technical cooperation project for capacity development for...
TRANSCRIPT

The Republic of IndonesiaMinistry of Finance
Technical Cooperation Project for
Capacity Development
for Green Economy Policy in Indonesia
Research on Green Urban Development
Final Report
March 2015
GE
JR
15-024
Japan International Cooperation Agency
Electric Power Development Co., Ltd
Technical Cooperation Project for Capacity Development for Green Economy Policy in Indonesia Research on Green Urban Development
Table of Contents
Outline of the Study Chapter 1
Background and Purpose of the Study ............................................................................. 1-1 1.1
Project Implementation up to December 2014 ................................................................ 1-1 1.2
Proposal of Fiscal and Financial Incentives to Promote EE&C Chapter 2
Current Situation, Issues and Barriers Related to the EE&C Development in 2.1Indonesia .......................................................................................................................... 2-1 2.1.1 Policy and Regulations ........................................................................................ 2-1 2.1.2 Government Incentives ....................................................................................... 2-12 2.1.3 Electricity Price ................................................................................................... 2-13 2.1.4 Voluntary Initiatives for Green Buildings ........................................................... 2-15 2.1.5 EE&C Project Financing ..................................................................................... 2-17
EE&C Promotion Policy in Other Countries (Incentive and Regulation) ....................... 2-18 2.22.2.1 EE&C Promotion for Office Buildings ............................................................... 2-18 2.2.2 EE&C Promotion for Households ....................................................................... 2-28 2.2.3 Summary ............................................................................................................. 2-29
Proposal of Fiscal and Financial Incentives to Promote EE&C ...................................... 2-31 2.32.3.1 Office Buildings .................................................................................................. 2-33 2.3.2 Households .......................................................................................................... 2-64 2.3.3 Notes on the Cost Benefit Analysis ..................................................................... 2-74 2.3.4 Summary and Issues to Be Considered ............................................................... 2-74
Final Report i
Technical Cooperation Project for Capacity Development for Green Economy Policy in Indonesia Research on Green Urban Development
List of Tables
Table 1.2-1 Study Schedule .................................................................................................... 1-3 Table 1.2-2 1st Mission Activity Record ................................................................................ 1-4 Table 1.2-3 2nd Mission Activity Record ............................................................................... 1-5 Table 1.2-4 3rd Mission Activity Record ................................................................................ 1-5 Table 2.1.1-1 Details of Energy Sector-Related Plan ................................................................ 2-1 Table 2.1.1-2 Final Draft for EE Labeling Criteria for Split Air Conditioners .......................... 2-2 Table 2.1.1-3 Final Draft for EE Labeling Criteria for Refrigerators ........................................ 2-3 Table 2.1.1-4 ESCO Development in Indonesia ........................................................................ 2-5 Table 2.1.1-5 Electricity Consumption by Appliance and Region in HH .................................. 2-8 Table 2.1.1-6 Refrigerator & AC by HH Contract Size ............................................................. 2-9 Table 2.1.1-7 EE Labeling Criteria for Air Conditioners (from 1 Star to 4 Stars) ..................... 2-9 Table 2.1.1-8 LG AC Line-up .................................................................................................... 2-10 Table 2.1.1-9 POLYTRON AC Line-up .................................................................................... 2-10 Table 2.1.1-10 CHANGHONG AC Line-up ............................................................................... 2-10 Table 2.1.2-1 Main Tax Incentives for Renewable Energy ........................................................ 2-12 Table 2.1.3-1 Electricity Tariff by Sector (2012, 2014/09) ........................................................ 2-14 Table 2.1.4-1 Green Building Contribution to Energy Savings and CO2 Reduction
2009-2014 ............................................................................................................ 2-16 Table 2.2.1-1 Incentive Mechanism to Promote EE&C in Japan .............................................. 2-18 Table 2.2.1-2 Incentive Mechanism for EE&C in Malaysia ...................................................... 2-21 Table 2.2.1-3 Incentive Mechanism for EE&C in Thailand ...................................................... 2-22 Table 2.2.1-4 Incentive Mechanism for EE&C in Vietnam ....................................................... 2-25 Table 2.2.1-5 VNEEP Subsidy ................................................................................................... 2-26 Table 2.2.1-6 Other Financing Programs with International Donors ......................................... 2-26 Table 2.2.1-7 Outline of EE Policy in CAC Country ................................................................ 2-27 Table 2.2.1-8 Outline of PV Incentives in CAC Countries ........................................................ 2-27 Table 2.2.2-1 Campaign Program for Label No. 5 AC and Refrigerators ................................. 2-29 Table 2.2.3-1 EE&C Policy in Other Countries ......................................................................... 2-30 Table 2.3-1 Proposed Incentive by Sector & Equipment ........................................................ 2-32 Table 2.3.1-1 Inverter Ration by Country .................................................................................. 2-33 Table 2.3.1-2 Comparison of Incentive Measures for Split Air Coinditioners (Listed
Companies) .......................................................................................................... 2-36 Table 2.3.1-3 Comparison of Incentive Measures for Split Air Coinditioners (Non-listed
Companies) .......................................................................................................... 2-40 Table 2.3.1-4 SNI6390:2011 for EE Performance of Air Conditioners ..................................... 2-43 Table 2.3.1-5 Comparison of Incentive Measures for Mid-large Sized Air Coinditioners
(Listed Companies).............................................................................................. 2-46
Final Report ii
Technical Cooperation Project for Capacity Development for Green Economy Policy in Indonesia Research on Green Urban Development
Table 2.3.1-6 Comparison of Incentive Measures for Mid-large Sized Air Coinditioners
(Non-listed Companies) ....................................................................................... 2-50 Table 2.3.1-7 Comparison of Incentive Measures for Heat Reflective Glass ............................ 2-55 Table 2.3.1-8 Comparison of Incentive Measures for PV Power Generation ............................ 2-58 Table 2.3.1-9 Comparison Incentive Mesures for Green Building ............................................ 2-62 Table 2.3.2-1 Comparison Incentive Mesures for Split Air Conditioners in HH ....................... 2-65 Table 2.3.2-2 Comparison Incentive Mesures for Refrigerators in HH ..................................... 2-70 Table 2.3.4-1 Assumption, Energy Saving and GHG Reduction for Each Technology ............ 2-75 Table 2.3.4-2 Summary of Cost Benefit Analysis...................................................................... 2-76 Table 2.3.4-3 Net Benefits from Incentive Program Implementation........................................ 2-77 Table 2.3.4-4 Comparison of Rebate Program in AC (Split) and Refrigerator .......................... 2-78
List of Figures
Figure 1.2-1 Work Flow ........................................................................................................... 1-2 Figure 2.1.1-1 Target of Green Building Regulation in Jakarta .................................................. 2-4 Figure 2.1.1-2 Electricity Consumption by Building Type and Purpose ..................................... 2-7 Figure 2.1.1-3 Two Major Factors to Promote EE&C for Buildings .......................................... 2-7 Figure 2.1.1-4 Electricity Consumption by Appliance and Contract Size in HH ........................ 2-8 Figure 2.1.3-1 Electricity Tariff and Subsidy by Sector .............................................................. 2-14 Figure 2.1.4-1 Component of Greenship Rating System ............................................................ 2-16 Figure 2.2.1-1 Low Interest Loan Program for EE Projects in Japan ......................................... 2-19 Figure 2.3.1-1 Comparson of Operation Pattern between Inverter and Non-inverter Air
Conditioners ........................................................................................................ 2-33 Figure 2.3.1-2 Field Test Result of Inverter and Non-inverter Air Conditionersin BPPT
Office throughout a Year...................................................................................... 2-34 Figure 2.3.1-3 Guarantee Program (Draft) .................................................................................. 2-44 Figure 2.3.1-4 Imprtance to Reduce Heat Gain through Windows ............................................. 2-53 Figure 2.3.1-5 Structure of Low-e Glass ..................................................................................... 2-53
Final Report iii

Technical Cooperation Project for Capacity Development for Green Economy Policy in Indonesia Research on Green Urban Development
ABBREVIATION
AC Air Conditioner ADB Asian Development Bank AfD Agence Francaise de Development APKENINDO Indonesia ESCO Association BAPPENAS The State Ministry of National Development Planning/National
Development Planning Agency BAU Business as Usual BEMS Building Energy Management System BOI Board of Investment of Thailand CD Capacity Development CDM Clean Development Mechanism COP Co-efficient of Performance COP COP-FCCC:Conference of the Parties-Framework Convention on
Climate Change C/P Counterparts CPA CDM Program Activity DEDE Department of Alternative Energy Development and Efficiency DSM Demand Side Management EC Energy Commission (Malaysia) ECCJ The Energy Conservation Center, Japan EE Energy Efficiency EE&C Energy Efficiency and Conservation EMI PT. Energy Management Indonesia ESCO Energy Service Company FI Financial Institution FPA Fiscal Policy Agency GBC(I) Green Building Council (Indonesia) GDP Gross Domestic Product GEF Global Environment Facility GHG Green House Gas GW Gigawatt IDR Indonesian Rupiah Jamkrindo Credit Guarantee Corporation of Indonesia JCM Joint Crediting Mechanism JERI Japan Economic Research Institute Inc. JICA Japan International Cooperation Agency JPOWER Electric Power Development Co., Ltd. JPY Japanese Yen KfW Development Bank of the Federal Republic and Federal States MEMR Ministry of Energy and Mineral Resources MEPS Minimum Energy Performance Standard METI Ministry of Economy, Trade and Industry
Final Report ab-i
Technical Cooperation Project for Capacity Development for Green Economy Policy in Indonesia
Research on Green Urban Development
Final Report
ab-ii
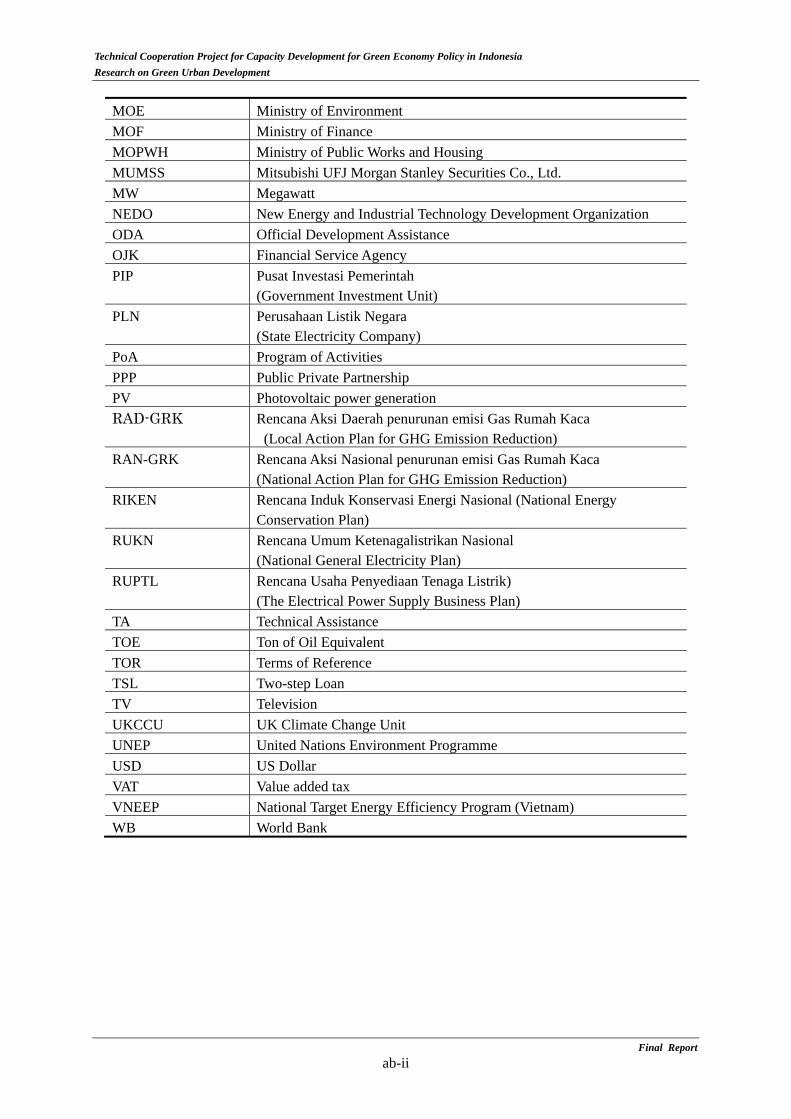
MOE Ministry of Environment MOF Ministry of Finance MOPWH Ministry of Public Works and Housing MUMSS Mitsubishi UFJ Morgan Stanley Securities Co., Ltd. MW Megawatt NEDO New Energy and Industrial Technology Development Organization ODA Official Development Assistance OJK Financial Service Agency PIP Pusat Investasi Pemerintah
(Government Investment Unit) PLN Perusahaan Listik Negara
(State Electricity Company) PoA Program of Activities PPP Public Private Partnership PV Photovoltaic power generation RAD-GRK Rencana Aksi Daerah penurunan emisi Gas Rumah Kaca
(Local Action Plan for GHG Emission Reduction) RAN-GRK Rencana Aksi Nasional penurunan emisi Gas Rumah Kaca
(National Action Plan for GHG Emission Reduction) RIKEN Rencana Induk Konservasi Energi Nasional (National Energy
Conservation Plan) RUKN Rencana Umum Ketenagalistrikan Nasional
(National General Electricity Plan) RUPTL Rencana Usaha Penyediaan Tenaga Listrik)
(The Electrical Power Supply Business Plan) TA Technical Assistance TOE Ton of Oil Equivalent TOR Terms of Reference TSL Two-step Loan TV Television UKCCU UK Climate Change Unit UNEP United Nations Environment Programme USD US Dollar VAT Value added tax VNEEP National Target Energy Efficiency Program (Vietnam) WB World Bank

Chapter 1
Outline of the Study
Technical Cooperation Project for Capacity Development for Green Economy Policy in Indonesia Research on Green Urban Development
Outline of the Study Chapter 1
Background and Purpose of the Study 1.1
Indonesia Government considers the measures against climate change as the important policy and established Center for Climate Change Financing and Multilateral Policy within Fiscal Policy Agency (FPA) as the research institute in June 2011. Furthermore, the government enacted Government Regulation 70/2009 about Energy Efficiency to regulate large-scale energy consumers under Law 30/2007 on energy. Following this Government Regulation, Ministry of Energy and Mineral Resources (MEMR) enacted MEMR Regulation 13/2012 about electricity saving and plans to introduce fiscal and financial incentives for it. However, in spite of these measures, energy consumption is increasing in Indonesia and FPA needs to establish effective fiscal and financial incentives in order to establish effective fiscal and financial incentives in order to promote energy efficiency policy in energy intensive cities.
To support Indonesian government’s actions against climate change, Japanese government implemented “Climate Change Program Loan”, assistance for policy matrix implementation and its monitoring and “Project of Capacity Development for Climate Change Strategies”. As a part of this capacity development project, “Project of Capacity Development for Green Economy Policy in Indonesia” is implemented from June 2014 to October 2015 to mainstream the climate change policy in the fiscal policy, and is aimed at developing capacity for fiscal policy making for this climate change policy’s smooth implementation.
This study (“the Study” below) aims to assist “strengthening FPA’s planning capacity for the fiscal and financial policy to promote green city (environment friendly cities)” as the component of “Project for Capacity Development for Green Economy Policy in Indonesia” mentioned above. Specifically, the issues and challenges for energy efficiency policy implementation including dissemination of low carbon technology in Indonesia will be identified and analyzed. Following this analysis, the ideal fiscal and financial incentive policy will be examined and recommended to promote the energy efficiency policy at a city level referring to the target city’s example.
Project Implementation up to December 2014 1.2
Work flow of the Study is shown in Figure 1.2-1. Study Schedule is shown in Table 1.2-1.
Final Report 1-1

Technical Cooperation Project for Capacity Development for Green Economy Policy in Indonesia Research on Green Urban Development
Figure 1.2-1 Work Flow
Final Report 1-2

Technical Cooperation Project for Capacity Development for Green Economy Policy in Indonesia Research on Green Urban Development
Table 1.2-1 Study Schedule
(1) 1st mission
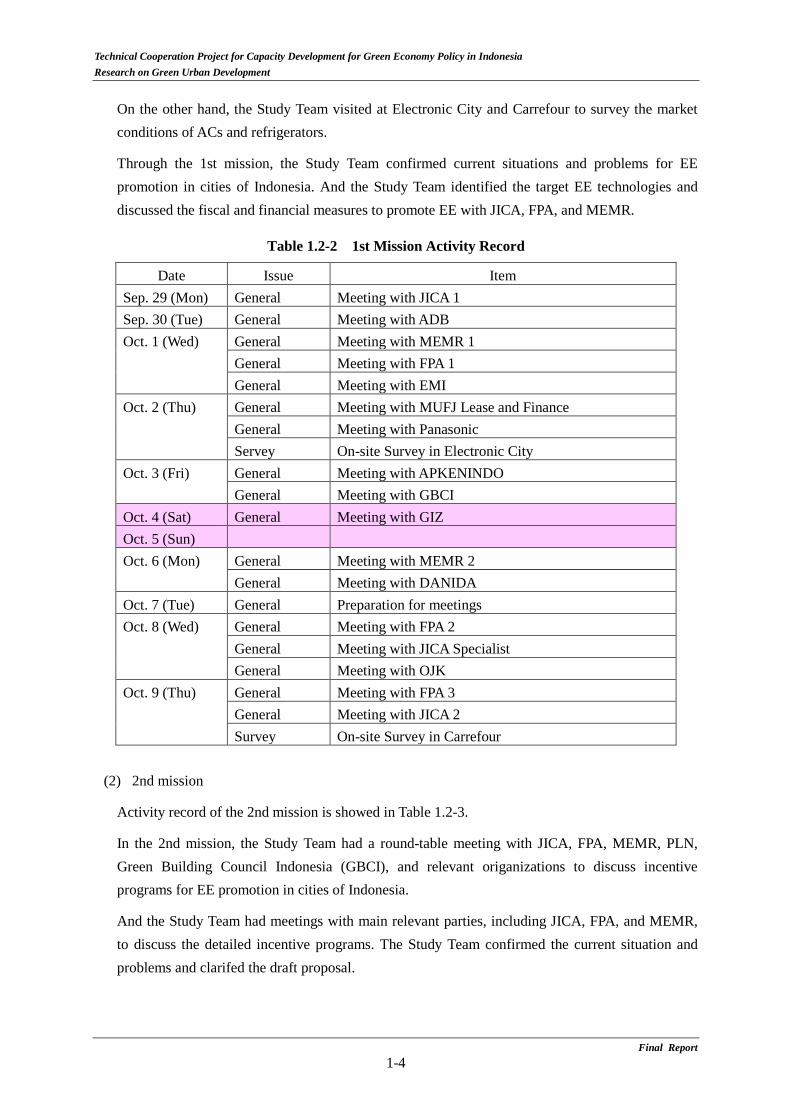
Activity record of the 1st mission is showed in Table 1.2-2.
In the 1st mission, the Study Team had meetings with JICA, FPA, MEMR, relevant organizations, and donors to discuss study direction, outline, and outputs of this study.
And in parallel the Study Team carried out technical transfer through supplying data and information and explaining technical issues, which were requested and needed by FPA and MEMR.
Final Report 1-3
Technical Cooperation Project for Capacity Development for Green Economy Policy in Indonesia Research on Green Urban Development
On the other hand, the Study Team visited at Electronic City and Carrefour to survey the market conditions of ACs and refrigerators.
Through the 1st mission, the Study Team confirmed current situations and problems for EE promotion in cities of Indonesia. And the Study Team identified the target EE technologies and discussed the fiscal and financial measures to promote EE with JICA, FPA, and MEMR.
Table 1.2-2 1st Mission Activity Record
Date Issue Item Sep. 29 (Mon) General Meeting with JICA 1 Sep. 30 (Tue) General Meeting with ADB Oct. 1 (Wed) General Meeting with MEMR 1
General Meeting with FPA 1 General Meeting with EMI
Oct. 2 (Thu) General Meeting with MUFJ Lease and Finance General Meeting with Panasonic Servey On-site Survey in Electronic City
Oct. 3 (Fri) General Meeting with APKENINDO General Meeting with GBCI
Oct. 4 (Sat) General Meeting with GIZ Oct. 5 (Sun) Oct. 6 (Mon) General Meeting with MEMR 2
General Meeting with DANIDA Oct. 7 (Tue) General Preparation for meetings Oct. 8 (Wed) General Meeting with FPA 2
General Meeting with JICA Specialist General Meeting with OJK
Oct. 9 (Thu) General Meeting with FPA 3 General Meeting with JICA 2 Survey On-site Survey in Carrefour
(2) 2nd mission
Activity record of the 2nd mission is showed in Table 1.2-3.
In the 2nd mission, the Study Team had a round-table meeting with JICA, FPA, MEMR, PLN, Green Building Council Indonesia (GBCI), and relevant origanizations to discuss incentive programs for EE promotion in cities of Indonesia.
And the Study Team had meetings with main relevant parties, including JICA, FPA, and MEMR, to discuss the detailed incentive programs. The Study Team confirmed the current situation and problems and clarifed the draft proposal.
Final Report 1-4

Technical Cooperation Project for Capacity Development for Green Economy Policy in Indonesia Research on Green Urban Development
In addition, the Study Team had meetings with MEMR to explain target EE technologies and draft insentive programs and carried out capacity building for MEMR.
On the other hand, the Study Team had meetings with Jakarta Province and Ministry of Public Works and Housing (MOPWH) to confirm the Green Building Regulation of Jakarta Province and the Green Building Guideline of MOPWH. And the Study Team had meetings with Daikin and Sharp in Indonesia to collect market information and data for EE productions including ACs and refreigirators.
Table 1.2-3 2nd Mission Activity Record
Date Issue Item Dec. 15 (Mon) General Meeting with FPA
General Meeting with JICA 1 Dec. 16 (Tue) General Round-table Meeting 1
General Round-table Meeting 2 Dec. 17 (Wed) General Meeting with Jakarta Province
General Meeting with MEMR 1 General Meeting with MEMR 2
Dec. 18 (Thu) General Meeting with Daikin General Meeting with JICA 2
Dec. 19 (Fri) General Meeting with Sharp General Meeting with MOPWH
(3) 3rd mission
Activity record of the 3rd mission is showed in Table 1.2-4.
In the 3rd mission, the Study Team had meetings with FPA, MEMR and MOPWH to confirm contents of the draft final report and collect comments and updated information from them.
The Study Team had a Focus Group Discussion with JICA, FPA, MEMR, MOPWH and PLN to finally discuss technologies and incentive programs for EE promotion in cities of Indonesia.
Table 1.2-4 3rd Mission Activity Record
Date Issue Item Feb. 9 (Mon) General Meeting with FPA and JICA
General Meeting with MEMR Feb. 10 (Tue) General Meeting with Daikin
General Meeting with MOPWH Feb. 11 (Wed) Preparation Preparation of documents for FPA Feb. 12 (Thu) General Meeting with FPA and JICA Feb. 13 (Fri) General Focus Group Discussion
Final Report 1-5
Chapter 2
Proposal of Fiscal and Financial Incentives
to Promote EE&C
Technical Cooperation Project for Capacity Development for Green Economy Policy in Indonesia Research on Green Urban Development
Proposal of Fiscal and Financial Incentives to Promote Chapter 2
EE&C
Current Situation, Issues and Barriers Related to the EE&C Development in 2.1Indonesia
2.1.1 Policy and Regulations
(1) Current situation
1) Public sector
a) RAN-GRK and RAD-GRK
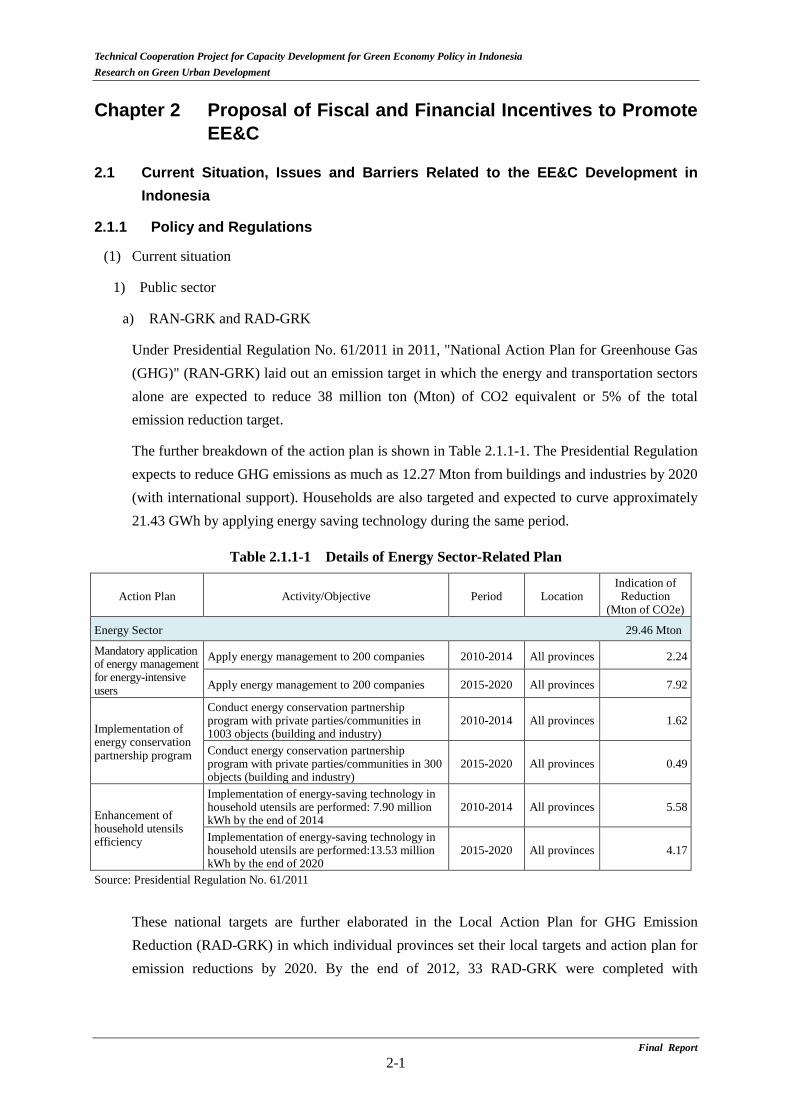
Under Presidential Regulation No. 61/2011 in 2011, "National Action Plan for Greenhouse Gas (GHG)" (RAN-GRK) laid out an emission target in which the energy and transportation sectors alone are expected to reduce 38 million ton (Mton) of CO2 equivalent or 5% of the total emission reduction target.
The further breakdown of the action plan is shown in Table 2.1.1-1. The Presidential Regulation expects to reduce GHG emissions as much as 12.27 Mton from buildings and industries by 2020 (with international support). Households are also targeted and expected to curve approximately 21.43 GWh by applying energy saving technology during the same period.
Table 2.1.1-1 Details of Energy Sector-Related Plan
Action Plan Activity/Objective Period Location Indication of
Reduction (Mton of CO2e)
Energy Sector 29.46 Mton
Mandatory application of energy management for energy-intensive users
Apply energy management to 200 companies 2010-2014 All provinces 2.24
Apply energy management to 200 companies 2015-2020 All provinces 7.92
Implementation of energy conservation partnership program
Conduct energy conservation partnership program with private parties/communities in 1003 objects (building and industry)
2010-2014 All provinces 1.62
Conduct energy conservation partnership program with private parties/communities in 300 objects (building and industry)
2015-2020 All provinces 0.49
Enhancement of household utensils efficiency
Implementation of energy-saving technology in household utensils are performed: 7.90 million kWh by the end of 2014
2010-2014 All provinces 5.58
Implementation of energy-saving technology in household utensils are performed:13.53 million kWh by the end of 2020
2015-2020 All provinces 4.17
Source: Presidential Regulation No. 61/2011
These national targets are further elaborated in the Local Action Plan for GHG Emission Reduction (RAD-GRK) in which individual provinces set their local targets and action plan for emission reductions by 2020. By the end of 2012, 33 RAD-GRK were completed with
Final Report 2-1
Technical Cooperation Project for Capacity Development for Green Economy Policy in Indonesia Research on Green Urban Development
assistance from donors1.
When structuring fiscal and financial incentives for the green urban development for regional governments, it is critical to first review RAD-GRKs. What is considered in RAD-GRK should be treated as a priority in implementation. If there found to be any issues hindering the implementation of RAD-GRK, incentives should be considered to overcome those barriers.
b) PRESIDENTIAL INSTRUCTION No. 13/2011 concerning on Energy and Water Saving and
MINISTRY OF EMR REGULATION No. 13 /2012 concerning on Electricity Usage Savings
By institutional activities and periodical reporting system, about 20% of the electricity was saved in governmental buildings, state owned buildings and street lightings in 2012. As a model project, MEMR renovated its own building with the support of DANIDA. Besides, MOPWH got the platinum rating, the highest rating for Indonesian Grenn Building Certificate (Geenship). This building is also positioned as a typical model of EE building, whose energy consumption is 38% less than the average buildings in Indonesia.
c) Energy efficiency labeling program & MEPS (Minimum Energy Performance Standard)
MEMR has a plan to enact EE Labeling Program & MEPS for split air conditioners and refrigerators in 2015. In EE Labeling Program, all appliances will be categolized from 1star to 4stars ratings. In cooperation with manufacturers and retail shops, suitable information of EE performance on appliances will be shared with consumers and it is expected to promote EE&C effectively. MEPS intends to prohibit to sell the appliances with less than 1star, and to bottom up the minimum EE performance.
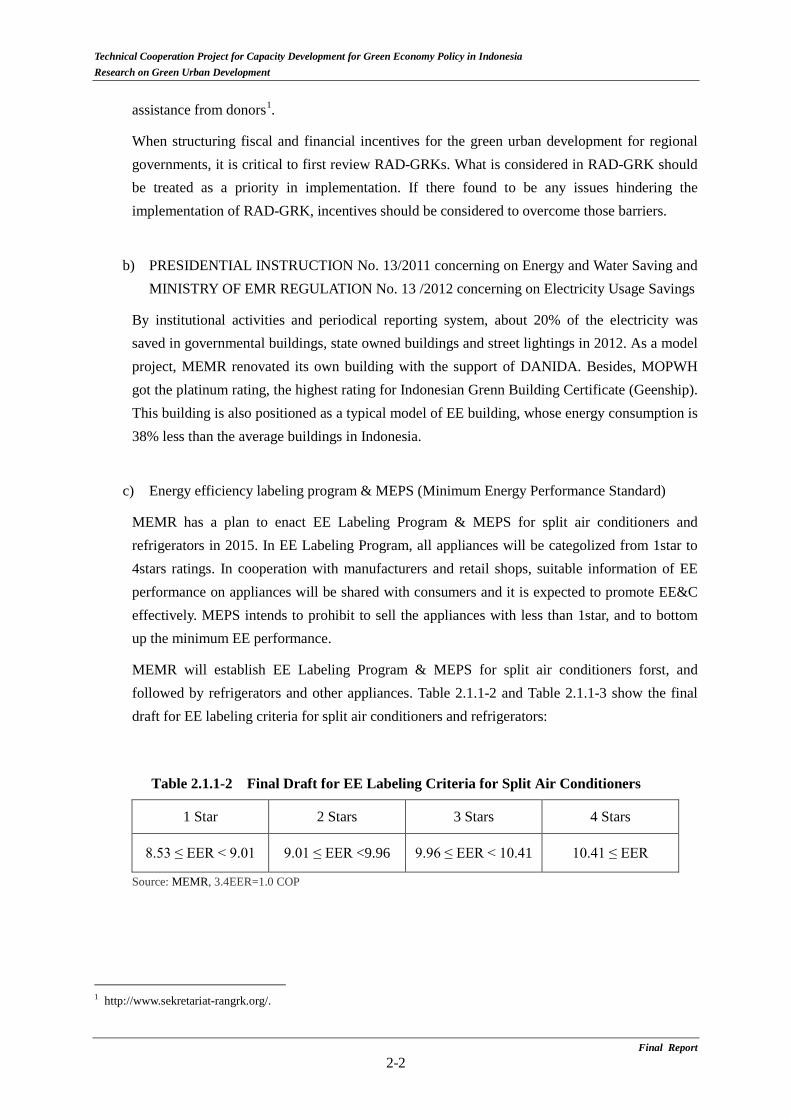
MEMR will establish EE Labeling Program & MEPS for split air conditioners forst, and followed by refrigerators and other appliances. Table 2.1.1-2 and Table 2.1.1-3 show the final draft for EE labeling criteria for split air conditioners and refrigerators:
Table 2.1.1-2 Final Draft for EE Labeling Criteria for Split Air Conditioners
1 Star 2 Stars 3 Stars 4 Stars
8.53 ≤ EER < 9.01 9.01 ≤ EER <9.96 9.96 ≤ EER < 10.41 10.41 ≤ EER
Source: MEMR, 3.4EER=1.0 COP
1 http://www.sekretariat-rangrk.org/.
Final Report 2-2

Technical Cooperation Project for Capacity Development for Green Economy Policy in Indonesia Research on Green Urban Development
Table 2.1.1-3 Final Draft for EE Labeling Criteria for Refrigerators
Without freezer Star rate Formula 1 Star < 465 + 1.378 x Vadj x 1.15 2 Stars < 1 Star x 0.77 3 Stars < 2 Stars x 0.77 4 Stars < 3 Stars x 0.77
With freezer Star rate Formula 1 Star < 465 + 1.378 x Vadj x 1.55 2 Stars < 1 Star x 0.77 3 Stars < 2 Stars x 0.77 4 Stars < 3 Stars x 0.77
Source:MEMR
EE performance esting will be conducted referring to SNI-ISO 04-15502-2008 and IEC 62552-2007. Here:
Adjusted Volume (Vadj),
Ω⋅Σ= iadj VV
- Vi = storage volume in each compartment
- Ω = Load factor:
ra
ia
TTTT
−−
=Ω
- Ta = T class ambience temperature ( 32 °C based on SNI/ ISO 15502).
- Ti = Rated temperature in each tested compartment
- Tr = Rated temperature in fresh food compartment (5°C).
d) Energy Service Company (ESCO)
Energy Service Company (known as ESCO) is a company, which provides a service resulted in EE&C. ESCO business model has been applied to the public sector in various countries to assist equipment replacement and facility renovation. Regional governments and municipalities with tight budgets welcome the shared-savings model, where ESCO companies pay upfront costs for the equipment. However, in many countries, governments needed to first change or adopt new laws/regulations to allow ESCO-type contracts to be applicable to public procurement scheme2.
2 For instance, in Japan, the Environmental Consideration Contracting Law was adopted and put into force in 2008, which allows both the central and local governments to extend their debt period up to 10 years if procured using ESCO.
Final Report 2-3

Technical Cooperation Project for Capacity Development for Green Economy Policy in Indonesia Research on Green Urban Development
The Indonesian central government, though interested, finds it difficult to apply the ESCO model to its public sector due to the single-year budgeting system. And MEMR is studying and discussing about the possibility to allow multiple year’s contract for introduction of ESCO scheme in public buildings. (In the Presidential decree No. 70/2009, procurement of public organizations.) Moreover MEMR has a plan to formulate a regulation to promote ESCO scheme for private sector.
However, there have been some initiatives introduced by a local ESCO in Indonesia, using local governments’ procurement of an operation and maintenance (O&M) company for street lighting. It is a unique attempt because the payment to PLN is inclusive in the O&M contract, which gives a small incentive for the ESCO to install energy-saving equipment. Though its application is limited to regional governments and the incentive may not be strong enough to entice other ESCOs, a similar approach may be duplicated by other regional governments under the Ministry of Home Affairs' Ministerial Regulation No. 22/2009 on Technical Procedure for Cooperation with Regional Government.
e) Regional government's introduction of green building codes
In 2007, Jakarta join in the C40 Cities Climate Leadership Group is a group of associations of cities committed to tackling climate change. At COP15 in Denmark in 2009, Jakarta is committed to lowering GHG emissions by 30% in 2030.
In accordance with this commitment, in 2012, the Regional Action Plan for Greenhouse Gas Emissions Decrease in Jakarta was set out by the Governor Rule. In as the same year the Green Building Regulation was enacted by Governor Regulation No38.
The target of this regulation is comparatively large new and existing buildings. The criteria of target buildings are shown in Figure 2.1.1-1.
Source: Jakarta City authority
Figure 2.1.1-1 Target of Green Building Regulation in Jakarta
Final Report 2-4

Technical Cooperation Project for Capacity Development for Green Economy Policy in Indonesia Research on Green Urban Development
This regulation stipulates not only the performance of energy conservation but also that of water conservation and indoor quality. The criteria of the regulation have a linkage to that of Green Building Council Indonesia. By 2020, it is expected that approximately 300 large buildings will comply with this regulation. In the 2nd on-site survey in Jakarta, hearing from Jakarta City Authority was conducted. Surabaya, Semarang and Bandung are investigating the feasibility and impact to introduce Green Building Regulation, referring to Jakarta’s experience.
2) Private sector
a) Energy management program
Ministerial regulation concerning energy management, MEMR Regulation NO.14/2012 was enacted in 2012. This regulation mainly focuses large energy consumers, whose energy consumption exceeds 6,000TOE/year. (Its dominant target consumers are manufacturers). The target consumers submit their periodical report every year. Buildings are not the main target of this regulation.
b) EE labelling program
Energy efficiency (EE) labeling program for CFL (Compact fluorescent lamp) has been enacted. In 2015, it is expected that EE labeling programs for split air conditioners and refrigerators will be enacted, based on the frameworks, drafted in 2012. These programs can contribute to the energy reduction for air conditioners, whose capacity is equal or over 1 HP, and refrigerators.
c) Energy Service Company (ESCO)
In Indonesia, there are some companies offering ESCO services. They established an association called APKENINDO in 2011, to promote ESCO activities in the country. Based on a series of interviews with APKENINDO and MEMR, Table 2.1.1-4 shows the current snapshots of the ESCO activities in the private sector in Indonesia.
Table 2.1.1-4 ESCO Development in Indonesia
Presence of ESCO companies
ESCO services are, though limited, available in Indonesia. However, many of them are conducted between foreign companies located in Indonesia and ESCO companies of their mother countries (e.g. Australia and New Zealand), and there is no "success story" to disseminate the local experience on ESCO.
DANIDA and MEMR's program for pilot ESCO project
In order to promote EE&C with the ESCO scheme, DANIDA, in collaboration with MEMR, is currently assisting to develop a pilot ESCO project (from identification of ESCO project to actual implementation). They are under the phase of identifying ESCO candidate project sites.
Final Report 2-5

Technical Cooperation Project for Capacity Development for Green Economy Policy in Indonesia Research on Green Urban Development
ESCO regulation under development
In parallel to the development of the pilot project, MEMR is currently developing a regulation for ESCO (no details have been disclosed to consider in this study).
Unlike the public sector, the private sector is not stranded by the single-year budgeting system. However, the ESCO scheme has not been extensively applied even with the private sector.
d) Introduction of incentives
Introduction of EE&C incentives for the private sector is stipulated as “possible options” in Government Regulation 70/2009 about Energy Efficiency, but there are no specific incentives agreed yet.
(2) Issues and barriers related to the EE&C development
1) Regulation on energy and water savings
By institutional activities and periodical reporting system, about 20% of the electricity was saved in governmental buildings, state owned buildings and street lightings in 2012. For further improvement, the present conditions and issues will be confirmed in the 2nd on-site survey.
2) Regional government's introduction of green building codes
Green building regulation has been introduced and operated in Jakarta. It can contribute to energy conservation in large buildings. However, dominant mid-size and small-sized buildings are not the target of this regulation. The measures to promote these should be established. At present Green Building Regulation is applied only in Jakarta. The impact is quite limited at present.
3) Central government’s intoruction of green building codes
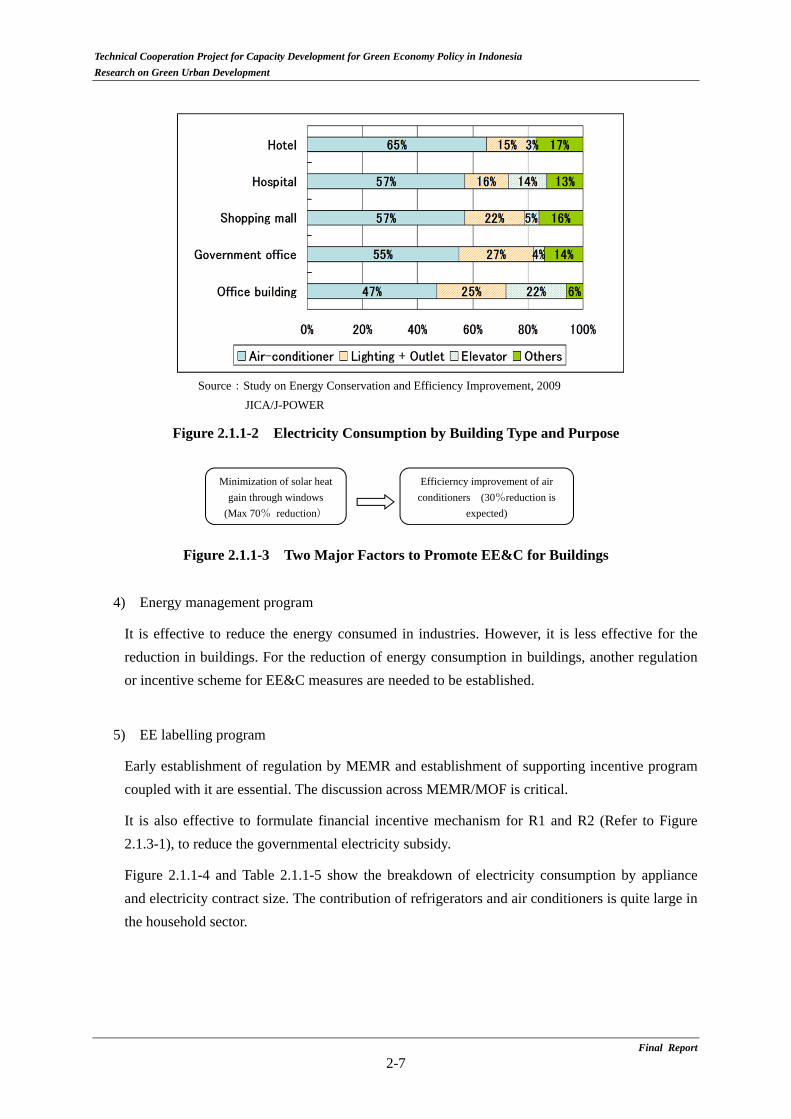
Early establishment of regulation by MOPWH and establishment of supporting incentive program coupled with it are essential. The discussion across MOPWH/MOF/MEMR is critical. As shown in Figure 2.1.1-2 and Figure 2.1.1-3, in order to promote EE&C for buildings, it is especially effective to improve the efficiency of air conditioners and to reduce thermal cooling load through windows.
Final Report 2-6
Technical Cooperation Project for Capacity Development for Green Economy Policy in Indonesia
Research on Green Urban Development
Final Report
2-7
Source:Study on Energy Conservation and Efficiency Improvement, 2009
JICA/J-POWER
Figure 2.1.1-2 Electricity Consumption by Building Type and Purpose
Figure 2.1.1-3 Two Major Factors to Promote EE&C for Buildings
4) Energy management program
It is effective to reduce the energy consumed in industries. However, it is less effective for the reduction in buildings. For the reduction of energy consumption in buildings, another regulation or incentive scheme for EE&C measures are needed to be established.
5) EE labelling program
Early establishment of regulation by MEMR and establishment of supporting incentive program coupled with it are essential. The discussion across MEMR/MOF is critical.
It is also effective to formulate financial incentive mechanism for R1 and R2 (Refer to Figure 2.1.3-1), to reduce the governmental electricity subsidy.
Figure 2.1.1-4 and Table 2.1.1-5 show the breakdown of electricity consumption by appliance and electricity contract size. The contribution of refrigerators and air conditioners is quite large in the household sector.
Efficierncy improvement of air conditioners (30%reduction is
expected)
Minimization of solar heat gain through windows
(Max 70% reduction)

Technical Cooperation Project for Capacity Development for Green Economy Policy in Indonesia Research on Green Urban Development
Source: Study for Promoting Practical Demand Side Management Program in Indonesia (2012),
JICA/J-POWER
Figure 2.1.1-4 Electricity Consumption by Appliance and Contract Size in HH
Table 2.1.1-5 Electricity Consumption by Appliance and Region in HH
Source: Study for Promoting Practical Demand Side Management Program in Indonesia (2012), JICA/J-POWER
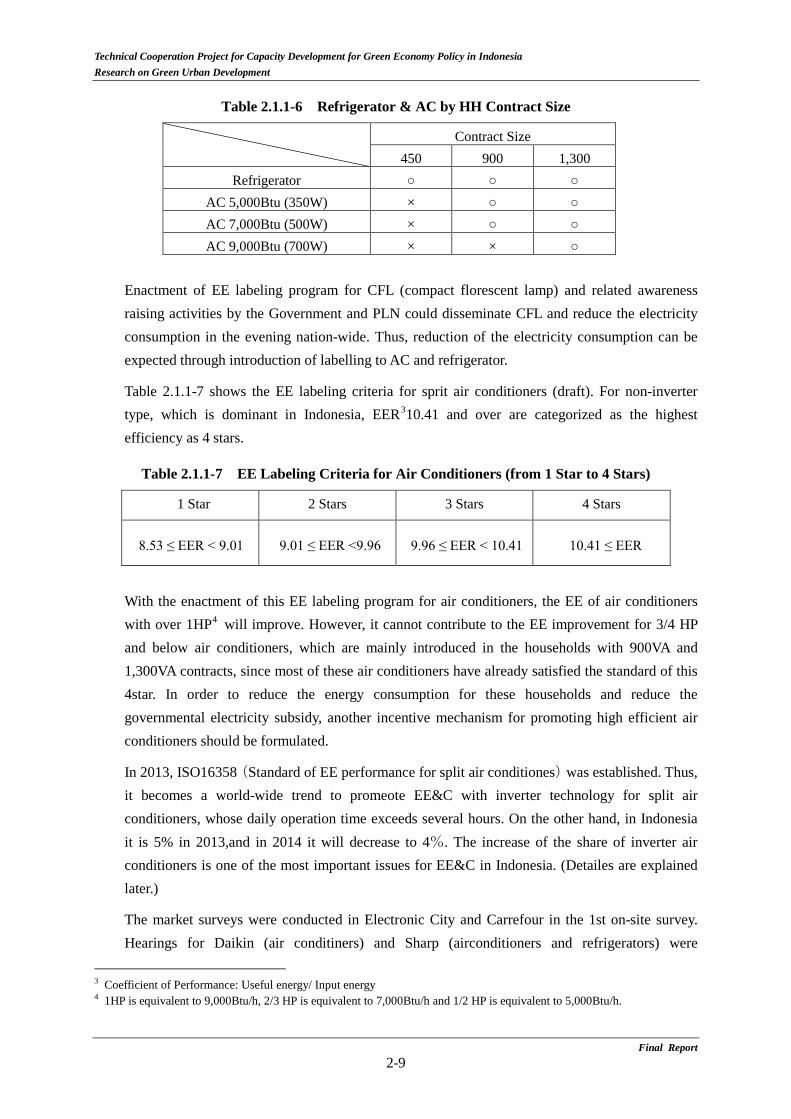
In Indonesia, due to the constraint of electricity contract size, 450VA consumers cannot install air conditioners and 900VA consumers can only install below 9,000Btu air conditioners. (See Table 2.1.1-6)
City (Number of Study
Targets)
Electricity Consumption Rates of Home Appliances for Total in Household (%)
Lighting Refrigerator TV AC Wash Machine
Rice Cooker
Dispenser
Jakarta (48) 13.1% 17.9% 12.3% 19.0% 2.4% 9.3% 0.6%
Palembang (50) 18.2% 22.4% 11.5% 10.5% 3.1% 11.7% 1.9%
Balik papan (52) 14.8% 21.4% 15.4% 22.4% 3.1% 5.6% 2.4%
Manado (50) 14.7% 16.4% 15.1% 19.7% 1.9% 8.0% 6.3%
Denpasar (46) 20.0% 18.3% 9.4% 16.0% 3.5% 11.5% 2.5%
All 16.1% 19.5% 13.2% 17.2% 2.8% 9.5% 2.6%
Elec. Kitchen
Water Pump
Computer Water Heater
Elec. Iron
Fan Others
Jakarta (48) 0.0% 0.2% 0.6% 0.2% 5.7% 5.1% 0.9%
Palembang (50) 0.0% 0.1% 2.7% 0.1% 6.3% 6.7% 1.3%
Balik papan (52) 0.1% 0.0% 3.2% 0.0% 5.3% 3.9% 1.0%
Manado (50) 0.2% 0.1% 3.1% 0.1% 5.5% 1.9% 1.1%
Denpasar (46) 0.0% 1.3% 2.3% 1.3% 6.9% 1.9% 1.1%
All 0.1% 5.6% 2.4% 0.2% 5.9% 3.9% 1.1%
Final Report 2-8
Technical Cooperation Project for Capacity Development for Green Economy Policy in Indonesia Research on Green Urban Development
Table 2.1.1-6 Refrigerator & AC by HH Contract Size
Contract Size
450 900 1,300 Refrigerator
AC 5,000Btu (350W) × AC 7,000Btu (500W) × AC 9,000Btu (700W) × ×
Enactment of EE labeling program for CFL (compact florescent lamp) and related awareness raising activities by the Government and PLN could disseminate CFL and reduce the electricity consumption in the evening nation-wide. Thus, reduction of the electricity consumption can be expected through introduction of labelling to AC and refrigerator.
Table 2.1.1-7 shows the EE labeling criteria for sprit air conditioners (draft). For non-inverter type, which is dominant in Indonesia, EER310.41 and over are categorized as the highest efficiency as 4 stars.
Table 2.1.1-7 EE Labeling Criteria for Air Conditioners (from 1 Star to 4 Stars)
1 Star 2 Stars 3 Stars 4 Stars
8.53 ≤ EER < 9.01 9.01 ≤ EER <9.96 9.96 ≤ EER < 10.41 10.41 ≤ EER
With the enactment of this EE labeling program for air conditioners, the EE of air conditioners with over 1HP4 will improve. However, it cannot contribute to the EE improvement for 3/4 HP and below air conditioners, which are mainly introduced in the households with 900VA and 1,300VA contracts, since most of these air conditioners have already satisfied the standard of this 4star. In order to reduce the energy consumption for these households and reduce the governmental electricity subsidy, another incentive mechanism for promoting high efficient air conditioners should be formulated.
In 2013, ISO16358(Standard of EE performance for split air conditiones)was established. Thus, it becomes a world-wide trend to promeote EE&C with inverter technology for split air conditioners, whose daily operation time exceeds several hours. On the other hand, in Indonesia it is 5% in 2013,and in 2014 it will decrease to 4%. The increase of the share of inverter air conditioners is one of the most important issues for EE&C in Indonesia. (Detailes are explained later.)
The market surveys were conducted in Electronic City and Carrefour in the 1st on-site survey. Hearings for Daikin (air conditiners) and Sharp (airconditioners and refrigerators) were
3 Coefficient of Performance: Useful energy/ Input energy 4 1HP is equivalent to 9,000Btu/h, 2/3 HP is equivalent to 7,000Btu/h and 1/2 HP is equivalent to 5,000Btu/h.
Final Report 2-9

Technical Cooperation Project for Capacity Development for Green Economy Policy in Indonesia Research on Green Urban Development
conducted in the 2nd mission. The followings are the major findings.
EE performance of air conditioners and refrigerators were confirmed by display and catalogue data. (Refer to Table 2.1.1-8 to 10)
(Air conditioner)
Around 2,500,000 split air conditioners are sold in Indonesia annually. In 2014 the sales numbers will decrease about 10% because of the economy recession.
EER of air conditioners with 5,000Btu and 7,000Btu ranges from 9.0 to 17.3. Almost all the air conditioners’ EER exceeds 10.415, which is a threshold of 4stars in the market and the ones below 10.41 are highly limited. (For 5,000, 7,000Btu)
EER of 9,000Btu air conditioners ranges from 8.9 to 13.1. Standard type’s EER is less than 10.41. (Generally EER of larger sized air conditioners is lower than that of smaller sized ones.)
Table 2.1.1-8 LG AC Line-up
5000Btu (350W) 7000Btu (500W) 9000Btu (700W)
EER (Btu/Wh)
Cost (Rp)
EER (Btu/Wh)
Cost (Rp)
EER (Btu/Wh)
Cost (Rp)
HERCULES 17.3 4,419,000 14.3 - 13.0 4,599,000 Skincare 15.0 - 12.8 - 13.1 - Standard 10.9/11.0 3,719,000 10.4 3.829,000 9.3/8.9 3,919,000
EER: Energy Efficiency Ratio
Table 2.1.1-9 POLYTRON AC Line-up
5,000Btu 9,000Btu
EER (Btu/Wh)
Cost (Rp)
EER (Btu/Wh)
Cost (Rp)
LC - - 13.0 3,199,000 LA 15.6 2,779,000 13.0 3,089,000
Table 2.1.1-10 CHANGHONG AC Line-up
5,000Btu 7,000Btu 9,000Btu
EER (Btu/Wh)
Cost (Rp)
EER (Btu/Wh)
Cost (Rp)
EER (Btu/Wh)
Cost (Rp)
CSC-TI 14.9 3,199,000 - - 13.8 3,149,000 CSC-K 14.9 3,029,000 - - 13.8 3,259,000 CSC-K/C 12.5 2,899,000 13.7 2,999,000 10.2 3,090,000 CSC-JZ 9.0 2,799,000 - - - -
(Refrigerator)
Share of high efficient inverter refrigerators was increased rapidly from 2.6% in 2013 to 8.2% in 2014.
Final Report 2-10
Technical Cooperation Project for Capacity Development for Green Economy Policy in Indonesia Research on Green Urban Development
Efficient refrigerators consume 10-36% less electricity than conventional ones.
The dominant refrigerators sold in Indonesian market ranges from 2 to 4stars rating in the EE labeling program, which will be enacted in 2015 by MEMR. Thus incentive mechanism for 4 stars rating refrigerators can contribute to promote EE performance.
In addition, the enactment of EE labeling program for refrigerators will lead to the energy consumption reduction, ultimately the governmental electricity subsidy’s reduction. To accelerate the reduction speed, it is effective to formulate a financial incentive mechanism for introducing high efficient refrigerators in the households with 450VA and 900VA.
As abobe mentioned, it is effective to promote EE&C by formulating finance incentive mechanism for home electric appliances.
6) ESCO
ESCO is an effective tool to promote EE&C. However, in reality, local ESCOs are facing some difficulties with following points:
a) Lack of financial sources to provide the ESCO services (especially the shared-savings contract)
b) Lack of experience-based know-how on ESCO operation c) No attractive incentives for ESCOs
Above mentioned, a) and c) are the main obstacles to the ESCO development in the country. Members of APKENINDO (the Indonesian ESCO Association) are equipment suppliers, engineering companies or service companies. Without a means to acquire low-cost finance, it is difficult for them to initiate or expand their ESCO business.
ESCO can also be a useful tool for the regional and municipal governments to achieve their individual RAD-GRK goals without budgetting a significant amount upfront. However, it needs to amend the government’s regulations in order to allow the public sector to use ESCO.
7) Introduction of incentives
In order to implement incentives to promote EE&C, the specific incentive and its implementation plan need to be agreed within the relevant Ministries/institutions (MOF and MEMR etc.).
Final Report 2-11
Technical Cooperation Project for Capacity Development for Green Economy Policy in Indonesia Research on Green Urban Development
2.1.2 Government Incentives
(1) Current situation
1) Free energy audits
MEMR provides free energy audit to office buildings and industries since 2003, and the number of audits has reached over 1,000 to date. However, it appears that only a limited number of projects have managed to go a step further and implement the energy saving measures recommended by the audit reports. For example, around 40 energy audits have been conducted in2014. However the number of retrofitting for EE&C after the audits is quite few.
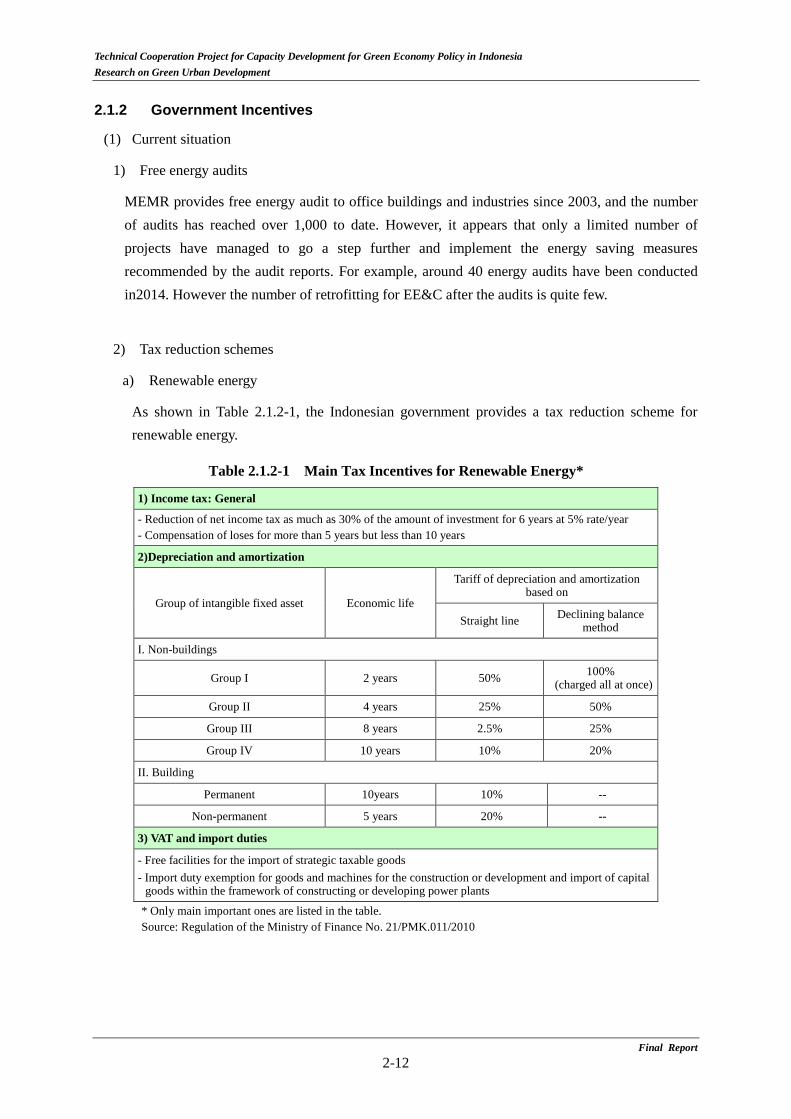
2) Tax reduction schemes
a) Renewable energy
As shown in Table 2.1.2-1, the Indonesian government provides a tax reduction scheme for renewable energy.
Table 2.1.2-1 Main Tax Incentives for Renewable Energy*
1) Income tax: General
- Reduction of net income tax as much as 30% of the amount of investment for 6 years at 5% rate/year - Compensation of loses for more than 5 years but less than 10 years
2)Depreciation and amortization
Group of intangible fixed asset Economic life
Tariff of depreciation and amortization based on
Straight line Declining balance method
I. Non-buildings
Group I 2 years 50% 100% (charged all at once)
Group II 4 years 25% 50%
Group III 8 years 2.5% 25%
Group IV 10 years 10% 20%
II. Building
Permanent 10years 10% --
Non-permanent 5 years 20% --
3) VAT and import duties
- Free facilities for the import of strategic taxable goods - Import duty exemption for goods and machines for the construction or development and import of capital
goods within the framework of constructing or developing power plants
* Only main important ones are listed in the table. Source: Regulation of the Ministry of Finance No. 21/PMK.011/2010
Final Report 2-12
Technical Cooperation Project for Capacity Development for Green Economy Policy in Indonesia Research on Green Urban Development
b) EE&C for buildings and households
The Indonesian government offers a series of tax incentives to invite foreign investments and assist export industries. Companies introducing a new technology to Indonesia can receive tax holiday, if it is one of the strategic sectors of the country (e.g. oil and gas sector and machinery sector). There are some special treatments for import duty and tax as well. Since air conditioners and household appliances are subject to luxury-goods sale tax (LST), no tax incentive is provided5. The tax incentive to energy efficient products is not implemented in Indonesia, so far.
(2) Issues and barriers related to the EE&C development
1) Lack of awareness of the incentive schemes
Except for the free energy audits, information on incentive schemes for EE&C is not readily available and thoroughly explained to building managers and consumers. It is difficult for the private sector to understand the real benefits of switching to EE&C equipment or introducing an EE&C system to their new buildings.
2) Lack of information dissemination of the results of using the incentive schemes
MEMR has been providing awareness raising on EE&C and some incentives. However, this information remains at the introductory level and does not include the useful examples of using the incentive schemes. One of the reasons for this may be the shortfall in 'success stories' of using governmental incentive schemes (including tax benefits). It is important to have an advance level of awareness raising activities to move to actual implementation of EE&C projects.
2.1.3 Electricity Price
(1) Current situation
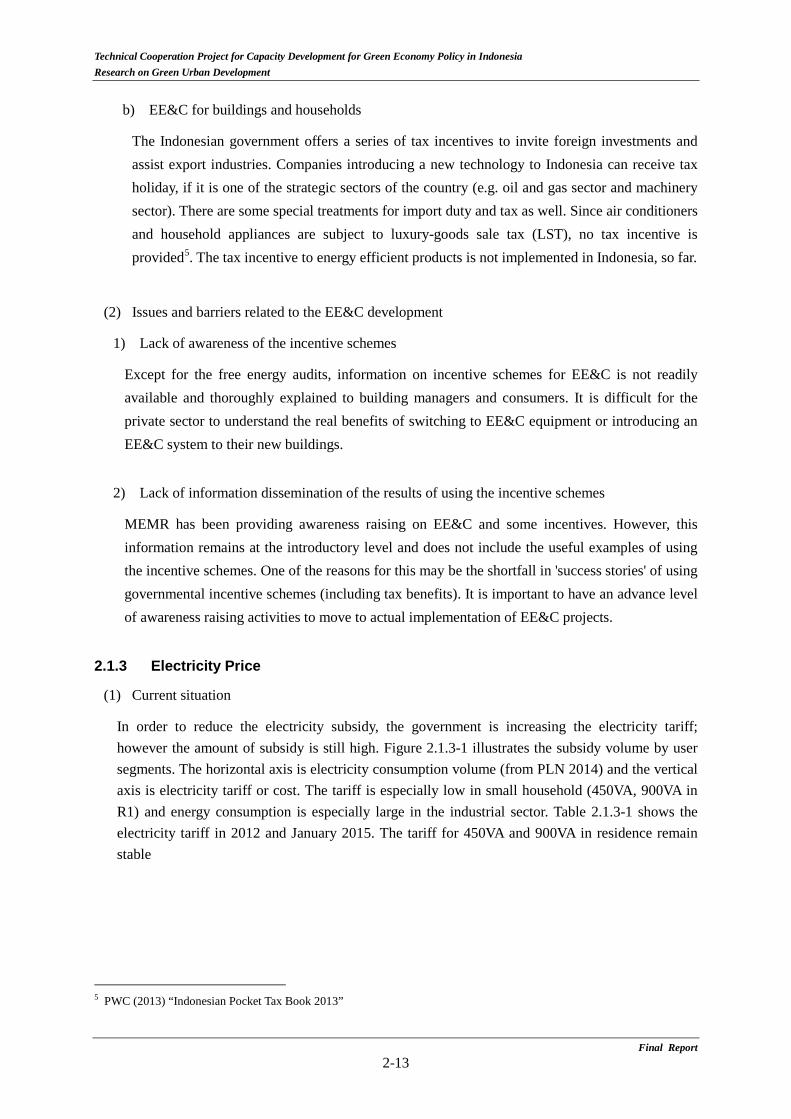
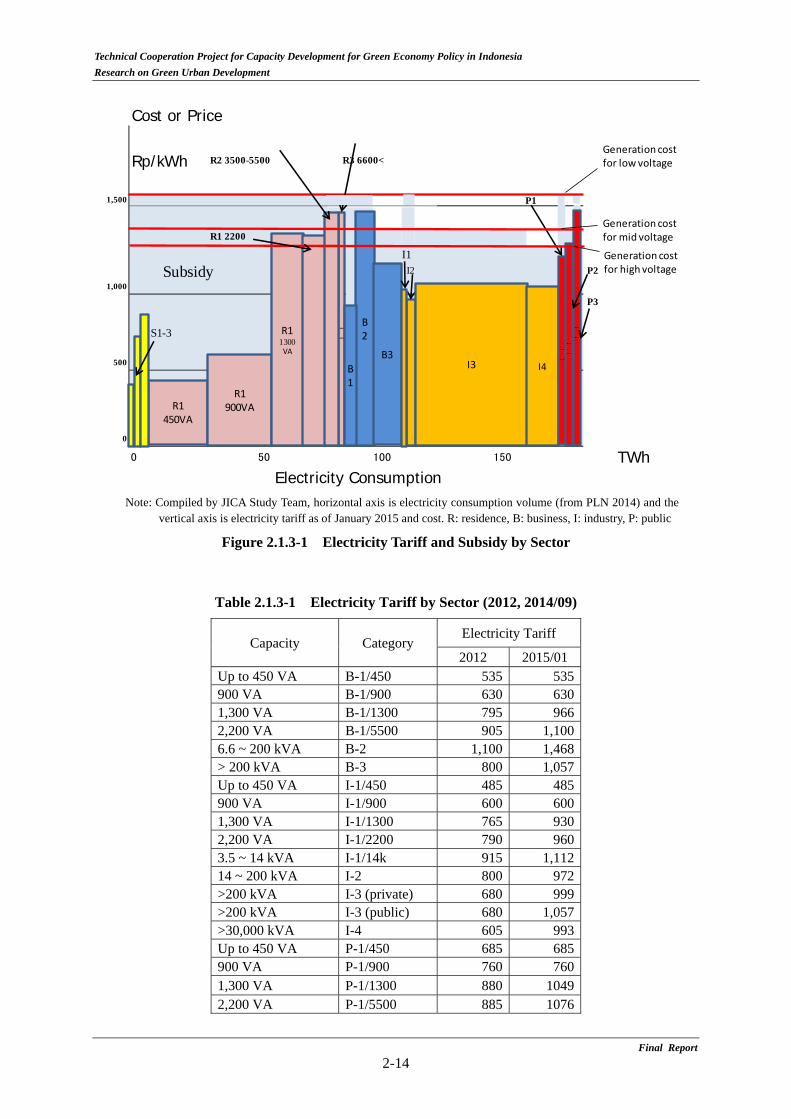
In order to reduce the electricity subsidy, the government is increasing the electricity tariff; however the amount of subsidy is still high. Figure 2.1.3-1 illustrates the subsidy volume by user segments. The horizontal axis is electricity consumption volume (from PLN 2014) and the vertical axis is electricity tariff or cost. The tariff is especially low in small household (450VA, 900VA in R1) and energy consumption is especially large in the industrial sector. Table 2.1.3-1 shows the electricity tariff in 2012 and January 2015. The tariff for 450VA and 900VA in residence remain stable
5 PWC (2013) “Indonesian Pocket Tax Book 2013”
Final Report 2-13
Technical Cooperation Project for Capacity Development for Green Economy Policy in Indonesia
Research on Green Urban Development
Final Report
2-14
Note: Compiled by JICA Study Team, horizontal axis is electricity consumption volume (from PLN 2014) and the
vertical axis is electricity tariff as of January 2015 and cost. R: residence, B: business, I: industry, P: public
Figure 2.1.3-1 Electricity Tariff and Subsidy by Sector
Table 2.1.3-1 Electricity Tariff by Sector (2012, 2014/09)
Capacity Category Electricity Tariff
2012 2015/01 Up to 450 VA B-1/450 535 535 900 VA B-1/900 630 630 1,300 VA B-1/1300 795 966 2,200 VA B-1/5500 905 1,100 6.6 ~ 200 kVA B-2 1,100 1,468 > 200 kVA B-3 800 1,057 Up to 450 VA I-1/450 485 485 900 VA I-1/900 600 600 1,300 VA I-1/1300 765 930 2,200 VA I-1/2200 790 960 3.5 ~ 14 kVA I-1/14k 915 1,112 14 ~ 200 kVA I-2 800 972 >200 kVA I-3 (private) 680 999 >200 kVA I-3 (public) 680 1,057 >30,000 kVA I-4 605 993 Up to 450 VA P-1/450 685 685 900 VA P-1/900 760 760 1,300 VA P-1/1300 880 1049 2,200 VA P-1/5500 885 1076
Cost or Price
Rp/kWh R2 3500-5500 R3 6600<
1,500 P1
R1 2200 I1
Subsidy I2 P21,000
P3
S1-3
500
0
0 50 150 TWh100
Electricity Consumption
__
R1450VA
R1900VA
R11300 VA
B2
B3I3 I4
__
__
__
B1
Generation costfor low voltage
Generation costfor mid voltage
Generation costfor high voltage

Technical Cooperation Project for Capacity Development for Green Economy Policy in Indonesia Research on Green Urban Development
Capacity Category Electricity Tariff
2012 2015/01 6.6 ~ 200 kVA P-1/200k 1,200 1,468 >200 kVA P-2 750 1,054 Street lighting P-3 820 1,468 Up to 450 VA R-1/450 415 415 900 VA R-1/900 605 605 1,300 VA R-1/1300 790 1,352 2,200 VA R-1/2200 795 1,352 3,500 - 5,500 VA R-2 890 1,468 6,600 VA & above R-3 1,330 1,468
Source: PLN
(2) Issues and barriers related to the EE&C development
1) Reliance on subsidies for household sector
As mentioned in the previous section, the small household heavily relies on the subsidy for their electricity consumption. The figure in the previous section indicates that the reduction of energy consumption in small household (R1 (450VA, 900VA) will have strong impact on subsidy reduction.
2) Political uncertainty
While the government is trying to increase the tariff to control subsidy, it is not easy to simply increase the tariff in the short period of the time under the political pressure. PLN is changing the tariff system to adjust the price equal to the cost, reflecting fuel price fluctuation (Fuel price adjustment sustem). There still exists a high uncertainty. This situation makes companies’ investment decision difficult.
2.1.4 Voluntary Initiatives for Green Buildings
(1) Current situation
Established in 2009 and an Emerging Member of the World Green Building Council (WGBC), Green Building Council Indonesia (GBCI) is a sole organization, accredited to certify green buildings as per the Ministry of Environment Decree on Green Building Certification Organization No. 8/2012.
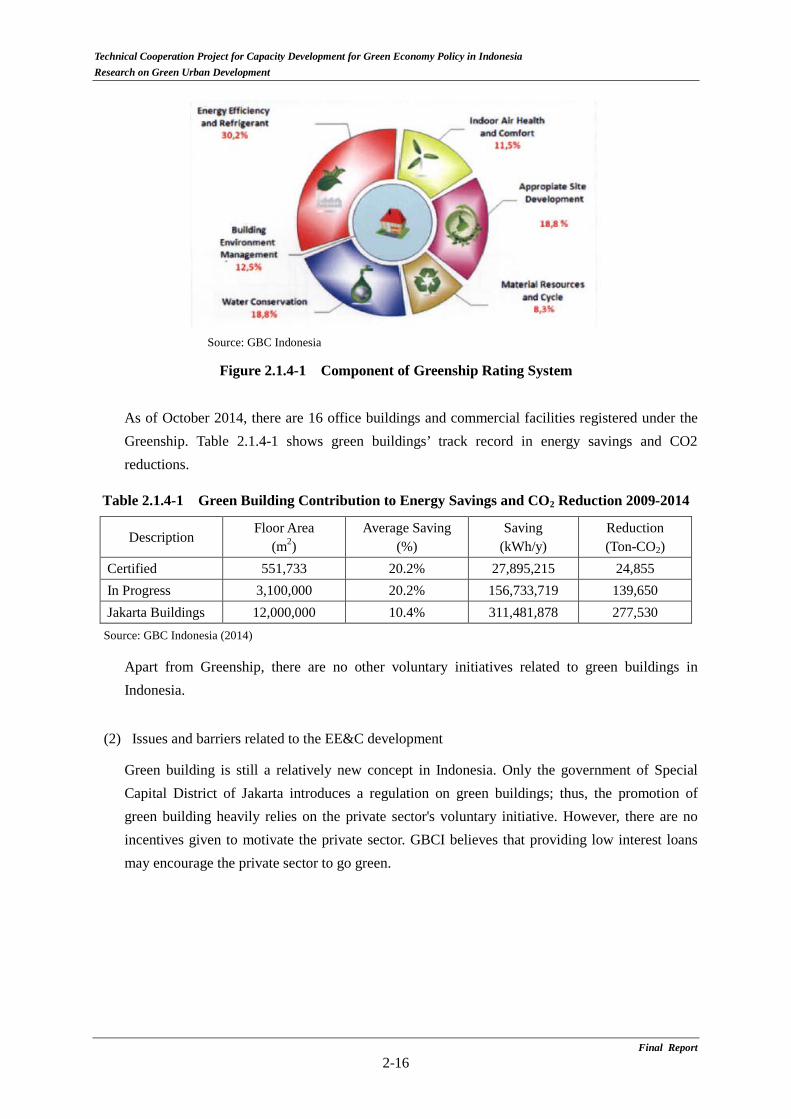
GBCI has developed a rating system called "Greenship" for both new and existing buildings based on their sets of standards and evaluation methods. Greenship rating system evaluates 6 different items as shown in Figure 2.1.4-1 and ranks the target facility into 4 statuses: bronze, silver, gold and platinum.
Final Report 2-15
Technical Cooperation Project for Capacity Development for Green Economy Policy in Indonesia Research on Green Urban Development
Source: GBC Indonesia
Figure 2.1.4-1 Component of Greenship Rating System
As of October 2014, there are 16 office buildings and commercial facilities registered under the Greenship. Table 2.1.4-1 shows green buildings’ track record in energy savings and CO2 reductions.
Table 2.1.4-1 Green Building Contribution to Energy Savings and CO2 Reduction 2009-2014
Description Floor Area
(m2) Average Saving
(%) Saving
(kWh/y) Reduction (Ton-CO2)
Certified 551,733 20.2% 27,895,215 24,855 In Progress 3,100,000 20.2% 156,733,719 139,650 Jakarta Buildings 12,000,000 10.4% 311,481,878 277,530
Source: GBC Indonesia (2014)
Apart from Greenship, there are no other voluntary initiatives related to green buildings in Indonesia.
(2) Issues and barriers related to the EE&C development
Green building is still a relatively new concept in Indonesia. Only the government of Special Capital District of Jakarta introduces a regulation on green buildings; thus, the promotion of green building heavily relies on the private sector's voluntary initiative. However, there are no incentives given to motivate the private sector. GBCI believes that providing low interest loans may encourage the private sector to go green.
Final Report 2-16
Technical Cooperation Project for Capacity Development for Green Economy Policy in Indonesia Research on Green Urban Development
2.1.5 EE&C Project Financing
(1) Current situation
1) Sustainable financing
OJK (Financial Service Authority in Indonesia) has the initiative called “Sustainable Financing” to stabilize the exchange rate through the fuel import reduction by renewable energy and EE&C promotion. It has the wider coverage than “Green Financing” previously advocated in Bank Indonesia, i.e. all financial institutions including banks, lease and non-banks. The legislation is under preparation. (There is no clear time schedule.)
2) Leasing EE&C equipment
Leasing EE&C equipment has not yet been a widely-spread practice in Indonesia. In the past, there were some heavy equipment leasing in the country; however, leasing companies shifted to consumers' market after the Asian Financial Crisis in 1997. The heavy equipment leasing is gradually coming back to the Indonesia market, including the power generation equipment. However, its application is still limited.
(2) Issues and barriers related to the EE&C development
1) Constraint in long-term financing
According to companies, the hurdles for EE&C investment with borrowing are availability of long-term loan is limited from Financial Institutions (FIs), high interest rates and high collateral requirement from banks.
2) Lack of incentives for the banking sector
Without incentives from the government, there are no incentives for banks to promote EE&C finance in addition to ordinary lending and EE&C finance can be simply burdensome for banks.
3) Lack of incentives for the leasing sector
JICA Study Team conducted informal interviews to some leasing companies and learned that there are no incentives given for leasing EE&C equipment in Indonesia. To the question of the effectiveness of introducing a subsidy for leasing fees, they replied that it may be an effective incentive for leasing companies as long as the rate of subsidy is high enough for them. They also commented that it is far more imporant to first develop the enabling environment for the EE&C equipment leasing, such as a means to recover leasing equipment with a lease deafult case or easy access to a second-hand markets for the EE&C equipment, to involve consumer leasing comanies to expand their buisness to EE&C equipment leasing.
Final Report 2-17
Technical Cooperation Project for Capacity Development for Green Economy Policy in Indonesia Research on Green Urban Development
EE&C Promotion Policy in Other Countries (Incentive and Regulation) 2.2
2.2.1 EE&C Promotion for Office Buildings
As we have reviewed in 2.1, it will be effective to focus on EE improvement of AC and solar insulation to promote EE&C in office buildings in Indonesia. In this section, EE&C policies implemented in other countries (mainly targeted at those equipment) are reviewed. Also, the introduction of PVs is effective for EE improvement in office buildings. Therefore, other countries’ experiences in this area are introduced.
(1) Japan
1) Regulation
Energy Conservation Law in Japan obliges the large energy consumers (more than 1,500kl/year) to appoint an Energy Management Control Officer and an Energy Management Planning Promoter and make the regular reporting on energy consumption including mid-long term plan, in addition to facilitating efforts to reduce energy consumption by 1%/year. On the other hand of regulations, the government provides various incentives described in 2) below.
As Green building code, CASBEE (Comprehensive Assessment System for Built Environment Efficiency), which is the methodology to evaluate and give ratings about the building’s energy and environmental design, was developed as an industry-government-academia collaboration project under the support of Ministry of Land, Infrastructure, Transport and Tourism. For implementation, some local governments make certification by CASBEE composary upon construction and expansion of buildings above the certain size by their ordinances.
2) Financial incentives
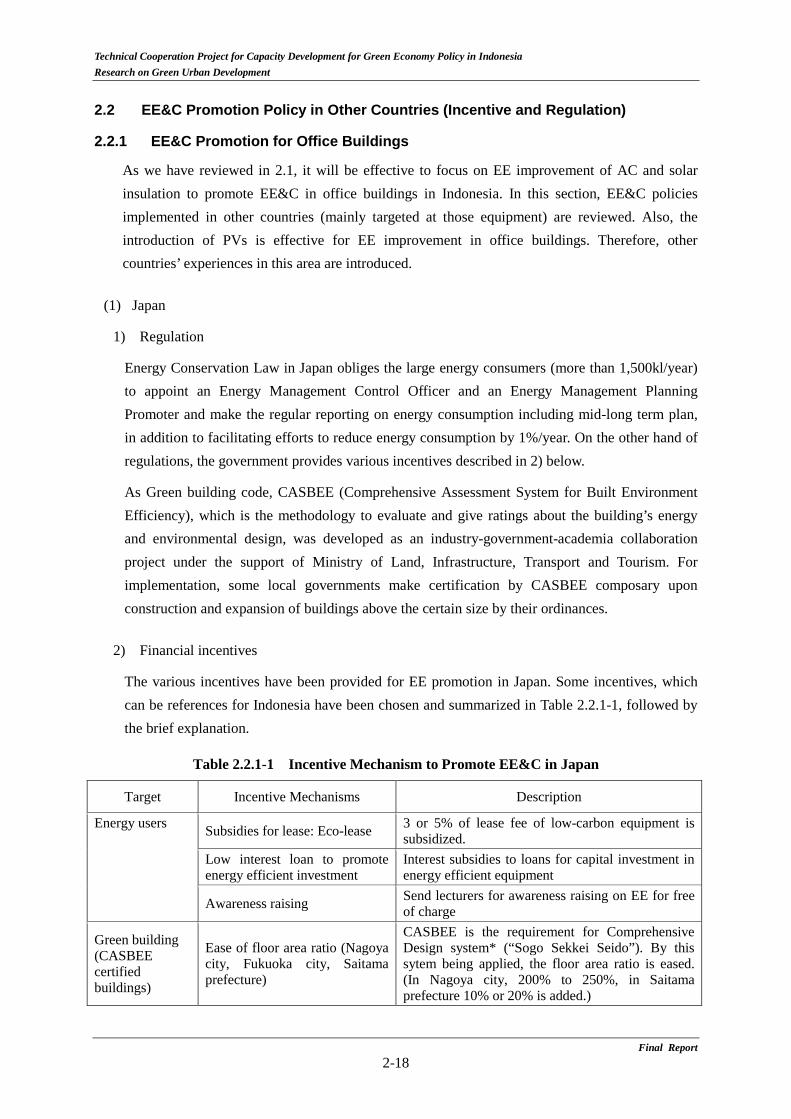
The various incentives have been provided for EE promotion in Japan. Some incentives, which can be references for Indonesia have been chosen and summarized in Table 2.2.1-1, followed by the brief explanation.
Table 2.2.1-1 Incentive Mechanism to Promote EE&C in Japan
Target Incentive Mechanisms Description
Energy users Subsidies for lease: Eco-lease 3 or 5% of lease fee of low-carbon equipment is subsidized.
Low interest loan to promote energy efficient investment
Interest subsidies to loans for capital investment in energy efficient equipment
Awareness raising Send lecturers for awareness raising on EE for free of charge
Green building (CASBEE certified buildings)
Ease of floor area ratio (Nagoya city, Fukuoka city, Saitama prefecture)
CASBEE is the requirement for Comprehensive Design system* (“Sogo Sekkei Seido”). By this sytem being applied, the floor area ratio is eased. (In Nagoya city, 200% to 250%, in Saitama prefecture 10% or 20% is added.)
Final Report 2-18
Technical Cooperation Project for Capacity Development for Green Economy Policy in Indonesia Research on Green Urban Development
Target Incentive Mechanisms Description
Low interest loan (Hiroshima city)
For the construction of buildings with 2000 m2 or above, the certificate by CASBEE Hiroshima is compulsory. If a company is SME, it can receive the low interest loan.
* In case that the buildings are built with some open space on a premise in the area of more than 500 m2, the ceiling of floor area ratio, setback-line limit and absolute height limit are eased by the local government’s permission, if it is admitted that the buildings contribute to improvement of city area’s environment by considering the the total plan.
a) Subsidies for lease: Eco-lease (subsidy to lease fee)
In this program, 3% or 5% of lease fee of low-carbon equipment is subsidized. Among the low-carbon equipment, equipment with high electricity saving is applied 5%. JPY 1.8 billion is budgeted for the program in the government in 2014. The main eligibility of lease contracts is as follows:
Lease of “low-carbon equipment” to satisfy the criteria determined by Ministry of Environment
In principle, neither cancellation nor termination is allowed in the lease period.
The lease transaction is the one without ownership transfer.
The lease period is, at minimum, 70% of statutory useful life (for 10 years or longer, 60% at minimum).
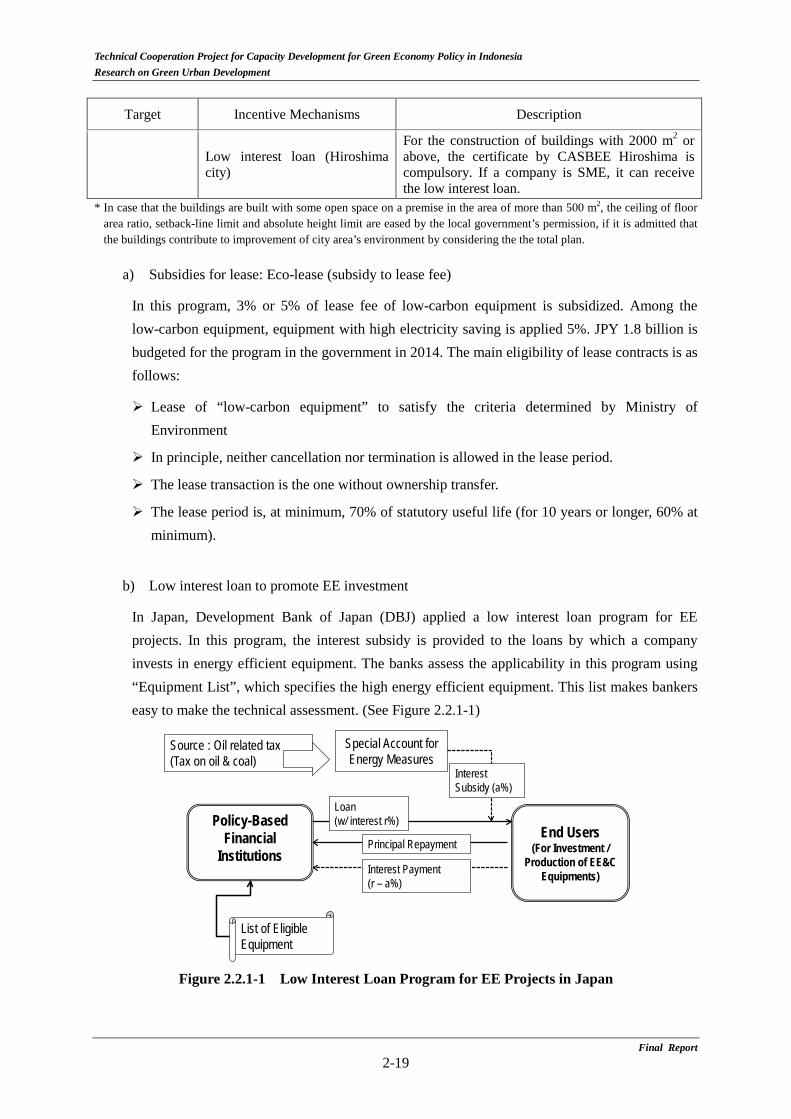
b) Low interest loan to promote EE investment
In Japan, Development Bank of Japan (DBJ) applied a low interest loan program for EE projects. In this program, the interest subsidy is provided to the loans by which a company invests in energy efficient equipment. The banks assess the applicability in this program using “Equipment List”, which specifies the high energy efficient equipment. This list makes bankers easy to make the technical assessment. (See Figure 2.2.1-1)
Figure 2.2.1-1 Low Interest Loan Program for EE Projects in Japan
List of Eligible Equipment
Policy-Based Financial
InstitutionsEnd Users
(For Investment / Production of EE&C
Equipments)
Special Account for Energy Measures
Loan (w/ interest r%)
Interest Payment (r – a%)
Source : Oil related tax(Tax on oil & coal)
Principal Repayment
Interest Subsidy (a%)
Final Report 2-19
Technical Cooperation Project for Capacity Development for Green Economy Policy in Indonesia Research on Green Urban Development
c) Awareness raising
In order to raise awareness toward EE&C, lecturers are sent from the Energy Conservation Center, Japan (ECCJ) to the workshop, without fees to explain EE&C, such as how to promote EE&C, case studies and introduction of energy audit. ECCJ is operated based on Governmental consignments and membership fees from companies.
d) Incentives to green buildings (buildings certified by CASBEE)
As described above, submission of certificates by CASBEE is made comporsury by some local government’s ordinances. Combined with this initiative, the local government established the incentives by setting CASBEE certificate as the requirement.
(i) Ease of floor area ratio (Nagoya city, Fukuoka city and Saitama prefecture)
CASBEE is the requirement for Comprehensive Design system (“Sogo Sekkei Seido”). “Comprehensive Design System” is that the ceiling of floor area ratio, setback-line limit and absolute height limit are eased by the local government’s permission, if it is admitted that the buildings contribute to improvement of city area’s environment by considering the the total plan, in case that the buildings are built with some open space on a premise in the area of more than 500 m2.
By this sytem being applied, the floor area ratio is eased in Nagoya city from usually 200% to 250% for S rank certificate. In Saitama prefecture, 10% or 20% of bonus floor area can be added.
(ii) Low interest loan to Small-medium enterprises (SMEs) (Hiroshima city)
In Hiroshima city, a building owner to build a building with the total floor area of more than 2000 m2 (if it is expansion or reform, the expanded/reformed area is more than 2000 m2), is required to evaluate the building’s energy and environmental design using “CASBEE Hiroshima” and submit the building environment planning document describing the evaluation results to the city.
On the other hand, the city provides the low interest loan (environment friendly finance (special loan)) to SMEs taking environment conservation action. The maximam loan size is JPY 70 million (approximately JPY 700,000), the repayment period is within 10 years for capital investment (grace period within 1 year), and the interest rate is 1.2%.
(2) Malaysia
1) Regulation
Energy Conservation Law in Malaysia obliges large energy consumers (more than 3 million kWh/half year) to appoint an accredited electric energy manager, make regular energy audit and
Final Report 2-20
Technical Cooperation Project for Capacity Development for Green Economy Policy in Indonesia Research on Green Urban Development
reporting on energy consumption and implement countermeasures against the audit results.
In order to promote energy efficient buildings, PAM (Malaysia Institute of Architects, NGO) started “Green Building Index (GBI)” program in 2009. In this GBI program, a certificate is issued to an energy efficient building based on the assessment by Association of Consulting Engineers Malaysia.
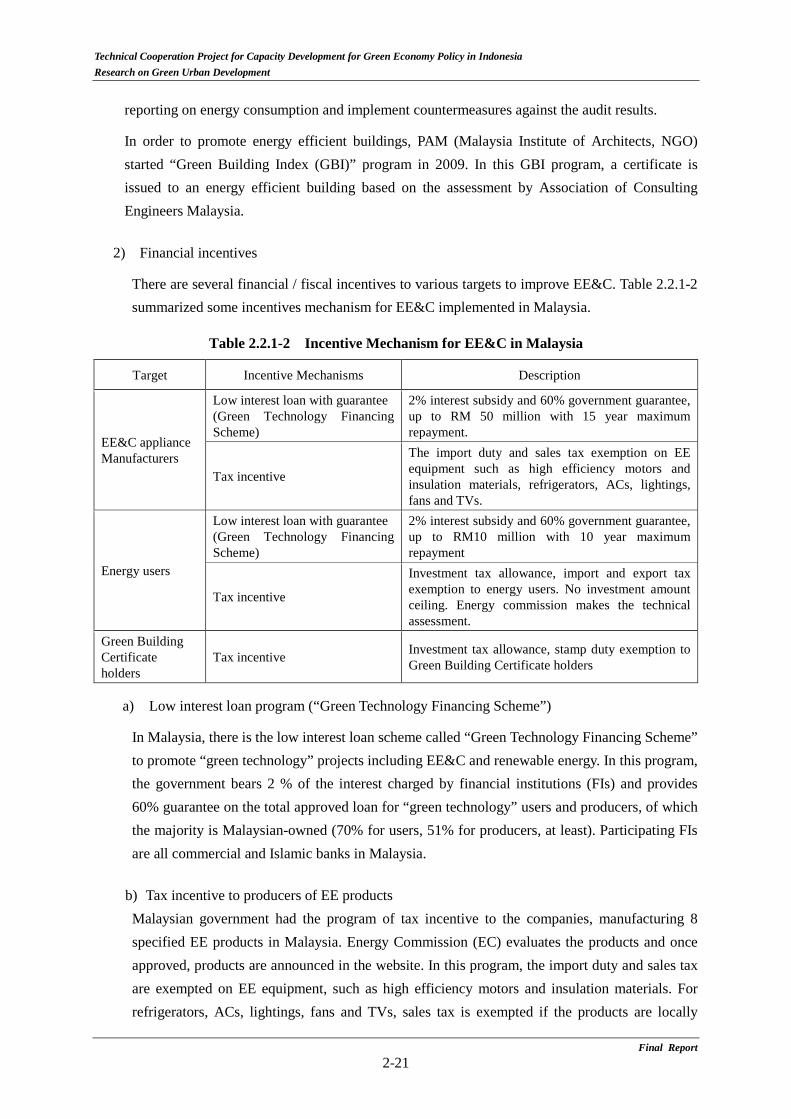
2) Financial incentives
There are several financial / fiscal incentives to various targets to improve EE&C. Table 2.2.1-2 summarized some incentives mechanism for EE&C implemented in Malaysia.
Table 2.2.1-2 Incentive Mechanism for EE&C in Malaysia
Target Incentive Mechanisms Description
EE&C appliance Manufacturers
Low interest loan with guarantee (Green Technology Financing Scheme)
2% interest subsidy and 60% government guarantee, up to RM 50 million with 15 year maximum repayment.
Tax incentive
The import duty and sales tax exemption on EE equipment such as high efficiency motors and insulation materials, refrigerators, ACs, lightings, fans and TVs.
Energy users
Low interest loan with guarantee (Green Technology Financing Scheme)
2% interest subsidy and 60% government guarantee, up to RM10 million with 10 year maximum repayment
Tax incentive
Investment tax allowance, import and export tax exemption to energy users. No investment amount ceiling. Energy commission makes the technical assessment.
Green Building Certificate holders
Tax incentive Investment tax allowance, stamp duty exemption to Green Building Certificate holders
a) Low interest loan program (“Green Technology Financing Scheme”)
In Malaysia, there is the low interest loan scheme called “Green Technology Financing Scheme” to promote “green technology” projects including EE&C and renewable energy. In this program, the government bears 2 % of the interest charged by financial institutions (FIs) and provides 60% guarantee on the total approved loan for “green technology” users and producers, of which the majority is Malaysian-owned (70% for users, 51% for producers, at least). Participating FIs are all commercial and Islamic banks in Malaysia.
b) Tax incentive to producers of EE products Malaysian government had the program of tax incentive to the companies, manufacturing 8 specified EE products in Malaysia. Energy Commission (EC) evaluates the products and once approved, products are announced in the website. In this program, the import duty and sales tax are exempted on EE equipment, such as high efficiency motors and insulation materials. For refrigerators, ACs, lightings, fans and TVs, sales tax is exempted if the products are locally
Final Report 2-21

Technical Cooperation Project for Capacity Development for Green Economy Policy in Indonesia Research on Green Urban Development
manufactured.
c) Tax incentive to EE&C projects by energy users
From 2009 to 2015, Malaysian government is implementing the program of investment tax allowance and import/sales tax exemption to EE&C projects by energy users. For technical criteria, there is no clear numerical threshold in terms of energy reduction, since an application will be approved if it leads to peak-cut.
d) Tax incentive (Investment tax allowance and exemption of stamp duty) to Green Building
Certificate holders
To promote Green Building Index initiative, Malaysian government provides the tax incentive, e.g. investment tax allowance (corporate tax reduction) and stamp duty exemption.
(3) Thailand
1) EE Standards and Regulations
The Thai government enacted the Energy Conservation Promotion (ECP) Act in 1992. Under this Act, a series of country's key EE&C policies and programs have been implemented, and they have become the source of various measures and sub-programs to promote and support the development of EE&C. In Energy Conservation Promotion Act, establishment of Green Building Code is also mentioned and “Ministerial Regulation Prescribing the Type and Size of Buildings and Standards, Rules and Procedures for Designing Energy Conservation Buildings 2009” specifying the floor area of the targeted buildings is published in 2009.
2) Financial incentives
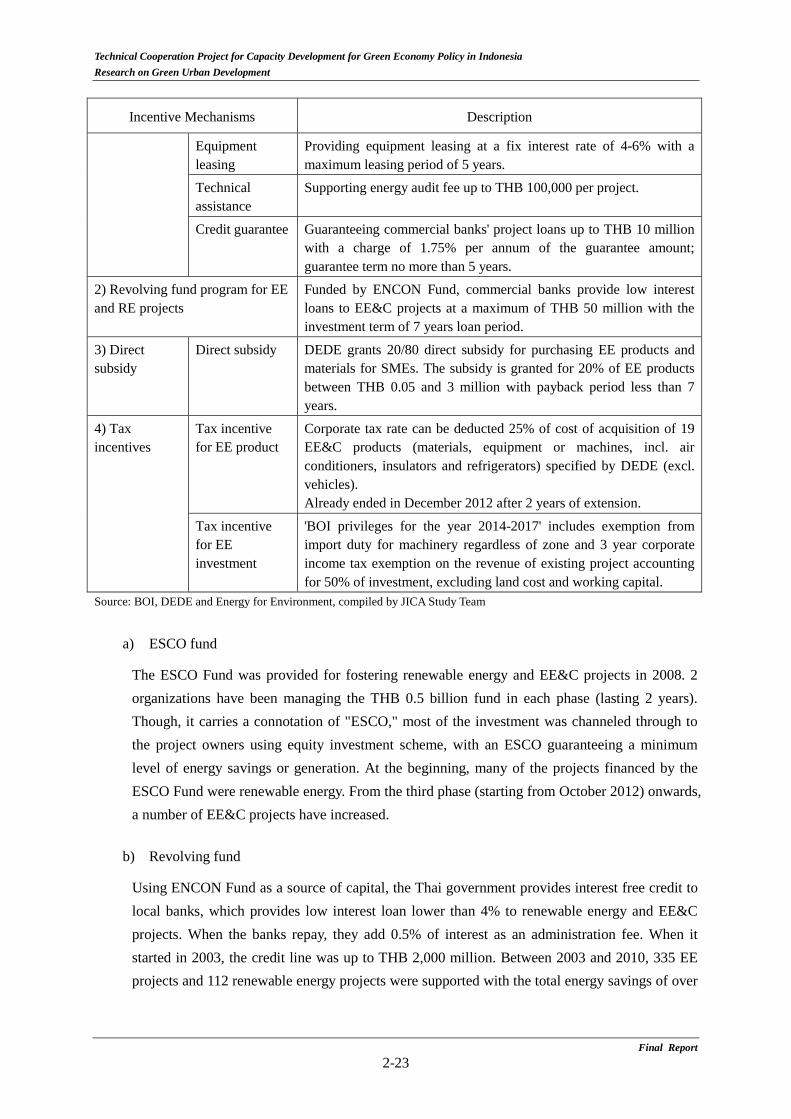
In 2010, the EE Improvement Program granted a subsidy to enhance the absorptive capacity of the enterprises, such as low interest loans via commercial banks (known as "revolving fund"), tax incentives for industries, EE investment promotion measures under the guidance of the Board of Investment of Thailand (BOI) and funding for technical assistance. Incentive mechanisms for EE&C programs can be classified into four different categories as shown in Table 2.2.1-3.
Table 2.2.1-3 Incentive Mechanism for EE&C in Thailand
Incentive Mechanisms Description
1) Government co-investment program (ESCO fund)
Equity investment
10-50% of total equity covered up to THB 50 million with an investment period of 5-7 years.
Venture capital with ESCO
10-30% of registered capital covered up to THB 50 million with an investment period of 5-7 years.
Final Report 2-22
Technical Cooperation Project for Capacity Development for Green Economy Policy in Indonesia Research on Green Urban Development
Incentive Mechanisms Description
Equipment leasing
Providing equipment leasing at a fix interest rate of 4-6% with a maximum leasing period of 5 years.
Technical assistance
Supporting energy audit fee up to THB 100,000 per project.
Credit guarantee Guaranteeing commercial banks' project loans up to THB 10 million with a charge of 1.75% per annum of the guarantee amount; guarantee term no more than 5 years.
2) Revolving fund program for EE and RE projects
Funded by ENCON Fund, commercial banks provide low interest loans to EE&C projects at a maximum of THB 50 million with the investment term of 7 years loan period.
3) Direct subsidy
Direct subsidy DEDE grants 20/80 direct subsidy for purchasing EE products and materials for SMEs. The subsidy is granted for 20% of EE products between THB 0.05 and 3 million with payback period less than 7 years.
4) Tax incentives
Tax incentive for EE product
Corporate tax rate can be deducted 25% of cost of acquisition of 19 EE&C products (materials, equipment or machines, incl. air conditioners, insulators and refrigerators) specified by DEDE (excl. vehicles). Already ended in December 2012 after 2 years of extension.
Tax incentive for EE investment
'BOI privileges for the year 2014-2017' includes exemption from import duty for machinery regardless of zone and 3 year corporate income tax exemption on the revenue of existing project accounting for 50% of investment, excluding land cost and working capital.
Source: BOI, DEDE and Energy for Environment, compiled by JICA Study Team
a) ESCO fund
The ESCO Fund was provided for fostering renewable energy and EE&C projects in 2008. 2 organizations have been managing the THB 0.5 billion fund in each phase (lasting 2 years). Though, it carries a connotation of "ESCO," most of the investment was channeled through to the project owners using equity investment scheme, with an ESCO guaranteeing a minimum level of energy savings or generation. At the beginning, many of the projects financed by the ESCO Fund were renewable energy. From the third phase (starting from October 2012) onwards, a number of EE&C projects have increased.
b) Revolving fund
Using ENCON Fund as a source of capital, the Thai government provides interest free credit to local banks, which provides low interest loan lower than 4% to renewable energy and EE&C projects. When the banks repay, they add 0.5% of interest as an administration fee. When it started in 2003, the credit line was up to THB 2,000 million. Between 2003 and 2010, 335 EE projects and 112 renewable energy projects were supported with the total energy savings of over
Final Report 2-23

Technical Cooperation Project for Capacity Development for Green Economy Policy in Indonesia Research on Green Urban Development
USD 154 million per year6. During the same time, over THB 6,800 million was provided to assist the projects through 11 local banks.
c) Direct subsidy
Thai government provides direct subsidies for selective equipment each year. They also have a 'priority list' (engines, compressors, VSC, boilers etc.) for the subsidy. Prior to opening up a tender for proposals, the government collects standard prices for each EE&C equipment and actual costs (including installation costs) and determines the ceiling amount for subsidy disbursement.
d) Tax incentives
BOI offers a variety of tax incentives, including corporate tax exemptions/reduction, tax holiday and reduction in import duty. Import duty reduction is important especially for EE&C equipment imported from abroad.
e) Impact of the individual incentive measures
Though, the impact of the individual measures provided by ENCON Fund was small at the beginning, the number of the projects benefitting from the programs gradually increased over the years. The Revolving Fund took a significant time to accumulate the track record among commercial banks due to lack of know-how and process to finance EE&C projects. Tax incentives have also become a marketing tool for EE equipment manufacturers when selling their products. On the other hand, venture capital with ESCO found to be less effective compared to other measures due to risk associated with ESCO business and its credibility. The ESCO fund managers also reported that the credit guarantee system was also not used in an extensive way.
(4) Vietnam
1) EE Standards and Regulations
In 2006, Presidential Decision 79/2006/QD-TTg approved the establishment of the National Target Energy Efficiency Program (VNEEP), aiming at reducing energy by 3% to 5 % during 2006-2010 and 5% to 8% during 2007-2015. Under VNEEP, various international/bilateral efforts have been provided to implement pilot projects for EE and renewable energy. However, the regulations related to green building is not introduced as of January 2015.
6 OECD (2013) "Southeast Asia Economic Outlook 2013 with Perspectives on China and India"
Final Report 2-24

Technical Cooperation Project for Capacity Development for Green Economy Policy in Indonesia Research on Green Urban Development
2) Financial incentives
Table 2.2.1-4 summarizes the financial incentives given by the Vietnamese government.
Table 2.2.1-4 Incentive Mechanism for EE&C in Vietnam
Incentive Mechanisms Description
1) Financial support for energy management
Energy audit (demand side)
-50% of energy audit fee to the maximum of 50 million per audit
Investment (demand side)
-30% of investment to the maximum of VND 70 million
Labelling (supply side)
-30% of total cost of product labelling to the maximum of VND60million per enterprise
2) VNEEP government subsidy
Subsidy - Subsidy up to 30% or VND 5 billion per project
3) Tax incentives
Corporate Income Tax (CIT)
For eligible newly established enterprises: - Preferential rate of 17% or 20% for 10 years from the first year of
revenue generation - CIT exemption for 2 years starting from the first profitable year, if
located in industrial parks - CIT reduction for 4 years after expiration of the CIT exemption period
VAT exemption/ reduction
- Exemption for special conditions, including machineries, equipment and materials that are unable to be produced domestically and must be imported.
Import duty ordinary
- Preferential rate between 0%-150% of the CIF (cost, insurance and freight) price of the imported goods from countries, including countries with special preferential agreement.
- Exemption and reduction for domestically unavailable EE and Renewable energy-consuming devices and equipment and parts
- Exemption and reduction for parts and components for the manufacture of energy-efficient lighting devices and equipment; devices and equipment using solar and wind power;
Source: Composed from Embassy of Socialist Republic of Vietnam in the U.S. website, related National Assembly Law 14/2008/QH12; NA 32/2013/QH13; Ministry of Finance Circular 123/2012/TT-BTC; and the Government Decree 218/2013/ND-CP, compiled by JICA Study Team
a) Financial support for energy management
In 2007, joint circular No. 142/2007/TTLT-BTC-BCT was issued on management and use of state budget for VNEEP, which defines the ceiling of financial support for energy management7.
7 Draft Final Project Document Low Carbon Transition in the Energy Efficiency Sector Vietnam, Volume II Supportive Annexes, Embassy of Denmark in Vietnam, http://vietnam.um.dk/en/green-growth/low-carbon-transition/
Final Report 2-25
Technical Cooperation Project for Capacity Development for Green Economy Policy in Indonesia Research on Green Urban Development
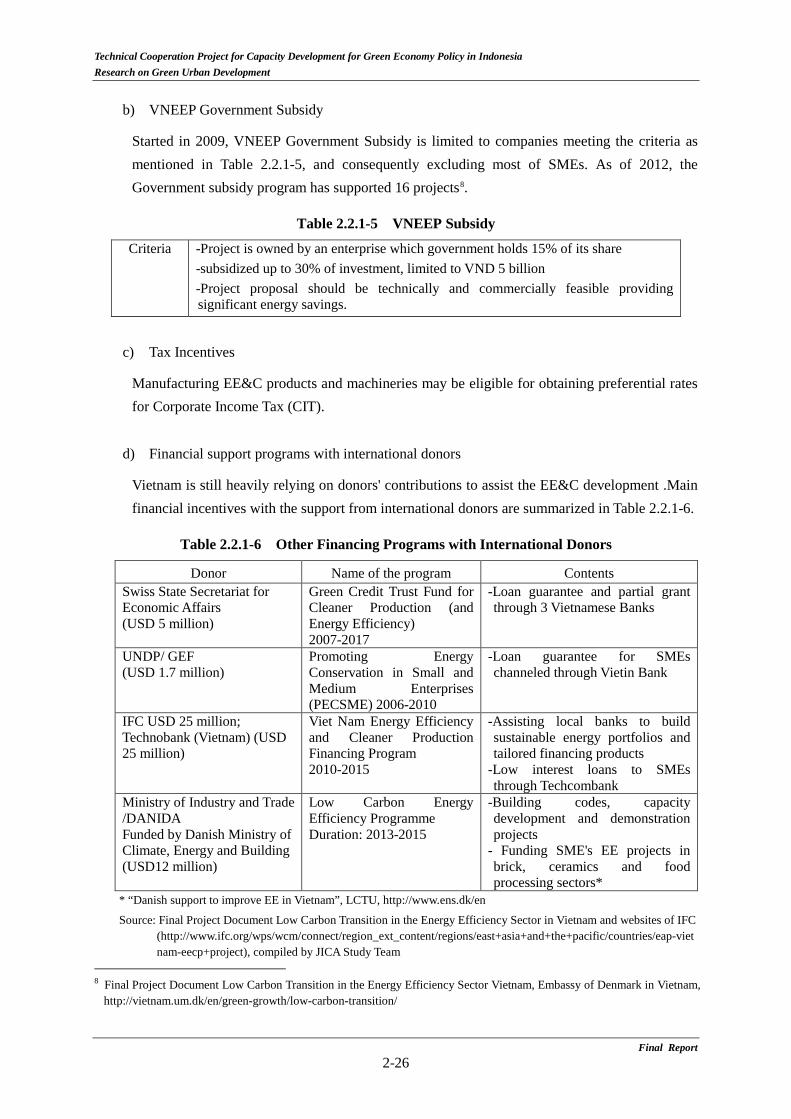
b) VNEEP Government Subsidy
Started in 2009, VNEEP Government Subsidy is limited to companies meeting the criteria as mentioned in Table 2.2.1-5, and consequently excluding most of SMEs. As of 2012, the Government subsidy program has supported 16 projects8.
Table 2.2.1-5 VNEEP Subsidy
Criteria -Project is owned by an enterprise which government holds 15% of its share -subsidized up to 30% of investment, limited to VND 5 billion -Project proposal should be technically and commercially feasible providing significant energy savings.
c) Tax Incentives
Manufacturing EE&C products and machineries may be eligible for obtaining preferential rates for Corporate Income Tax (CIT).
d) Financial support programs with international donors
Vietnam is still heavily relying on donors' contributions to assist the EE&C development .Main financial incentives with the support from international donors are summarized in Table 2.2.1-6.
Table 2.2.1-6 Other Financing Programs with International Donors
Donor Name of the program Contents Swiss State Secretariat for Economic Affairs (USD 5 million)
Green Credit Trust Fund for Cleaner Production (and Energy Efficiency) 2007-2017
-Loan guarantee and partial grant through 3 Vietnamese Banks
UNDP/ GEF (USD 1.7 million)
Promoting Energy Conservation in Small and Medium Enterprises (PECSME) 2006-2010
-Loan guarantee for SMEs channeled through Vietin Bank
IFC USD 25 million; Technobank (Vietnam) (USD 25 million)
Viet Nam Energy Efficiency and Cleaner Production Financing Program 2010-2015
-Assisting local banks to build sustainable energy portfolios and tailored financing products
-Low interest loans to SMEs through Techcombank
Ministry of Industry and Trade /DANIDA Funded by Danish Ministry of Climate, Energy and Building (USD12 million)
Low Carbon Energy Efficiency Programme Duration: 2013-2015
-Building codes, capacity development and demonstration projects
- Funding SME's EE projects in brick, ceramics and food processing sectors*
* “Danish support to improve EE in Vietnam”, LCTU, http://www.ens.dk/en
Source: Final Project Document Low Carbon Transition in the Energy Efficiency Sector in Vietnam and websites of IFC (http://www.ifc.org/wps/wcm/connect/region_ext_content/regions/east+asia+and+the+pacific/countries/eap-vietnam-eecp+project), compiled by JICA Study Team
8 Final Project Document Low Carbon Transition in the Energy Efficiency Sector Vietnam, Embassy of Denmark in Vietnam, http://vietnam.um.dk/en/green-growth/low-carbon-transition/
Final Report 2-26
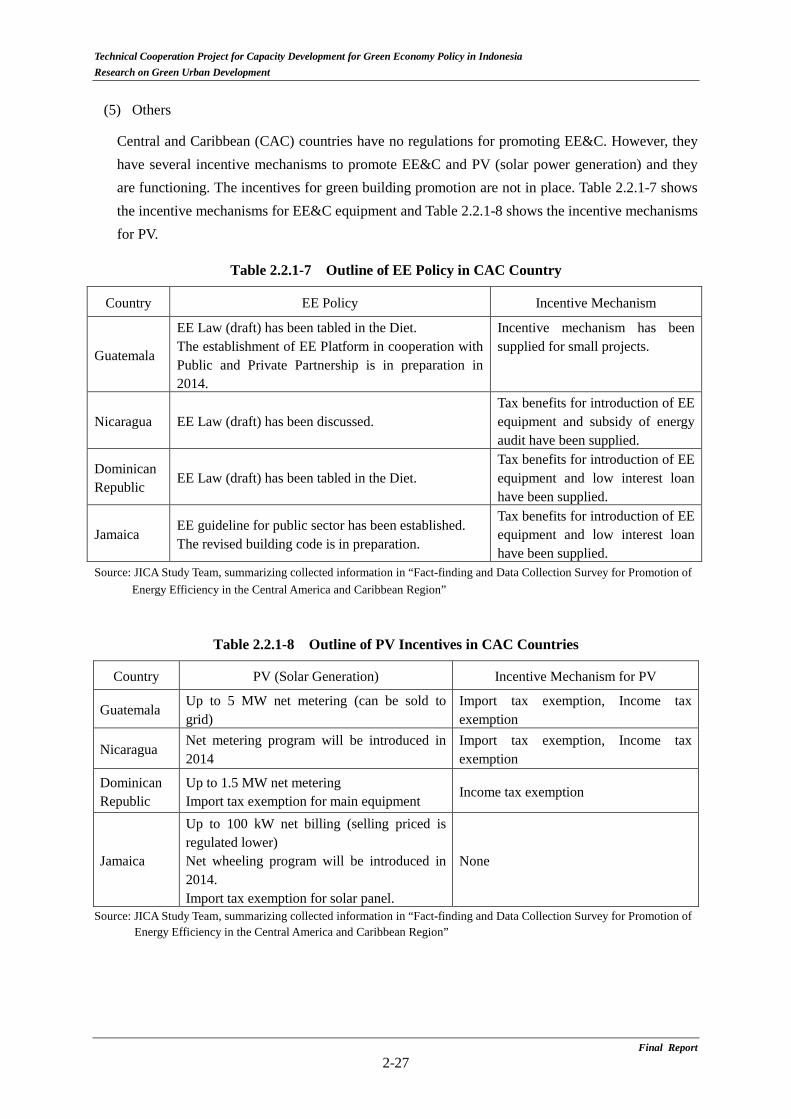
Technical Cooperation Project for Capacity Development for Green Economy Policy in Indonesia Research on Green Urban Development
(5) Others
Central and Caribbean (CAC) countries have no regulations for promoting EE&C. However, they have several incentive mechanisms to promote EE&C and PV (solar power generation) and they are functioning. The incentives for green building promotion are not in place. Table 2.2.1-7 shows the incentive mechanisms for EE&C equipment and Table 2.2.1-8 shows the incentive mechanisms for PV.
Table 2.2.1-7 Outline of EE Policy in CAC Country
Country EE Policy Incentive Mechanism
Guatemala
EE Law (draft) has been tabled in the Diet. The establishment of EE Platform in cooperation with Public and Private Partnership is in preparation in 2014.
Incentive mechanism has been supplied for small projects.
Nicaragua EE Law (draft) has been discussed. Tax benefits for introduction of EE equipment and subsidy of energy audit have been supplied.
Dominican Republic
EE Law (draft) has been tabled in the Diet. Tax benefits for introduction of EE equipment and low interest loan have been supplied.
Jamaica EE guideline for public sector has been established. The revised building code is in preparation.
Tax benefits for introduction of EE equipment and low interest loan have been supplied.
Source: JICA Study Team, summarizing collected information in “Fact-finding and Data Collection Survey for Promotion of Energy Efficiency in the Central America and Caribbean Region”
Table 2.2.1-8 Outline of PV Incentives in CAC Countries
Country PV (Solar Generation) Incentive Mechanism for PV
Guatemala Up to 5 MW net metering (can be sold to grid)
Import tax exemption, Income tax exemption
Nicaragua Net metering program will be introduced in 2014
Import tax exemption, Income tax exemption
Dominican Republic
Up to 1.5 MW net metering Import tax exemption for main equipment
Income tax exemption
Jamaica
Up to 100 kW net billing (selling priced is regulated lower) Net wheeling program will be introduced in 2014. Import tax exemption for solar panel.
None
Source: JICA Study Team, summarizing collected information in “Fact-finding and Data Collection Survey for Promotion of Energy Efficiency in the Central America and Caribbean Region”
Final Report 2-27
Technical Cooperation Project for Capacity Development for Green Economy Policy in Indonesia Research on Green Urban Development
2.2.2 EE&C Promotion for Households
As we have reviewed in 2.1, it is effective to focus on EE improvement of ACs and refrigerators to promote EE&C in households in Indonesia. In this section, EE&C policies implemented in other countries for these segments are reviewed.
(1) Japan
In Japan, “Top runner program” has been adapted since Energy Conservation Law enactment in 1979 and its target has been increased since then. The current program is to set the EE target of electric appliances, such as ACs and refrigerators to the best performance of the product among the available ones in the market. In addition, assignment of “Eco-labelling” to ACs and refrigerator was also made compulsory.
1) Rebate program for electric appliances (Eco-point program using Eco-labeling)
The rebate program provided to EE electric appliances was implemented in Japan from 2009 to 2011. “Electric appliance’s eco points” (rebates), which can be exchanged with various products and services upon “Green Electrical Appliances” purchase, were provided. “Green Electric Appliances” includes ACs and refrigerators with 4stars or above of EE labelling established by the government. (From the purchase after 1st January 2011, the eligibility criteria for application were changed to the products with the five stars for replacement and recycle”.)
The issued cumulative Eco-point amounts for individuals (i.e. except corporations) reached to 26.94 million cases, approximately 402 billion points (equivalent to JPY 402 billion (USD 3.5 billion)) from July 2009 to the end of November 2010.
2) Subsidies for PV power generation system in household
When a household or company newly install PV system in their premises, JPY 20,000 (USD 170) or JPY 15,000 (USD 130)/kW will be subsidized in case that investment costs are JPY 20-410 thousands (USD 170-3,565) and JPY 410-500 thousands (USD 3,565-4350), respectively.
(2) Malaysia
In Malaysia, the labeling to indicate EE to electric appliances is introduced on voluntary basis to refrigerators, ACs, fans, TVs and lamps etc. Following the voluntary labeling program, Minimum Energy Performance Standards (MEPS) was implemented and enforced for 5 domestic electrical products (AC, refrigerator, television, electric fan and lighting). From May 2015, the above 5 appliances will have to adhere to the MEPS requirement for it to be sell in the Malaysian market.
1) Rebate program
Malaysian government implemented “labelling program” for refrigerator, AC, electric fan and TV. It was voluntary basis and Energy Commission conducts the technical assessment. It has from 2
Final Report 2-28
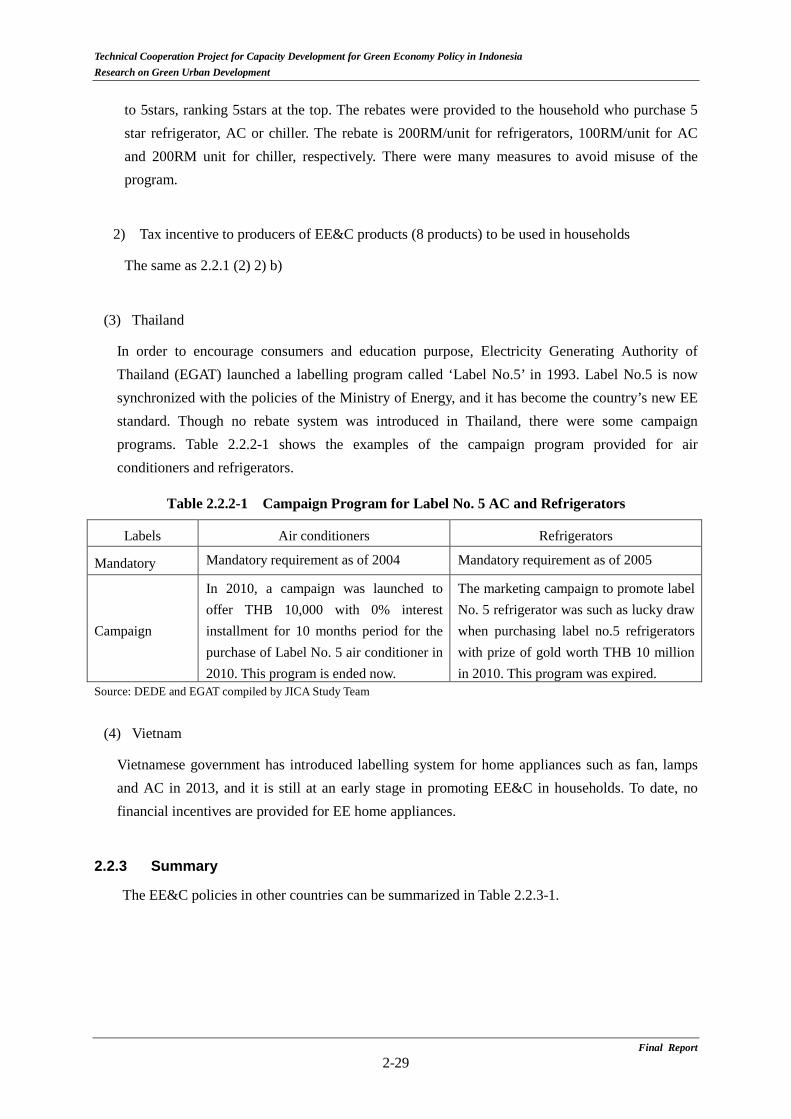
Technical Cooperation Project for Capacity Development for Green Economy Policy in Indonesia Research on Green Urban Development
to 5stars, ranking 5stars at the top. The rebates were provided to the household who purchase 5 star refrigerator, AC or chiller. The rebate is 200RM/unit for refrigerators, 100RM/unit for AC and 200RM unit for chiller, respectively. There were many measures to avoid misuse of the program.
2) Tax incentive to producers of EE&C products (8 products) to be used in households
The same as 2.2.1 (2) 2) b)
(3) Thailand
In order to encourage consumers and education purpose, Electricity Generating Authority of Thailand (EGAT) launched a labelling program called ‘Label No.5’ in 1993. Label No.5 is now synchronized with the policies of the Ministry of Energy, and it has become the country’s new EE standard. Though no rebate system was introduced in Thailand, there were some campaign programs. Table 2.2.2-1 shows the examples of the campaign program provided for air conditioners and refrigerators.
Table 2.2.2-1 Campaign Program for Label No. 5 AC and Refrigerators
Labels Air conditioners Refrigerators
Mandatory Mandatory requirement as of 2004 Mandatory requirement as of 2005
Campaign
In 2010, a campaign was launched to offer THB 10,000 with 0% interest installment for 10 months period for the purchase of Label No. 5 air conditioner in 2010. This program is ended now.
The marketing campaign to promote label No. 5 refrigerator was such as lucky draw when purchasing label no.5 refrigerators with prize of gold worth THB 10 million in 2010. This program was expired.
Source: DEDE and EGAT compiled by JICA Study Team
(4) Vietnam
Vietnamese government has introduced labelling system for home appliances such as fan, lamps and AC in 2013, and it is still at an early stage in promoting EE&C in households. To date, no financial incentives are provided for EE home appliances.
2.2.3 Summary
The EE&C policies in other countries can be summarized in Table 2.2.3-1.
Final Report 2-29
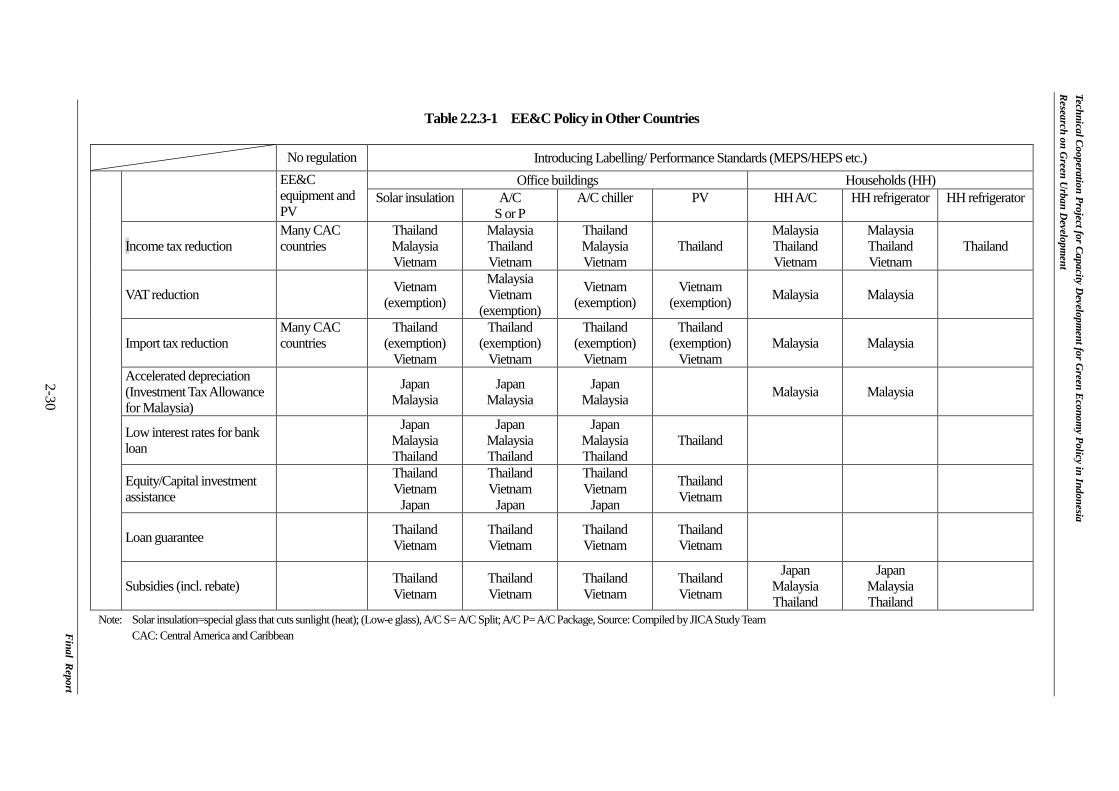
Technical Cooperation Project for Capacity D
evelopment for G
reen Econom
y Policy in Indonesia R
esearch on Green U
rban Developm
ent
Final R
eport
2-30
Table 2.2.3-1 EE&C Policy in Other Countries
Note: Solar insulation=special glass that cuts sunlight (heat); (Low-e glass), A/C S= A/C Split; A/C P= A/C Package, Source: Compiled by JICA Study Team CAC: Central America and Caribbean
No regulation Introducing Labelling/ Performance Standards (MEPS/HEPS etc.)
EE&C equipment and PV
Office buildings Households (HH) Solar insulation A/C
S or P A/C chiller PV HH A/C HH refrigerator HH refrigerator
Income tax reduction Many CAC countries
Thailand Malaysia Vietnam
Malaysia Thailand Vietnam
Thailand Malaysia Vietnam
Thailand Malaysia Thailand Vietnam
Malaysia Thailand Vietnam
Thailand
VAT reduction Vietnam
(exemption)
Malaysia Vietnam
(exemption)
Vietnam (exemption)
Vietnam (exemption) Malaysia Malaysia
Import tax reduction Many CAC countries
Thailand (exemption)
Vietnam
Thailand (exemption)
Vietnam
Thailand (exemption)
Vietnam
Thailand (exemption)
Vietnam Malaysia Malaysia
Accelerated depreciation (Investment Tax Allowance for Malaysia)
Japan Malaysia
Japan Malaysia
Japan Malaysia Malaysia Malaysia
Low interest rates for bank loan
Japan Malaysia Thailand
Japan Malaysia Thailand
Japan Malaysia Thailand
Thailand
Equity/Capital investment assistance
Thailand Vietnam
Japan
Thailand Vietnam
Japan
Thailand Vietnam
Japan
Thailand Vietnam
Loan guarantee Thailand
Vietnam Thailand Vietnam
Thailand Vietnam
Thailand Vietnam
Subsidies (incl. rebate) Thailand
Vietnam Thailand Vietnam
Thailand Vietnam
Thailand Vietnam
Japan Malaysia Thailand
Japan Malaysia Thailand

Technical Cooperation Project for Capacity Development for Green Economy Policy in Indonesia Research on Green Urban Development
Proposal of Fiscal and Financial Incentives to Promote EE&C 2.3
Based on other countries experiences and Indonesian present condition, the following fiscal and financial incentive programs to promote EE&C are proposed. It will be possible to mitigate the government’s burden ultimately by implementing the incentive policies considering the mid to long term incentive, as well. Table 2.3-1 illustrates the roadmap including short to mid-long term.
In order to promote the energy efficiency in public sector, the service by ESCO should be considered to mitigate the government’s fiscal burden. Like “Environment consideration contract law” (Kankyo Hairyo Keiyaku Hou), enacted in 2000 by Japanaese government, ESCO service over several years is made available in public sector by having the mechanism to facilitate environment-friendly goods and services’ procurement by government agencies and state-owned companies. At the same time, consideration of the incentive, in which energy cost reduction is valued, is essential by introducing ESCO service.
In mid to long term, the effects by ESCO’s promotion policy and introduction of feed-in-tariff (FIT) to PV in offices can be expected. In addition, in Indonesia, the regulation to convert refrigerant from existing R22 to R32 (Hydro Fluoro Carbon), whose Global Warming Potential and Ozone Depletion Potential is less, will be effective from 2015. Therefore, by providing the subsidies to promote HFC’s introduction, its introduction can be promoted by mitigating the shocks by conversion.
The proposed incentives in office buildings and households are described in the following section.
Final Report 2-31

Technical Cooperation Project for Capacity D
evelopment for G
reen Econom
y Policy in Indonesia R
esearch on Green U
rban Developm
ent
Final R
eport 2-32
Table 2.3-1 Proposed Incentive by Sector & Equipment
Target Bldg. Target Tech SectorShort-term
(Most recommended approach for bothexisting/new buildings)
Mid-term Long-term
Public:Gov't/State-
OwnedAwareness Raising about EEC
Change the government's budget from thesingle year basis to multiple year basis.(Revision of law is necessary)
Private:Listed/Non-Listed/SME
Listed: Promotion of leaseNon-Listed/SME: Eco-lease (Subsidy tolease)All: VAT exemption, Awareness raisingabout EEC
A/C (chiller) All
Listed: (i) Promotion of lease,(ii) Low Interest LoanNon-Listed: (i) Low Interest Loan, (ii)Guarantee
Solar insulation All(i) VAT reduction (or exemption)(ii) Awareness Raising
PVs All(i) Promotion of lease(ii) Low interest loan
Green Building All Land/building tax reduction/exemption
A/C (split) All VAT reduction
Refrigerator All VAT reduction
A/C (split, package)
Households
Officebuildings
"Sustainable Financing"Voluntary action by FI(Portfolio allocation to
sustainable finance)
Rebate to promote CFC collection
Combined with awareness raising campaign about electricity bill reduction from EE appliances
ESCO
FIT for solar power generation at office buildings

Technical Cooperation Project for Capacity Development for Green Economy Policy in Indonesia Research on Green Urban Development
2.3.1 Office Buildings
(1) AC (split)
1) Criteria for incentive
Inverter air conditioners are to be the target of incentive mechanism.
Reason:As mentioned before, in order to reduce electricity consumption, it is a world-wide trend to introduce inverter technology for air conditioner. Ths retios of inverter air conditioners in Japan, Singapore, Vietnam and Malaysis are 100%, 80%,30% and 30% respectively. On the other hand, that of Indonesia remains only 5% and is decreasing. (See Table 2.3.1-1)
Table 2.3.1-1 Inverter Ration by Country
Country Inverter ratio(%) Japan 100
Singapore 78 China 50
Vietnam 30 Malaysia (30)
Indonesia 5 Source: GfK (2014), As for Malaysia; JICA Team estimation
Besides in the field test, which was conducted in BPPT office from 2010 to 2011, the throughout electricity consumption of inverter ACs was 20% less than that of non-inverter type. Figue 2.3.1-1 shows the comparison of operation pattern between inverter and non-inverter Acs. Figure 2.3.1-2 shows the field test result of Inverter and Non-inverter ACs in BPPT Office throughout a year.
Figure 2.3.1-1 Comparson of Operation Pattern between Inverter and Non-inverter Air Conditioners
Final Report 2-33
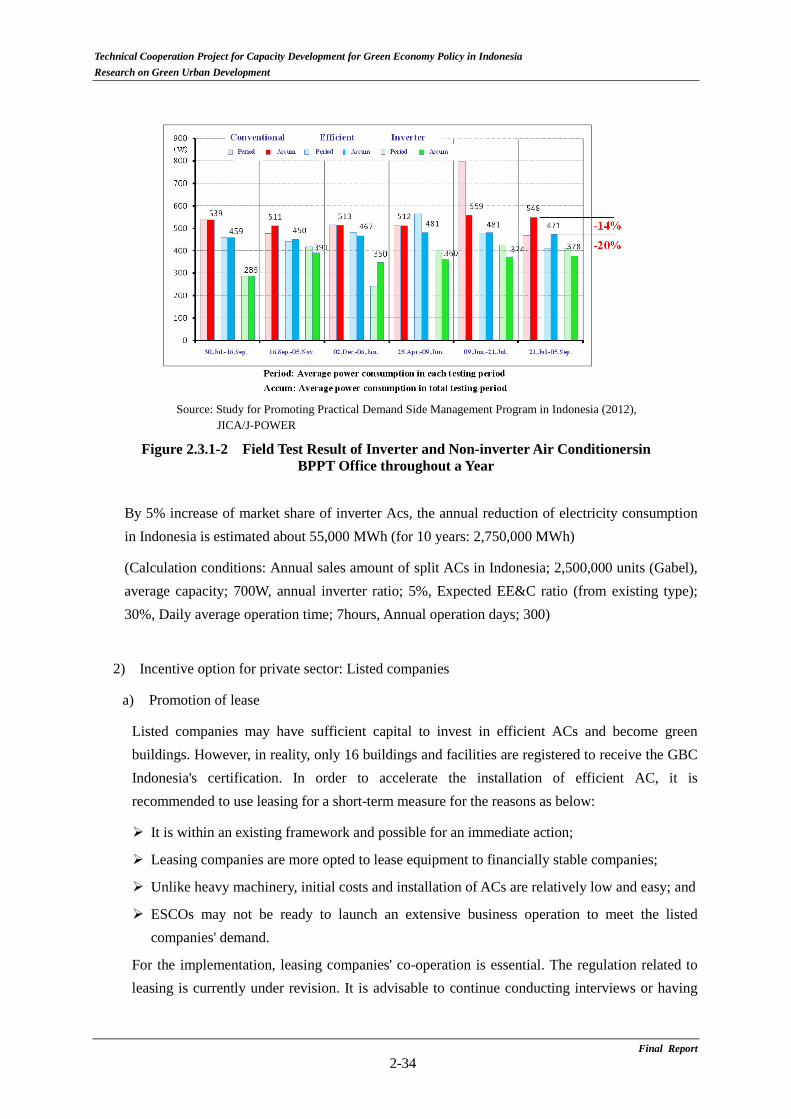
Technical Cooperation Project for Capacity Development for Green Economy Policy in Indonesia Research on Green Urban Development
Source: Study for Promoting Practical Demand Side Management Program in Indonesia (2012),
JICA/J-POWER
Figure 2.3.1-2 Field Test Result of Inverter and Non-inverter Air Conditionersin BPPT Office throughout a Year
By 5% increase of market share of inverter Acs, the annual reduction of electricity consumption in Indonesia is estimated about 55,000 MWh (for 10 years: 2,750,000 MWh)
(Calculation conditions: Annual sales amount of split ACs in Indonesia; 2,500,000 units (Gabel), average capacity; 700W, annual inverter ratio; 5%, Expected EE&C ratio (from existing type); 30%, Daily average operation time; 7hours, Annual operation days; 300)
2) Incentive option for private sector: Listed companies
a) Promotion of lease
Listed companies may have sufficient capital to invest in efficient ACs and become green buildings. However, in reality, only 16 buildings and facilities are registered to receive the GBC Indonesia's certification. In order to accelerate the installation of efficient AC, it is recommended to use leasing for a short-term measure for the reasons as below:
It is within an existing framework and possible for an immediate action;
Leasing companies are more opted to lease equipment to financially stable companies;
Unlike heavy machinery, initial costs and installation of ACs are relatively low and easy; and
ESCOs may not be ready to launch an extensive business operation to meet the listed companies' demand.
For the implementation, leasing companies' co-operation is essential. The regulation related to leasing is currently under revision. It is advisable to continue conducting interviews or having
Final Report 2-34

Technical Cooperation Project for Capacity Development for Green Economy Policy in Indonesia Research on Green Urban Development
discussion with leasing companies or association to develop the incentive scheme for the EE&C equipment.
b) VAT reduction
The advantage of VAT reduction scheme is that the transaction cost is relatively low compared to the rebates. As the cons, according to the media, it is not necessary that all shops are registered to file the tax (The registered shop is called “PKP/Pengusaha Kena Pajak”). Thus, if the products are sold without VAT at non PKP before implementing the incentive, the effectiveness of the incentive will be jeopardized. One of the alternatives could be to provide tax incentives to manufactures like Malaysian case. Also, VAT exemption was adopted in 2010 in Indonesia to promote LP gas equipment replacement. Therefore, the outcome of this initiative could be the lessons to implement this approach.
c) Summary and cost benefit analysis
The comparison of incentives for sprit ACs in listed companies is summarized inTable 2.3.1-2. As for AC (split) the same incentives are recommended for existing/new buildings. As for “Net benefit”, all sectors are included in the estimation.
Final Report 2-35
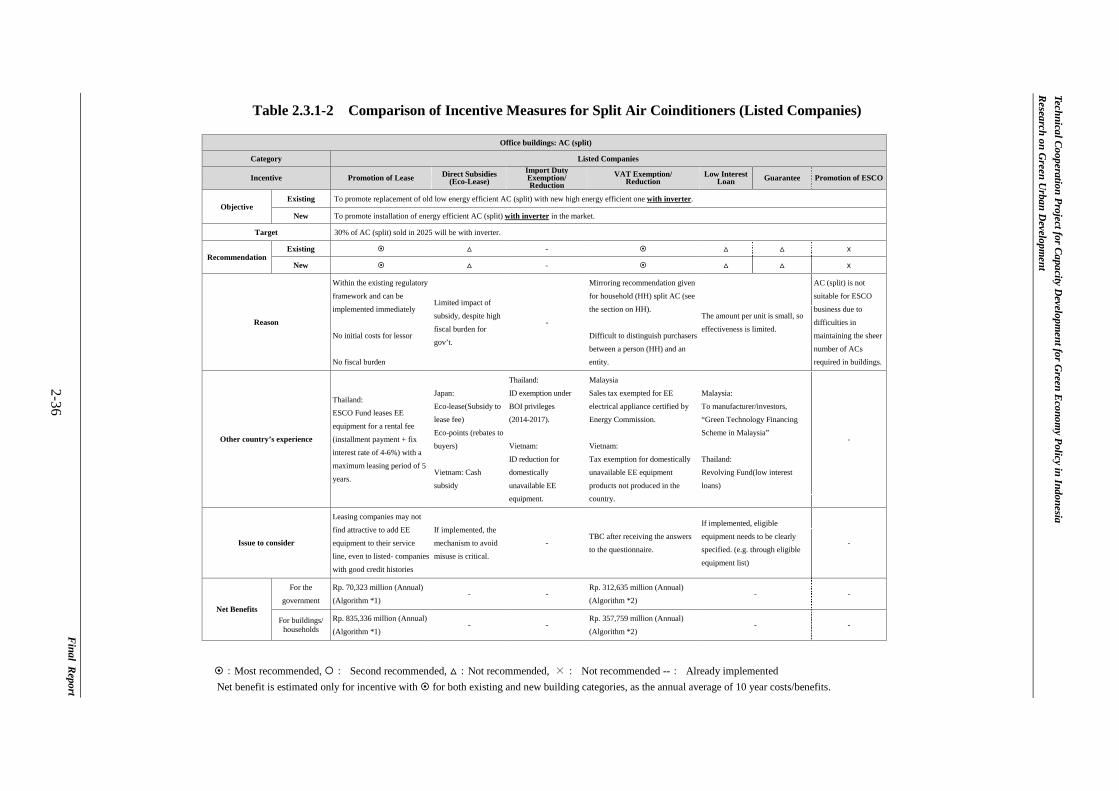
Technical Cooperation Project for Capacity D
evelopment for G
reen Econom
y Policy in Indonesia R
esearch on Green U
rban Developm
ent
Final R
eport 2-36
Table 2.3.1-2 Comparison of Incentive Measures for Split Air Coinditioners (Listed Companies)
:Most recommended, : Second recommended, :Not recommended, ×: Not recommended --: Already implemented Net benefit is estimated only for incentive with for both existing and new building categories, as the annual average of 10 year costs/benefits.
Office buildings: AC (split)
Category Listed Companies
Incentive Promotion of Lease Direct Subsidies (Eco-Lease)
Import Duty Exemption/ Reduction
VAT Exemption/ Reduction
Low Interest Loan Guarantee Promotion of ESCO
Objective Existing To promote replacement of old low energy efficient AC (split) with new high energy efficient one with inverter.
New To promote installation of energy efficient AC (split) with inverter in the market.
Target 30% of AC (split) sold in 2025 will be with inverter.
Recommendation Existing - x
New - x
Reason
Within the existing regulatory
framework and can be
implemented immediately
No initial costs for lessor
No fiscal burden
Limited impact of
subsidy, despite high
fiscal burden for
gov’t.
-
Mirroring recommendation given
for household (HH) split AC (see
the section on HH).
Difficult to distinguish purchasers
between a person (HH) and an
entity.
The amount per unit is small, so
effectiveness is limited.
AC (split) is not
suitable for ESCO
business due to
difficulties in
maintaining the sheer
number of ACs
required in buildings.
Other country’s experience
Thailand:
ESCO Fund leases EE
equipment for a rental fee
(installment payment + fix
interest rate of 4-6%) with a
maximum leasing period of 5
years.
Japan:
Eco-lease(Subsidy to
lease fee)
Eco-points (rebates to
buyers)
Vietnam: Cash
subsidy
Thailand:
ID exemption under
BOI privileges
(2014-2017).
Vietnam:
ID reduction for
domestically
unavailable EE
equipment.
Malaysia
Sales tax exempted for EE
electrical appliance certified by
Energy Commission.
Vietnam:
Tax exemption for domestically
unavailable EE equipment
products not produced in the
country.
Malaysia:
To manufacturer/investors,
“Green Technology Financing
Scheme in Malaysia”
Thailand:
Revolving Fund(low interest
loans)
-
Issue to consider
Leasing companies may not
find attractive to add EE
equipment to their service
line, even to listed- companies
with good credit histories
If implemented, the
mechanism to avoid
misuse is critical.
- TBC after receiving the answers
to the questionnaire.
If implemented, eligible
equipment needs to be clearly
specified. (e.g. through eligible
equipment list)
-
Net Benefits
For the
government
Rp. 70,323 million (Annual)
(Algorithm *1) - -
Rp. 312,635 million (Annual)
(Algorithm *2) - -
For buildings/ households
Rp. 835,336 million (Annual)
(Algorithm *1) - -
Rp. 357,759 million (Annual)
(Algorithm *2) - -
Technical Cooperation Project for Capacity Development for Green Economy Policy in Indonesia Research on Green Urban Development
(Conditions for calculation)
General assumption for AC (split)
Incentives given for 5 years (2016-2020); # of inverter ACs/total # of AC sold = 5% in 2016 => expanding to 30% in 2025 (Conversion ratio to inverter AC: average till 2025, 12.5% (excluding BAU), average till 2020 (over incentive period), 10.56%) 2.5 million units sold/year (based on actual), Operating hours: 7 hours/day, Operating days: 300 days/year AC’s Electric capacity (Average): 700W, Energy saving by conversion to AC with invertors: 30%, Price for AC with invertors: Rp. 3.5 million, Price difference between with/without invertors: Rp. 1 million/unit, Maintenance over 10 years: 15% of investment *1 Promotion of lease Assumption Electricity subsidy (Average) Rp. 102 /kWh, Average electricity tariff: Rp. 1,333 /kWh Cost of fund: 10%, Leasing fee: cost of fund (10%) + O&M costs (1.5%) + fee (3.5%), full-payout option of 5 years, corporate tax (25%) is considered as deductible expenses of 25% Government Benefits (Annual) = [Average energy saving (Annual)] * [Electricity Subsidy]
[2.5 million units*12.5%* 10 years*0.7 kW*30%*7 hours*300 days/year* 10 years/2/10years]* 102 Rp. /kWh=Rp. 70,323 million/year
Costs (Annual) Assumed to be zero
Net benefit (Annual) Rp. 70,323 million – Rp. 0 = Rp. 70,323 million
Buildings Benefits (Annual) = [Average energy saving] * [Electricity tariff] + [Tax benefit for lease]
(2.5 million units*12.5%*10 years*0.7 kW*30%*7 hours*300 days/year *10 years/2/10 years*Rp. 1,200 /kWh) + ((2.5 million units*17.5%*10 years*Rp. 1.1 million*25%)*5 years/10 years) = Rp. 1,348,065 million/year
Costs (Annual)
Equipment cost [2,500,000 unit ∗ 12.5% ∗ Rp. 1.1 million] + Payment for the interest𝑖𝑖 /10 years 10
𝑖𝑖=1
= Rp. 512,730 million/year Net benefit (Annual)
Rp. 1, 1,348,065 million– Rp. 512,730 million=Rp. 835,336 million *2 VAT Exemption (Including all types of companies and households) Assumption Electricity subsidy Rp. 521/kWh, Average electricity tariff: Rp. 974/kWh (Weighted average of R-class and B-class) Government Benefits (Annual) = [Average energy saving (Annual)] * [Electricity Subsidy]
[2,500,000 units*12.5%*10 years*0.7 kW*30%*7 hours*300 days*10 years/2/10]*Rp. 521 /kWh=Rp. 358,815 million
Costs (Annual) : Tax revenue decrease from “VAT reduction(10%)” = ([Number of equipment over incentive period]*[unit price]*[VAT rate])/10 years (2,500,000 units*10.56%*5 years*Rp. 3.5 million*10%)/10years=Rp. 46,181 million
Final Report 2-37
Technical Cooperation Project for Capacity Development for Green Economy Policy in Indonesia Research on Green Urban Development
Net benefit (Annual)
Rp. 358,815 million – Rp. 46,181 million=Rp. 312,635 million Buildings/households Benefits (Annual) = [Electricity cost reduction]+[VAT reduction] = [Average energy saving (Annual)] *
[Electricity tariff] + ([Number of equipment over incentive period]*[unit price]*[VAT rate])/10 years [2.5 million units*12.5%*10 years *0.7 kW*30%*7 hrs*300 d ays *10/2/10 years]*Rp. 974 /kWh + Rp. 46,181 million =Rp. 717,134 million
Costs (Annual) (Investment & maintenance cost) = [[Accumulated numbers of equipment over 10 years]*[price increase]*1.15] / Useful life of AC (2.5 million units*12.5%*10 years*Rp. 1 million)*1.15/10=Rp. 359,375 million
Net benefit (Annual) Rp. 717,134 million – Rp. 359,375 million=Rp. 357,759 million
Final Report 2-38

Technical Cooperation Project for Capacity Development for Green Economy Policy in Indonesia Research on Green Urban Development
3) Incentive option to private sector: Non-listed companies and SME
a) Eco-lease
Unlike listed companies, non-listed companies and SMEs may not have sufficient capital to invest in efficient ACs. Leasing can be also a solution to this problem. In order to motivate non-listed companies and SMEs, Eco-lease scheme provided by the Japanese government9 may be adopted to fit in to the Indonesian business culture. Under Eco-Lease, the government partially subsidizes lease fees for selected EE&C equipment. Eco-lease has following advantages:
One of the fastest ways to install new ACs;
Financial solutions, especially for cash-strapped companies; and
Leasing fees can be set to an attractive level;
The possible issue may be failure in having sufficient interest and participation from the leasing companies. In a long-run, leasing companies are subject to OJK's sustainable financing; however, they may need another motivation or incentive to join the Eco-lease program.
b) VAT reduction
The same as 2) b) above
c) Awareness raising
It is critical to have a series of awareness raising activities in order to promote different options for financial assistance. Those activities may include consultation meetings to assist individual projects in preparing necessary documentations for application of each incentive scheme. If Eco-lease is to be introduced, intensive workshops are required for leasing companies, especially for administrative works related to Eco-lease. A help desk may be useful for VAT reduction and lease providers for questions related to the dministrative work.
d) Summary and cost benefit analysis
The comparison of incentives for sprit ACs in non-listed companies is summarized in Table 2.3.1-3. As for AC (split), the same incentives are recommended for both of existing and new buildings. As for “Net benefit”, all sectors are included in estimation,
9 Ministry of Environment, Subsidy project "Subsidy to promote eco-lease for households/corporations", http://www.jaesco.or.jp/ecolease-promotion/
Final Report 2-39
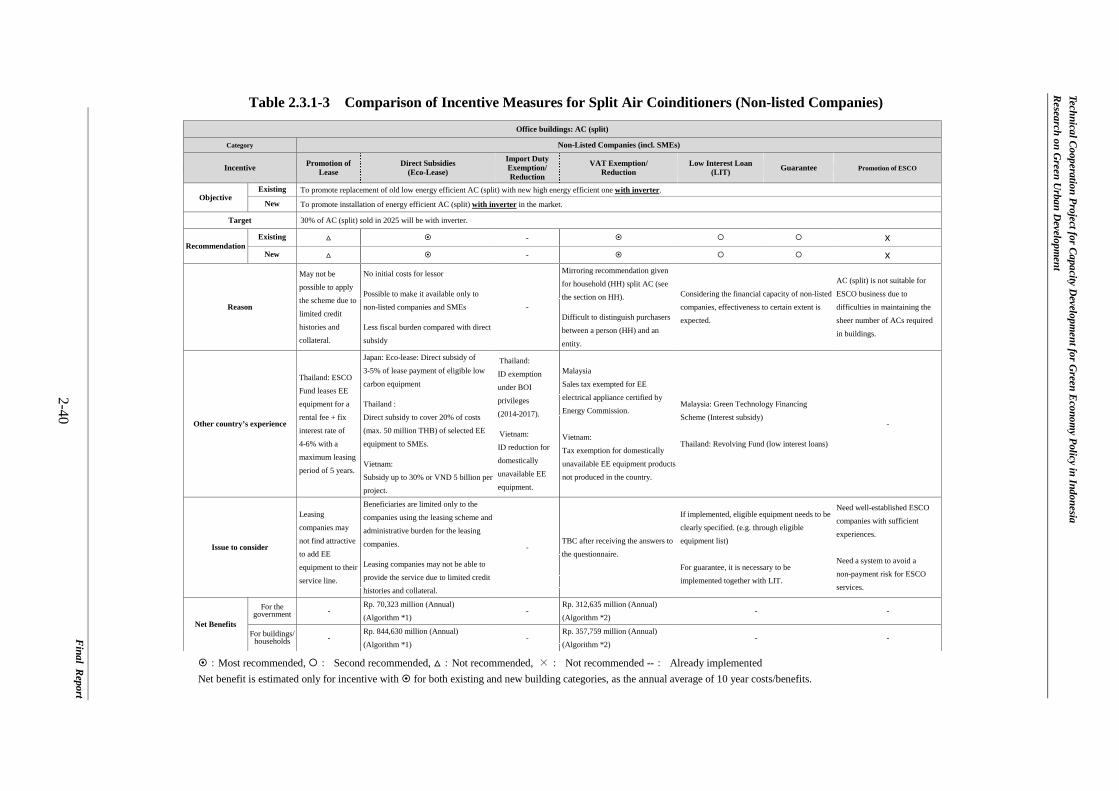
Technical Cooperation Project for Capacity D
evelopment for G
reen Econom
y Policy in Indonesia R
esearch on Green U
rban Developm
ent
Final R
eport 2-40
Table 2.3.1-3 Comparison of Incentive Measures for Split Air Coinditioners (Non-listed Companies)
:Most recommended, : Second recommended, :Not recommended, ×: Not recommended --: Already implemented Net benefit is estimated only for incentive with for both existing and new building categories, as the annual average of 10 year costs/benefits.
Office buildings: AC (split)
Category Non-Listed Companies (incl. SMEs)
Incentive Promotion of Lease
Direct Subsidies (Eco-Lease)
Import Duty Exemption/ Reduction
VAT Exemption/ Reduction
Low Interest Loan (LIT) Guarantee Promotion of ESCO
Objective Existing To promote replacement of old low energy efficient AC (split) with new high energy efficient one with inverter.
New To promote installation of energy efficient AC (split) with inverter in the market.
Target 30% of AC (split) sold in 2025 will be with inverter.
Recommendation Existing - x
New - x
Reason
May not be
possible to apply
the scheme due to
limited credit
histories and
collateral.
No initial costs for lessor Possible to make it available only to
non-listed companies and SMEs Less fiscal burden compared with direct
subsidy
-
Mirroring recommendation given
for household (HH) split AC (see
the section on HH). Difficult to distinguish purchasers
between a person (HH) and an
entity.
Considering the financial capacity of non-listed
companies, effectiveness to certain extent is
expected.
AC (split) is not suitable for
ESCO business due to
difficulties in maintaining the
sheer number of ACs required
in buildings.
Other country’s experience
Thailand: ESCO
Fund leases EE
equipment for a
rental fee + fix
interest rate of
4-6% with a
maximum leasing
period of 5 years.
Japan: Eco-lease: Direct subsidy of
3-5% of lease payment of eligible low
carbon equipment Thailand :
Direct subsidy to cover 20% of costs
(max. 50 million THB) of selected EE
equipment to SMEs. Vietnam:
Subsidy up to 30% or VND 5 billion per
project.
Thailand:
ID exemption
under BOI
privileges
(2014-2017). Vietnam:
ID reduction for
domestically
unavailable EE
equipment.
Malaysia
Sales tax exempted for EE
electrical appliance certified by
Energy Commission.
Vietnam:
Tax exemption for domestically
unavailable EE equipment products
not produced in the country.
Malaysia: Green Technology Financing
Scheme (Interest subsidy)
Thailand: Revolving Fund (low interest loans)
-
Issue to consider
Leasing
companies may
not find attractive
to add EE
equipment to their
service line.
Beneficiaries are limited only to the
companies using the leasing scheme and
administrative burden for the leasing
companies. Leasing companies may not be able to
provide the service due to limited credit
histories and collateral.
- TBC after receiving the answers to
the questionnaire.
If implemented, eligible equipment needs to be
clearly specified. (e.g. through eligible
equipment list)
For guarantee, it is necessary to be
implemented together with LIT.
Need well-established ESCO
companies with sufficient
experiences.
Need a system to avoid a
non-payment risk for ESCO
services.
Net Benefits
For the government -
Rp. 70,323 million (Annual)
(Algorithm *1) -
Rp. 312,635 million (Annual)
(Algorithm *2) - -
For buildings/ households -
Rp. 844,630 million (Annual)
(Algorithm *1) -
Rp. 357,759 million (Annual)
(Algorithm *2) - -
Technical Cooperation Project for Capacity Development for Green Economy Policy in Indonesia Research on Green Urban Development
(Conditions for calculation)
General assumption for AC (split)
Incentives given for 5 years (2016-2020); # of inverter ACs/total # of AC sold = 5% in 2016 => expanding to 30% in 2025 (Conversion ratio to inverter AC: average till 2025, 17.5%, average till 2020, 10.56%) 2.5 million units sold/year (based on actual), Operating hrs: 7 hours/day, Operating days: 300 days/year AC’s Electric capacity (Average): 700W, Energy saving by conversion to AC with invertors: 30%, Price for AC with invertors: Rp. 3.5 million, Price difference between with/without invertors: Rp. 1 million/unit, Maintenance over 10 years: 15% of investment *1 Eco-lease Assumption Electricity subsidy (Average) Rp. 102/kWh, Average electricity tariff: Rp. 1333/kWh (Weighted average of B-2 and B-3) Cost of fund: 10%, Leasing fee: cost of fund (10%) + O&M costs (1.5%) + fee (3.5%) - subsidy (3.5%), full-payout option of 5 years, corporate tax (25%) is considered as deductible expenses of 25% Government Benefits (Annual) = [Average energy saving (Annual)] * [Electricity Subsidy]
[2.5 million units*12.5%*0.7 kW*10 years *30%*7 hours*300 days/year*10 years/2/10 years]*102 /kWh=Rp. 70,323 million/year
Costs (Annual) = [number of equipment unit over incentive period*unit price*subsidized rate]/10 years Assumed to be zero
Net benefit (Annual) Rp. 70,323 million – Rp. 0 = Rp. 70,323 million
Buildings Benefits (Annual) = [Electricity cost reduction]+[subsidy] = [Average energy saving (Annual)] *
[Electricity tariff] + ([Number of equipment over incentive period]*[unit price]*[VAT rate])/10 years (2.5 million units*12.5%*10 years*0.7 kW*30%*7 hours*300 days/yr*10 years/2/10 years *Rp. 1,200 /kWh*) + ((2.5 million units*12.5%*10 years*Rp. 1.1 million*25%)*5 years/10 years) = Rp. 1,348,065 million/year
Costs (Annual)
Equipment cost[2,500,000 unit ∗ 12.5% ∗ Rp. 1.1 million] 10
𝑖𝑖=1
+ Payment for the interest with Subsidy of 3.5% discount𝑖𝑖 /10 years = Rp. 503,436 million/year
Net benefit (Annual) Rp. 1,348,065 million – Rp. 503,436 million=Rp. 844,630 million
*2 VAT Exemption (Including all types of companies and households) Assumption Electricity subsidy Rp. 521 /kWh, Average electricity tariff: Rp. 974 /kWh (Weighted average of R-class and B-class) Government Benefits (Annual) = [Average energy saving (Annual)] * [Electricity Subsidy]
[2,500,000 units*12.5%*10 years*0.7 kW*30%*7 hours*300 days*10/2/10 years]*Rp. 521 /kWh=Rp. 358,815 million
Final Report 2-41
Technical Cooperation Project for Capacity Development for Green Economy Policy in Indonesia Research on Green Urban Development
Costs (Annual): Tax revenue decrease from “VAT reduction(10%)” = ([Number of equipment over
incentive period]*[unit price]*[VAT rate])/10 years ([2,500,000 units*10.56%*5 years]*Rp. 3.5 million*10%)/10 years=Rp. 46,181 million
Net benefit (Annual) Rp. 358,815 million – Rp. 46,181 million=Rp. 312,635 million
Buildings/households Benefits (Annual) = [Electricity cost reduction]+[VAT reduction] = [Average energy saving (Annual)] *
[Electricity tariff] + ([Number of equipment over incentive period]*[unit price]*[VAT rate])/10 years ([2.5million units*12.5%*10 years *0.7 kW*30%*7 hours*300 days*10/2/10 year]*Rp. 974 /kWh) + Rp. 46,181 million =Rp. 717,134 million
Costs (Annual) (Investment & maintenance cost) = [[Accumulated numbers of equipment over 10 years]*[price increase]*1.15] / Useful life of AC (2.5 million units*12.5%*10 years*Rp. 1 million)*1.15/10=Rp. 359,375 million
Net benefit (Annual) Rp. 717,134 million – Rp. 359,375 million=Rp. 357,759 million
Final Report 2-42
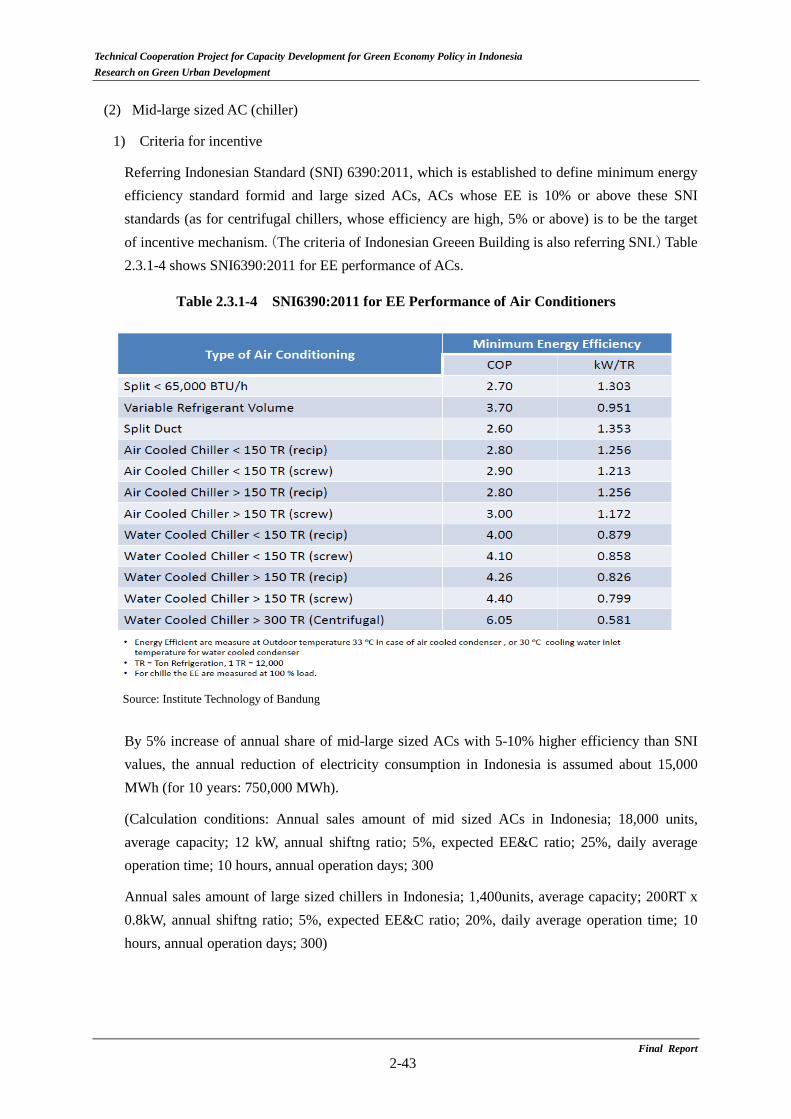
Technical Cooperation Project for Capacity Development for Green Economy Policy in Indonesia Research on Green Urban Development
(2) Mid-large sized AC (chiller)
1) Criteria for incentive
Referring Indonesian Standard (SNI) 6390:2011, which is established to define minimum energy efficiency standard formid and large sized ACs, ACs whose EE is 10% or above these SNI standards (as for centrifugal chillers, whose efficiency are high, 5% or above) is to be the target of incentive mechanism.(The criteria of Indonesian Greeen Building is also referring SNI.)Table 2.3.1-4 shows SNI6390:2011 for EE performance of ACs.
Table 2.3.1-4 SNI6390:2011 for EE Performance of Air Conditioners
Source: Institute Technology of Bandung
By 5% increase of annual share of mid-large sized ACs with 5-10% higher efficiency than SNI values, the annual reduction of electricity consumption in Indonesia is assumed about 15,000 MWh (for 10 years: 750,000 MWh).
(Calculation conditions: Annual sales amount of mid sized ACs in Indonesia; 18,000 units, average capacity; 12 kW, annual shiftng ratio; 5%, expected EE&C ratio; 25%, daily average operation time; 10 hours, annual operation days; 300
Annual sales amount of large sized chillers in Indonesia; 1,400units, average capacity; 200RT x 0.8kW, annual shiftng ratio; 5%, expected EE&C ratio; 20%, daily average operation time; 10 hours, annual operation days; 300)
Final Report 2-43

Technical Cooperation Project for Capacity Development for Green Economy Policy in Indonesia Research on Green Urban Development
2) Incentive option
a) Promotion of lease
The advantages and issues are the same as (1) 2) a) above.
b) Low interest loan
The approach and the pros and cons are the same as AC (split, package). However, in case of AC (chiller), one of the options for the technical assessment can be the assessment by the designated energy auditors or designated institutions like Malaysian case, in addition to “Equipment list”.
c) Guarantee
As described in 2.1, banks in Indonesia require borrowers much collateral to extend the loans, which is one of the hurdles for capital investments in EE&C especially for small companies. On the other hand, if high EE chillers are installed and electricity consumption in buildings is reduced, that will improve profitability of the buildings. Yet, it will be extremely difficult for FIs to consider this future electricity saving as the collateral. To overcome this hurdle related to collateral, the guarantee is one of the options to reduce the collateral requirement. Jaminan Kredit Indonesia (“Jamkrind”) is the public guarantee institution extending credit guarantee to companies and it is worthwhile considering Jamkrind to provide the guarantee to the loans to reduce collateral, in case that the buildings install high energy efficient AC (chiller). Like low interest loan, the “Equipment list” can be the criteria to provide the guarantee. The pros and cons of this scheme are as follows: the pros are less fiscal burden compared to subsidy and utilization of credit appraisal capacity of Jamkrind. The cons are, unless part of loss upon defaults is covered by FIs, there is risk of moral hazard by FIs, i.e. the loans are provided by FIs to the companies, which are not capable to make repayment. (See Figure 2.3.1-3)
Figure 2.3.1-3 Guarantee Program (Draft)
FIs
RepaymentLoans
Guarantee
Premium JamkrindCompanies
Assessment by Equipment List
Final Report 2-44
Technical Cooperation Project for Capacity Development for Green Economy Policy in Indonesia Research on Green Urban Development
d) VAT reduction
The advantages and issues are the same as (1) 2) b) above.
e) Awareness raising
As in the case of split and package ACs, awareness raising activities are essential for reaching out the users. It is also important to have a help desk for loan providers on the equipment list. Consultation meetings and workshops can be organized for all the stakeholders, but assistance for individual projects is necessary for the start-up of the program.
f) Summary and cost benefit analysis
The comparison of incentives for mid-large sized ACs is summarized in Table 2.3.1-5 and 2.3.1-6. Listed and non-listed companies largely differ in financial capacity, so the proposed incentivs are different as below. In case that new buildings introduce ACs and existing buildings exchange ACs, the same incentive is likely to give different impacts on each case. Therefore, incentives for each segment are recommended, respectively.
Final Report 2-45
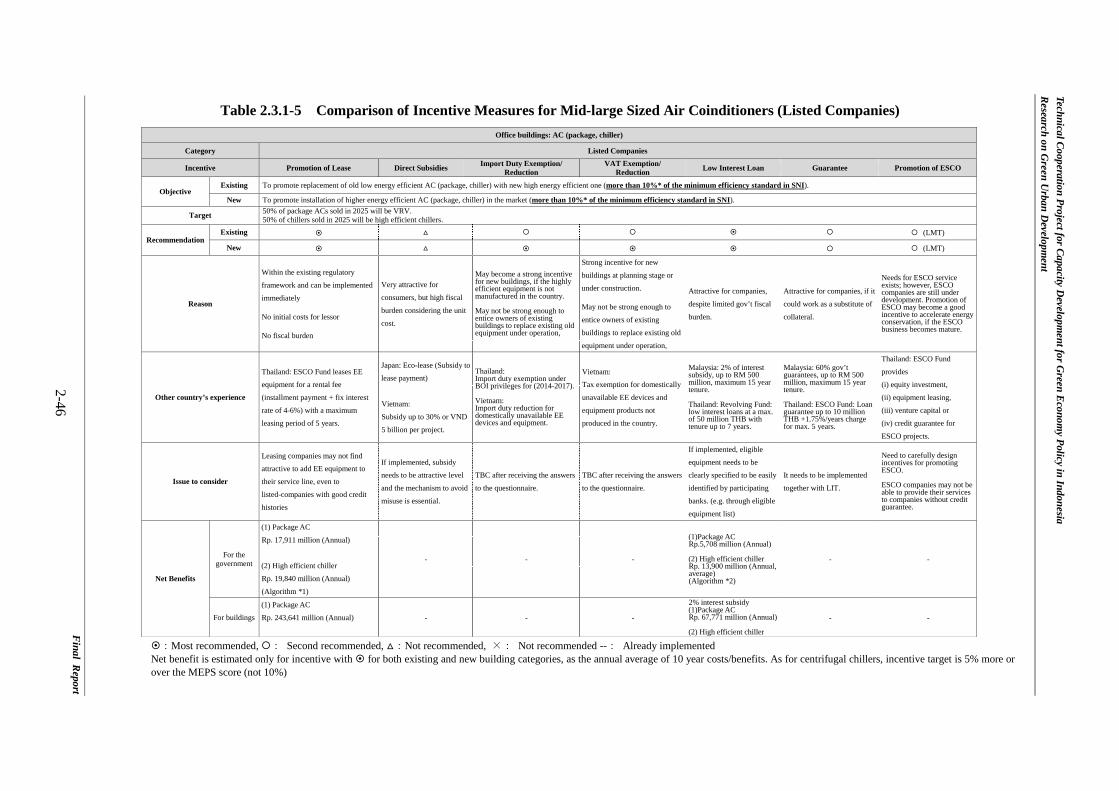
Technical Cooperation Project for Capacity D
evelopment for G
reen Econom
y Policy in Indonesia R
esearch on Green U
rban Developm
ent
Final R
eport 2-46
Table 2.3.1-5 Comparison of Incentive Measures for Mid-large Sized Air Coinditioners (Listed Companies)
:Most recommended, : Second recommended, :Not recommended, ×: Not recommended --: Already implemented Net benefit is estimated only for incentive with for both existing and new building categories, as the annual average of 10 year costs/benefits. As for centrifugal chillers, incentive target is 5% more or over the MEPS score (not 10%)
Office buildings: AC (package, chiller)
Category Listed Companies
Incentive Promotion of Lease Direct Subsidies Import Duty Exemption/ Reduction
VAT Exemption/ Reduction Low Interest Loan Guarantee Promotion of ESCO
Objective Existing To promote replacement of old low energy efficient AC (package, chiller) with new high energy efficient one (more than 10%* of the minimum efficiency standard in SNI).
New To promote installation of higher energy efficient AC (package, chiller) in the market (more than 10%* of the minimum efficiency standard in SNI).
Target 50% of package ACs sold in 2025 will be VRV. 50% of chillers sold in 2025 will be high efficient chillers.
Recommendation Existing (LMT)
New (LMT)
Reason
Within the existing regulatory
framework and can be implemented
immediately No initial costs for lessor No fiscal burden
Very attractive for
consumers, but high fiscal
burden considering the unit
cost.
May become a strong incentive for new buildings, if the highly efficient equipment is not manufactured in the country. May not be strong enough to entice owners of existing buildings to replace existing old equipment under operation,
Strong incentive for new
buildings at planning stage or
under construction. May not be strong enough to
entice owners of existing
buildings to replace existing old
equipment under operation,
Attractive for companies,
despite limited gov’t fiscal
burden.
Attractive for companies, if it
could work as a substitute of
collateral.
Needs for ESCO service exists; however, ESCO companies are still under development. Promotion of ESCO may become a good incentive to accelerate energy conservation, if the ESCO business becomes mature.
Other country’s experience
Thailand: ESCO Fund leases EE
equipment for a rental fee
(installment payment + fix interest
rate of 4-6%) with a maximum
leasing period of 5 years.
Japan: Eco-lease (Subsidy to
lease payment)
Vietnam:
Subsidy up to 30% or VND
5 billion per project.
Thailand: Import duty exemption under BOI privileges for (2014-2017). Vietnam: Import duty reduction for domestically unavailable EE devices and equipment.
Vietnam:
Tax exemption for domestically
unavailable EE devices and
equipment products not
produced in the country.
Malaysia: 2% of interest subsidy, up to RM 500 million, maximum 15 year tenure. Thailand: Revolving Fund: low interest loans at a max. of 50 million THB with tenure up to 7 years.
Malaysia: 60% gov’t guarantees, up to RM 500 million, maximum 15 year tenure. Thailand: ESCO Fund: Loan guarantee up to 10 million THB +1.75%/years charge for max. 5 years.
Thailand: ESCO Fund
provides
(i) equity investment,
(ii) equipment leasing,
(iii) venture capital or
(iv) credit guarantee for
ESCO projects.
Issue to consider
Leasing companies may not find
attractive to add EE equipment to
their service line, even to
listed-companies with good credit
histories
If implemented, subsidy
needs to be attractive level
and the mechanism to avoid
misuse is essential.
TBC after receiving the answers
to the questionnaire.
TBC after receiving the answers
to the questionnaire.
If implemented, eligible
equipment needs to be
clearly specified to be easily
identified by participating
banks. (e.g. through eligible
equipment list)
It needs to be implemented
together with LIT.
Need to carefully design incentives for promoting ESCO. ESCO companies may not be able to provide their services to companies without credit guarantee.
Net Benefits
For the government
(1) Package AC
Rp. 17,911 million (Annual)
(2) High efficient chiller
Rp. 19,840 million (Annual)
(Algorithm *1)
- - -
(1)Package AC Rp.5,708 million (Annual) (2) High efficient chiller Rp. 13,900 million (Annual, average) (Algorithm *2)
- -
For buildings (1) Package AC
Rp. 243,641 million (Annual)
- - -
2% interest subsidy (1)Package AC Rp. 67,771 million (Annual) (2) High efficient chiller
- -
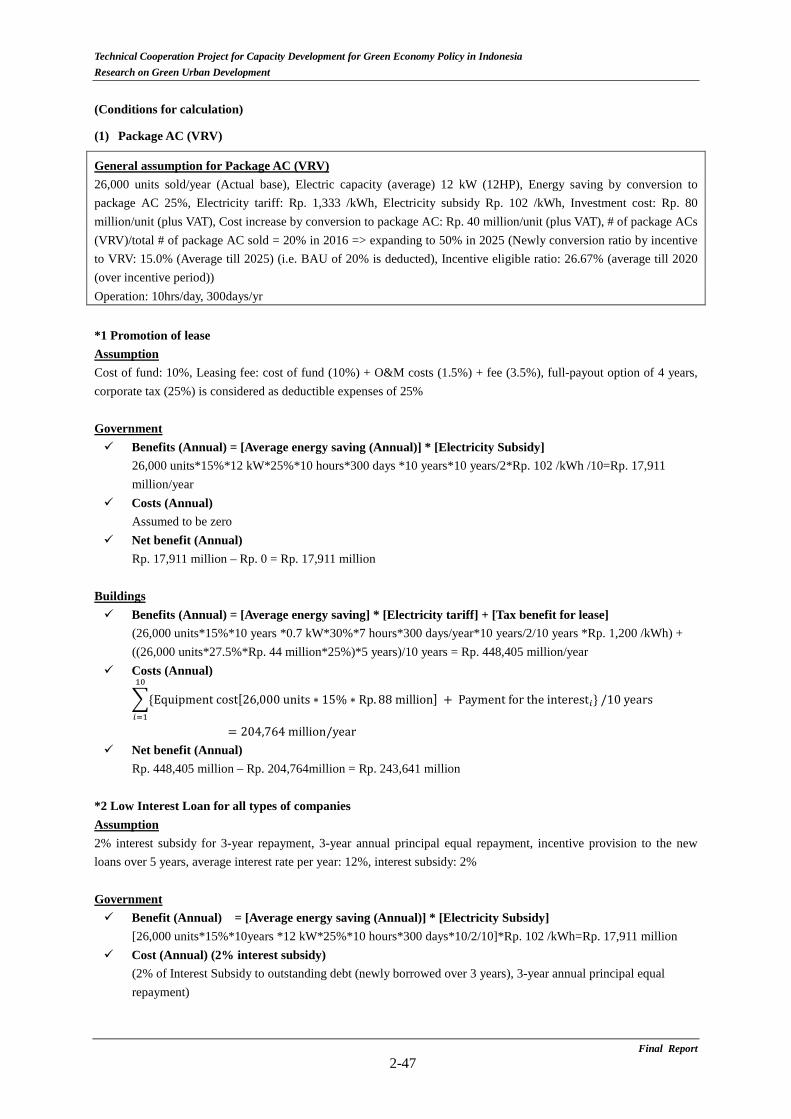
Technical Cooperation Project for Capacity Development for Green Economy Policy in Indonesia Research on Green Urban Development
(Conditions for calculation)
(1) Package AC (VRV)
General assumption for Package AC (VRV) 26,000 units sold/year (Actual base), Electric capacity (average) 12 kW (12HP), Energy saving by conversion to package AC 25%, Electricity tariff: Rp. 1,333 /kWh, Electricity subsidy Rp. 102 /kWh, Investment cost: Rp. 80 million/unit (plus VAT), Cost increase by conversion to package AC: Rp. 40 million/unit (plus VAT), # of package ACs (VRV)/total # of package AC sold = 20% in 2016 => expanding to 50% in 2025 (Newly conversion ratio by incentive to VRV: 15.0% (Average till 2025) (i.e. BAU of 20% is deducted), Incentive eligible ratio: 26.67% (average till 2020 (over incentive period)) Operation: 10hrs/day, 300days/yr *1 Promotion of lease Assumption Cost of fund: 10%, Leasing fee: cost of fund (10%) + O&M costs (1.5%) + fee (3.5%), full-payout option of 4 years, corporate tax (25%) is considered as deductible expenses of 25% Government Benefits (Annual) = [Average energy saving (Annual)] * [Electricity Subsidy]
26,000 units*15%*12 kW*25%*10 hours*300 days *10 years*10 years/2*Rp. 102 /kWh /10=Rp. 17,911 million/year
Costs (Annual) Assumed to be zero
Net benefit (Annual) Rp. 17,911 million – Rp. 0 = Rp. 17,911 million
Buildings Benefits (Annual) = [Average energy saving] * [Electricity tariff] + [Tax benefit for lease]
(26,000 units*15%*10 years *0.7 kW*30%*7 hours*300 days/year*10 years/2/10 years *Rp. 1,200 /kWh) + ((26,000 units*27.5%*Rp. 44 million*25%)*5 years)/10 years = Rp. 448,405 million/year
Costs (Annual)
Equipment cost[26,000 units ∗ 15% ∗ Rp. 88 million] + Payment for the interest𝑖𝑖 /10 years 10
𝑖𝑖=1
= 204,764 million/year Net benefit (Annual)
Rp. 448,405 million – Rp. 204,764million = Rp. 243,641 million *2 Low Interest Loan for all types of companies Assumption 2% interest subsidy for 3-year repayment, 3-year annual principal equal repayment, incentive provision to the new loans over 5 years, average interest rate per year: 12%, interest subsidy: 2% Government Benefit (Annual) = [Average energy saving (Annual)] * [Electricity Subsidy]
[26,000 units*15%*10years *12 kW*25%*10 hours*300 days*10/2/10]*Rp. 102 /kWh=Rp. 17,911 million Cost (Annual) (2% interest subsidy)
(2% of Interest Subsidy to outstanding debt (newly borrowed over 3 years), 3-year annual principal equal repayment)
Final Report 2-47
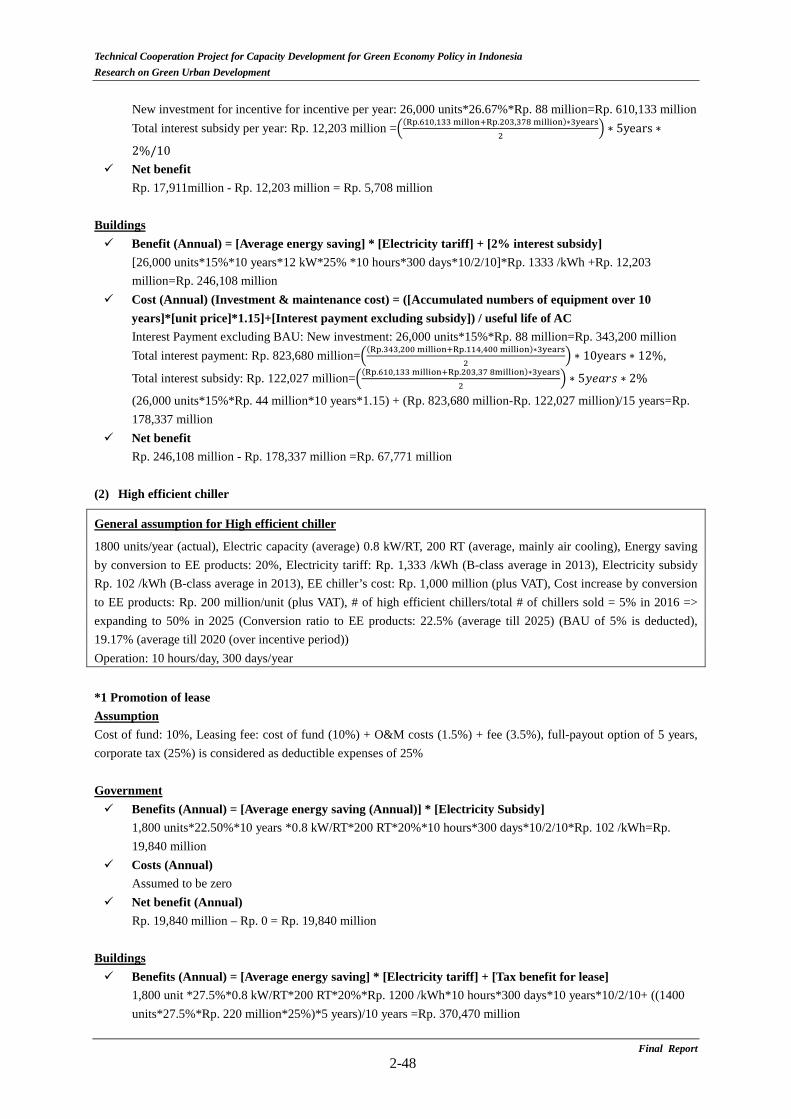
Technical Cooperation Project for Capacity Development for Green Economy Policy in Indonesia Research on Green Urban Development
New investment for incentive for incentive per year: 26,000 units*26.67%*Rp. 88 million=Rp. 610,133 million Total interest subsidy per year: Rp. 12,203 million =(Rp.610,133 millon+Rp.203,378 million)∗3years
2 ∗ 5years ∗
2%/10 Net benefit
Rp. 17,911million - Rp. 12,203 million = Rp. 5,708 million Buildings Benefit (Annual) = [Average energy saving] * [Electricity tariff] + [2% interest subsidy]
[26,000 units*15%*10 years*12 kW*25% *10 hours*300 days*10/2/10]*Rp. 1333 /kWh +Rp. 12,203 million=Rp. 246,108 million
Cost (Annual) (Investment & maintenance cost) = ([Accumulated numbers of equipment over 10 years]*[unit price]*1.15]+[Interest payment excluding subsidy]) / useful life of AC Interest Payment excluding BAU: New investment: 26,000 units*15%*Rp. 88 million=Rp. 343,200 million Total interest payment: Rp. 823,680 million=(Rp.343,200 million+Rp.114,400 million)∗3years
2 ∗ 10years ∗ 12%,
Total interest subsidy: Rp. 122,027 million=(Rp.610,133 million+Rp.203,37 8million)∗3years2
∗ 5𝑦𝑦𝑦𝑦𝑦𝑦𝑦𝑦𝑦𝑦 ∗ 2%
(26,000 units*15%*Rp. 44 million*10 years*1.15) + (Rp. 823,680 million-Rp. 122,027 million)/15 years=Rp. 178,337 million
Net benefit Rp. 246,108 million - Rp. 178,337 million =Rp. 67,771 million
(2) High efficient chiller
General assumption for High efficient chiller
1800 units/year (actual), Electric capacity (average) 0.8 kW/RT, 200 RT (average, mainly air cooling), Energy saving by conversion to EE products: 20%, Electricity tariff: Rp. 1,333 /kWh (B-class average in 2013), Electricity subsidy Rp. 102 /kWh (B-class average in 2013), EE chiller’s cost: Rp. 1,000 million (plus VAT), Cost increase by conversion to EE products: Rp. 200 million/unit (plus VAT), # of high efficient chillers/total # of chillers sold = 5% in 2016 => expanding to 50% in 2025 (Conversion ratio to EE products: 22.5% (average till 2025) (BAU of 5% is deducted), 19.17% (average till 2020 (over incentive period)) Operation: 10 hours/day, 300 days/year *1 Promotion of lease Assumption Cost of fund: 10%, Leasing fee: cost of fund (10%) + O&M costs (1.5%) + fee (3.5%), full-payout option of 5 years, corporate tax (25%) is considered as deductible expenses of 25% Government Benefits (Annual) = [Average energy saving (Annual)] * [Electricity Subsidy]
1,800 units*22.50%*10 years *0.8 kW/RT*200 RT*20%*10 hours*300 days*10/2/10*Rp. 102 /kWh=Rp. 19,840 million
Costs (Annual) Assumed to be zero
Net benefit (Annual) Rp. 19,840 million – Rp. 0 = Rp. 19,840 million
Buildings Benefits (Annual) = [Average energy saving] * [Electricity tariff] + [Tax benefit for lease]
1,800 unit *27.5%*0.8 kW/RT*200 RT*20%*Rp. 1200 /kWh*10 hours*300 days*10 years*10/2/10+ ((1400 units*27.5%*Rp. 220 million*25%)*5 years)/10 years =Rp. 370,470 million
Final Report 2-48

Technical Cooperation Project for Capacity Development for Green Economy Policy in Indonesia Research on Green Urban Development
Costs (Annual)
Equipment cost[1,800 units ∗ 27.5% ∗ Rp. 220 million] + Payment for the interest𝑖𝑖 /10 years 10
𝑖𝑖=1
= Rp. 132,900 million/year Net benefit (Annual)
Rp. 370,470 million – Rp. 132,900 million = Rp. 237,570 million *2 Low Interest Loan for all types of companies Assumption Average interest rate per year: 12%, 2% interest subsidy for 3-year repayment, 3-year annual principal equal repayment, and incentive provision to the new loans over 5 years Government Benefit (Annual) = [Average energy saving (Annual)] * [Electricity Subsidy]
[1,800 units*22.5%*10 years *0.8 kW/RT*200 RT*20%*10 hours*300 days*10/2/10]*Rp. 102 /kWh=Rp. 19,840 million
Cost (Annual) (2% of Interest Subsidy to outstanding debt (newly borrowed over 10 years), 3-year annual principal equal repayment) New investment for incentive per year: 1,800 units*15%*Rp. 1,100 million=Rp. 297,000 million Total interest subsidy (2%): Rp. 5,940 million=(Rp.297,000 million+Rp.99,000 million)∗3years
2 ∗ 5years ∗ 2%/10
Net benefit (Annual, Average) Rp. 19,840 million-Rp. 5,940 million=Rp. 13,900 million
Buildings Benefit (Annual) = [Average energy saving] * [Electricity tariff] + [2% interest subsidy]
[1,800 units*22.5%*10 years*0.8 kW/RT*200 RT*20%*10 hours*300 days*10/2/10]*Rp. 1333 /kWh + Rp. 5,940 million =Rp. 265,035 million
Cost (Annual) = ([Accumulated numbers of equipment over 10 years]*[unit price]*1.15] +[Interest payment excluding subsidy]) / Useful life of chiller Interest Payment excluding BAU: New investment: 1800 units*22.5%*Rp. 1,100 million=Rp. 445,500 million Total interest payment: Rp. 1,069,200 million=(Rp.445,500 million+Rp.148,500 million)∗3years
2 ∗ 10years ∗ 12%,
Total interest subsidy per year: Rp. 59,400 million=(Rp.297,000 million+Rp.99,000 million)∗3years2
∗ 5years ∗ 2%
([1800 units*22.5%*Rp. 220 million*10 years*1.15] + (Rp. 1,069,200 million - Rp. 59,400 million)/15years=Rp. 135,630 million
Net benefit (Annual) Rp. 265,035 million - Rp. 135,630 million = Rp. 129,405 million
Final Report 2-49
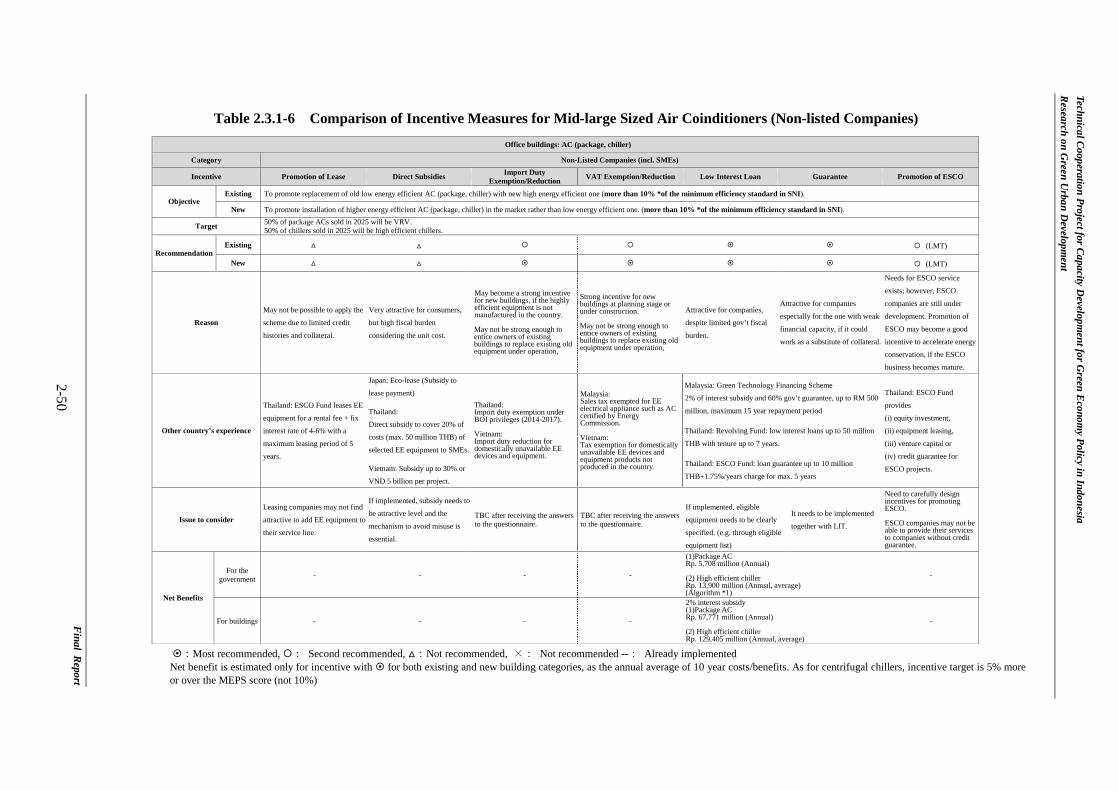
Technical Cooperation Project for Capacity D
evelopment for G
reen Econom
y Policy in Indonesia R
esearch on Green U
rban Developm
ent
Final R
eport 2-50
Table 2.3.1-6 Comparison of Incentive Measures for Mid-large Sized Air Coinditioners (Non-listed Companies)
:Most recommended, : Second recommended, :Not recommended, ×: Not recommended --: Already implemented
Net benefit is estimated only for incentive with for both existing and new building categories, as the annual average of 10 year costs/benefits. As for centrifugal chillers, incentive target is 5% more or over the MEPS score (not 10%)
Office buildings: AC (package, chiller)
Category Non-Listed Companies (incl. SMEs)
Incentive Promotion of Lease Direct Subsidies Import Duty Exemption/Reduction VAT Exemption/Reduction Low Interest Loan Guarantee Promotion of ESCO
Objective Existing To promote replacement of old low energy efficient AC (package, chiller) with new high energy efficient one (more than 10% *of the minimum efficiency standard in SNI).
New To promote installation of higher energy efficient AC (package, chiller) in the market rather than low energy efficient one. (more than 10% *of the minimum efficiency standard in SNI).
Target 50% of package ACs sold in 2025 will be VRV. 50% of chillers sold in 2025 will be high efficient chillers.
Recommendation Existing (LMT)
New (LMT)
Reason May not be possible to apply the
scheme due to limited credit
histories and collateral.
Very attractive for consumers,
but high fiscal burden
considering the unit cost.
May become a strong incentive for new buildings, if the highly efficient equipment is not manufactured in the country. May not be strong enough to entice owners of existing buildings to replace existing old equipment under operation,
Strong incentive for new buildings at planning stage or under construction. May not be strong enough to entice owners of existing buildings to replace existing old equipment under operation,
Attractive for companies,
despite limited gov’t fiscal
burden.
Attractive for companies
especially for the one with weak
financial capacity, if it could
work as a substitute of collateral.
Needs for ESCO service
exists; however, ESCO
companies are still under
development. Promotion of
ESCO may become a good
incentive to accelerate energy
conservation, if the ESCO
business becomes mature.
Other country’s experience
Thailand: ESCO Fund leases EE
equipment for a rental fee + fix
interest rate of 4-6% with a
maximum leasing period of 5
years.
Japan: Eco-lease (Subsidy to
lease payment) Thailand:
Direct subsidy to cover 20% of
costs (max. 50 million THB) of
selected EE equipment to SMEs. Vietnam: Subsidy up to 30% or
VND 5 billion per project.
Thailand: Import duty exemption under BOI privileges (2014-2017). Vietnam: Import duty reduction for domestically unavailable EE devices and equipment.
Malaysia: Sales tax exempted for EE electrical appliance such as AC certified by Energy Commission. Vietnam: Tax exemption for domestically unavailable EE devices and equipment products not produced in the country.
Malaysia: Green Technology Financing Scheme
2% of interest subsidy and 60% gov’t guarantee, up to RM 500
million, maximum 15 year repayment period Thailand: Revolving Fund: low interest loans up to 50 million
THB with tenure up to 7 years. Thailand: ESCO Fund: loan guarantee up to 10 million
THB+1.75%/years charge for max. 5 years
Thailand: ESCO Fund
provides
(i) equity investment,
(ii) equipment leasing,
(iii) venture capital or
(iv) credit guarantee for
ESCO projects.
Issue to consider Leasing companies may not find
attractive to add EE equipment to
their service line.
If implemented, subsidy needs to
be attractive level and the
mechanism to avoid misuse is
essential.
TBC after receiving the answers to the questionnaire.
TBC after receiving the answers to the questionnaire.
If implemented, eligible
equipment needs to be clearly
specified. (e.g. through eligible
equipment list)
It needs to be implemented
together with LIT.
Need to carefully design incentives for promoting ESCO. ESCO companies may not be able to provide their services to companies without credit guarantee.
Net Benefits
For the government - - - -
(1)Package AC Rp. 5,708 million (Annual) (2) High efficient chiller Rp. 13,900 million (Annual, average) (Algorithm *1)
-
For buildings - - - -
2% interest subsidy (1)Package AC Rp. 67,771 million (Annual) (2) High efficient chiller Rp. 129,405 million (Annual, average)
-

Technical Cooperation Project for Capacity Development for Green Economy Policy in Indonesia Research on Green Urban Development
(Conditions for calculation)
(1) Package AC (VRV)
General assumption for Package AC (VRV) 26,000 units sold/year (Actual base), Electric capacity (average) 12 kW (12HP), Energy saving by conversion to package AC 25%, Electricity tariff: Rp. 1,333 /kWh (B-class average in 2013), Electricity subsidy Rp. 102 /kWh (B-class average in 2013), Investment cost: Rp. 80 million/unit, Cost increase by conversion to package AC: Rp. 40 million/unit, # of package ACs (VRV)/total # of package AC sold = 20% in 2016 => expanding to 50% in 2025 (Newly conversion ratio to VRV by incentive: 15% (average till 2025) (i.e. BAU of 20% is deducted), Incentive eligible ratio: 26.67% (average till 2020 (over incentive period)) Operation: 10 hours/day, 300 days/year *1 Low Interest Loan for all types of companies (Guarantee is excluded, since it is hard to be quantified to be included in this calculation.) Assumption 2% interest subsidy for 3-year repayment, 3-year annual principal equal repayment, incentive provision to the new loans over 5 years, average interest rate per year: 12%, interest subsidy: 2% Government Benefit (Annual) = [Average energy saving (Annual)] * [Electricity Subsidy]
[26,000 units*15%*10 years *12 kW*25%*10 hours*300 days *10/2/10]*Rp. 102 /kWh=Rp. 17,911 million Cost (Annual) (2% interest subsidy) (2% of Interest Subsidy to outstanding debt (newly borrowed over
10 years), 3-year annual principal equal repayment, Annual) New investment for incentive per yr: 26,000 units*26.67%*Rp. 88 million=Rp. 610,133 million Total interest subsidy: Rp. 12,203 million=(Rp.610,133 millon+Rp.203,378 million)∗3years
2 ∗ 5years ∗ 2%/10
Net benefit Rp. 17,911 million - Rp. 12,203 million=Rp. 5,708 million
Buildings Benefit (Annual) = [Average energy saving] * [Electricity tariff] + [2% interest subsidy]
[26,000 units*15%*10 years *12 kW*25% *10 hours*300 days*10/2/10]*Rp. 1333 /kWh +Rp. 12,203 million=Rp. 246,108 million
Cost (Annual) (Investment & maintenance cost) = ([Accumulated numbers of equipment over 10 years]*[unit price]*1.15]+[Interest payment excluding subsidy]) / useful life of AC Interest Payment excluding BAU: New investment: 26,000 units*15%*Rp. 88 million = Rp. 343,200 million Total interest payment: Rp. 823,680 million=(Rp.343,200 million+Rp.114,400 million)∗3years
2 ∗ 10yrs ∗ 12%, Total
interest subsidy: Rp. 122,027 million=(Rp.610,133 million+Rp.203,378 million)∗3years2
∗ 5years ∗ 2%
(26,000 units*15%*Rp. 44 million*10 years*1.15) + (Rp. 823,680 million - Rp.122,027 million)/15 years=Rp. 178,337 million
Net benefit (Annual) Rp. 246,108 million - Rp. 178,337 million=Rp. 67,771 million
Final Report 2-51
Technical Cooperation Project for Capacity Development for Green Economy Policy in Indonesia Research on Green Urban Development
(2) High efficient chiller
General assumption for High efficient chiller 1800 units/yr (actual), Electric capacity (average) 0.8 kW/RT, 200 RT (average, mainly air cooling), Energy saving by conversion to EE products: 20%, Electricity tariff: Rp. 1,333 /kWh (B-class average in 2013), Electricity subsidy Rp. 102 /kWh (B-class average in 2013), EE chiller’s cost: Rp. 1,000 million (plus VAT), Cost increase by conversion to EE products: Rp. 200 million/unit (plus VAT), # of high efficient chillers/total # of chillers sold = 5% in 2016 => expanding to 50% in 2025 (Conversion ratio to EE products: 22.5% (average till 2025) (BAU (5%) is deducted), 15% (average till 2020 (over incentive period)) Operation: 10 hours/day, 300 days/year *1 Low Interest Loan for all types of companies Assumption 2% interest subsidy for 3-year repayment, 3-year annual principal equal repayment, incentive provision to the new loans over 5 years Government Benefit (Annual) = [Average energy saving (Annual)] * [Electricity Subsidy]
[1,800 units*22.50%*10 years *0.8 kW/RT*200 RT*20%*10 hours*300 days*10/2/10]*Rp. 102 /kWh=Rp. 19,840 million
Cost (Annual) (2% of Interest Subsidy to outstanding debt (newly borrowed over 10 years), 3-year annual principal equal repayment, Annual) New investment for incentive per year: 1,800 units*15%*Rp. 1,100 million=Rp. 297,000 million Total interest subsidy (2%): Rp. 5,940 million=(Rp.297,000 million+Rp.99,000 million)∗3years
2 ∗ 5years ∗ 2%/10
Net benefit (Annual, Average) Rp. 19,840 million - Rp. 5,940 million = Rp. 13,900million
Buildings Benefit (Annual) = [Average energy saving] * [Electricity tariff] + [2% interest subsidy]
[1,800 units*22.5%*10 years *0.8 kW/RT*200 RT*20% *10 hours*300 days*10/2/10]*Rp. 1333 /kWh + Rp. 5,940 million =Rp. 265,035 million
Cost (Annual) = ([Accumulated numbers of equipment over 10 years]*[unit price]*1.15] +[Interest payment excluding subsidy]) / Useful life of chiller Interest Payment excluding BAU: New investment: 1800 unit*22.5%*Rp. 1,100 million=Rp. 445,500 million Total interest payment: Rp. 1,069,200 million=(Rp.445,500 million+Rp.148,500 million)∗3years
2 ∗ 10yrars ∗ 12%,
Total interest subsidy per year: Rp. 59,400 million=(Rp.297,000 million+Rp.99,000million)∗3years2
∗ 5years ∗ 2%
([1800 units*22.5%*Rp. 220 million*10 years*1.15] + (Rp. 1,069,200 million-Rp. 59,400 million)/15 years=Rp. 135,630 million
Net benefit (Annual) Rp. 265,035 million - Rp. 135,630 million = Rp. 129,405 million
Final Report 2-52
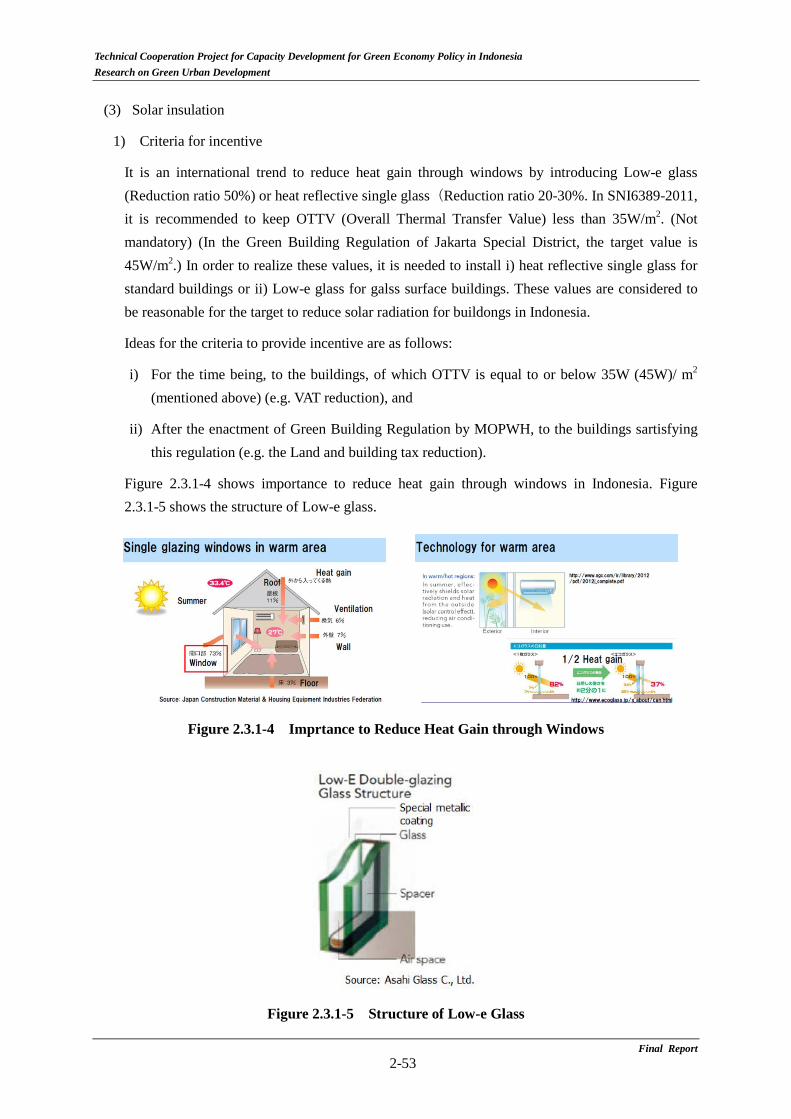
Technical Cooperation Project for Capacity Development for Green Economy Policy in Indonesia Research on Green Urban Development
(3) Solar insulation
1) Criteria for incentive
It is an international trend to reduce heat gain through windows by introducing Low-e glass (Reduction ratio 50%) or heat reflective single glass(Reduction ratio 20-30%. In SNI6389-2011, it is recommended to keep OTTV (Overall Thermal Transfer Value) less than 35W/m2. (Not mandatory) (In the Green Building Regulation of Jakarta Special District, the target value is 45W/m2.) In order to realize these values, it is needed to install i) heat reflective single glass for standard buildings or ii) Low-e glass for galss surface buildings. These values are considered to be reasonable for the target to reduce solar radiation for buildongs in Indonesia.
Ideas for the criteria to provide incentive are as follows:
i) For the time being, to the buildings, of which OTTV is equal to or below 35W (45W)/ m2
(mentioned above) (e.g. VAT reduction), and
ii) After the enactment of Green Building Regulation by MOPWH, to the buildings sartisfying this regulation (e.g. the Land and building tax reduction).
Figure 2.3.1-4 shows importance to reduce heat gain through windows in Indonesia. Figure 2.3.1-5 shows the structure of Low-e glass.
Figure 2.3.1-4 Imprtance to Reduce Heat Gain through Windows
Figure 2.3.1-5 Structure of Low-e Glass
Final Report 2-53
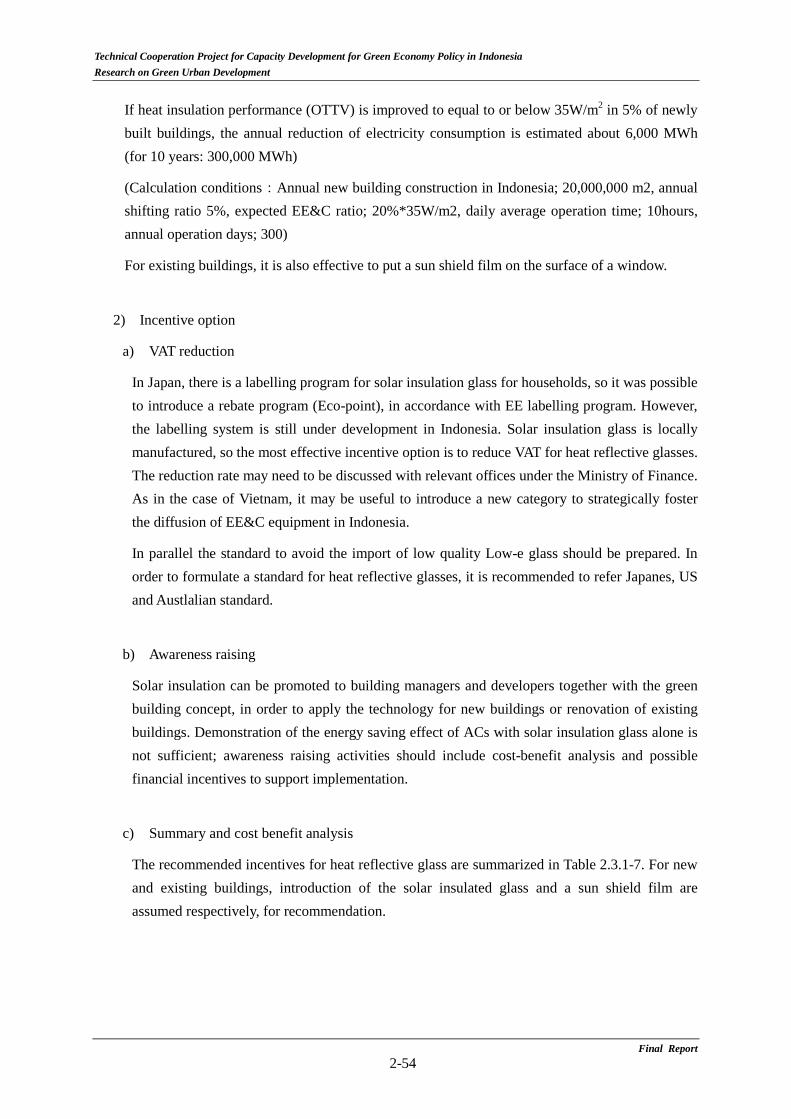
Technical Cooperation Project for Capacity Development for Green Economy Policy in Indonesia Research on Green Urban Development
If heat insulation performance (OTTV) is improved to equal to or below 35W/m2 in 5% of newly built buildings, the annual reduction of electricity consumption is estimated about 6,000 MWh (for 10 years: 300,000 MWh)
(Calculation conditions:Annual new building construction in Indonesia; 20,000,000 m2, annual shifting ratio 5%, expected EE&C ratio; 20%*35W/m2, daily average operation time; 10hours, annual operation days; 300)
For existing buildings, it is also effective to put a sun shield film on the surface of a window.
2) Incentive option
a) VAT reduction
In Japan, there is a labelling program for solar insulation glass for households, so it was possible to introduce a rebate program (Eco-point), in accordance with EE labelling program. However, the labelling system is still under development in Indonesia. Solar insulation glass is locally manufactured, so the most effective incentive option is to reduce VAT for heat reflective glasses. The reduction rate may need to be discussed with relevant offices under the Ministry of Finance. As in the case of Vietnam, it may be useful to introduce a new category to strategically foster the diffusion of EE&C equipment in Indonesia.
In parallel the standard to avoid the import of low quality Low-e glass should be prepared. In order to formulate a standard for heat reflective glasses, it is recommended to refer Japanes, US and Austlalian standard.
b) Awareness raising
Solar insulation can be promoted to building managers and developers together with the green building concept, in order to apply the technology for new buildings or renovation of existing buildings. Demonstration of the energy saving effect of ACs with solar insulation glass alone is not sufficient; awareness raising activities should include cost-benefit analysis and possible financial incentives to support implementation.
c) Summary and cost benefit analysis
The recommended incentives for heat reflective glass are summarized in Table 2.3.1-7. For new and existing buildings, introduction of the solar insulated glass and a sun shield film are assumed respectively, for recommendation.
Final Report 2-54
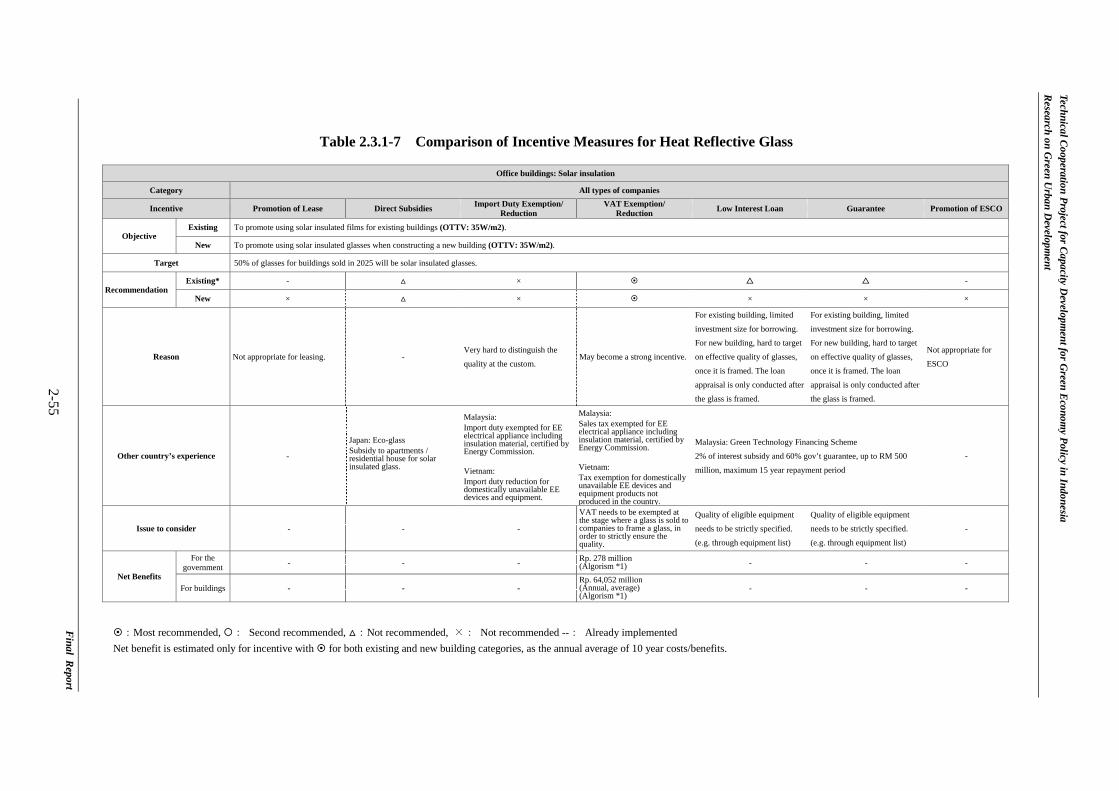
Technical Cooperation Project for Capacity D
evelopment for G
reen Econom
y Policy in Indonesia R
esearch on Green U
rban Developm
ent
Final R
eport 2-55
Table 2.3.1-7 Comparison of Incentive Measures for Heat Reflective Glass
:Most recommended, : Second recommended, :Not recommended, ×: Not recommended --: Already implemented Net benefit is estimated only for incentive with for both existing and new building categories, as the annual average of 10 year costs/benefits.
Office buildings: Solar insulation
Category All types of companies
Incentive Promotion of Lease Direct Subsidies Import Duty Exemption/ Reduction
VAT Exemption/ Reduction Low Interest Loan Guarantee Promotion of ESCO
Objective Existing To promote using solar insulated films for existing buildings (OTTV: 35W/m2).
New To promote using solar insulated glasses when constructing a new building (OTTV: 35W/m2).
Target 50% of glasses for buildings sold in 2025 will be solar insulated glasses.
Recommendation Existing* - × -
New × × × × ×
Reason Not appropriate for leasing. - Very hard to distinguish the
quality at the custom. May become a strong incentive.
For existing building, limited
investment size for borrowing.
For new building, hard to target
on effective quality of glasses,
once it is framed. The loan
appraisal is only conducted after
the glass is framed.
For existing building, limited
investment size for borrowing.
For new building, hard to target
on effective quality of glasses,
once it is framed. The loan
appraisal is only conducted after
the glass is framed.
Not appropriate for
ESCO
Other country’s experience -
Japan: Eco-glass Subsidy to apartments / residential house for solar insulated glass.
Malaysia: Import duty exempted for EE electrical appliance including insulation material, certified by Energy Commission.
Vietnam: Import duty reduction for domestically unavailable EE devices and equipment.
Malaysia: Sales tax exempted for EE electrical appliance including insulation material, certified by Energy Commission. Vietnam: Tax exemption for domestically unavailable EE devices and equipment products not produced in the country.
Malaysia: Green Technology Financing Scheme
2% of interest subsidy and 60% gov’t guarantee, up to RM 500
million, maximum 15 year repayment period
-
Issue to consider - - -
VAT needs to be exempted at the stage where a glass is sold to companies to frame a glass, in order to strictly ensure the quality.
Quality of eligible equipment
needs to be strictly specified.
(e.g. through equipment list)
Quality of eligible equipment
needs to be strictly specified.
(e.g. through equipment list)
-
Net Benefits
For the government - - - Rp. 278 million
(Algorism *1) - - -
For buildings - - - Rp. 64,052 million (Annual, average) (Algorism *1)
- - -
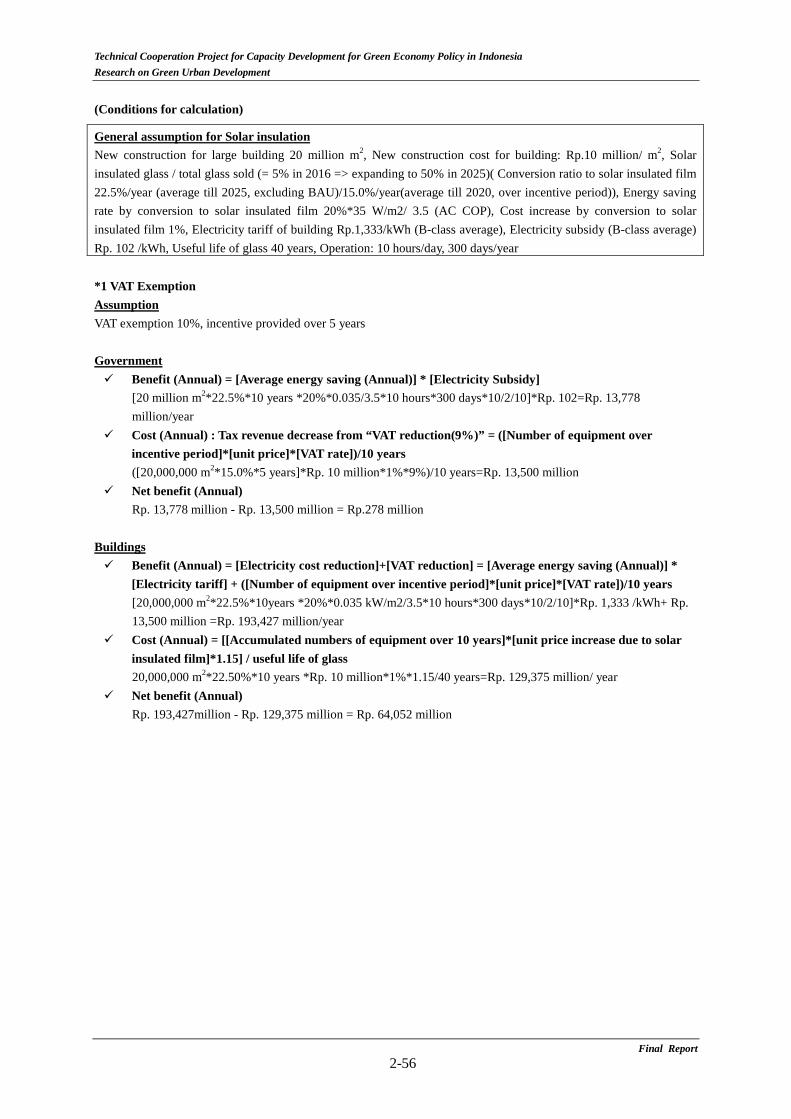
Technical Cooperation Project for Capacity Development for Green Economy Policy in Indonesia Research on Green Urban Development
(Conditions for calculation)
General assumption for Solar insulation New construction for large building 20 million m2, New construction cost for building: Rp.10 million/ m2, Solar insulated glass / total glass sold (= 5% in 2016 => expanding to 50% in 2025)( Conversion ratio to solar insulated film 22.5%/year (average till 2025, excluding BAU)/15.0%/year(average till 2020, over incentive period)), Energy saving rate by conversion to solar insulated film 20%*35 W/m2/ 3.5 (AC COP), Cost increase by conversion to solar insulated film 1%, Electricity tariff of building Rp.1,333/kWh (B-class average), Electricity subsidy (B-class average) Rp. 102 /kWh, Useful life of glass 40 years, Operation: 10 hours/day, 300 days/year *1 VAT Exemption Assumption VAT exemption 10%, incentive provided over 5 years Government Benefit (Annual) = [Average energy saving (Annual)] * [Electricity Subsidy]
[20 million m2*22.5%*10 years *20%*0.035/3.5*10 hours*300 days*10/2/10]*Rp. 102=Rp. 13,778 million/year
Cost (Annual) : Tax revenue decrease from “VAT reduction(9%)” = ([Number of equipment over incentive period]*[unit price]*[VAT rate])/10 years ([20,000,000 m2*15.0%*5 years]*Rp. 10 million*1%*9%)/10 years=Rp. 13,500 million
Net benefit (Annual) Rp. 13,778 million - Rp. 13,500 million = Rp.278 million
Buildings Benefit (Annual) = [Electricity cost reduction]+[VAT reduction] = [Average energy saving (Annual)] *
[Electricity tariff] + ([Number of equipment over incentive period]*[unit price]*[VAT rate])/10 years [20,000,000 m2*22.5%*10years *20%*0.035 kW/m2/3.5*10 hours*300 days*10/2/10]*Rp. 1,333 /kWh+ Rp. 13,500 million =Rp. 193,427 million/year
Cost (Annual) = [[Accumulated numbers of equipment over 10 years]*[unit price increase due to solar insulated film]*1.15] / useful life of glass 20,000,000 m2*22.50%*10 years *Rp. 10 million*1%*1.15/40 years=Rp. 129,375 million/ year
Net benefit (Annual) Rp. 193,427million - Rp. 129,375 million = Rp. 64,052 million
Final Report 2-56

Technical Cooperation Project for Capacity Development for Green Economy Policy in Indonesia Research on Green Urban Development
(4) PV power generation
1) Criteria for incentive
For the time being, all PVs (panels, inverters and batteries) are to be the targets of incentive mechanism. The criteria is to be with guarantee years; PV panels with 20 years warrantee, and inverters/ batteries with 5 years warrantee.
By annual implementation of 500 units of 20kW PV power genaration, the annual reduction of electricity consumption will be assumed about 18,000MWh (for 10 years: 900,000MWh)
(Calculation conditions: effective operation ratio; 20%)
2) Incentive option
a) Utilization of existing tax incentive
As mentioned in 2.1.2, a full package of tax incentives (income tax, VAT, import duty and government-born tax facilities) are already given to renewable energy, including PV, without size limitations. It is recommended to keep the incentives, especially for buildings.
b) Low interest loan
The approach and the pros and cons are the same as AC (package) and AC (chiller). Like AC (chiller), one of the options for the technical assessment can be the assessment by the designated energy auditors or designated institutions like Malaysian case, in addition to “Equipment list”.
c) Lease
Leasing PV may be another option to facilitate the fast diffusion of technology among buildings. PV tends to be cost-intensive with a long payback period, which is a big huddle despite the presence of all the tax incentives provided. The point to consider is whether there are any leasing companies willing to lease the PV system for buildings. One leasing company the Study Team interviewed answered positively; however, they have no track record of leasing the PV system.
d) Awareness raising
A number of capacity development activities have already been provided related to PVs in Indonesia. However, many have the perception that installing PVs on roof-tops of buildings is still an expensive option. As the electricity tariff is gradually increasing, awareness raising activities should be provided to reflect the current situation related to PVs, including the cost-benefit analysis and financial incentives in supporting PVs.
e) Summary and cost benefit analysis
The recommended incentives for PV power generation are summarized in Table 2.3.1-8.
Final Report 2-57

Technical Cooperation Project for Capacity D
evelopment for G
reen Econom
y Policy in Indonesia R
esearch on Green U
rban Developm
ent
Final R
eport 2-58
Table 2.3.1-8 Comparison of Incentive Measures for PV Power Generation
:Most recommended, : Second recommended, :Not recommended, ×: Not recommended --: Already implemented Net benefit is estimated only for incentive with for both existing and new building categories, as the annual average of 10 year costs/benefits.
Office buildings: PV power generation
Category All types of companies
Incentive Promotion of Lease Direct Subsidies Import Duty Exemption/ Reduction
VAT Exemption/ Reduction
Low Interest Loan (LIL) Guarantee Promotion of ESCO
Objective Existing/New To promote the introduction of PV power system to buildings
Target Buildings with PV will be 500 buildings in 2025.
Recommendation Existing - - 〇 ×
New - - 〇 ×
Reason
Within the existing regulatory
framework and can be
implemented immediately
No initial costs for lessor
No fiscal burden
High fiscal burden for gov’t
considering investment size. Already introduced
-
Attractive for companies, despite
limited gov’t fiscal burden.
Attractive for companies
especially for the one with
weak financial capacity, if
it could work as a
substitute of collateral.
More appropriate to introduce a
Feed-In-Tariff system to
promote PV system.
Other country’s experience
Thailand: ESCO Fund leases
renewable energy equipment for
a rental fee (installment payment
+ fix interest rate of 4-6%) with a
maximum leasing period of 5
years.
Vietnam: Subsidy up to 30% or
VND 5 billion per project.
Thailand:
Import duty exemption under
BOI privileges for (2014-2017).
Vietnam:
Import duty reduction for
domestically unavailable EE
devices and equipment.
Vietnam:
Tax exemption for domestically
unavailable EE devices and
equipment products not
produced in the country.
Malaysia: Green Technology Financing Scheme
2% of interest subsidy and 60% gov’t guarantee, up to RM
500 million, maximum 15-year repayment period
-
Issue to consider - -
-
- Quick appraisal is important for investors.
Guarantee needs to be implemented together with LIL.
-
Net Benefits
For the government
Rp. 894 million (Annual)
(Algorithm *1) - - -
Rp. 531 million (Annual,
average, 2% interest subsidy)
(Algorism *2)
- -
For investors Rp. 13,160 million (Annual)
(Algorithm *1) - - -
Rp. 4,390 million
(Annual, average, 2% interest
subsidy) (Algorism *2)
Rp. 88 million/building
- -

Technical Cooperation Project for Capacity Development for Green Economy Policy in Indonesia Research on Green Urban Development
(Conditions for calculation)
General assumption for PV power generation Annual new installment of PV: 0 MW (20 kW*0 bldg) in 2016 expanding to 10 MW (20 kW*500 buildings) by 2025 (1.0 MW/year (20 kW*50 buildings) for average till 2025) / 0.56 MW/year (20 kW*28 buildings) for average till 2020 over incentive period), Capacity Factor 20%, Investment Cost Rp. 20,000,000 /kW (plus VAT), Electricity Tariff for large building Rp. 1333 /kWh (B-2 and B-3 class average), Electricity Subsidy (B-2 and B-3 class average) Rp. 102/kWh, maintenance over 10 years: 15% of investment, Useful life of PV: 20years, Operation: 365 days, 24 hours *1 Promotion of lease Assumption Cost of fund: 10%, Leasing fee: cost of fund (10%) + O&M costs (1.5%) + fee (3.5%), full-payout option of 7 years, corporate tax (25%) is considered as deductible expenses of 25% Government Benefit (Annual) = [Average energy saving (Annual)] * [Electricity Subsidy]
20 kW*365 days*24 hours*20%*50 buildings*Rp. 102 kWh*10 year*10year/2/10=Rp. 894 million Cost
Assumed to be zero Net benefit
Rp. 894 million – Rp. 0= Rp. 894 million Investors Benefit (Reduction of Electricity subsidy, annual)
20 kW*365 days*24 hours*20%*50 bnildings*Rp. 1333 /kWh*10 years*10/2/10 + ((20 kW*50buildings*10years*Rp. 22 million/kW*25%)*7 years)/10 years =Rp. 50,175million
Cost (annual)
Equipment cost[20kW ∗ (Number of blgs in each year) ∗ 15% ∗ Rp. 22 million/kW] 10
𝑖𝑖=1
+ Payment for the interest𝑖𝑖 /10 years = 37,015 millions/year Net benefit (Annual, average)
Rp. 50,175 million - Rp. 37,015 = Rp. 13,160 million *2 Low Interest Loan for all types of companies Assumption Average interest rate: 12%, 2% interest subsidy for 5-year repayment, 5-year annual principal equal repayment, incentive provided to the new loans over 5 years Government Benefit (Annual) = [Average energy saving (Annual)] * [Electricity Subsidy]
50 buildings*10 years* 20 kW*365 day*24 hours*20%*10/2/10*Rp. 102 /kWh=Rp. 894 million Cost (2% of Interest Subsidy to outstanding debt (newly borrowed over 10 years), 5-year annual
principal equal repayment, Annual) New investment for incentive per year: 20 kW*28 buildings*Rp. 22 million/kW=Rp. 12,100 million Total interest subsidy: Rp. 363 million=(Rp.12,100 million+Rp2,420 million)∗5years
2 ∗ 5years ∗ 2% /10
Net benefit (Annual, average) Rp. 894 million – Rp. 363 million =Rp. 531 million
Final Report 2-59
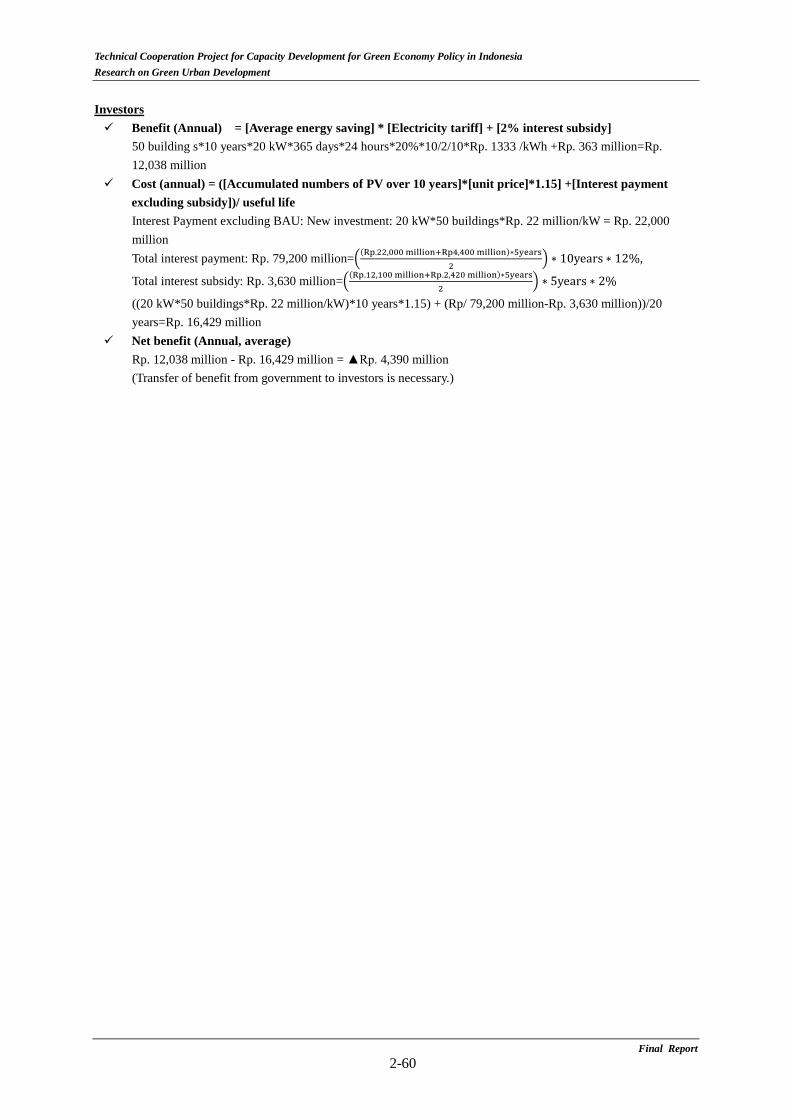
Technical Cooperation Project for Capacity Development for Green Economy Policy in Indonesia Research on Green Urban Development
Investors Benefit (Annual) = [Average energy saving] * [Electricity tariff] + [2% interest subsidy]
50 building s*10 years*20 kW*365 days*24 hours*20%*10/2/10*Rp. 1333 /kWh +Rp. 363 million=Rp. 12,038 million
Cost (annual) = ([Accumulated numbers of PV over 10 years]*[unit price]*1.15] +[Interest payment excluding subsidy])/ useful life Interest Payment excluding BAU: New investment: 20 kW*50 buildings*Rp. 22 million/kW = Rp. 22,000 million Total interest payment: Rp. 79,200 million=(Rp.22,000 million+Rp4,400 million)∗5years
2 ∗ 10years ∗ 12%,
Total interest subsidy: Rp. 3,630 million=(Rp.12,100 million+Rp.2,420 million)∗5years2
∗ 5years ∗ 2%
((20 kW*50 buildings*Rp. 22 million/kW)*10 years*1.15) + (Rp/ 79,200 million-Rp. 3,630 million))/20 years=Rp. 16,429 million
Net benefit (Annual, average) Rp. 12,038 million - Rp. 16,429 million = Rp. 4,390 million (Transfer of benefit from government to investors is necessary.)
Final Report 2-60
Technical Cooperation Project for Capacity Development for Green Economy Policy in Indonesia Research on Green Urban Development
(5) Green building
1) Criteria for incentive mechanism
In Jakarta Special District, Green Building criteria have been decided by referring the Indonesia Green building council standard,”Greenship”. The criteria can be applicable for the incentive. The criteria for National Green Building, which will be defined by MOPWH in 2015, can be also applicable as the incentive criteria.
By 5% of annual increase of Green Building ratio, the annual reduction of electricity consumption is assumed about 50,000 MWh (for 10 years: 2,500,000 MWh)
(Calculation conditions: Annual new building construction in Indonesia; 20,000,000 m2, annual shifting ratio 5%, expected EE&C ratio; 20%=50 kWh/m2y)
2) Incentive option
a) Reduction of fixed asset tax
At present, all lands or buildings or both are charged the land/ building (real estate) tax (PBB: Pajak Bumi dan Bangunan), unless exempted. The calculation of the tax is [the property valuation amount (NJOP: Nilai Jual Objek Pajak) minus exempted amount] times [maximum 0.3%] and the certain tax reduction from this level can be considered as the incentive.
b) Awareness raising
The tax rate of the fixed asset tax differs depending on the local governments, so the coordination and awareness raising with each local government are important in order to maximize the effects of these incentives above. Also, recommendation of the concept of green buildings to building managers or developers will lead to application of new buildings and existing building’s renovation. Thus, the cost benefit analysis and economic incentive to promote project implementation should be included in awareness raising.
c) Summary and cost benefit analysis
The comparison of incentives for green buildings is summarized in Table 2.3.1-9. The same incentives are likely to give the different impacts on consumers either in existing buildings and new buildings, thus the recommended incentives are examined, respectively.
Final Report 2-61
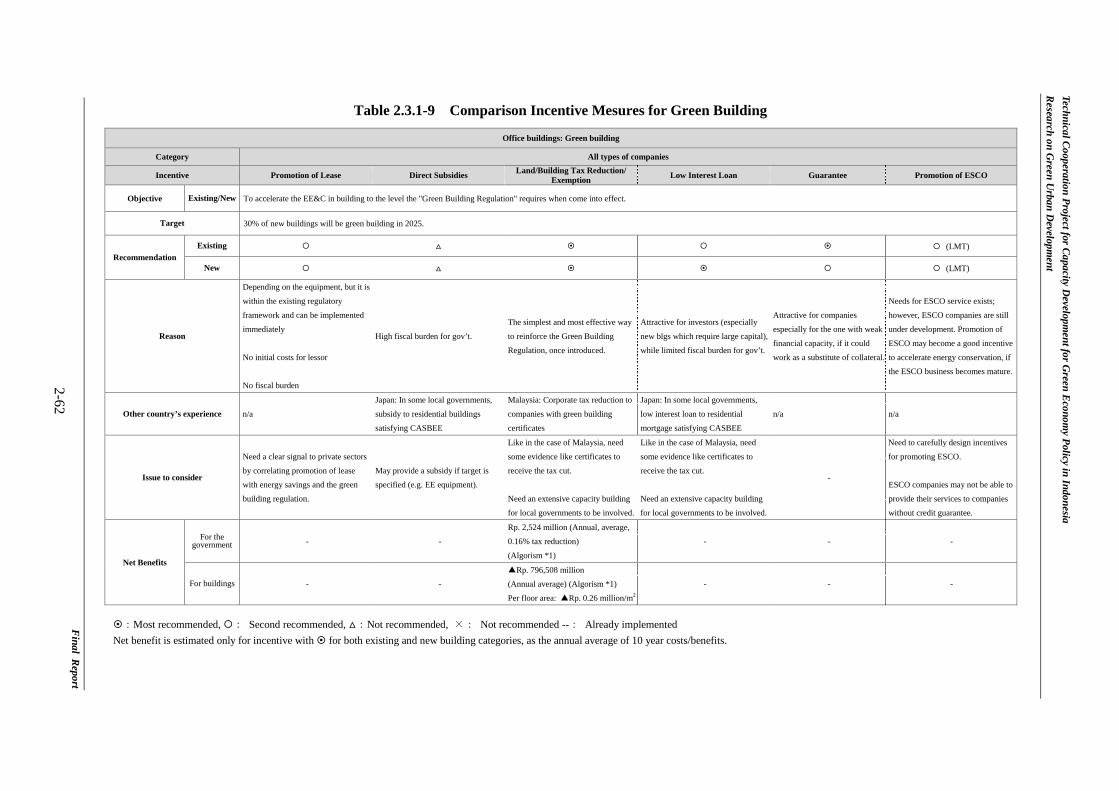
Technical Cooperation Project for Capacity D
evelopment for G
reen Econom
y Policy in Indonesia R
esearch on Green U
rban Developm
ent
Final R
eport 2-62
Table 2.3.1-9 Comparison Incentive Mesures for Green Building
:Most recommended, : Second recommended, :Not recommended, ×: Not recommended --: Already implemented Net benefit is estimated only for incentive with for both existing and new building categories, as the annual average of 10 year costs/benefits.
Office buildings: Green building
Category All types of companies
Incentive Promotion of Lease Direct Subsidies Land/Building Tax Reduction/ Exemption Low Interest Loan Guarantee Promotion of ESCO
Objective Existing/New To accelerate the EE&C in building to the level the "Green Building Regulation" requires when come into effect.
Target 30% of new buildings will be green building in 2025.
Recommendation Existing (LMT)
New (LMT)
Reason
Depending on the equipment, but it is
within the existing regulatory
framework and can be implemented
immediately
No initial costs for lessor
No fiscal burden
High fiscal burden for gov’t.
The simplest and most effective way
to reinforce the Green Building
Regulation, once introduced.
Attractive for investors (especially
new blgs which require large capital),
while limited fiscal burden for gov’t.
Attractive for companies
especially for the one with weak
financial capacity, if it could
work as a substitute of collateral.
Needs for ESCO service exists;
however, ESCO companies are still
under development. Promotion of
ESCO may become a good incentive
to accelerate energy conservation, if
the ESCO business becomes mature.
Other country’s experience n/a
Japan: In some local governments,
subsidy to residential buildings
satisfying CASBEE
Malaysia: Corporate tax reduction to
companies with green building
certificates
Japan: In some local governments,
low interest loan to residential
mortgage satisfying CASBEE
n/a n/a
Issue to consider
Need a clear signal to private sectors
by correlating promotion of lease
with energy savings and the green
building regulation.
May provide a subsidy if target is
specified (e.g. EE equipment).
Like in the case of Malaysia, need
some evidence like certificates to
receive the tax cut.
Need an extensive capacity building
for local governments to be involved.
Like in the case of Malaysia, need
some evidence like certificates to
receive the tax cut.
Need an extensive capacity building
for local governments to be involved.
-
Need to carefully design incentives
for promoting ESCO.
ESCO companies may not be able to
provide their services to companies
without credit guarantee.
Net Benefits
For the government - -
Rp. 2,524 million (Annual, average,
0.16% tax reduction)
(Algorism *1)
- - -
For buildings - -
Rp. 796,508 million
(Annual average) (Algorism *1)
Per floor area: Rp. 0.26 million/m2
- - -
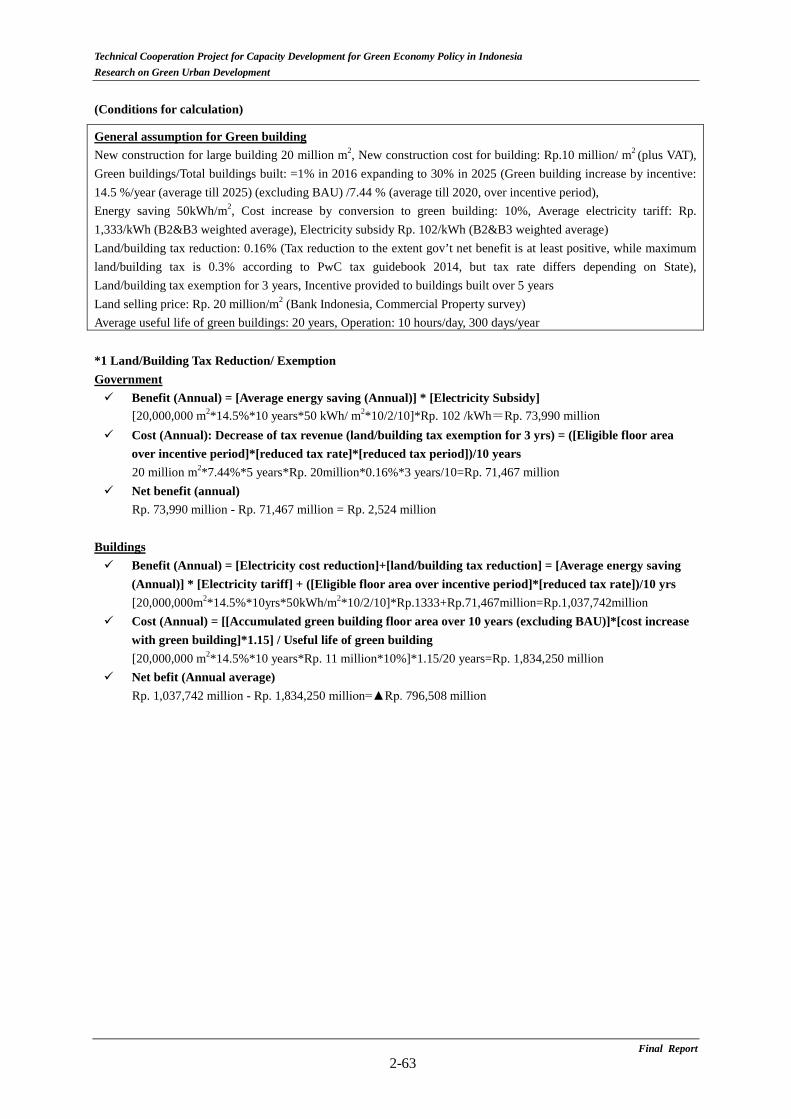
Technical Cooperation Project for Capacity Development for Green Economy Policy in Indonesia Research on Green Urban Development
(Conditions for calculation)
General assumption for Green building New construction for large building 20 million m2, New construction cost for building: Rp.10 million/ m2 (plus VAT), Green buildings/Total buildings built: =1% in 2016 expanding to 30% in 2025 (Green building increase by incentive: 14.5 %/year (average till 2025) (excluding BAU) /7.44 % (average till 2020, over incentive period), Energy saving 50kWh/m2, Cost increase by conversion to green building: 10%, Average electricity tariff: Rp. 1,333/kWh (B2&B3 weighted average), Electricity subsidy Rp. 102/kWh (B2&B3 weighted average) Land/building tax reduction: 0.16% (Tax reduction to the extent gov’t net benefit is at least positive, while maximum land/building tax is 0.3% according to PwC tax guidebook 2014, but tax rate differs depending on State), Land/building tax exemption for 3 years, Incentive provided to buildings built over 5 years Land selling price: Rp. 20 million/m2 (Bank Indonesia, Commercial Property survey) Average useful life of green buildings: 20 years, Operation: 10 hours/day, 300 days/year *1 Land/Building Tax Reduction/ Exemption Government Benefit (Annual) = [Average energy saving (Annual)] * [Electricity Subsidy]
[20,000,000 m2*14.5%*10 years*50 kWh/ m2*10/2/10]*Rp. 102 /kWh=Rp. 73,990 million Cost (Annual): Decrease of tax revenue (land/building tax exemption for 3 yrs) = ([Eligible floor area
over incentive period]*[reduced tax rate]*[reduced tax period])/10 years 20 million m2*7.44%*5 years*Rp. 20million*0.16%*3 years/10=Rp. 71,467 million
Net benefit (annual) Rp. 73,990 million - Rp. 71,467 million = Rp. 2,524 million
Buildings Benefit (Annual) = [Electricity cost reduction]+[land/building tax reduction] = [Average energy saving
(Annual)] * [Electricity tariff] + ([Eligible floor area over incentive period]*[reduced tax rate])/10 yrs [20,000,000m2*14.5%*10yrs*50kWh/m2*10/2/10]*Rp.1333+Rp.71,467million=Rp.1,037,742million
Cost (Annual) = [[Accumulated green building floor area over 10 years (excluding BAU)]*[cost increase with green building]*1.15] / Useful life of green building [20,000,000 m2*14.5%*10 years*Rp. 11 million*10%]*1.15/20 years=Rp. 1,834,250 million
Net befit (Annual average) Rp. 1,037,742 million - Rp. 1,834,250 million=Rp. 796,508 million
Final Report 2-63
Technical Cooperation Project for Capacity Development for Green Economy Policy in Indonesia Research on Green Urban Development
2.3.2 Households
(1) AC (split type)
1) Criteria for incentive
Same as office building, inverter ACs are to be the target of incentive mechanism. Whether the incentive target will be limited to the households of 900VA, which are highly subsidized or to all sectors is the issue to be considered.
2) Incentive option
a) Rebate
The higher price of EE electric appliances compared to the standard products is one of the hurdles to promote the penetration of EE electric appliances. Therefore, the rebates could lower this hurdle, like Japan/Malaysia’s case. According to the interviews in the previous study, in case of 15% price difference, the lower price products will be bought. If the price difference is below 5%, EE models even with higher price will be purchased. In the current market, the price difference between the standard and EE models is approximately 19%. This incentive’s pros are that it has the direct (strong) impacts to boost EE product purchase. The cons, on the other hand, are that the fiscal burden and the transaction cost are high and there is high risk for misuse (cheating) unless the mechanism is carefully designed.
b) VAT reduction
VAT reduction has the similar financial impact on the household, like the rebates. In addition to the pros of the rebate, the pros are that the transaction cost is relatively low compared to the rebates. The cons are that the maximum reduction rate is 10% (since VAT in Indonesia is 10%) while 15% at least is the desirable discount to fill the price gap between the standard model and EE model to change the consumer’s behavior. Furthermore, according to the media, it is not necessary that all shops are registered to file the tax (The registered shop is called “PKP/Pengusaha Kena Pajak”). Thus, if the products are sold without VAT at non PKP before implementing the incentive, the effectiveness of the incentive will be jeopardized. One of the alternatives could be to provide tax incentives to manufactures like Malaysian case. Also, VAT exemption was adopted in 2010 in Indonesia to promote LP gas equipment replacement. Therefore, the outcome of this initiative could be the lessons to implement this approach.
c) Summary and cost benefit analysis
The recommended incentives for split ACs in households are summarized in Table 2.3.2-1. As for “Net benefit”, all sectors are included in estimation. In order to reduce Governmental subsidy, 900VA consumers should be targeted.
Final Report 2-64

Technical Cooperation Project for Capacity D
evelopment for G
reen Econom
y Policy in Indonesia R
esearch on Green U
rban Developm
ent
Final R
eport 2-65
Table 2.3.2-1 Comparison Incentive Mesures for Split Air Conditioners in HH
:Most recommended, : Second recommended, :Not recommended, ×: Not recommended --: Already implemented Net benefit is estimated only for incentive with for both existing and new building categories, as the annual average of 10 year costs/benefits.
Households (HH): AC (split)
Category All types of households
Incentive Direct Subsidies (rebate) Import Duty Exemption/ Reduction VAT Exemption/ Reduction
Objective To promote installment/replacement of AC (split) with invertor in households.
Target 30% of AC (split) sold in 2025 will be with inverter.
Recommendation (900VA HH only) -
Reason High impact on consumer’s purchasing behavior, but heavy fiscal burden and high administration cost on the government. But could be effective to change 900 VA household segments.
Already implemented Relatively easy to implement and high impact on consumer’s purchasing behavior.
Other country’s experience Japan: Eco-point program When an AC with high EE labelling is purchased, provide the eco-point to be exchanged with various goods and service.
- Malaysia: Sales tax exempted for EE electrical appliance such as AC certified by Energy Commission.
Issue to consider The mechanism to avoid misuse is essential. - The mechanism to avoid misuse is essential.
Net Benefits
For the government
For all segments: Rp. 302,937 million (Annual) (Algorithm *1) Only for HH: Rp. 67,737 million (Annual) - For all segments: Rp. 312,635 million (Annual) (Algorithm *2)
Only for HH: Rp. 69,676 million (Annual)
For buildings/ household
For all segments: Rp. 326,440 million (Annual) (Algorithm *1) Only for HH: Rp. 33,390 million (Annual) - For all segments: Rp. 357,759 million (Annual) (Algorithm *2)
Only for HH: Rp. 39,654 million (Annual)

Technical Cooperation Project for Capacity Development for Green Economy Policy in Indonesia Research on Green Urban Development
(Conditions for calculation)
General assumption for AC (split) Incentives given for 5 years (2016-2020); # of inverter ACs/total # of AC sold = 5% in 2016 => expanding to 30% in 2025 (Conversion ratio by incentive to inverter AC: average till 2025, 12.5% (excluding BAU), average till 2020 (over incentive period): 10.56%) Operating hours: 7 hours/day, Energy saving by conversion to AC with invertors: 30%, Maintenance over 10 years: 15% of investment *1 Rebates Assumption Price for AC with invertors: Rp. 3.5 million (plus VAT), Price difference between with/without invertors: Rp. 1 million/unit (plus VAT) Rebates: 10% of unit price, Commission to PLN for rebate program: 1% of unit price <For all segments> Assumption 2.5 million units sold/year (based on actual), Electricity subsidy Rp. 521 /kWh, Average electricity tariff: Rp. 974 /kWh (Weighted average of R-class and B-class) Operating days: 300 days/year Government Benefits (Annual) = [Average energy saving (Annual)] * [Electricity Subsidy]
[2,500,000 units* 12.5%* 10 years* 0.7 kW* 30%*7 hours* 300 days/year* 10 years/2/10]* Rp. 521 /kWh=Rp. 358,815 million
Costs (Annual) = ([Number of equipment over incentive period]*[unit price]*[Rebate rate + Commission to PLN])/10 years (2,500,000 units*10.56%*5 years*Rp. 3.85 million*(10%+1%))/10 years=Rp. 55,878 million
Net benefit (Annual) Rp. 358,815 million – Rp. 55,878 million=Rp. 302,937 million
Buildings/households Benefits (Annual) = [Electricity cost reduction]+[Rebate] = [Average energy saving (Annual)] *
[Electricity tariff] + ([Number of equipment over incentive period]*[unit price]*[Rebate rate])/10 yreas [(2.5 million units*12.5%*10 years*0.7 kW*30%*7 hours*300 days *10/2)/10 years]*Rp. 974 /kWh + Rp. 50,799 million =Rp. 721,752 million
Costs (Annual) (Investment & maintenance cost) = [[Accumulated numbers of equipment over 10 years]*[price increase]*1.15] / 10years (2.5 million units*12.5%*10 years*Rp. 1.1 million)*1.15/10=Rp. 395,313 million
Net benefit (Annual) Rp.721,752 million – Rp.395,313 million = Rp. 326,440 million
<For households> Assumption 20% of 2.5 million units sold/year is for households. Electric capacity (Average): 0.5 kW, Operating days: 365 days/year, Electricity subsidy Rp. 659 /kWh, Average electricity tariff: Rp. 854 /kWh (Weighted average of R-class) Government Benefits (Annual) = [Average energy saving (Annual)] * [Electricity Subsidy]
[500,000 units*12.5%*10 years*0.5 kW*30%*7 hours*365 days*10 years/2/10]*Rp. 659 /kWh=Rp. 78,913
Final Report 2-66
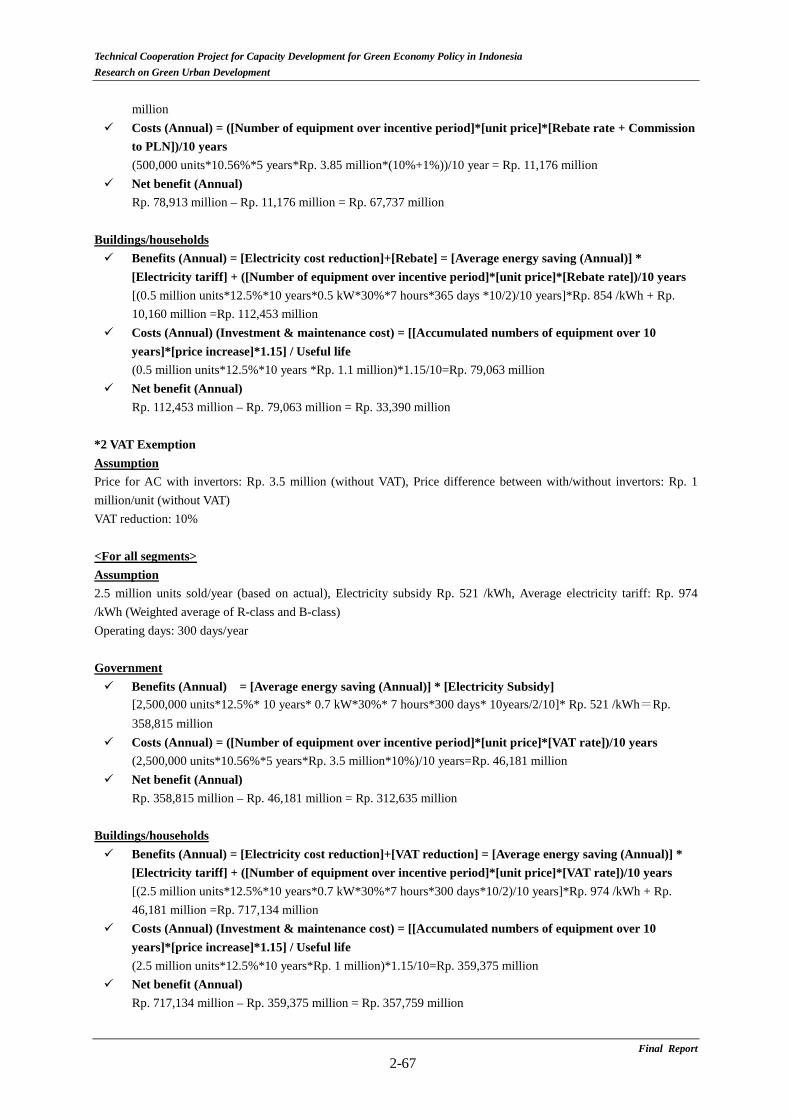
Technical Cooperation Project for Capacity Development for Green Economy Policy in Indonesia Research on Green Urban Development
million
Costs (Annual) = ([Number of equipment over incentive period]*[unit price]*[Rebate rate + Commission to PLN])/10 years (500,000 units*10.56%*5 years*Rp. 3.85 million*(10%+1%))/10 year = Rp. 11,176 million
Net benefit (Annual) Rp. 78,913 million – Rp. 11,176 million = Rp. 67,737 million
Buildings/households Benefits (Annual) = [Electricity cost reduction]+[Rebate] = [Average energy saving (Annual)] *
[Electricity tariff] + ([Number of equipment over incentive period]*[unit price]*[Rebate rate])/10 years [(0.5 million units*12.5%*10 years*0.5 kW*30%*7 hours*365 days *10/2)/10 years]*Rp. 854 /kWh + Rp. 10,160 million =Rp. 112,453 million
Costs (Annual) (Investment & maintenance cost) = [[Accumulated numbers of equipment over 10 years]*[price increase]*1.15] / Useful life (0.5 million units*12.5%*10 years *Rp. 1.1 million)*1.15/10=Rp. 79,063 million
Net benefit (Annual) Rp. 112,453 million – Rp. 79,063 million = Rp. 33,390 million
*2 VAT Exemption Assumption Price for AC with invertors: Rp. 3.5 million (without VAT), Price difference between with/without invertors: Rp. 1 million/unit (without VAT) VAT reduction: 10% <For all segments> Assumption 2.5 million units sold/year (based on actual), Electricity subsidy Rp. 521 /kWh, Average electricity tariff: Rp. 974 /kWh (Weighted average of R-class and B-class) Operating days: 300 days/year Government Benefits (Annual) = [Average energy saving (Annual)] * [Electricity Subsidy]
[2,500,000 units*12.5%* 10 years* 0.7 kW*30%* 7 hours*300 days* 10years/2/10]* Rp. 521 /kWh=Rp. 358,815 million
Costs (Annual) = ([Number of equipment over incentive period]*[unit price]*[VAT rate])/10 years (2,500,000 units*10.56%*5 years*Rp. 3.5 million*10%)/10 years=Rp. 46,181 million
Net benefit (Annual) Rp. 358,815 million – Rp. 46,181 million = Rp. 312,635 million
Buildings/households Benefits (Annual) = [Electricity cost reduction]+[VAT reduction] = [Average energy saving (Annual)] *
[Electricity tariff] + ([Number of equipment over incentive period]*[unit price]*[VAT rate])/10 years [(2.5 million units*12.5%*10 years*0.7 kW*30%*7 hours*300 days*10/2)/10 years]*Rp. 974 /kWh + Rp. 46,181 million =Rp. 717,134 million
Costs (Annual) (Investment & maintenance cost) = [[Accumulated numbers of equipment over 10 years]*[price increase]*1.15] / Useful life (2.5 million units*12.5%*10 years*Rp. 1 million)*1.15/10=Rp. 359,375 million
Net benefit (Annual) Rp. 717,134 million – Rp. 359,375 million = Rp. 357,759 million
Final Report 2-67
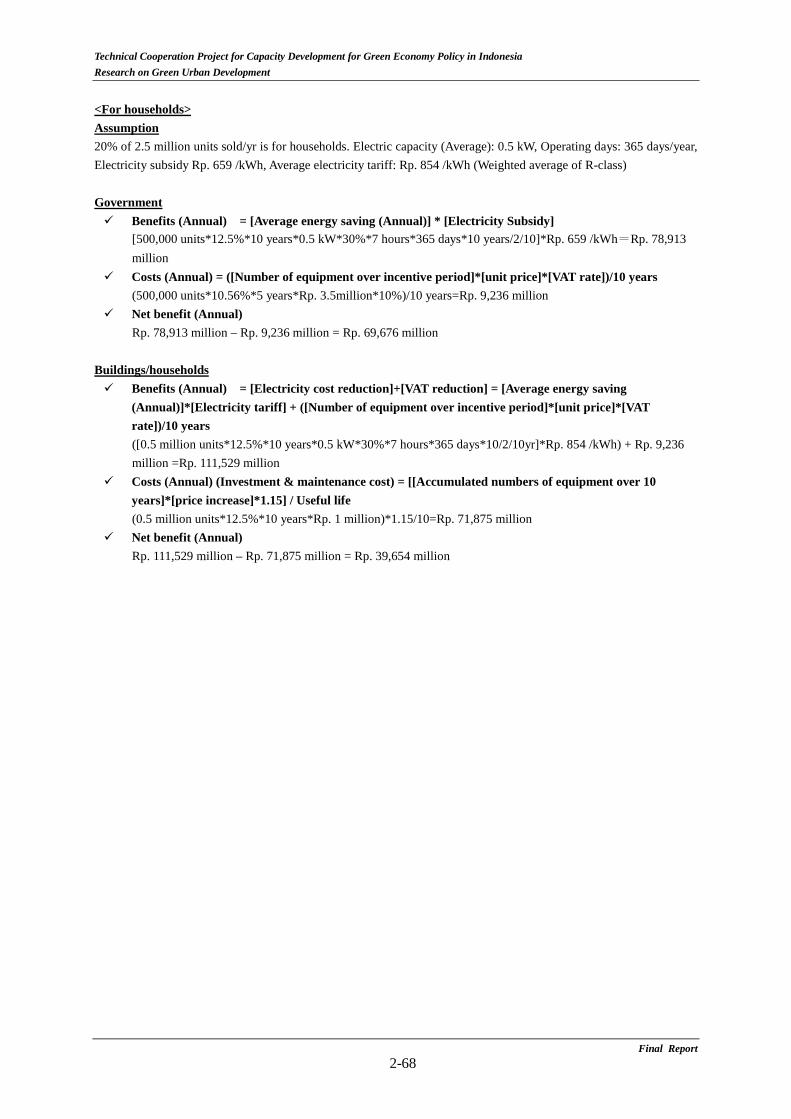
Technical Cooperation Project for Capacity Development for Green Economy Policy in Indonesia Research on Green Urban Development
<For households> Assumption 20% of 2.5 million units sold/yr is for households. Electric capacity (Average): 0.5 kW, Operating days: 365 days/year, Electricity subsidy Rp. 659 /kWh, Average electricity tariff: Rp. 854 /kWh (Weighted average of R-class) Government Benefits (Annual) = [Average energy saving (Annual)] * [Electricity Subsidy]
[500,000 units*12.5%*10 years*0.5 kW*30%*7 hours*365 days*10 years/2/10]*Rp. 659 /kWh=Rp. 78,913 million
Costs (Annual) = ([Number of equipment over incentive period]*[unit price]*[VAT rate])/10 years (500,000 units*10.56%*5 years*Rp. 3.5million*10%)/10 years=Rp. 9,236 million
Net benefit (Annual) Rp. 78,913 million – Rp. 9,236 million = Rp. 69,676 million
Buildings/households Benefits (Annual) = [Electricity cost reduction]+[VAT reduction] = [Average energy saving
(Annual)]*[Electricity tariff] + ([Number of equipment over incentive period]*[unit price]*[VAT rate])/10 years ([0.5 million units*12.5%*10 years*0.5 kW*30%*7 hours*365 days*10/2/10yr]*Rp. 854 /kWh) + Rp. 9,236 million =Rp. 111,529 million
Costs (Annual) (Investment & maintenance cost) = [[Accumulated numbers of equipment over 10 years]*[price increase]*1.15] / Useful life (0.5 million units*12.5%*10 years*Rp. 1 million)*1.15/10=Rp. 71,875 million
Net benefit (Annual) Rp. 111,529 million – Rp. 71,875 million = Rp. 39,654 million
Final Report 2-68
Technical Cooperation Project for Capacity Development for Green Economy Policy in Indonesia Research on Green Urban Development
(2) Refrigerator
1) Criteria for incentive
4star lebeled refigerators, which are defined by EE labeling program being enacted in 2015 by MEMR, are to be the target of incentive mechanism.
By shifting 5% of refrigerators sold in the market (average is 3 stars) to 4stars one, the annual reduction of electricity consumption is assumed about 27,600 MWh (for 10 years: 1,380,000 MWh)
(Calculation conditions:Annual sales amount of refrigerators in Indonesia; 3,000,000 units, annual shifting ratio 5%, average annual electricity consumption of existing refrigerators; 800 kWh, expected EE&C ratio; 23%)
2) Incentive option
a) Rebate
The consumer’s attitude and the incentive’s pros and cons are the same as “rebates” in (1). The price difference between the standard model and EE one is approximately 20% according to the previous JICA study.
b) VAT reduction
The consumer’s attitude and the incentive’s pros and cons are the same as “VAT reduction” in AC (split).
c) Summary and cost benefit analysis
The recommended incentives for refrigerators in households are summarized in Table 2.3.2-2.
Final Report 2-69

Technical Cooperation Project for Capacity D
evelopment for G
reen Econom
y Policy in Indonesia R
esearch on Green U
rban Developm
ent
Final R
eport 2-70
Table 2.3.2-2 Comparison Incentive Mesures for Refrigerators in HH
:Most recommended, : Second recommended, :Not recommended, ×: Not recommended --: Already implemented Net benefit is estimated only for incentive with for both existing and new building categories, as the annual average of 10 year costs/benefits.
Households (HH): Refrigerator
Category All types of households
Incentive Direct Subsidies (rebate) Import Duty Exemption/ Reduction VAT Exemption/ Reduction
Objective To promote installment/replacement of refrigerator with Energy efficient labelling of 4 stars in households.
Target The specification of all refrigerator sold in 2025 will be energy efficient labelling 4 star level.
Recommendation (450VA/900VA HH only) -
Reason High impact on consumer’s purchasing behavior, but heavy fiscal burden and high administration cost on the government. But could be effective to change 450 and 900 VA household segment.
Already exempted. Relatively easy to implement and high impact on consumer’s purchasing behavior.
Other country’s experience Japan: Eco-point program When a refrigerator with high EE labelling is purchased, provide the eco-point to be exchanged with various goods and service.
-- Malaysia: Sales tax exempted for EE electrical appliance such as refrigerator certified by Energy Commission
Issue to consider The mechanism to avoid misuse is essential. - The mechanism to avoid misuse is essential.
Net Benefits
For the government
For all sectors: Rp. 237,564 million (Annual) (Algorithm *1) Only for HH: Rp.175,981 million (Annual) - For all sectors: Rp. 271,164 million (Annual) (Algorithm *2)
Only for HH: Rp. 192,781 million (Annual)
For household For all sectors: Rp. 412,990 million (Annual) (Algorithm *1) Only for HH: Rp. 156,976 million (Annual) - For all sectors: Rp. 448,740 million (Annual) (Algorithm *2)
Only for HH: Rp. 174,851 million (Annual)
Technical Cooperation Project for Capacity Development for Green Economy Policy in Indonesia Research on Green Urban Development
(Conditions for calculation)
General assumption for Refrigerator Operating hours: 7 hours/day, Operating days: 300 days/year Electric capacity (Average): 800 kWh/year, # of refrigerators with 4 stars level specification/total # of refrigerators sold = 40% in 2016 => expanding to 100% in 2025 (Conversion ratio to a refrigerator with high EE label by incentive: 30%/yr (average till 2025) (excluding BAU) /53.33%/yr(average till 2020, over incentive period)), Energy saving by conversion to a refrigerator with high EE label: 23%, Maintenance cost over 10 years: 15% of investment cost VAT exemption: 10%, Incentive provided for 5 years Useful life of refrigerator: 10 years *1 Rebates Assumption Average price for a refrigerator with high EE label Rp. 2 million (plus VAT), Price difference between with/without invertors: Rp. 0.5 million/unit (plus VAT) Rebate: 10% of unit price, Commission to PLN for rebate program: 1% of unit price <For all segments> Assumption Electricity subsidy (Average) Rp. 521 /kWh, Average electricity tariff: Rp. 974 /kWh, 3 million units sold (based on actual) Government Benefits (Annual) = [Average energy saving (Annual)] * [Electricity Subsidy]
[3,000,000 units*30%*10 years*800 kWh*23%*10/2/10]*Rp. 521 /kWh=Rp. 431,164 million Costs (Annual) = ([Number of equipment over incentive period]*[unit price]*[Rebate rate + Commission
to PLN])/10 yrs (3,000,000 units*53.33%*5 years*Rp. 2.2 million*(10%+1%))/10 years=Rp. 193,600 million
Net benefit (Annual) Rp. 431,164 million - Rp. 193,600 million = Rp. 237,564 million
Households Benefits (Annual) = [Electricity cost reduction]+[Rebate] = [Average energy saving (Annual)] *
[Electricity tariff] + ([Number of equipment over incentive period]*[unit price]*[Rebate rate])/10 years [3,000,000 units*30%*10 years*800 kWh*23%*10/2/10]*Rp. 974 /kWh +Rp. 176,000 million = Rp. 982,240 million
Costs (Annual) = [[Accumulated numbers of equipment over 10 years]*[price increase]*1.15] / Useful life 3,000,000 units*30%*10 years*Rp. 0.55 million*1.15/10 years = Rp. 569,250 million
Net benefit (Annual) Rp. 982,240 million - Rp. 569,250 million = Rp. 412,990 million
<Only for households> Assumption Electricity subsidy (Average) Rp. 659 /kWh, Average electricity tariff: Rp. 854 /kWh, Half of 3 million units sold is for households. Government Benefits = [Average energy saving (Annual)] * [Electricity Subsidy]
[1,500,000 units*30%*10 years*800 kWh*23%*10/2/10]*Rp. 659 /kWh=Rp. 272,781 million
Final Report 2-71
Technical Cooperation Project for Capacity Development for Green Economy Policy in Indonesia Research on Green Urban Development
Costs (Annual) = ([Number of equipment over incentive period]*[unit price]*[Rebate rate + Commission
to PLN])/10 yrs (1,500,000 units*53.33%*5 years* Rp. 2.2 million*(10%+1%))/10 years = Rp. 96,800 million
Net benefit (Annual) Rp. 272,781 million - Rp. 96,800 million = Rp. 175,981 million
Households Benefits (Annual) = [Electricity cost reduction]+[Rebate] = [Average energy saving (Annual)] *
[Electricity tariff] + ([Number of equipment over incentive period]*[unit price]*[Rebate rate])/10 years [1,500,000 units*30%*10 years*800 kWh*23%*10/2/10]*Rp. 854 /kWh+Rp. 88,000 million = Rp. 441,601 million
Costs (Annual) = [[Accumulated numbers of equipment over 10 years]*[price increase]*1.15] / Useful life 1,500,000 units*30%*10 years*Rp. 0.55 million*1.15/10 years = Rp. 284,625 million
Net benefit (Annual) Rp. 441,601 million - Rp. 284,625million = Rp. 156,976 million
*2 VAT Exemption Assumption Average price for a refrigerator with high EE label Rp. 2 million (without VAT), Price difference between with/without invertors: Rp. 0.5 million/unit (without VAT) VAT reduction: 10% <For all segments> Assumption Average price for a refrigerator with high EE label Rp. 2 million (without VAT), Price difference between with/without invertors: Rp. 0.5 million/unit (without VAT), Electricity subsidy (Average) Rp. 521 /kWh, Average electricity tariff: Rp. 974 /kWh (weighted average of B-class and R-class), 3 million units sold (based on actual) Government Benefits (Annual) = [Average energy saving (Annual)] * [Electricity Subsidy]
[3,000,000 units*30%*10 years*800 kWh*23% *10/2/10]*Rp. 521 /kWh = Rp. 431,164 million Costs (Annual) = ([Number of equipment over incentive period]*[unit price]*[VAT rate]) / 10 years
(3,000,000 units*53.33%*5 years* Rp. 2 million*10%)/10 years = Rp. 160,000 million Net benefit (Annual)
Rp. 431,164 million - Rp. 160,000 million = Rp. 271,164 million Households Benefits (Annual) = [Electricity cost reduction]+[VAT reduction] = [Average energy saving (Annual)] *
[Electricity tariff] + ([Number of equipment over incentive period]*[unit price]*[VAT rate])/10 years [3,000,000 units*30%*10 years*800 kWh*23%*10/2/10]*Rp. 974 /kWh+Rp. 160,000 million = Rp. 966,240 million
Costs (Annual) = [[Accumulated numbers of equipment over 10 years]*[price increase]*1.15] / Useful life 3,000,000 units*30%*10 years*Rp. 0.5 million*1.15/10 years = Rp. 517,500 million
Net benefit (Annual) Rp. 966,240 million - Rp. 517,500 million = Rp. 448,740 million
Final Report 2-72
Technical Cooperation Project for Capacity Development for Green Economy Policy in Indonesia Research on Green Urban Development
<Only for households> Assumption Electricity subsidy (Average) Rp. 659 /kWh, Average electricity tariff: Rp. 854 /kWh (Weighted average of R-class), Half of 3 million units sold is for households. Government Benefits (Annual) = [Average energy saving (Annual)] * [Electricity Subsidy]
[1,500,000 units*30%*10 years*800 kWh*23%*10/2/10]*Rp. 659 /kWh=Rp. 272,781 million Costs (Annual) = ([Number of equipment over incentive period]*[unit price]*[VAT rate])/10 years
(1,500,000 units*53.33%*5 years*Rp. 2million*10%)/10 years = Rp. 80,000 million Net benefit (Annual)
Rp. 272,781 million - Rp. 80,000 million = Rp. 192,781 million Households Benefits (Annual) = [Electricity cost reduction]+[VAT reduction] = [Average energy saving (Annual)] *
[Electricity tariff] + ([Number of equipment over incentive period]*[unit price]*[VAT rate])/10 years [1,500,000 units*30%*10 years*800 kWh*23%*10/2/10]*Rp. 854 /kWh +Rp. 80,000 million = Rp. 433,601 million
Costs (Annual) = [[Accumulated numbers of equipment over 10 years]*[price increase]*1.15] / Useful life 1,500,000 units*30%*10 years*Rp. 0.5 million*1.15/10 years = Rp. 258,750 million
Net benefit (Annual) Rp. 433,601 million - Rp. 258,750 million = Rp.174,851 million
Final Report 2-73
Technical Cooperation Project for Capacity Development for Green Economy Policy in Indonesia Research on Green Urban Development
2.3.3 Notes on the Cost Benefit Analysis
The cost benefit analysis above is the simplified estimation, based on the electricity tariff and subsidy in January 2015.
Also, the cost benefit analysis above is simplified one and the detailed examination of the assumptions is necessary upon implementation of incentives. All the manufacturers, to whom JICA Syudy Team interviewed, showed positive reactions to give incenthive for a little more expencive and high quality appliances. Additionally split Acs with inverter and refrigerators with 4stars are provided by not only foreign manufacturers but also Indonesian domestic manufacturers.
2.3.4 Summary and Issues to Be Considered
The Table 2.3.4-1 summarizes the proposed technology’s power consumption and GHG emission reduction. All these technologies/policies have the large impacts on energy efficiency promotion in Indonesia. Especially, ACs (split) and ACs (package (VRV), chiller) and refrigerators has the large reduction volume.
Final Report 2-74
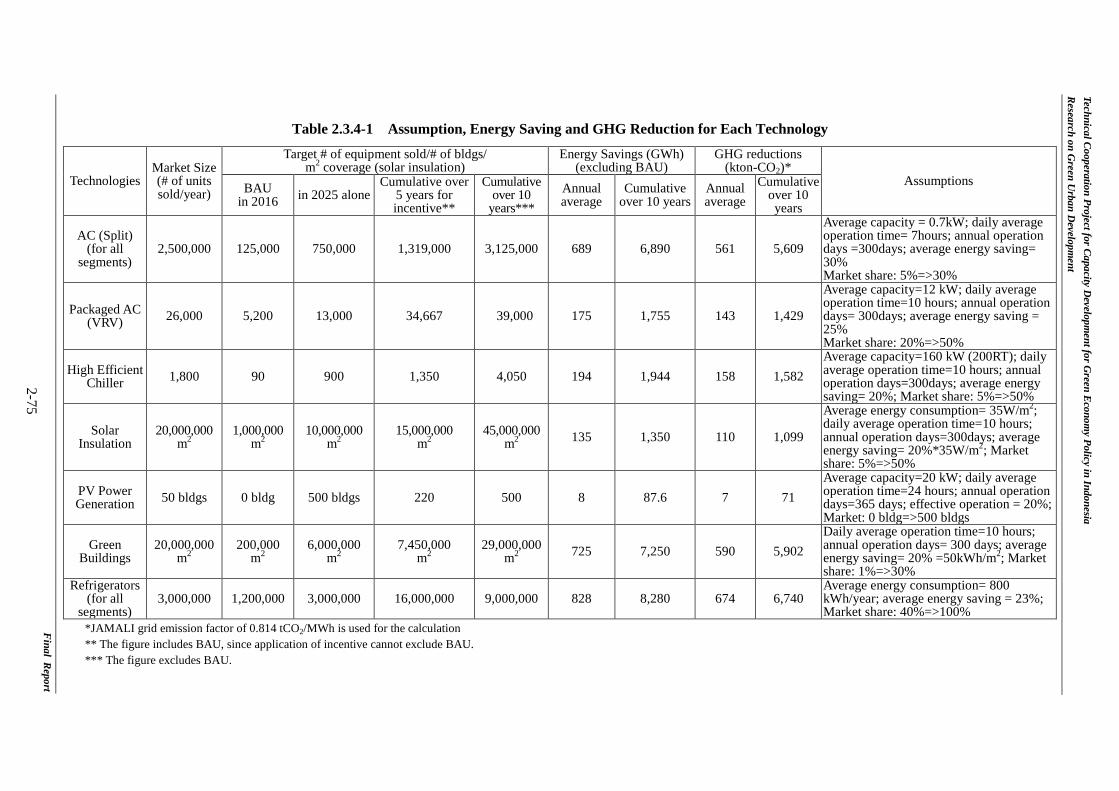
Technical Cooperation Project for Capacity Developm
ent for Green E
conomy Policy in Indonesia
Research on G
reen Urban D
evelopment
Final R
eport 2-75
Table 2.3.4-1 Assumption, Energy Saving and GHG Reduction for Each Technology
*JAMALI grid emission factor of 0.814 tCO2/MWh is used for the calculation ** The figure includes BAU, since application of incentive cannot exclude BAU. *** The figure excludes BAU.
Technologies Market Size (# of units sold/year)
Target # of equipment sold/# of bldgs/ m2 coverage (solar insulation)
Energy Savings (GWh) (excluding BAU)
GHG reductions (kton-CO2)*
Assumptions BAU in 2016 in 2025 alone
Cumulative over 5 years for incentive**
Cumulative over 10
years*** Annual average
Cumulative over 10 years
Annual average
Cumulative over 10 years
AC (Split) (for all
segments) 2,500,000 125,000 750,000 1,319,000 3,125,000 689 6,890 561 5,609
Average capacity = 0.7kW; daily average operation time= 7hours; annual operation days =300days; average energy saving= 30% Market share: 5%=>30%
Packaged AC (VRV) 26,000 5,200 13,000 34,667 39,000 175 1,755 143 1,429
Average capacity=12 kW; daily average operation time=10 hours; annual operation days= 300days; average energy saving = 25% Market share: 20%=>50%
High Efficient Chiller 1,800 90 900 1,350 4,050 194 1,944 158 1,582
Average capacity=160 kW (200RT); daily average operation time=10 hours; annual operation days=300days; average energy saving= 20%; Market share: 5%=>50%
Solar Insulation
20,000,000 m2
1,000,000 m2
10,000,000 m2
15,000,000 m2
45,000,000 m2 135 1,350 110 1,099
Average energy consumption= 35W/m2; daily average operation time=10 hours; annual operation days=300days; average energy saving= 20%*35W/m2; Market share: 5%=>50%
PV Power Generation 50 bldgs 0 bldg 500 bldgs 220 500 8 87.6 7 71
Average capacity=20 kW; daily average operation time=24 hours; annual operation days=365 days; effective operation = 20%; Market: 0 bldg=>500 bldgs
Green Buildings
20,000,000 m2
200,000 m2
6,000,000 m2
7,450,000 m2
29,000,000 m2 725 7,250 590 5,902
Daily average operation time=10 hours; annual operation days= 300 days; average energy saving= 20% =50kWh/m2; Market share: 1%=>30%
Refrigerators (for all
segments) 3,000,000 1,200,000 3,000,000 16,000,000 9,000,000 828 8,280 674 6,740
Average energy consumption= 800 kWh/year; average energy saving = 23%; Market share: 40%=>100%

Technical Cooperation Project for Capacity Development for Green Economy Policy in Indonesia Research on Green Urban Development
In order to promote these equipment and policies, the recommended incentive program is shown in Table 2.3.4-2
Table 2.3.4-2 Summary of Cost Benefit Analysis
Target Technologies Company type Building type Proposed incentive
Office building AC (Split) Listed companies Existing - Promotion of lease - VAT reduction/exemption New
Non-listed companies
Existing - Eco-lease (Direct subsidy) - VAT reduction/exemption New
AC (Package/ Chiller)
Listed companies Existing - Promotion of lease - Low interest loan
New - Promotion of lease - Import duty exemption/
reduction - VAT reduction/exemption - Low interest loan
Non-listed companies
Existing - Low interest loan - Guarantee
New - Import duty exemption/ reduction
- VAT reduction/exemption - Low interest loan - Guarantee
Solar insulation All companies Existing - VAT reduction/exemption New
PV power generation
All companies Existing - Promotion of lease - Low interest loan New
Green building All companies Existing - Land/building tax reduction/ exemption
- Guarantee New - Land/building tax reduction/
exemption - Low interest loan
Household AC (Split) All household Common - VAT reduction/exemption Refrigerator All household Common - VAT reduction/exemption
The net benefit obtained from these incentive programs’ introduction is shown in Table 2.3.4-3 (the figures are extracted from the incentive comparison table above by equipment):
Final Report 2-76

Technical Cooperation Project for Capacity Development for Green Economy Policy in Indonesia Research on Green Urban Development
Table 2.3.4-3 Net Benefits from Incentive Program Implementation
Technologies Proposed incentive Assumption Net benefits (Annual, Average)
AC (Split) for all segments
Promotion of lease Awareness raising only
Gov’t Rp. 170,323 million Private Rp.835,336 million
Eco-lease (Direct subsidy)
3.5% of lease fee subsidy for 5 years
Gov’t Rp. 70,323 million
Private Rp. 844,630 million
VAT reduction/exemption
10% VAT reduction
Gov’t Rp. 312,635 million Private Rp. 357,759 million
Package AC (VRV)
Promotion of lease Awareness raising only
Gov’t Rp. 17,911 million Private Rp. 243,641 million
Low interest loan 2% interest subsidy for 3 years
Gov’t Rp. 5,708 million
Private Rp. 67,771 million
High Efficient Chiller
Promotion of lease Awareness raising only
Gov’t Rp. 19,840 million Private Rp. 237,570 million
Low interest loan 2% interest subsidy for 3 years
Gov’t Rp. 13,900 million
Private Rp. 129,405 million
Solar insulation
VAT reduction/exemption
9% VAT reduction
Gov’t Rp. 278 million Private Rp. 64,052 million
PV power generation
Promotion of lease Awareness raising only
Gov’t Rp. 4,470 million Private Rp. 59,861 million
Low interest loan 2% interest subsidy for 5 years
Gov’t Rp. 531 million
Private For all blgs. Rp. 4,390 million
Per building Rp. 88 million
Green buildings
Land/Building Tax reduction/exemption
0.16% reduction
Gov’t Rp. 2,524 million
Private For all blgs. Rp. 796,508 million Per floor area Rp.0.26 million/m2
Refrigerator (For all segments)
VAT reduction/exemption
10% VAT reduction
Gov’t Rp. 271,164 million
Private Rp. 448,740 million
To design each incentive program in the days ahead, the following issues need to be noted. (a) Exemption of VAT is easy to manage compared with rebate program. However, VAT rate is the
upper ceiling of exemption. To change the consumer’s behavior, whether 5% or 10% VAT reduction/exemption is sufficient need to be fully examined. On the other hand, the rebates can set the amount without restriction like the upper ceiling of VAT’s rate. However, the commission to PLN or retailers for rebate provision is necessar. (i) The price difference between the standard and energy efficient models and (ii) the difference of discount rate by VAT and rebate of AC (split) and refrigerator are summarized in Table 2.3.4-4.
Final Report 2-77
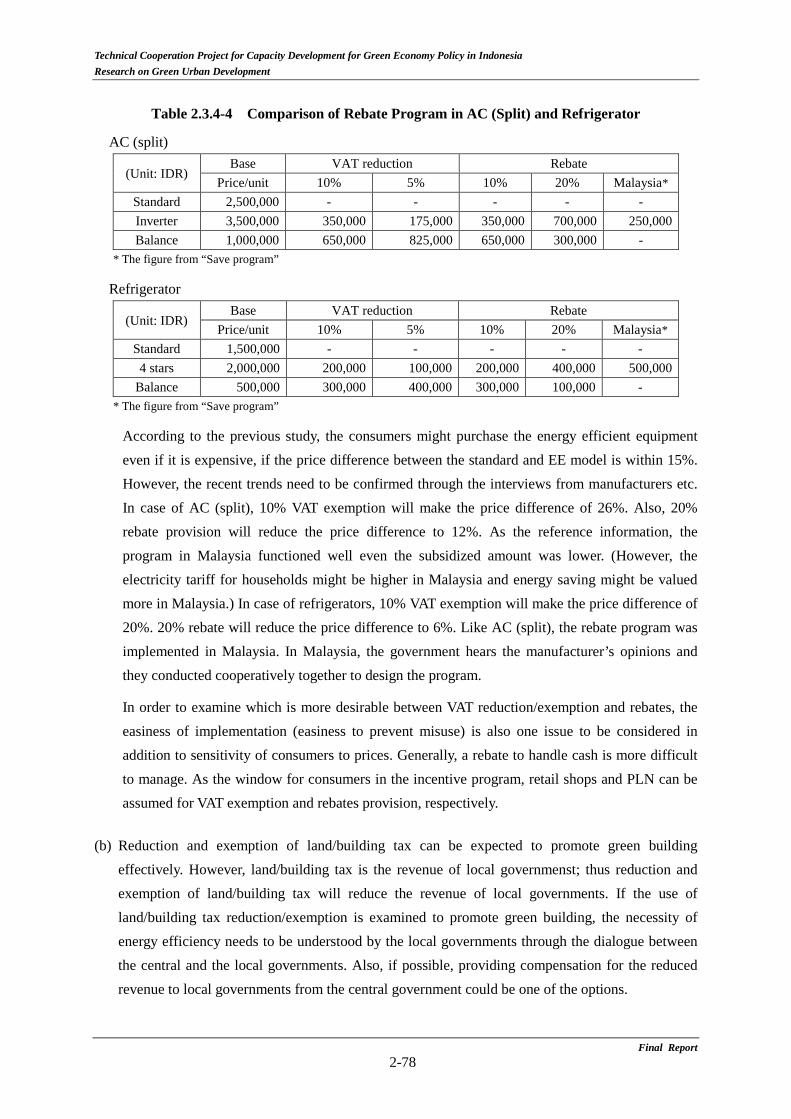
Technical Cooperation Project for Capacity Development for Green Economy Policy in Indonesia Research on Green Urban Development
Table 2.3.4-4 Comparison of Rebate Program in AC (Split) and Refrigerator
AC (split)
(Unit: IDR) Base VAT reduction Rebate
Price/unit 10% 5% 10% 20% Malaysia* Standard 2,500,000 - - - - - Inverter 3,500,000 350,000 175,000 350,000 700,000 250,000 Balance 1,000,000 650,000 825,000 650,000 300,000 -
* The figure from “Save program”
Refrigerator
(Unit: IDR) Base VAT reduction Rebate
Price/unit 10% 5% 10% 20% Malaysia* Standard 1,500,000 - - - - - 4 stars 2,000,000 200,000 100,000 200,000 400,000 500,000
Balance 500,000 300,000 400,000 300,000 100,000 - * The figure from “Save program”
According to the previous study, the consumers might purchase the energy efficient equipment even if it is expensive, if the price difference between the standard and EE model is within 15%. However, the recent trends need to be confirmed through the interviews from manufacturers etc. In case of AC (split), 10% VAT exemption will make the price difference of 26%. Also, 20% rebate provision will reduce the price difference to 12%. As the reference information, the program in Malaysia functioned well even the subsidized amount was lower. (However, the electricity tariff for households might be higher in Malaysia and energy saving might be valued more in Malaysia.) In case of refrigerators, 10% VAT exemption will make the price difference of 20%. 20% rebate will reduce the price difference to 6%. Like AC (split), the rebate program was implemented in Malaysia. In Malaysia, the government hears the manufacturer’s opinions and they conducted cooperatively together to design the program.
In order to examine which is more desirable between VAT reduction/exemption and rebates, the easiness of implementation (easiness to prevent misuse) is also one issue to be considered in addition to sensitivity of consumers to prices. Generally, a rebate to handle cash is more difficult to manage. As the window for consumers in the incentive program, retail shops and PLN can be assumed for VAT exemption and rebates provision, respectively.
(b) Reduction and exemption of land/building tax can be expected to promote green building
effectively. However, land/building tax is the revenue of local governmenst; thus reduction and exemption of land/building tax will reduce the revenue of local governments. If the use of land/building tax reduction/exemption is examined to promote green building, the necessity of energy efficiency needs to be understood by the local governments through the dialogue between the central and the local governments. Also, if possible, providing compensation for the reduced revenue to local governments from the central government could be one of the options.
Final Report 2-78