technical briefing national senior certificate of...- progressed learners in grade 12, average of...
TRANSCRIPT

TECHNICAL BRIEFING
National Senior Certificate results of the class of 2014
Presentation by
Dr SNP Sishi
Superintendent-General
Head of Department: Education
Republic of South Africa

the transformation of the schooling system in
KZN
1. Incremental introduction of CAPS from 2012 starting with Foundation Phase and
Grade 10;
2. The final rollout of CAPS was in 2014 making the group under review to be the first
cohort to have sat for this examination;
3. The introduction of CAPS brought about certain changes in different subjects.
- In Mathematics, topics that were previously optional viz. Euclidean Geometry and
Probability have been made compulsory and incorporated into Paper 1 and 2 of
the core curriculum.
- The cognitive demand of Economics prompted that the question paper be divided
into two papers.
- The incremental decrease of 1% in the implementation of the Language
Compensation Policy.

the class of 2014
- First FET to write the CAPS aligned examinations
- Seventh cohort to sit for the NSC
- Cohort has benefited from the maturity of the system accumulated over
the last six years.
- Greatest benefit for the cohort was the focus on ECD strengthening the
foundations
- Single curriculum in each band, the RNCS and the NCS.
- Progressed learners in Grade 12, average of 3000 learners per province,
resulting in almost 30 000 in the country.

Preparation for CAPS
• the department implemented a curriculum management strategy;
which focussed on:
- delivery of CAPS documents to schools;
- training of Subject Advisors;
- teacher training;
- delivery of Learner Teacher Support Material aligned to CAPS;
- supply of equipment and;
- continuous monitoring by Head Office and Districts.

Magnitude and size

Examination Administration
1. 139 367 wrote
2. 1716 examination centres
3. 29 marking centres
4. 7685 Markers
5. 1532 Senior Markers
6. 214 Deputy Chief Markers
7. 73 Chief Markers
8. 71 Internal Moderators
9. More than 2,3 million scripts
10. 450 concessions

Number of Schools by Sector and Level in 2014
Ownership Primary Secondary Combined
Total
Ordinary LSEN TOTAL
Public 3719 1543 650 5912 69 5981
Independent 79 40 117 236 4 240
Both 3798 1583 767 6148 73 6221

Number of learners, educators and schools by district in 2014
(Public Ordinary Schools only)
DISTRICT Public Ordinary Schools Independent Ordinary Schools
Learners1 Teachers2 Schools Learners Teachers Schools
Amajuba 131 774 4 362 241 1 201 114 8
Ilembe 163 023 5 522 426 1 396 114 4
Pinetown 323 508 10 958 491 13 450 1 093 41
Sisonke 142 213 5 132 441 1 836 111 11
Ugu 197 730 6 817 486 4 217 310 16
Umgungundlovu 216 946 7 525 494 13 186 1 031 50
Umkhanyakude 223 128 7 272 537 1 749 112 7
Umlazi 315 554 11 464 467 14 947 1 214 51
Umzinyathi 183 000 5 837 494 1 125 120 7
Uthukela 194 625 6 429 444 2 090 162 12
Uthungulu 276 581 9 329 653 3 757 272 16
Zululand 269 140 9 021 738 2 962 148 13
Province 2 637 222 89 668 5 912 61 916 4 801 236

Overall National Performance

0
10
20
30
40
50
60
70
80
9084.6 84.2 82.8 82.2
79.1 76.4
72.9 69.7
65.4
75.8
2014 National pass rate

0
5000
10000
15000
20000
25000
30000
35000
40000
Gauteng Western Cape Limpopo KwaZulu-Natal
36848
18524
16325
35724
National Contribution of Bachelor passes in 2014

Overall Provincial Performance

0
20000
40000
60000
80000
100000
120000
140000
160000
enrolled wrote achieved
147726 139367
97144
Overall Performance
2014

10000
20000
30000
40000
50000
60000
70000
80000
90000
100000
110000
120000
2008 2009 2010 2011 2012 2013 2014
82478 80704
86556 83201
93003
111500
97144
Number passes from 2008 - 2014
Achieved

142756
132176
122444
122126
127253
145000
139367
82478
80704
86556
83201
93003
111500
97144
10000 20000 30000 40000 50000 60000 70000 80000 90000100000110000120000130000140000150000160000
2008
2009
2010
2011
2012
2013
2014
Number of passes from 2008 - 2014
Achieved No. Wrote
2nd highest passes since
inception of NSC

0
20 000
40 000
60 000
80 000
100 000
120 000
Achieved Achieved Achieved Achieved Achieved Achieved
2008 2009 2010 2011 2012 2013
GP 70 822 70871 72538 69216 75214 85122
KZN 78 747 80733 86556 83204 93003 112403
LP 45 958 40776 54771 47091 51745 59184
WC 34 479 34017 34831 33110 36974 40542
Nu
mb
er o
f le
arn
ers
Comparison of the contribution of the KZN to the skills base of the country
since 2008.
The province has contributed 534646 learners into the country’s skills base in a period of six (6) years,
greater than any other province. With the inclusion of passes in 2014, the total contribution will be
628790

0
20000
40000
60000
80000
100000
120000
140000
160000
wrote Achieved wrote achieved
2008 2014
KZN 142756 82478 139367 97144
Nu
mb
er o
f le
arn
ers
Comparison of the 2008 NSC and 2014 CAPS baselines

0
10
20
30
40
50
60
70
80
2008 2009 2010 2011 2012 2013 2014
57.8 61.1
70.7 68.1
73.1
77.4
69.7
KZN Provincial Pass rate: 2008 - 2014 compared
NCS INCEPTIO N
NEW BASELINE CAPS
QUANTUM OF SYSTEM MATURITY

0
20000
40000
60000
80000
100000
120000
140000
Wrote Bachelors Diploma H. Cert NSC Achieved
Wrote Bachelors Diploma H. Cert NSC Achieved
2014 139367 35724 39751 21544 125 97144
Types of Performance in 2014

0
20 000
40 000
60 000
80 000
100 000
120 000
140 000
160 000
180 000
200 000
63 606
40 921
159 857
182 689
111 059
57 180 48 296
20 119
94 256
Total Contribution of KZN towards bachelor passes since 2008 -2013
EC FS GP KZN LP MP NW NC WC

18.2
19.9
25.7
22.4
27.3
32.5
25.7
0 5 10 15 20 25 30 35
Comparison of bachelor pass rate 2008 - 2014 in KZN
2014
2013
2012
2011
2010
2009
2008
NEW CAPS
INCEPTION OF NCS

Type of performance in different quintiles
Quintile Entered Wrote Bachelor Diploma H-Cert NSC
6486 6063 2611 1434 764 2
1 24291 23210 5001 6690 4580 55
2 32305 31008 7508 9264 5672 39
3 33968 32964 8718 9751 5588 12
4 25256 24711 8975 7797 3269 5
5 27648 27322 14389 7824 2455 0
Total 149954 145278 47202 42760 22328 113

Provincial Performance per gender

0
20000
40000
60000
80000
100000
120000
140000
total wrote achieved
female 139367 74720 64647
male 97144 51496 45648
Performance per gender

19530 20402
11521
43
16194
19349
10023
82
0
5000
10000
15000
20000
25000
Total Achieved Bachelor Total Achieved Diploma Total Achieved H-Cert Total Achieved NSC
Types of performance per gender
Female Male

SNQ Gender Total Entered Total Wrote Total Achieved Pass rate
1 Female 12879 11516 6300 54.71
1 Male 11118 10262 5957 58.05
2 Female 18235 16766 10726 63.97
2 Male 15436 14542 9837 67.65
3 Female 19475 18476 11935 64.60
3 Male 17239 16486 11206 67.97
4 Female 12205 11853 9060 76.44
4 Male 10313 10087 7730 76.63
5 Female 12859 12598 11025 87.51
5 Male 10709 10477 8915 85.09
Female 3842 3511 2450
69.78
Male 3045 2793 2003
71.72
Performance by gender in the different quintile of schools

0.00
10.00
20.00
30.00
40.00
50.00
60.00
70.00
80.00
90.00
Female Male Female Male Female Male Female Male Female Male Female Male
1 2 3 4 5
Pass rate 69.78 71.72 54.71 58.05 63.97 67.65 64.60 67.97 76.44 76.63 87.51 85.09
Pass rate per gender in different quintiles

Provincial Performance in different
categories

164
412 416
325 341
90 107
211
362
522
455
81
0
100
200
300
400
500
600
0-19.9% 20-39.9% 40-59.9% 60-79.9% 80-99.9% 100%
Performance of schools in different categories - 2008 and 2014 baselines compared
2008 2014

0-19.9% 6%
20-39.9% 12%
40-59.9% 21%
60-79.9% 30%
80-100% 26%
100% 5%
Other 31%
Performance rate of schools in different categories

Performance per quintile

Categories of performance of learners by quintile ranking of
schools
Quintile 0-19.9% 20-29.9% 30-39% 40-49% 50-59% 60-69% 70-79% 80 - 99% 100%
1 43 37 45 51 56 67 60 59 16
2 33 22 35 41 65 80 63 123 19
3 7 14 24 26 63 68 77 88 7
4 0 1 3 8 15 26 30 79 5
5 0 0 3 0 5 13 25 99 9
Undefin
ed 4 5 7 11 12 7 7 31 37
Total 87 79 117 137 216 261 262 479 93

Q1 Q2 Q3 Q4 Q5 undefined
wrote 21778 31308 34962 21940 23075 6304
Achieved 12257 20563 23141 16790 19940 4453
0
5000
10000
15000
20000
25000
30000
35000
40000
Nu
mb
er o
f le
arn
ers
Performance per quintile

0
5
10
15
20
25
30
35
40
100%
16
19
7 5
9
37
Number of schools in different categories per Quintile
Quintile 1 Quintile 2 Quintile 3 Quintile 4 Quintile 5 undefined

0
20
40
60
80
100
120
140
0 - 19.99 20 - 39.99 40 - 49.99 50 - 69.99 70 - 79.99 80 -99.99 100
43
82
51
123
60 59
16
Number of schools in Quintile 1
Quintile 1

0
20
40
60
80
100
120
140
160
0 - 19.99 20 - 39.99 40 - 49.99 50 - 69.99 70 - 79.99 80 -99.99 100
33
57
41
145
63
123
19
Performance of schools in Quintile 2
Quintile 2

0
20
40
60
80
100
120
140
0 - 19.99 20 - 39.99 40 - 49.99 50 - 69.99 70 - 79.99 80 -99.99 100
7
38
26
131
77
88
7
The number of schools in quintile 3 by pass rate interval
Quintile 3

0
10
20
30
40
50
60
70
80
0 - 19.99 20 - 39.99 40 - 49.99 50 - 69.99 70 - 79.99 80 -99.99 100
0
4
8
41
30
79
5
The number of schools in quintile 4 by pass rate interval
Quintile 4

0
10
20
30
40
50
60
70
80
90
100
0 - 19.99 20 - 39.99 40 - 49.99 50 - 69.99 70 - 79.99 80 -99.99 100
0 3
0
18
25
99
9
The number of schools in quintile 5 by pass rate interval
Quintile 5

Subject Performance

0.0
10.0
20.0
30.0
40.0
50.0
60.0
70.0
%Achieved % achieved
2008 2014
Nu
mb
er o
f le
arn
ers
2008 2014%Achieved % achieved
ACCN Achieved 61.0 62.95
40% and above 32.0 39.15
Accounting

0.0
10.0
20.0
30.0
40.0
50.0
60.0
70.0
80.0
%Achieved % achieved
2008 2014
Nu
mb
er o
f le
arn
ers
2008 2014%Achieved % achieved
AGRIS Achieved 59.0 78.04
40% and above 19.0 50.55
Agricultural Science

0.0
10.0
20.0
30.0
40.0
50.0
60.0
70.0
80.0
%Achieved % achieved
2008 2014
Nu
mb
er o
f le
arn
ers
2008 2014%Achieved % achieved
BSTD Achieved 72.0 71.74
40% and above 42.0 48.24
Business Studies

0.0
10.0
20.0
30.0
40.0
50.0
60.0
70.0
80.0
%Achieved % achieved
2008 2014
Nu
mb
er o
f le
arn
ers
2008 2014%Achieved % achieved
ECON Achieved 76.0 69.67
40% and above 54.0 40.80
Economics

0.0
10.0
20.0
30.0
40.0
50.0
60.0
70.0
80.0
%Achieved % achieved
2008 2014
Nu
mb
er o
f le
arn
ers
2008 2014%Achieved % achieved
GEOG Achieved 77.0 76.97
40% and above 40.0 51.89
Geography

0.0
10.0
20.0
30.0
40.0
50.0
60.0
70.0
80.0
90.0
%Achieved % achieved
2008 2014
Nu
mb
er o
f le
arn
ers
2008 2014%Achieved % achieved
HIST Achieved 61.0 89.69
40% and above 34.0 74.05
History

0.0
10.0
20.0
30.0
40.0
50.0
60.0
70.0
80.0
%Achieved % achieved
2008 2014
Nu
mb
er o
f le
arn
ers
2008 2014%Achieved % achieved
LFSC Achieved 65.0 72.73
40% and above 35.0 48.12
Life Sciences

0.0
10.0
20.0
30.0
40.0
50.0
60.0
70.0
80.0
%Achieved % achieved
2008 2014
Nu
mb
er o
f le
arn
ers
2008 2014%Achieved % achieved
MLIT Achieved 74.0 75.86
40% and above 48.0 48.68
Mathematical Literacy

0.0
5.0
10.0
15.0
20.0
25.0
30.0
35.0
40.0
45.0
%Achieved % achieved
2008 2014
Nu
mb
er o
f le
arn
ers
2008 2014%Achieved % achieved
MATHS Achieved 44.0 40.75
40% and above 27.0 24.30
Mathematics

0
10000
20000
30000
40000
50000
60000
70000
80000
EC FS GP KZN LP MP NW NC WC
2011 wrote 38067 10001 32665 61483 35118 19899 9818 3280 14304
2011 achieved 12752 5395 20027 24284 15618 9199 5282 1656 9820
2012 wrote 37038 9512 32682 63168 35044 18835 10344 2864 15387
2012 achieved 14114 6167 23899 30408 18346 9998 6160 1572 11306
2013 wrote 36274 9629 36908 73019 3558 19400 10906 3139 16676
2013 achieved 15753 6847 27150 39151 21088 11301 7350 1810 12216
Achievements in Mathematics: 2011 - 2013
0.0
10.0
20.0
30.0
40.0
50.0
60.0
%Achieved % achieved
2008 2014
Nu
mb
er o
f le
arn
ers
2008 2014%Achieved % achieved
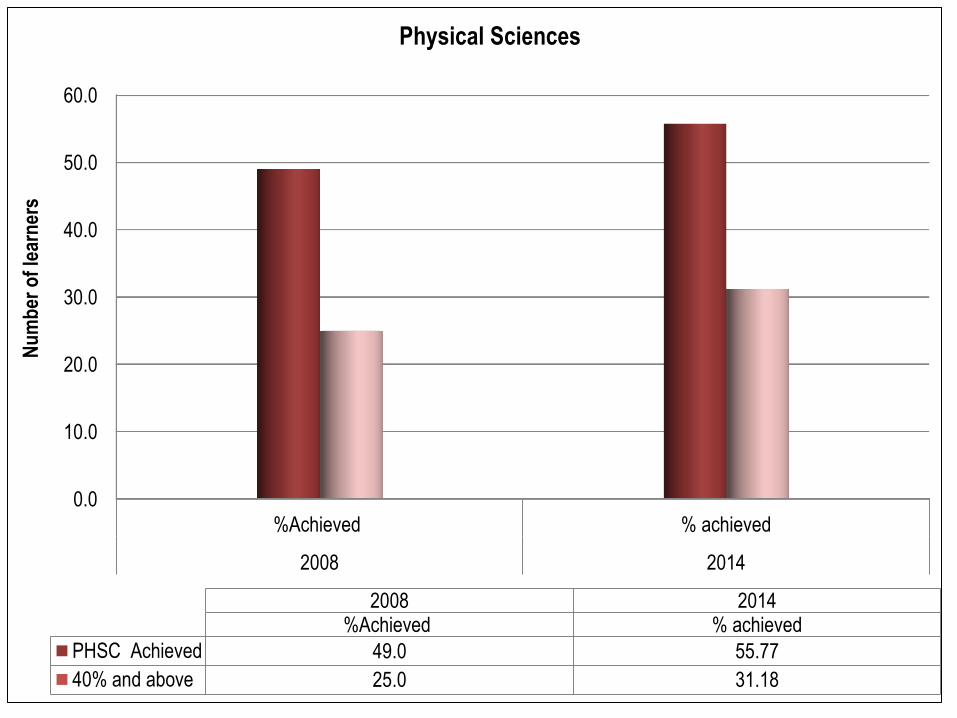
PHSC Achieved 49.0 55.77
40% and above 25.0 31.18
Physical Sciences

0
10000
20000
30000
40000
50000
60000
EC FS GP KZN LP MP NW NC WC
2011 wrote 26367 9901 28605 45340 30874 17280 8624 8624 10927
2011 achieved 12123 5466 17069 23516 16079 9025 4853 1173 7137
2012 wrote 25603 8487 29001 45951 30975 16493 16493 9225 11257
2012 achieved 12911 5820 20335 26783 18566 10426 5769 1324 7984
2013 wrote 25218 8288 29836 50332 30758 16952 16952 8978 11481
2013 achieved 14061 6280 22557 33442 20180 11104 6686 1563 8333
Contributions to Physical Sciences

Alpha
code Subject Description
Total
Entered Total Wrote
Achieved 40-
100% Pass rate
AFRHL Afrikaans Home Language 878 870 843
96.90
ENGHL English Home Language 30155 29788 28212
94.71
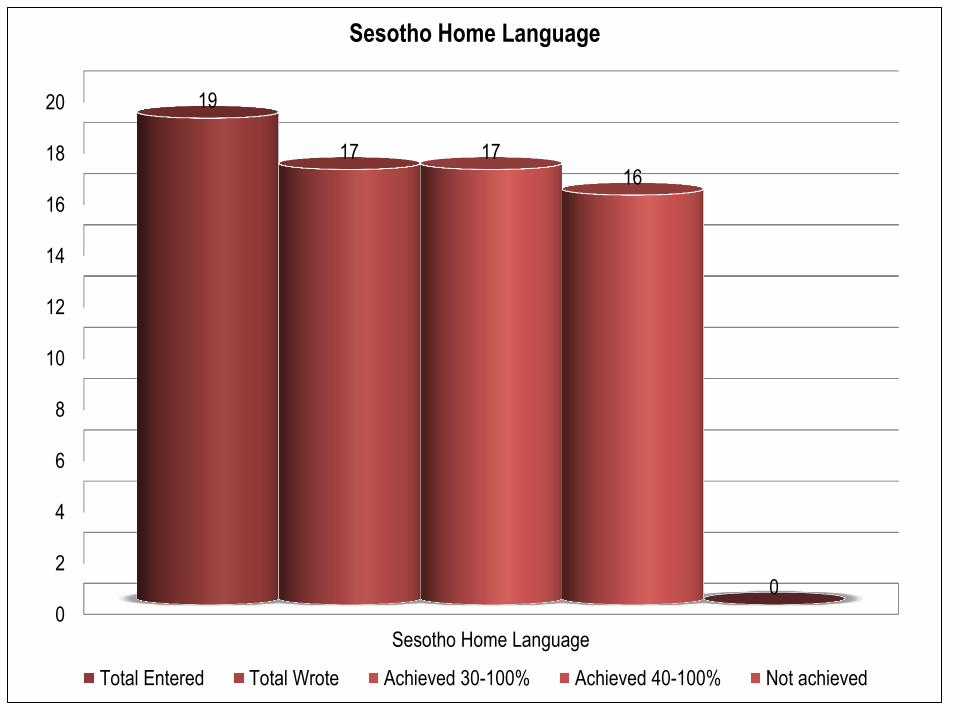
SESHL Sesotho Home Language 19 17 16
94.12
SWAHL SiSwati Home Language 416 392 386
98.47
XHOHL IsiXhosa Home Language 3416 3247 3236
99.66
ZULHL IsiZulu Home Language 113280 109286 108797
99.55
Performance in Home Language

Alpha
code Subject Description
Total
Entered
Total
Wrote
Achieved 30-
100%
Achieved 40-
100% Pass rate
AFRFA Afrikaans First Additional Language 16128 15943 13821 10499
65.85
ENGFA English First Additional Language 117199 112978 108173 86829 76.85
SETFA Setswana First Additional
Language 1 1 1 1
100.00
SWAFA SiSwati First Additional Language 10 8 8 8 100.00
TMLFA Tamil First Additional Language 1 1 1 1 100.00
URDFA Urdu First Additional Language 3 3 3 3 100.00
XHOFA IsiXhosa First Additional Language 148 147 147 147 100.00
ZULFA IsiZulu First Additional Language 13088 12866 12814 12756 99.15
The comparison in performance in First Additional languages

Other Subjects performance

0
2000
4000
6000
8000
10000
12000
14000
16000
18000
Afrikaans First Additional Language
16128 15943
13821
10499
2122
Afrikaans First Additional
Total Entered Total Wrote Achieved 30-100% Achieved 40-100% Not achieved

0
5000
10000
15000
20000
25000
30000
35000
40000
Accounting
39298 37968
23901
14866 14067
Accounting
Total Entered Total Wrote Achieved 30-100% Achieved 40-100% Not achieved

0
100
200
300
400
500
600
700
800
900
Afrikaans Home Language
878 870 867 843
3
Afrikaans Home Language
Total Entered Total Wrote Achieved 30-100% Achieved 40-100% Not achieved

0
200
400
600
800
1000
1200
1400
1600
1800
2000
Afrikaans Second Additional Language
1932 1855 1846
1538
9
Afrikaans Second Additional
Total Entered Total Wrote Achieved 30-100% Achieved 40-100% Not achieved

0
2000
4000
6000
8000
10000
12000
14000
16000
18000
20000
Agricultural Sciences
19794
18837
14701
9522
4136
Afrikaans First Additional
Total Entered Total Wrote Achieved 30-100% Achieved 40-100% Not achieved

0
5
10
15
20
25
30
35
40
45
50
Agricultural Technology
46 44 44
43
0
Agricultural Technology
Total Entered Total Wrote Achieved 30-100% Achieved 40-100% Not achieved
0
10
20
30
40
50
60
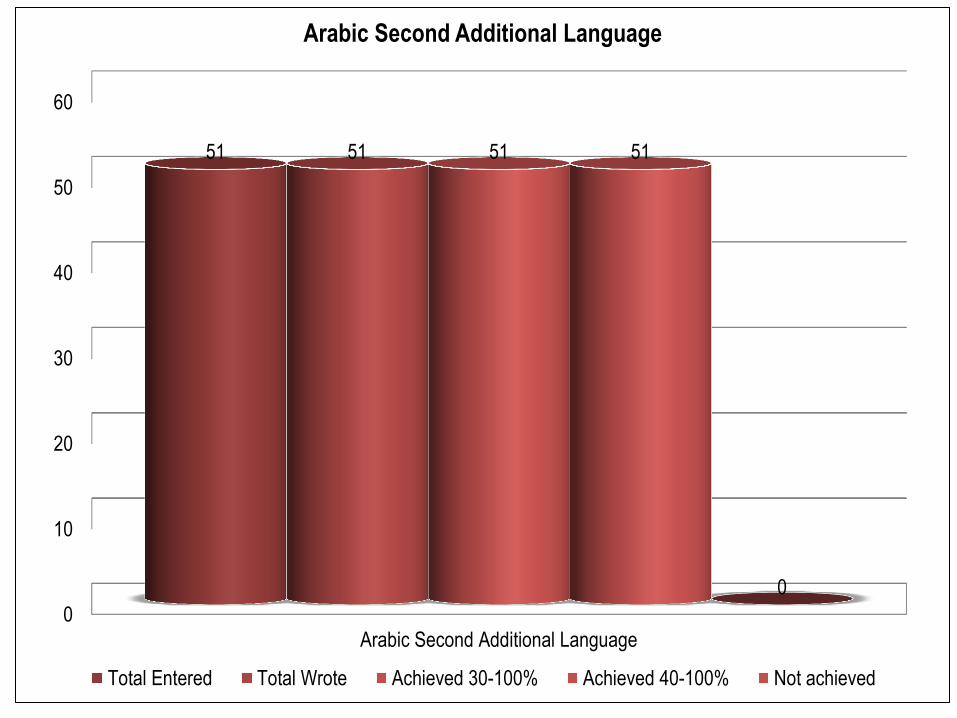
Arabic Second Additional Language
51 51 51 51
0
Arabic Second Additional Language
Total Entered Total Wrote Achieved 30-100% Achieved 40-100% Not achieved

0
10000
20000
30000
40000
50000
60000
70000
Business Studies
62136 60157
43155
29017
17002
Business Studies
Total Entered Total Wrote Achieved 30-100% Achieved 40-100% Not achieved

0
1000
2000
3000
4000
5000
6000
7000
Computer Applications Technology
6063 5874
5059
3277
815
Computer Applications Technology
Total Entered Total Wrote Achieved 30-100% Achieved 40-100% Not achieved
0
1000
2000
3000
4000
5000
6000
7000
8000
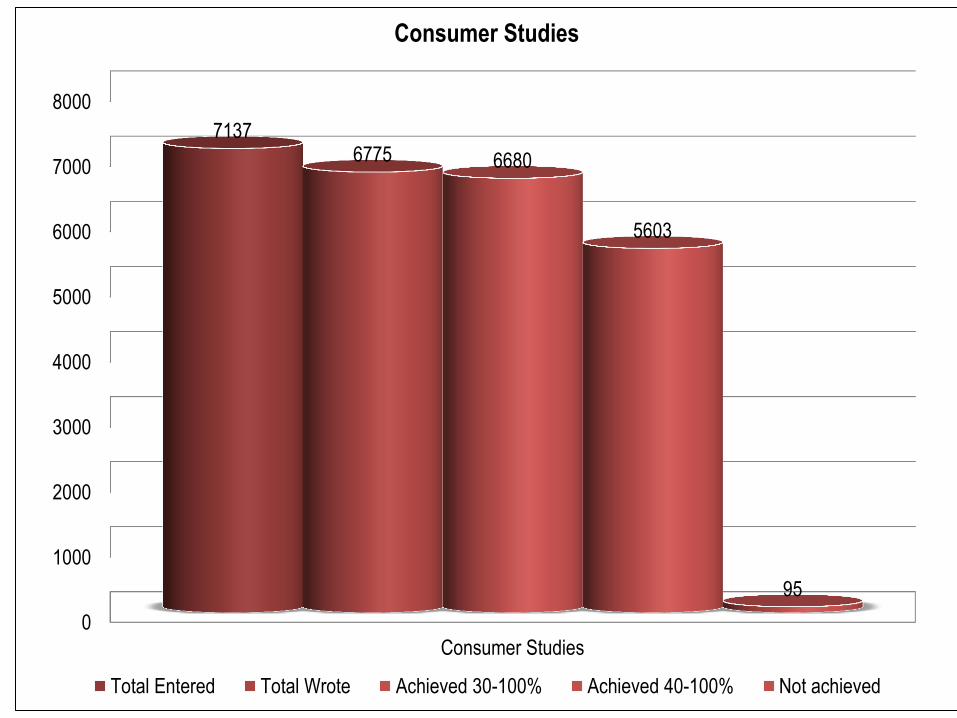
Consumer Studies
7137 6775 6680
5603
95
Consumer Studies
Total Entered Total Wrote Achieved 30-100% Achieved 40-100% Not achieved

0
200
400
600
800
1000
1200
1400
1600
1800
Civil Technology
1761 1738 1669
1334
69
Civil Technology
Total Entered Total Wrote Achieved 30-100% Achieved 40-100% Not achieved

0
10
20
30
40
50
60
70
80
Dance Studies
72 72 72 71
0
Dance Studies
Total Entered Total Wrote Achieved 30-100% Achieved 40-100% Not achieved

0
1000
2000
3000
4000
5000
6000
Dramatic Arts
5320 5174 5126
4817
48
Dramatic Arts
Total Entered Total Wrote Achieved 30-100% Achieved 40-100% Not achieved

0
20
40
60
80
100
120
Design
107
99 97
87
2
Design
Total Entered Total Wrote Achieved 30-100% Achieved 40-100% Not achieved

0
5000
10000
15000
20000
25000
30000
35000
40000
Economics
37637 36230
25241
14781
10989
Economics
Total Entered Total Wrote Achieved 30-100% Achieved 40-100% Not achieved
0
200
400
600
800
1000
1200
1400
1600
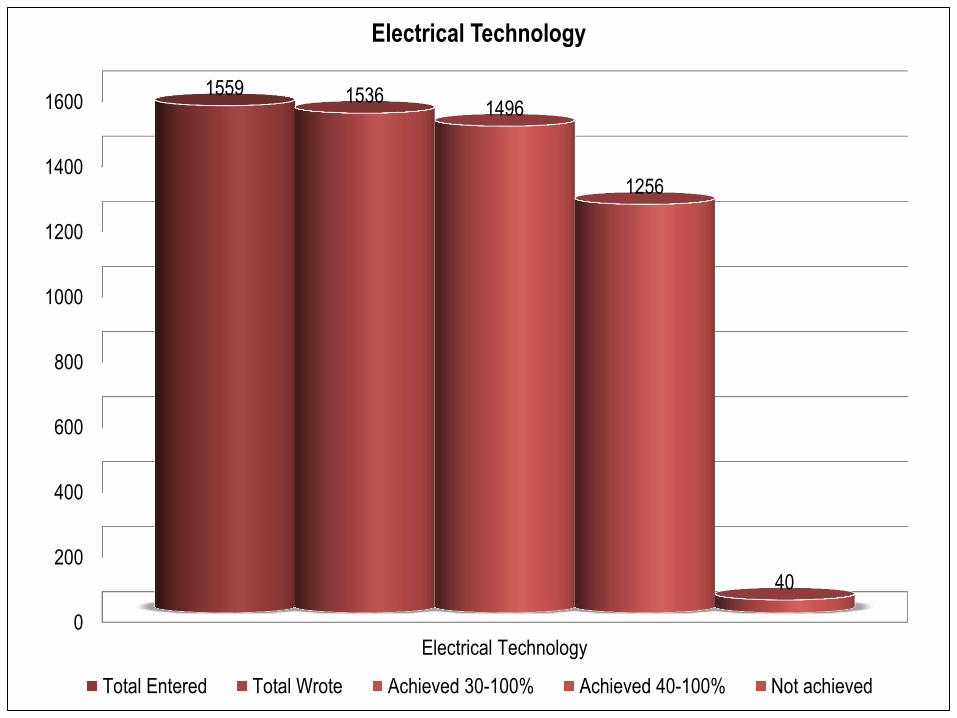
Electrical Technology
1559 1536 1496
1256
40
Electrical Technology
Total Entered Total Wrote Achieved 30-100% Achieved 40-100% Not achieved

0
20000
40000
60000
80000
100000
120000
English First Additional Language
117199 112978
108173
86829
4805
English First Additional language
Total Entered Total Wrote Achieved 30-100% Achieved 40-100% Not achieved

0
5000
10000
15000
20000
25000
30000
35000
English Home Language
30155 29788 29636 28212
152
English Home Language
Total Entered Total Wrote Achieved 30-100% Achieved 40-100% Not achieved

0
10000
20000
30000
40000
50000
60000
70000
Geography
66333 64057
49303
33238
14754
Geography
Total Entered Total Wrote Achieved 30-100% Achieved 40-100% Not achieved

0
1000
2000
3000
4000
5000
6000
7000
8000
Engineering Graphics and Design
7433 7340 7034
5903
306
Engineering Graphics and Designs
Total Entered Total Wrote Achieved 30-100% Achieved 40-100% Not achieved

0
5000
10000
15000
20000
25000
30000
35000
History
32385 31224
28006
23121
3218
History
Total Entered Total Wrote Achieved 30-100% Achieved 40-100% Not achieved

0
500
1000
1500
2000
2500
3000
3500
Hospitality Studies
3025 2882
2811
2380
71
Hospitality Studies
Total Entered Total Wrote Achieved 30-100% Achieved 40-100% Not achieved

0
500
1000
1500
2000
2500
3000
3500
Hospitality Studies
3025 2882
2811
2380
71
Hospitality Studies
Total Entered Total Wrote Achieved 30-100% Achieved 40-100% Not achieved

0
200
400
600
800
1000
1200
1400
Information Technology
1275 1239
1117
834
122
Information Technology
Total Entered Total Wrote Achieved 30-100% Achieved 40-100% Not achieved

0
10000
20000
30000
40000
50000
60000
70000
80000
Life Sciences
76897 74496
54184
35850
20312
Life Sciences
Total Entered Total Wrote Achieved 30-100% Achieved 40-100% Not achieved

0
20000
40000
60000
80000
100000
120000
140000
160000
Life Orientation
147355 144607 143802 141825
805
Life Orientation
Total Entered Total Wrote Achieved 30-100% Achieved 40-100% Not achieved

0
10000
20000
30000
40000
50000
60000
70000
80000
Mathematics
74397 71634
29188
17405
42446
Mathematics
Total Entered Total Wrote Achieved 30-100% Achieved 40-100% Not achieved

0
200
400
600
800
1000
1200
1400
1600
1800
Mechanical Technology
1605 1584 1523
1140
61
Mechanical Technology
Total Entered Total Wrote Achieved 30-100% Achieved 40-100% Not achieved

0
10000
20000
30000
40000
50000
60000
70000
80000
Mathematical Literacy
72949 70070
53154
34110
16916
Mathematical Literacy
Total Entered Total Wrote Achieved 30-100% Achieved 40-100% Not achieved

0
10
20
30
40
50
60
70
80
Maritime Economics
76 75
63
48
12
Maritime Economics
Total Entered Total Wrote Achieved 30-100% Achieved 40-100% Not achieved

0
100
200
300
400
500
600
Music
559 551
493
376
58
Music
Total Entered Total Wrote Achieved 30-100% Achieved 40-100% Not achieved

0
5000
10000
15000
20000
25000
30000
35000
40000
45000
50000
Physical Sciences
46776 45143
25177
14077
19966
Physical Sciences
Total Entered Total Wrote Achieved 30-100% Achieved 40-100% Not achieved

0
50
100
150
200
250
300
350
400
450
Religion Studies
410 393
379
331
14
Religion Studies
Total Entered Total Wrote Achieved 30-100% Achieved 40-100% Not achieved
0
2
4
6
8
10
12
14
16
18
20
Sesotho Home Language
19
17 17
16
0
Sesotho Home Language
Total Entered Total Wrote Achieved 30-100% Achieved 40-100% Not achieved

0
50
100
150
200
250
300
350
400
450
SiSwati Home Language
416
392 389 386
3
SiSwati Home Language
Total Entered Total Wrote Achieved 30-100% Achieved 40-100% Not achieved

0
10
20
30
40
50
60
Tamil Second Additional Language
54 54 54 54
0
Tamil Second Additional Language
Total Entered Total Wrote Achieved 30-100% Achieved 40-100% Not achieved

0
5000
10000
15000
20000
25000
30000
35000
40000
Tourism
36602 35426
34540
29448
886
Tourism
Total Entered Total Wrote Achieved 30-100% Achieved 40-100% Not achieved

0
500
1000
1500
2000
2500
Visual Arts
2045 2027 2027 1999
0
Visual Arts
Total Entered Total Wrote Achieved 30-100% Achieved 40-100% Not achieved

0
20
40
60
80
100
120
140
160
IsiXhosa First Additional Language
148 147 147 147
0
IsiXhosa First Additional Language
Total Entered Total Wrote Achieved 30-100% Achieved 40-100% Not achieved

0
2000
4000
6000
8000
10000
12000
14000
IsiZulu First Additional Language
13088 12866 12814 12756
IsiZulu First Additional Language
Total Entered Total Wrote Achieved 30-100% Achieved 40-100% Not achieved

0
20000
40000
60000
80000
100000
120000
IsiZulu Home Language
113280 109286 109182 108797
IsiZulu Home Language
Total Entered Total Wrote Achieved 30-100% Achieved 40-100% Not achieved

District Performance

District Name Wrote Achieved Not achieved Pass %
UMLAZI 21056 16272 4784 77.28%
PINETOWN 18592 14099 4493 75.83%
UMGUNGUNDLOVU 12249 9271 2978 75.69%
UTHUKELA 8853 6493 2360 73.34%
UGU 9542 6921 2621 72.53%
UMKHANYAKUDE 10308 7413 2895 71.92%
AMAJUBA 7463 4891 2572 65.54%
SISONKE 6382 4126 2256 64.65%
UTHUNGULU 15034 9626 5408 64.03%
ZULULAND 14380 9155 5225 63.66%
ILEMBE 7963 4714 3249 59.20%
UMZINYATHI 7545 4163 3382 55.18%
TOTAL 139367 97144 42223 69.70%
Overall District Performance

0
5000
10000
15000
20000
25000
2105
6
1859
2
1503
4
1224
9 1438
0
1030
8
9542
8853
7463
7963
7545
6382
1627
2
1409
9
9626
9271
9155
7413
6921
6493
4891
4714
4163
4126
Number of passes per district ranked in order
Wrote Achieved

0
10
20
30
40
50
60
70
8077.28 75.83 75.69
73.34 72.53 71.92
65.54 64.65 64.03 63.66 59.2
55.18
Districts ranked in order of passes: 2014

Districts Wrote Achieved Bachelors Diploma H. Cert NSC
Amajuba 7463 4891 1751 1951 1189 0
UThungulu 15034 9626 3234 4117 2248 27
UMkhanyakude 10308 7413 2276 3268 1863 6
Zululand 14380 9155 2936 3749 2430 40
Uthukela 8853 6493 2380 2548 1545 20
Umzinyathi 7545 4163 1281 1677 1201 4
Umgungundl. 12249 9271 3863 3603 1803 2
Sisonke 6382 4126 1277 1672 1175 2
Ilembe 7963 4714 1329 2073 1303 9
Pinetown 18592 14099 5737 5859 2495 8
Ugu 9542 6921 2518 2802 1598 3
Umlazi 21056 16272 7142 6432 2694 4
TYPES OF DISTRICT PERFORMANCE IN THE NATIONAL SENIOR CERTIFICATE: 2014

0
10
20
30
40
50
60
70
80
9079
.4
72.4
81.5
70.7
75.2
79.6
74.2
83.7
71.8
78.8
72.7
75.7
77.4
65.5
4
59.2
75.8
3
64.6
5 72.5
3
75.6
9
71.9
2 77.2
8
55.1
8
73.3
4
64.0
3
63.6
6 69.7
District Pass rates : 2013 and 20134
2013 2014
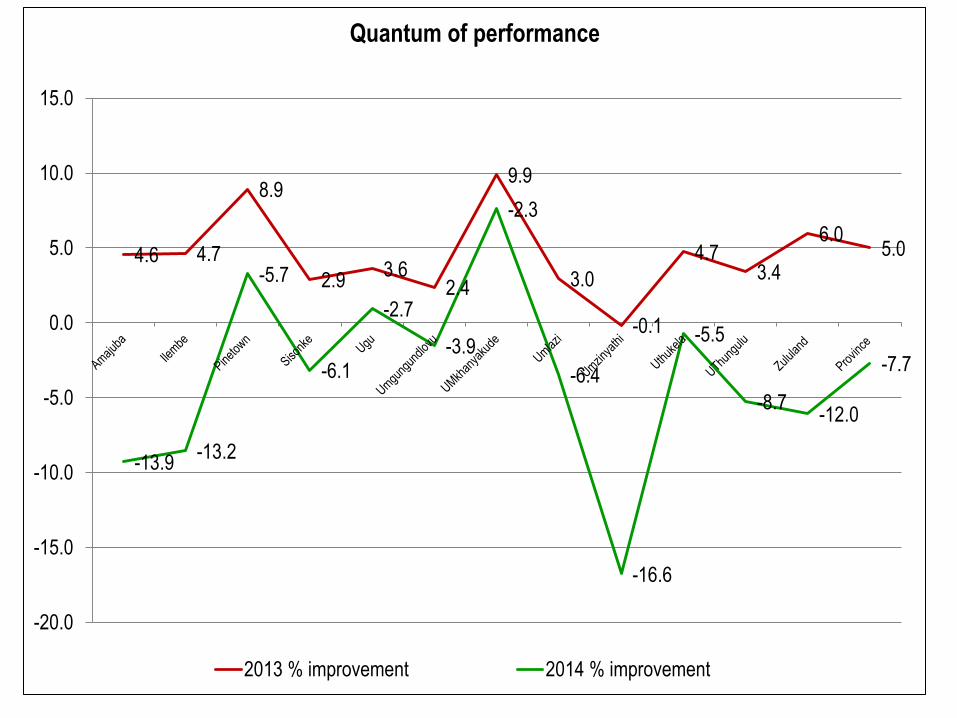
4.6 4.7
8.9
2.9 3.6
2.4
9.9
3.0
-0.1
4.7 3.4
6.0 5.0
-13.9 -13.2
-5.7
-6.1
-2.7
-3.9
-2.3
-6.4
-16.6
-5.5
-8.7 -12.0
-7.7
-20.0
-15.0
-10.0
-5.0
0.0
5.0
10.0
15.0
Quantum of performance
2013 % improvement 2014 % improvement

District
No of
Schools
No with
0%
No with
100%
No with 0 to
19.9%
No with 20
to 39.9%
No with 40
to 59.9%
No with 60
to 79.9%
No with 80
to 100%
Umkhanyakude 155 0 5 4 14 28 59 50
Zululand 201 2 4 16 39 45 63 38
Uthungulu 197 4 6 20 37 50 45 45
Uthukela 135 0 13 4 10 25 37 59
Umzinyathi 141 2 4 21 34 25 38 23
Amajuba 67 0 4 3 6 18 25 15
Umgungundlovu 161 3 13 7 12 31 46 65
Ugu 129 1 3 7 7 23 47 45
Sisonke 85 0 2 4 9 21 28 23
Umlazi 179 0 13 4 13 27 49 86
Pinetown 164 0 11 1 8 32 54 69
Ilembe 124 3 3 16 22 37 31 18
Province 1738 15 81 107 211 362 522 536
District Performance in different categories

0
1000
2000
3000
4000
5000
6000
7000
8000
7142
5737
3863
3234 2936
2518 2380 2276
1751
1329 1281 1277
Bachelor passes per district
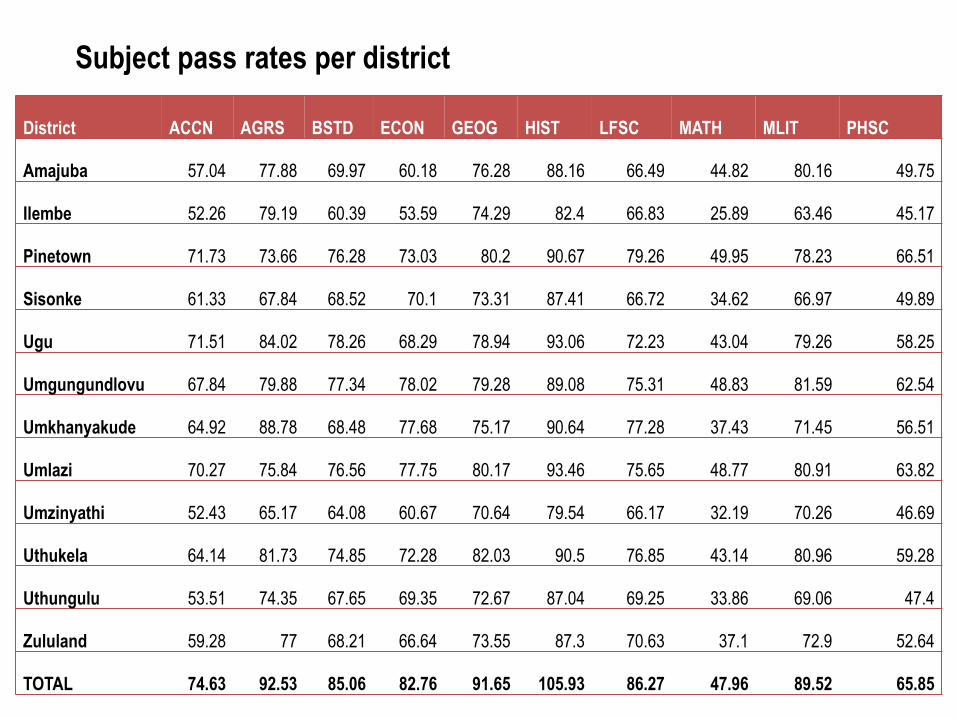
District ACCN AGRS BSTD ECON GEOG HIST LFSC MATH MLIT PHSC
Amajuba 57.04 77.88 69.97 60.18 76.28 88.16 66.49 44.82 80.16 49.75
Ilembe 52.26 79.19 60.39 53.59 74.29 82.4 66.83 25.89 63.46 45.17
Pinetown 71.73 73.66 76.28 73.03 80.2 90.67 79.26 49.95 78.23 66.51
Sisonke 61.33 67.84 68.52 70.1 73.31 87.41 66.72 34.62 66.97 49.89
Ugu 71.51 84.02 78.26 68.29 78.94 93.06 72.23 43.04 79.26 58.25
Umgungundlovu 67.84 79.88 77.34 78.02 79.28 89.08 75.31 48.83 81.59 62.54
Umkhanyakude 64.92 88.78 68.48 77.68 75.17 90.64 77.28 37.43 71.45 56.51
Umlazi 70.27 75.84 76.56 77.75 80.17 93.46 75.65 48.77 80.91 63.82
Umzinyathi 52.43 65.17 64.08 60.67 70.64 79.54 66.17 32.19 70.26 46.69
Uthukela 64.14 81.73 74.85 72.28 82.03 90.5 76.85 43.14 80.96 59.28
Uthungulu 53.51 74.35 67.65 69.35 72.67 87.04 69.25 33.86 69.06 47.4
Zululand 59.28 77 68.21 66.64 73.55 87.3 70.63 37.1 72.9 52.64
TOTAL 74.63 92.53 85.06 82.76 91.65 105.93 86.27 47.96 89.52 65.85
Subject pass rates per district

District AFRHL ENGHL ZULHL SESHL SWAHL
Amajuba 100 100 99.97
Ilembe 100 99.11 98.81
Pinetown 100 99.68 99.94
SiSonke 95 100 99.97
Ugu 100 99.93 99.98
Umgungundlovu 98.59 99.6 99.87 100
Umkhanyakude 100 99.23 99.97
Umlazi 100 99.19 99.79 100
Umzinyathi 100 99.58 99.83 100
Uthukela 100 100 99.9
Uthungulu 100 99.52 99.91
Zululand 99.38 100 99.93
District Performance in Home Languages

Conclusion

conclusion
Pillar 1: the Transformation of the Schooling System;
Pillar 2: Early Childhood Development;
Pillar 3: Curriculum and Assessment;
Pillar 4: Teacher Provision, Development and Support;
Pillar 5: Leadership and Management;
Pillar 6: Planning and Resourcing;
Pillar 7: Infrastructure Development and Maintenance;
Pillar 8: Information and Communication Technology;
Pillar 9: Social Cohesion and Integration of Schools; as well as
Pillar 10: School Functionality and Community Involvement.