technical assistance consultant’s report · tenaga listrik), developing new and renewable energy...
TRANSCRIPT
Technical Assistance Consultant’s Report
This consultant’s report does not necessarily reflect the views of ADB or the Government concerned, and ADB and the Government cannot be held liable for its contents.
Project Number: 48323-001 January 2018
Republic of Indonesia: Sustainable and Inclusive Energy Program (Financed by the Agence Française de Développement and the
Technical Assistance Special Fund)
Appendix E: PLN PV Procurement Workshop Support Appendix F: Renewable Incentives FGD 1—Current Policies Appendix G: Renewable Incentives FGD 2—Financing Gaps
Prepared by Castlerock Consulting, Indonesia in association with Economic Consulting Associates Ltd, United Kingdom and PT. Q Energy South East Asia, Indonesia
For Coordinating Ministry for Economic Affairs Ministry of Energy and Mineral Resources Ministry of Finance Perusahaan Listrik Negara

E-1
SIEP Final Report – January 2018
APPENDIX E: PLN PV PROCUREMENT WORKSHOP REPORT
REPORT Technical Assistance to PLN: Workshop on Solar PV Procurement 23-24 May 2017

E-2
Acknowledgement This report was prepared by Castlerock Consulting under a policy and technical assistance grant administered by the Asian Development Bank (ADB): Sustainable and Inclusive Energy Program (PATA 8826-INO). Inputs were provided by PT Synergy Engineering, Mott MacDonald, and Hadiputranto, Hadinoto and Partners. Disclaimer The views expressed in this publication are those of the authors and do not necessarily reflect the views and policies of the Asian Development Bank (ADB) or its Board of Governors or the governments they represent. ADB does not guarantee the accuracy of the data included in this publication and accepts no responsibility for any consequence of their use. The mention of specific companies or products of manufacturers does not imply that they are endorsed or recommended by ADB in preference to others of a similar nature that are not mentioned. By making any designation of or reference to a particular territory or geographic area, or by using the term “country” in this document, ADB does not intend to make any judgments as to the legal or other status of any territory or area.
E-3
Executive Summary Under Government Regulation No. 79 of 2014 on the National Energy Policy, the Government of Indonesia has targeted new and renewable energy to provide 23% of primary energy needs by 2025 (up from 6% in 2015). This target has been reaffirmed in the National Energy Plan signed by President Joko Widodo in January 2017. In addition, the country’s Nationally Determined Contribution to the Paris Agreement of 2015 calls for a 29% reduction greenhouse gas emission by 2030. As the state-owned enterprise for electricity supply, PLN (Perusahaan Listrik Negara – State Electricity Company) has planned accordingly to develop electricity by utilizing renewable energy. As stated in the Electricity Supply Business Plan (Rencana Usaha Penyediaan Tenaga Listrik, RUPTL) 2017-2026, PLN plans to expand electricity generation capacity to fulfill demand growth and to increase their supply by utilizing local energy resources, especially renewable energy. By November 2016, total installed capacity of generation in Indonesia had reached 51,915 MW which consists of PLN-owned generation of 39,859 MW, independent power producer (IPP)-owned generation of 8,867 MW and rented generation of 3,192 MW. Out of this total, 44% of total capacity is from coal power plants, 29.3% from gas power plants, 11.1% from diesel power plants, 8.9% from hydro power plants, 3.2% from oil-steamed power plants, 2.6% from geothermal, and 0.2% from various renewable energy. In January 2017, the Ministry of Energy and Mineral Resources (MEMR) issued broad-based guidelines for purchasing electricity from renewable energy sources. Ministerial Regulation MEMR (Peraturan Menteri Energi dan Sumber Daya Mineral, Permen ESDM) No.12/2017 establishes pricing and selection guidance for all forms of renewable energy (including solar photovoltaic, wind, hydropower, biomass, biogas, municipal waste, and geothermal). This regulation requires PLN to purchase electricity from renewable sources with reference to national targets, prioritize the dispatch of renewable-based generation projects below 10 megawatts (MW) as “must-run” plants, and develop standardized procurement documents and power purchase agreements (PPAs). It requires tendering of wind and solar projects in in packages of at least 15 MW each and provides a benchmark price for all renewable generation technologies. The state-owned electricity corporation, PLN, plans to issue several tenders for solar and wind power procurement under this new regulation in the coming months, representing the first large-scale tenders for renewables in the country. The first tender will be for a combined 167 MW of solar power plants in Sumatera. The benchmark price will be tied to local average cost of generation (Biaya Pokok Penyediaan, BPP), which is approximately USD 7 cents/kWh. PLN plans to subsequently tender solar packages for Kalimantan, Maluku and Papua, and West Java. As stipulated by Permen ESDM 12/2017, PLN is also preparing standard power purchase agreements (PPAs) and standard bidding documents. As part of on-going assistance for clean energy development, ADB, in collaboration with AFD, has been providing support to PLN with tender preparation. ADB conducted a one-week consultation with PLN with a team comprising a solar PV specialist, power system planner, and other specialists in Jakarta. The workshop was designed to help PLN have a better understanding of solar PV procurement. It covered grid connection issues, solar PV development issues, and commercial
E-4
and legal issues. The workshop was followed up by one day of in-depth one-on-one consultations between PLN engineers and the consultants. Representatives from PLN Headquarters and Regional Offices attended the workshop and one-on-one consultations. Representatives from ADB and AFD also attended the series of activities. The main findings from the workshop are as follows:
The effectiveness of solar PV procurement is still an issue for PLN. The grid code and distribution code do not adequately address renewable energy integration, particularly given the intermittent nature of wind and PV power generation.
The selection of projects was largely conducted in an ad hoc manner, with the bolstering of areas with forecast power deficits being the main criterion for project selection. As a result, many projects do not appear to be technically feasible due to grid conditions.
PLN has not conducted any grid-connected solar PV procurement to date. The rationale and objectives of the solar procurement seems unclear for some PLN Regional Office staff.
PLN seeks performance guarantees from IPPs, but guaranteeing energy production from solar and other intermittent power projects is not possible due to their intermittent and uncertain nature. For solar PV, PLN’s PPA instead works on the basis of guaranteeing plant capacity under defined operating conditions. However, this approach is not used elsewhere in the world.
E-5
SIEP Final Report – January 2018
Contents Executive Summary ......................................................................................................... E-3 Introduction ...................................................................................................................... E-6
Background .................................................................................................................. E-6 Objective ...................................................................................................................... E-6 Proposed Assistance ................................................................................................... E-6 Agenda ......................................................................................................................... E-7
Presentation ..................................................................................................................... E-7 Integration of Intermittent Renewable Power Plant in Power System Planning ........... E-7 Grid Impact Studies for Integrating Utility Scale Solar PV into PLN Networks ............. E-8 Solar PV Generation in the Region .............................................................................. E-8 Solar Development Challenges in Indonesia ............................................................... E-9 Procurement of Solar PV Projects ............................................................................. E-10 Solar PV Power Purchase Agreement ....................................................................... E-10
Findings ......................................................................................................................... E-11 Recommendation for next step ...................................................................................... E-12 Appendix 1: Workshop’s Agenda ................................................................................... E-14 Appendix 2: Workshop’s Documentation ....................................................................... E-16

E-6
Introduction
Background 1. The Government of Indonesia recognizes that a climate-friendly social and economic development path is a key factor for sustainable development. The government has set the target to reduce emissions by 29% by 2030, and this reduction could reach 41% subject to availability of international support. In addition, the government has set an ambitious target of 23% of renewable energy share in its primary energy mix by 2025 in the 2014 National Energy Policy, which has been reaffirmed in the National Energy Plan. To increase renewable energy production in the electricity mix, the Ministry of Energy and Mineral Resources (MEMR) of the Republic of Indonesia stipulated Ministerial Regulation No. 12/2017 on Utilization of Renewable Energy Resources for Electricity Supply. 2. According to the Electricity Law No. 30/2009, the government is obliged to control the electricity supply. Through national electricity company Perusahaan Listrik Negara (PLN), the government controls electricity supply, distribution, and demand. Ministerial Regulation No.12/2017 also mandates (i) PLN to purchase electricity from renewable energy generators to achieve the targeted energy mix and electrification targets, and (ii) the manner in which PLN may procure electricity supply from various renewable energy resources. 3. In PLN’s Electricity Supply Business Plan (RUPTL, Rencana Usaha Penyediaan Tenaga Listrik), developing new and renewable energy is one of PLN’s policy objectives. Therefore, PLN is planning to develop new and renewable energy in the form of geothermal, hydro, wind, solar, and bioenergy. Furthermore, PLN is obliged to treat renewable energy projects with a capacity below 10MW as “must run” plants. PLN must procure solar PV and wind projects through open tender. Adequate preparation of the tender process is the key to achieve positive outcomes and low prices. The required preparation includes (i) technical analysis (i.e. resource quality analysis and grid studies), and (ii) commercial analysis. However, PLN has only limited resources and capacity to develop proper criteria based on technical and commercial studies.
Objective 4. The Asian Development Bank (ADB) and Agence Francaise de Developpment (AFD) are jointly providing technical assistance to PLN to support the renewable energy procurement preparation. The objective of the support is as follows: a. To improve PLN’s knowledge on renewable energy tendering preparation b. To improve the capacity of PLN’s staff on the tendering process. c. To provide PLN with methods and support to evaluate the suitability of particular
sites for solar PV development from the standpoint of grid conditions. d. To provide inputs for preparation of a standard power purchase agreement (PPA)
and standard bidding documents in purchasing renewable energy by PLN.
Proposed Assistance 5. ADB-AFD initiated the assistance with a 3-day consultation with a team comprising: Solar PV Specialist Power System Planner Other specialists (legal expert, renewable energy tender specialist) 6. The assistance included a one-day workshop, covering technical issues and commercial issues on solar PV procurement process.
E-7
7. Key technical and commercial issues for PLN were discussed during the workshop. This covered grid integration (injection from renewable energy and stability), technical and economic criteria for tendering, and key aspects in the PPA for renewable energy. Lessons learned from renewable energy procurement, primarily solar PV, from selected countries were presented as well. This aims to increase PLN’s knowledge on solar PV so they can prepare proper tendering processes and criteria in the future.
Agenda 8. The assistance was conducted in 4th week of May (please see attachment 1 for detailed agenda), with detailed scheduled as follows: 22 May – Afternoon – Kickoff meeting within the team to discuss issues 23 May – workshop at PLN on solar PV procurement – technical and commercial
issues 24 May – detailed one-on-one consultations in small groups at PLN - with engineers
from PLN Wilayahs and Pusat.
Presentations
Integration of Intermittent Renewable Power Plant in Power System Planning 9. Renewable energy (RE) penetration into power systems globally will continue to grow rapidly as has been forecasted by the International Energy Agency in their Energy Outlook 2015, as well as BP in their energy outlook. Both analyses show that renewable energy will be the highest growth in electricity power production compared to other types of primary energy resources. One of the reasons for this is the declining price of RE, mainly solar and wind. A defining characteristic of RE is energy from a sustainable natural resource, but production is intermittent, which makes RE more difficult to integrate into power systems. 10. Economic evaluation of RE rests mainly on the capital expense as operation and maintenance expense is minor. Economic evaluation will depend principally on construction cost, and its economic life and discount rate, which reflects the cost of financing. Other important parameters that must be considered are availability of RE resources and their characteristics. This will determine the productivity of RE. 11. RE resource availability will determine the energy that is produced, hence it will determine the economic viability as well. There are several publicly available sources of information on resource availability but they are usually not as detailed and accurate as needed for an in-depth, investment-grade analysis. At least using this information, we can estimate and approach the characteristic.
12. One such source of information is the Energy Sector Management Assistance Program (ESMAP) World Solar Irradiation Atlas (http://globalsolaratlas.info/). This site provides average solar irradiation around the world with 1 km-sq resolution. This allows us to estimate production of a solar power plant anywhere in the world.
13. Intermittency is one challenge that must be considered when integrating RE into power systems. There are several mitigations that are available and implementable for RE intermittency. These include site size limitation, multiple site diversity, storage, fast response conventional generation elsewhere on the grid and forecasting of RE output. These mitigations will be more effective if supported by regulation, such as grid and distribution code. 14. There are several simulation tools for integrating RE into power system capacity expansion planning. One of the simulation tools is PLEXOS Simulator by Energy Exemplar.

E-8
This simulation will optimize capacity planning (long term), create a production simulation by optimizing available resources, and show chronologic dispatch of each power plant. 15. Sumba Island was used as a case study in the presentation. Data on solar and wind have hourly resolution for 1 year and were extended into 10 years of simulation time. Results of the simulation show that a combination of RE (solar & wind) and fossil energy (gas engine) is needed in Sumba. This shows that fossil fuel is still needed, while RE will minimize the consumption of LNG. Fossil fuel is still needed for supporting capacity need, while RE will support on energy need. This sort of capacity expansion planning should be followed by grid impact studies.
Grid Impact Studies for Integrating Utility Scale Solar PV into PLN Networks 16. This presentation describes a structured approach to performing grid impact studies for the interconnection of utility scale solar PV into PLN’s networks. Because PLN is responsible for hundreds of separate electricity grids around Indonesia, a single “one size fits all” approach and assessment criteria is neither practical nor advisable. Rather, the concept of “weak” and “strong” grid connections are introduced taking into account the characteristics of the network relative to the power plant to be connected. 17. Weak grid connections are subdivided into high impedance and low inertia connection points. A weak high impedance connection point is one that has a Short Circuit Ratio (SCR) of less than 3 (as per IEEE Std 1204). These types of connection points are typically characterized by long radial upstream feeders and low short circuit levels, leading to issues relating to voltage regulation / stability and increases in active power losses. 18. A weak low inertia connection point is associated with the connection of a large power plant relative to the frequency response characteristics of the system, i.e. the power plant has a large influence on the frequency of the system. It is proposed that a connection point is weak if the Stiffness Ratio (SR) is less than 4. Low inertia connection points are typically associated with small isolated power systems with a high mix of diesel or gas engine generator capacity (i.e. low inertia machines). The key issues surrounding low inertia connection points are frequency stability and issues with conventional generator dispatch and loading (such as maintaining minimum machine loading and spinning reserve). 19. Lastly, strong connection points are those that have SCR >3 and SR >4. In such cases, there are no major issues foreseen in the connection of solar PV plants and standard grid impact studies apply for checking the evacuation of the power to the grid and short circuit contributions.
Solar PV Generation in the Region 20. Despite huge resources and ambitious national and regional targets, uptake of solar in South East Asia (SEA) has been limited so far. The main barriers identified so far include:
– Data availability for preliminary assessments, – Grid connection and integration, – Access to land, – Regulatory frameworks (complex, frequently changing), – Perception of high cost still exists, – Very short timelines for bid preparations, – Local content expectations, – Access to financing, – Poor track record of some projects.

E-9
21. These barriers can be overcome by an adequate procurement approach and lessons learned from existing projects in the region. Various approaches that could be applied to minimize the cost of energy in equatorial regions include the following:
– Optimisation of DC/AC ratio – East / East-West facing orientation – Layout optimization for complex terrain – Component selection based on latest technical developments and the site
conditions. 22. Procurement rules should allow new trends that provide value for money, as long as they don’t compromise the robustness of the projects. Current engineering, procurement and construction (EPC) cost in SEA region is ~USD 1,000/kWp for utility scale projects with good access. A very clear downward trend in cost can be observed, but conditions vary greatly and so do costs. All technical and commercial elements need to be considered when comparing tariffs achieved internationally (as evident from the comparison between Dubai and Indonesia projects):
– Irradiation – Economies of scale – Local content restrictions – Land cost – Responsibility for grid interconnection costs – Taxes and import duties – Country, currency and off-taker risk – Financing costs, and – PPA term and escalation provisions
Solar Development Challenges in Indonesia 23. Solar resource estimation is not yet mature for the Indonesian context. It is necessary to consider both ground-measured and satellite-derived data to ensure confidence in revenue estimates, to capture (i) long-term climate; (ii) modelling uncertainty; (iii) microclimate effects; and (iv) any impacts from air pollution. 24. BMKG (Indonesia Agency for Meteorology, Climatology and Geophysics) has more than 60 meteorological stations with solar irradiation measurements. However, this information is not easily accessible to developers and consultants and its quality needs to be assessed. 25. Adequate site assessment is key for a successful project. Logistics can have a huge impact on the delivery of the project and need to be factored in the design and procurement. 26. Lessons from elsewhere in the SEA region regarding design and equipment selection remain relevant, for example:
– Material selection to avoid corrosion, – Enclosures for electrical components adequate for high temperatures and
humidity, – Flood mitigation and drainage design,
27. During operations, inverter outages are typically the key revenue risk under plant owner control:
– Nuisance trips from low isolation resistance, particularly during damp periods (e.g. from DC cable selection; damage to cable insulation; poorly specified ducting; inadequate drainage),
– Nuisance trips due to over-voltage and/or coordination of settings (e.g. for varied AC cable lengths),
– Lack of local maintenance or spares storage base, particularly for inverter suppliers without a prior installed base in the country.
E-10
28. Grid-related constraints on power sales remains a central concern for island networks (this was discussed in more detail by the other presenters).
Procurement of Solar PV Projects 29. Auctions represent best practice for RE procurement, providing price discovery and control over volumes and cost. Auction risks can be managed by adequate selection of design features: demand, qualification requirements, winner selection and seller liabilities. There is no single formula for successful auctions, but ensuring competition is key. 30. Valuable lessons learned from South African REIPPP, Scaling Solar and Kenyan auctions study were discussed. A multi-stage, solar specific auction seems appropriate as a first step in Indonesia. The option of pre-selected sites or at least pre-selected area/connection substation should be explored.
Solar PV Power Purchase Agreement 31. The presentation highlights the Indonesian solar power purchase agreement, which is a new model power purchase agreement and relatively different compared to the previously issued model agreement in 2013. 32. The presentation first covered the contractual structure and objectives of a power purchase agreement and the roles of the parties involved in a power project in order to get a general understanding where a power purchase agreement sits and why it is an important project document. 33. The presentation points out key terms of a power purchase agreement as they relate to different stages of the project, such as construction, operation, and power supply. Under the terms of the power purchase agreement, an IPP would be required to construct a power plant and the transmission line, and be ready to operate by a certain targeted commercial operation date. The contract will also define consequences of delay, force majeure, term and termination etc. 34. The solar power purchase agreement introduced by PLN suggests key differences in terms of supply guarantee from other power purchase agreements. For example, in thermal PPAs, energy supply guarantee is possible due to constant fuel source, whilst for solar power purchase agreement, it is impossible for the IPP to guarantee if the sun will shine or for how long, and therefore, a guarantee is feasible only with respect to plant capacity under defined operating conditions. However, this type of guarantee is not used elsewhere in the world; elsewhere it is accepted that PV is intermittent and projects are sized and located so that the system can compensate for variation in output. The presentation also addresses the differences in the tariff components for solar power projects where it only comprises components A (capital cost recovery), B (fixed and variable O&M) and C (transmission line capital cost recovery). 35. The presentation further addresses the key concerns relating to Regulation of the Minister of Energy and Mineral Resources No. 10 of 2017 on the terms of a power purchase agreement ("Reg 10"), which does not apply to solar projects, but PLN indicates that it wants to follow the same principles under Reg 10 for solar power purchase agreements. Some of the key concerns are relating to the build-own-operate-transfer (BOOT) model, Force Majeure conditions (PLN is relieved of payment obligations where PLN cannot take power due to (natural) Force Majeure, thereby PLN shifts government force majeure risk to power developers), and the take or pay period, which should be set by taking into account the debt period.

E-11
Findings 36. The following points are the findings from the workshop and one-on-one consultations with PLN’s staff:
Planning departments from the PLN Wilayahs were given the responsibility to select the quotas and projects (capacity and location) for the upcoming solar PV tenders.
From discussions with planning staff, the selection of projects was largely conducted in an ad hoc manner, with the bolstering of areas with forecast power deficits being the main criterion for project selection. As a result, there are many projects that do not appear to be technically feasible since the local grid conditions were not assessed.
No technical assessment studies were performed for the selection of the solar PV projects. It appears that PLN has no simulation models for most of the smaller isolated grids.
During the breakout session, the Sumatera projects were categorized into Strong, Weak (Low Inertia) and Weak (High Impedance) connections based on a preliminary screening. PLN will follow up by collecting the required technical data to conduct a more detailed evaluation.
The participants from procurement divisions were new and had never done any procurement to date. They expect that the solar procurement would be rolled-out in Java next year.
The rationale and objectives of the solar procurement seem unclear to some PLN staff. The workshop was useful to share knowledge and increase buy-in among stakeholders.
The allocation of capacity for the announced solar tenders is decided by the planning teams of each Wilayah. It appears that the solar capacity is selected only based on a simple threshold (e.g. no more than 5% of the total peak generation capacity in each system). It seems that no specific grid studies are being conducted to select the capacity allocation or the interconnection point of the projects.
An area of concern for the participants (shared by the consultant team) is the feasibility of interconnection and dispatch of future solar PV projects.
Procurement documents were not available for review by the consultant, and the below findings are purely based on verbal communications from PLN, which in some cases presented some contradictions.
The basic structure of the procurement seems reasonable with a staged process: prequalification (PQ) and request for proposal (RFP) stage; and multi-round approach: one region first and then lessons learned to be applied to next regions.
The PQ is focused on the capabilities of the prospective bidders to develop, build and operate the project. It includes legal, financial and track-record requirements.
The RFP package seems to be still under preparation. The contents of the RFP are unclear; it was mentioned that it includes a draft PPA, details of the project sites and the point of interconnection. However, based on subsequent discussions, it seems that the last two items are actually not included.
The evaluation is based on a combined technical and financial score. The weights are not clear at this stage but in other PLN procurement processes the technical component can have up to a 60% weight.

E-12
The tender timelines are challenging for the bidders, with one week to respond to the PQ and one month to respond to the RFP. Considering that the prequalified bidders are provided with little information (no solar data, no interconnection study) and that the project site is not pre-selected by PLN, one month seems insufficient to prepare a well-informed proposal.
There is a local content requirement in the tender process. While this is feasible for some components and beneficial to develop local industry, it should be carefully considered not to affect the competitiveness. At the moment, it would seem that the PV module local content requirement effectively means that there is only one possible Tier 1 supplier.
The documentation of the Scaling Solar initiative was shown to the participants, with particular focus on the up-front advisory work to select the project site, define the project capacity and the technical limits of the interconnection; and the Minimum Functional Specifications.
Guaranteeing supply of energy for solar and other intermittent power projects is not possible for intermittent power project, and the possible approach is by way of guaranteeing the plant capacity under defined operating conditions (Though this is not used elsewhere in the world. Elsewhere PV projects are sized and located so that the power system can accommodate the variability of PV output);
The relief of PLN's payment obligation due to PLN’s inability to take power caused by a force majeure event and the shifting government force majeure risk to developers are major bankability concerns;
There is no restriction for PLN to set take or pay at full term of PPA; and There is no regulatory requirement for solar projects to be set on a BOOT
basis;
Recommendations for next steps 37. PLN is undertaking significant efforts to increase the uptake of solar in their system. The upcoming tenders show some positive features, but the overall impression is that they might not attract enough competition; bidders will be pricing the risks/uncertainties associated in the absence of information, and the lack of upfront grid impact/interconnection studies may compromise the feasibility of some projects. 38. Throughout our interactions during the workshop we have identified several areas of future work. Below are some proposed follow-up actions which could be supported by ADB-AFD and carried out by independent consultants:
Assist PLN with technical evaluation of projects already selected for upcoming solar PV tenders (starting with the Sumatera tender packages) when all data is collected
Assist PLN with developing clearly defined assessment criteria and framework for conducting grid impact studies. The studies can be further developed into integration of intermittent RE in power system planning, penetration level of intermittent RE, and mitigation of intermittency studies.
Assist PLN with developing the grid code and updated distribution code for renewable energy integration.
PLN (or a consultant) to conduct whole of system studies for each of the major grids (e.g. Sumatera interconnected system, Jawa-Bali, etc.) that incorporates all intermittent power plants in the system. This is done to determine system-level limits for solar PV and wind penetration.
E-13
Solar resource: the solar irradiation data recorded by BMKG meteorologicalstations is currently not accessible. Technical support to compile, assess and makethis data easily available would significantly benefit solar development in thecountry.
Tender documents: independent review and update of the current tender designand the existing tender documents: RFQ, RFP (project agreements, studies,technical requirements) and evaluation criteria.
Grid integration, as elaborated by other presenters:o Review and update of Grid Code for integration of intermittent renewable
energy generation;o System studies for each of the major grids to determine potential
penetration of renewables.
Terms of reference for upfront work required to define project sites, project capacityand technical limits of the interconnection of future tender processes.
Capacity building within the relevant PLN teams on procurement, solar/wind energyand grid impact studies.
In order to promote and support for the development of solar power projects, PLNshould consider adopting a model of power purchase agreement that applies riskallocation principles, and removing the major bankability concerns raised by Reg10;
There must be an integrated view and actions taken by the Government, PLN andstakeholders in respect of solar projects development and for this purpose, it isimportant for the Government to issue an implementing regulation that governs thedevelopment of intermittent power projects.

E-14
Appendix 1: Workshop’s Agenda ADB-AFD Support to PLN on RE Procurement Venue: PLN Pusat, Jakarta, Indonesia Participants: Representatives from PLN Pusat and PLN Wilayah Date: May 22, 2017
Time Agenda Speaker 13.00 pm – 15.00 pm
Kickoff meeting representatives from ADB, AFD, and PLN
Led by Toru Kubo Asian Development Bank
Date: May 23, 2017
Time Agenda Speaker 9.00 am – 9.30 am
Registration
9.30 am – 10.30 am
Session 1: Grid impacts on integrating renewable energy
9.30 – 10.00 am Integration of renewable power in system planning
I Made Rosakya Castlerock Consulting
10.00 – 10.30 am
Grid impact studies for integrating utility-scale solar PV plants into PLN networks
Dharma Susanto Castlerock Consulting
10.30 – 10.45 am
Coffee/Tea Break
10.45 – 12.15 pm
Session 2: Solar PV Development
10.45 – 11.15 am
Solar PV generation in the region Mr. Inaki Perez Solar Team Leader, Mott MacDonald
11.15 – 11.45 am
Solar development challenges in Indonesia
Mr. Inaki Perez Solar Team Leader, Mott MacDonald
11.45 – 12.15 pm
Solar procurement program Mr. Inaki Perez Solar Team Leader, Mott MacDonald
12.15 – 1.30 pm Lunch Break 1.30 - 2.30 pm Session 3: Legal and commercial issues 1.30 - 2.00 pm Legal issues on solar PV
development Baker MacKenzie
2.00 – 2.30 pm Commercial issues Baker MacKenzie 2.30 – 2.45 pm Coffee/Tea Break 2.45 – 3.45 pm Q&A Session
Date: May 24, 2017
Time Agenda Speaker 8.30 – 09.00 am
Registration
09.00 – 10.30 am
One-on-one consultation on solar pv development Resource person: Inaki Perez, Mott McDonald
10.30 – 12.00 pm
One-on-one consultation on grid impacts Resource person: Castlerock Consulting

E-15
Time Agenda Speaker 8.30 – 09.00 am
Registration
12.00 – 1.00 pm
Lunch Break
1.00 – 3.00 pm One-on-one consultation on legal and commercial issues Resource Person: Baker MacKenzie

E-16
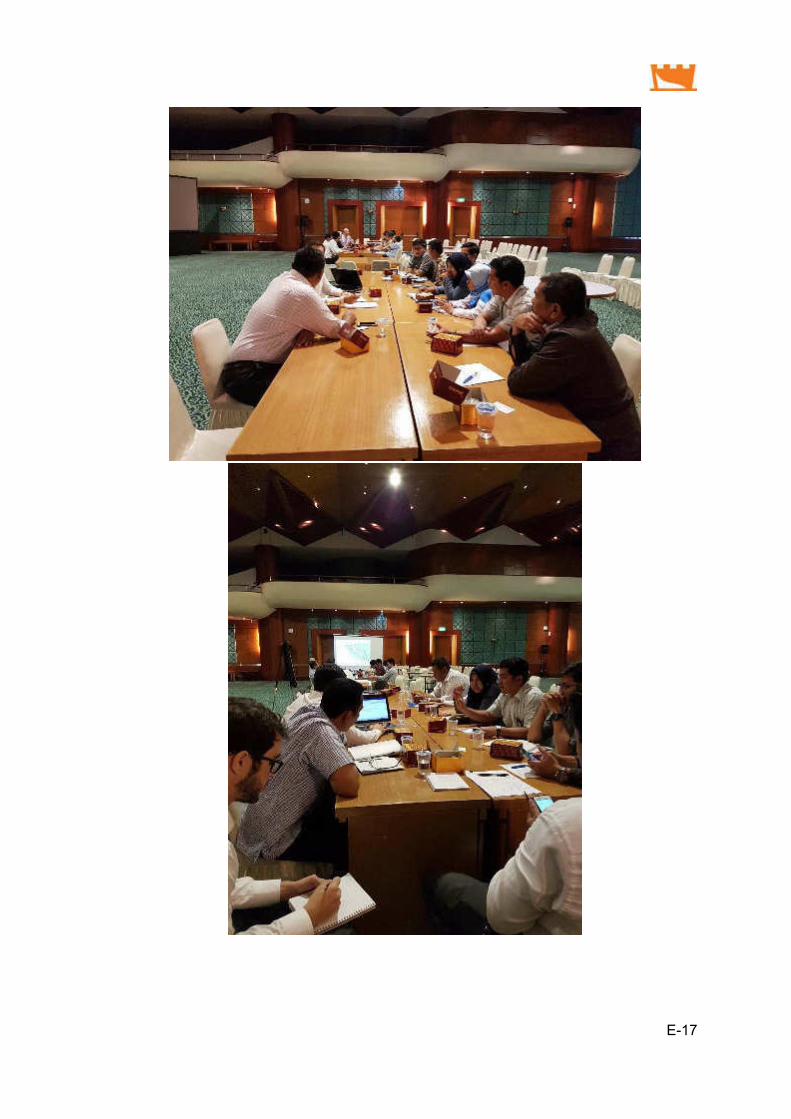
Appendix 2: Workshop’s Documentation
E-17
F-1
SIEP Final Report – January 2018
APPENDIX F: RENEWABLE INCENTIVES FGD 1 – CURRENT POLICIES
This appendix contains four presentations from MEMR, DEN, INDEF and BKPM which is presented during the first FGD. The first FGD mainly discuss about the current policy in Indonesia's RE sector.
These presentations are provided below.

KEMENTERIANESDM1
KEMENTERIAN ENERGI DAN SUMBER DAYA MINERALDIREKTORAT JENDERAL ENERGI BARU TERBARUKAN DAN KONSERVASI ENERGI
FGD Percepatan Investasi Energi Terbarukan, Jakarta 31 Juli 2017KEMENTERIANESDM
2
Outline
I. Kebijakan dan Peraturan Pengembangan EBTKE 3
II. Potensi dan Target Penyediaan Energi Primer EBT 5
III. Pengembangan Energi Terbarukan berdasarkan RUPTL dan Roadmap EBT 7
IV. Penyederhanaan Perizinan dan Insentif 10
V. Upaya Pengembangan EBT 13
VI. Tantangan dan Kemitraan Strategis 16
KEMENTERIANESDM3
Proses bisnis yang semakin jelas, terukur,sederhana dan cepat
Penggunaan teknologi yang efektif, efisiendan memberikan keekonomian proyekyang bagus
Peningkatan kompetensi sumber daya manusia
yang meliputi pengetahuan, keahlian dan
pengalaman
I. KEBIJAKAN PERCEPATAN PENGEMBANGAN EBTKE
KEMENTERIANESDM4
1. Undang-undang Nomor 30 tahun 2007 tentang Energi; Undang-undang ini merupakan regulasi payung, meskipun memberikan penekanan khusus terhadap EBT Pasal 20 ayat (3) mengamanatkan bahwapenyediaan energi baru dan energi terbarukan wajib ditingkatkan oleh Pemerintah dan pemerintah daerah sesuaidengan kewenangannya;
2. Undang-undang Nomor 30 tahun 2009 tentang Ketenagalistrikan;
3. Undang-undang Nomor 21 tahun 2014 tentang Panas Bumi;
4. Undang-undang Nomor 16 tahun 2016 tentang Pengesahan Paris Agreement To The United Nations Framework Convention On Climate Change
5. Peraturan Pemerintah Nomor 79 tahun 2014 tentang Kebijakan Energi Nasional, Pasal 9mengamanatkan bahwa peran Energi Baru dan Energi Terbarukan paling sedikit 23% tahun 2025 dan paling sedikit 31% tahun 2050 sepanjang keekonomiannya terpenuhi;
6. Peraturan Pemerintah Nomor 7 Tahun 2017 tentang Panas Bumi untuk Pemanfaatan Tidak Langsung;
7. Peraturan Presiden Nomor 4/2016 tentang Percepatan Infrastruktur Ketenagalistrikan, Pasal 14 mengamanatkan bahwa pelaksanaan percepatan infrastruktur ketenagalistrikan mengutamakan pemanfaatanenergi baru dan terbarukan;
8. Peraturan Presiden Nomor 22/2017 tentang Rencana Umum Energi Nasional (RUEN);
9. Peraturan Menteri ESDM Nomor 12 Tahun 2017 tentang Pemanfaatan Sumber Energi Terbarukanuntuk Penyediaan Tenaga Listrik dan Peraturan Menteri Nomor 43 Tahun 2017 tentang Perubahan atas Permen ESDM Nomor 12 Tahun 2017 tentang Pemanfaatan Sumber Energi Terbarukan untukPenyediaan Tenaga Listrik;
10. Peraturan Menteri ESDM Nomor 39 Tahun 2017 tentang Pelaksanaan Kegiatan Fisik PemanfaatanEnergi Baru dan Energi Terbarukan;
11. Beberapa Peraturan Menteri Keuangan tentang insentif fiskal dan non fiskal pengembangan EBT.
I. Peraturan Pendukung Energi Baru Terbarukan
KEMENTERIANESDM5
II. Potensi Energi Baru Terbarukan
Kapasitas terpasang
Pembangkit saat ini
Rencana
Pembangunan Pembangkit
59.656 MW
35.000 MW+7.500 MW
New project
Potensi :
75 GW + 19,3 GW
Realisasi
PLTA 5,124 GW
PLTMH 0,162 GW
(1,19%)
441,7 GW8,80 GW
(2% terhadap potensi)
Air Surya Panas Bumi
Angin Bioenergi
Potensi : 207,8 GWp
Realisasi
PLTS 0,085 GWp
(0,02%)
Potensi
Sumber Daya : 11,0 GW
Reserve : 17,5 GW
Realisasi
PLTP 1,65 GW
(0,36%)
Potensi : 60,6 GW
Realisasi
PLTB :1,1 MW
(0,0002%)
Laut
Potensi
PLT Bio : 32,6 GW
BBN : 200 Ribu Bph
Realisasi
PLT Bio : 1,78 GW (0,4%)
Potensi : 17,9 GW
Energi FosilCadangan
TerbuktiProduksi Akan habis
Minyak Bumi 3,6 miliar barel 288 Juta barel 13 tahun
Gas Bumi 100,3 TSCF 2,97 TSCF 34 tahun
Batubara 7,2 miliar ton 434 juta ton 16 tahun
KEMENTERIANESDM6
23%
25%
30%
22%
II. Target Penyediaan Energi Primer EBT Tahun 2025
92,2MTOE
69,2MTOE
23,0MTOE
Biofuel 13,69juta kilo liter
Biomassa 8,4juta ton
Biogas 489,8juta m3
CBM46,0
mmscfd
Listrik
EBT 45
GW
1. PLT Panas Bumi, 7,2 GW
2. PLT Hidro, 17,9 GW
3. PLT Mikrohidro, 3 GW
4. PLT Bioenergi, 5,5 GW
5. PLT Surya, 6,5 GW
6. PLT Angin, 1,8 GW
7. PLT EBT lainnya, 3 GW
EBT
Minyak
GasBatubara
~ 400
MTOE
Kapasitas Pembangkit Listrik Nasional 135 GW
Kapasitas Pembangkit Listrik EBT 45 GW
Berdasarkan Peraturan Presiden Nomor 22 Tahun 2017 tentang
Rencana Umum Energi Nasional (RUEN)
F-2
SIEP Final Report – January 2018

KEMENTERIANESDM7
III. Pengembangan Energi Terbarukan berdasarkan RUPTL
Total Indonesia
Wilayah Maluku & PapuaWilayah Sulawesi & Nusa Tenggara
Wilayah KalimantanWilayah Sumatera
No Pembangkit Listrik Kapasitas Total
1 Panas Bumi MW 6.290
2 Air MW 12.343
3 Mini/Mikro Hidro MW 1.694
4 Surya MWp 57
5 Bayu MW 570
6 Biomas/ Sampah kota MW 597
7 Laut MW 0
8 Bio-Fuel Ribu KL 6.572
Total MW 21.549
No Pembangkit Listrik Kapasitas Total
1 Panas Bumi MW -
2 Air MW 1.056
3 Mini/Mikro Hidro MW 10
4 Surya MWp -
5 Bayu MW 15
6 Biomas/ Sampah kota MW 41
7 Laut MW -
8 Bio-Fuel Ribu KL 830
Total MW 1.257
No Pembangkit Listrik Kapasitas Total
1 Panas Bumi MW 3.305
2 Air MW 4.284
3 Mini/Mikro Hidro MW 983
4 Surya MWp 5
5 Bayu MW -
6 Biomas/ Sampah kota MW 274
7 Laut MW -
8 Bio-Fuel Ribu KL 411
Total MW 8.851
No Pembangkit Listrik Kapasitas Total
1 Panas Bumi MW 400
2 Air MW 2.323
3 Mini/Mikro Hidro MW 221
4 Surya MWp 52
5 Bayu MW 170
6 Biomas/ Sampah kota MW 21
7 Laut MW -
8 Bio-Fuel Ribu KL 4.423
Total MW 3.186
No Pembangkit Listrik Kapasitas Total
1 Panas Bumi MW 2.150
2 Air MW 4.562
3 Mini/Mikro Hidro MW 437
4 Surya MWp -
5 Bayu MW 250
6 Biomas/ Sampah kota MW 206
7 Laut MW -
8 Bio-Fuel Ribu KL 439
Total MW 7.965
No Pembangkit Listrik Kapasitas Total
1 Panas Bumi MW 75
2 Air MW 118
3 Mini/Mikro Hidro MW 43
4 Surya MWp -
5 Bayu MW -
6 Biomas/ Sampah kota MW 55
7 Laut MW -
8 Bio-Fuel Ribu KL 469
Total MW 290
Berdasarkan RUPTL 2017 – 2026 PT. PLN Persero
Wilayah Jawa-Bali
KEMENTERIANESDM8
*Asumsi: Filipina (1.870 MW) dan Amerika (3.450 MW) tidak mengalami penambahan kapasitas
0 37110
7.560 35
205 215 165 220
866
450
858
650
1,175
999
0
500
1000
1500
2000
2500
3000
-
1,000.0
2,000.0
3,000.0
4,000.0
5,000.0
6,000.0
7,000.0
8,000.0
2010 2011 2012 2013 2014 2015 2016 2017 2018 2019 2020 2021 2022 2023 2024 2025
Ta
mb
ah
an
Ka
pa
sita
s (M
W)
Re
nca
na
Ka
pa
sita
s (M
W)
Rencana Kapasitas Tambahan Kapasitas
Kapasitas Terpasang (per Juli 2017) :
1.698,5 MW Penambahan kapasitas
terpasang 2017 terdiri dari:
1.PLTP Ulubelu Unit 4 (55 MW) (COD
25 April 2017)
2.PLTP Karaha Unit 1 (30 MW)
3.PLTP Sorik Marapi (Modular, 20 MW)
4.PLTP Sarulla Unit 2 (110 MW)
Indonesia
peringkat ke-2
dunia melampaui
Filipina
Indonesia
peringkat ke-1
dunia melampaui
Amerika
III. Roadmap Panas Bumi (1/2)
KEMENTERIANESDM9
ROADMAP BIODIESEL (Minimum)
Sektor April 2015 Januari 2016 Januari 2020 Januari 2025
Usaha Mikro, Usaha Perikanan, Usaha Pertanian,
Transportasi, dan Pelayanan Umum (PSO)
15% 20% 30% 30%
Transportasi Non PSO 15% 20% 30% 30%
Industri dan Komersial 15% 20% 30% 30%
Pembangkit Listrik 25% 30% 30% 30%
B2 – B7,5 B10 B15 B20
III. Roadmap Mandatori BBN (2/2)
Implementasi Biodiesel
KEMENTERIANESDM10
IV. Perizinan dan Non Perizinan
1. Ditjen EBTKE telah mengelola 6 jenis perizinan dan 25 jenis non perizinan.
2. Penyederhanaan perizinan telah dilakukan dengan pelimpahan 3 perizinandilaksanakan oleh BKPM antara lain:
1. Penugasan Survei Pendahuluan Panas Bumi
2. Izin Panas Bumi
3. Izin Penggunaan Gudang Bahan Peledak Panas Bumi
3. Penyederhanaan non perizinan telah dilakukan dengan pelimpahan 1 non perizinanyang dilaksanakan oleh BKPM, penghapusan 9 non perizinan dan saat ini dalamproses penghapusan 8 non perizinan lainnya.
4. Ditjen EBTKE tetap mengelola 3 jenis perizinan dan 7 jenis non perizinan.
63
25
7
02468
10121416182022242628
Awal Akhir
Perizinan (P) Non Perizinan (NP)
P : 3 ke BKPM
NP : 1 ke BKPM
9 dihapus
8 dalam proses dihapus
KEMENTERIANESDM11
IV. Insentif Fiskal dan non Fiskal (1/2)
11
No. Tax Allowance Bea Masuk Pendanaan
1. Peraturan Pemerintah No. 1 Tahun 2007 jo. PP
No. 62 Tahun 2008 jo. PP No.52 Tahun 2011
memberikan fasilitas berupa pengurangan PPh
netto 30% dari nilai investasi selama 6 tahun,
penyusutan dan amortisasi dipercepat.
Keputusan Menteri Keuangan No.
766/1992 memberikan fasilitas berupa
impor barang operasi oleh Pengusaha
untuk keperluan Pengusahaan sumber
daya Panasbumi tidak dipungut Bea
masuk, Pajak Pertambahan Nilai, Pajak
Penjualan atas Barang Mewah dan
Pajak Penghasilan.
Peraturan Menteri Keuangan No.
139/PMK.011/2011 mengatur tata cara
pemberian jaminan kelayakan usaha PT.
Perusahaan Listrik Negara (Persero)
untuk pembangunan pembangkit tenaga
listrik dengan menggunakan energi
terbarukan, batubara, dan gas yang
dilakukan melalui kerjasama dengan
pengembang listrik swasta.
2. PMK Nomor 144/PMK.011/2012 memberikan
fasilitas pajak penghasilan untuk penanaman
modal di bidang-bidang usaha tertentu
dan/atau di daerah-daerah tertentu berupa
pengurangan PPh netto 30% dari nilai investasi
selama 6 tahun, penyusutan dan amortisasi
dipercepat
Peraturan Menteri Keuangan No.
78/PMK.010/2005 memberikan fasilitas
pembebasan bea masuk atas impor
barang untuk kegiatan pengusahaan
Panas Bumi berdasarkan kontrak
sebelum berlakunya UU No. 27 Tahun
2003 tentang Panas Bumi.
Peraturan Menteri Keuangan -No.
03/PMK.011/2012 yang mengatur tata
cara pengelolaan dan
pertanggungjawaban fasilitas dana panas
bumi geothermal.
3. PMK Nomor 159/PMK.010/2015 memberikan
fasilitas pengurangan pajak penghasilan badan
paling banyak 100% dan paling sedikit 10%.
Peraturan Menteri Keuangan No.
177/PMK.011/2007 memberikan fasilitas
Pembebasan bea masuk atas impor
barang untuk kegiatan usaha hulu
minyak dan gas bumi serta panas bumi.
-
KEMENTERIANESDM12
IV. Insentif Fiskal dan non Fiskal (2/2)
12
No. Tax Allowance Bea Masuk Pendanaan
4.
PMK Nomor 89/PMK.010/2015 mengatur tata
cara pemberian fasilitas pajak penghasilan
untuk penanaman modal di bidang usaha
tertentu dan/atau di daerah tertentu serta
pengalihan aktiva dan sanksi bagi wajib pajak
badan dalam negeri yang diberikan fasilitas
pajak penghasilan.
Peraturan Menteri Keuangan No.
021/PMK.011/2010 memberikan fasilitas
perpajakan dan kepabeanan untuk
kegiatan pemanfaatan sumber energi
terbarukan
-
5.
PMK Nomor 268/PMK.03/2015 mengatur tata
cara pemberian fasilitas dibebaskan dari
pengenaan pajak pertambahan nilai atas impor
dan/atau penyerahan barang kena pajak
tertentu yang bersifat strategis dan tyata cara
pemnbayaran pajak pertambahan nilai barang
kena pajak tertentu yang bersifat strategis yang
telah dibebaskan serta pengenaan sanksi
Peraturan Menteri Keuangan No.
70/PMK.011/2013 Perlakuan Pajak
Pertambahan Nilai dan Pajak Penjualan
atas Barang Mewah atas Impor Barang
Kena Pajak Yang Dibebaskan dari
Pungutan Bea Masuk
-
F-3
SIEP Final Report – January 2018

KEMENTERIANESDM13
Penugasan kepada BUMNPemerintah akan memberikan penugasan kepada BUMN Panas Bumi dalam rangka pengembangan hulu
dan hilir panas bumi berdasarkan UU 21 tahun 2014
Penugasan Survei Pendahuluan + EksplorasiInvestor yang memenuhi persyaratan memiliki kesempatan untuk mendapatkan Penugasan Survei
Pendahuluan hingga tahap eksplorasi. Sebagai insentif wilayah kerja akan dilelang melalui mekanisme
penunjukan langsung
Pengeboran Eksplorasi oleh Pemerintah & Geothermal FundMengoptimalkan pemanfaatan dana Geothermal Fund sebesar USD 300 juta yang dikelola oleh PT. SMI
untuk melakukan eksplorasi sebelum pelelangan WKP. Hal ini juga sebagai upaya mitigasi risiko untuk
menurunkan risiko kegagalan dalam pengembangan panas bumi.
Pelelangan WKP Indonesia TimurPemerintah akan fokus melakukan pelelangan WKP di wilayah Indonesia Timur khususnya di daerah yang
memiliki BPP setempat lebih tinggi dari BPP Nasional
V. Upaya Pengembangan Panas Bumi (1/3)
KEMENTERIANESDM14
V. Upaya Pengembangan Bioenergi (2/3)
1. Mandatori Bahan Bakar Nabati B-20 (80% Solar, 20% Biodiesel),
2. Biogas Nasional, Non Komersial (Investasi Pemerintah) dan Semi Komersial (Penerapan
Subsidi Parsial)
3. Pengembangan Bioenergi Berbasis Hutan, Bekerjasama dengan Kementerian
Kehutanan, merupakan Pencadangan kawasan hutan produksi yang khusus diperuntukan
untuk pembangunan hutan energi sebagai sumber bahan baku bioenergi
4. Pulau Ikonis Energi Terbarukan (Sumba Iconic Island), Penyediaan sumber energi
baru terbarukan di Pulau Sumba, NTT sebesar 100% pada tahun 2025.
5. Biomassa Untuk Listrik, Pembangunan Pembangkit Listrik Tenaga Biomassa dengan
menggunakan bahan baku limbah biomassa dan sampah kota
KEMENTERIANESDM15
V. Upaya Pengembangan Aneka EBT (3/3)
1. Mendorong prioritas pengembangan Aneka EBT: Jangka pendek 1-3 tahun: PLTS (5.000 MW), PLTM/ PLTMH dan PLTB; Jangka menengah 4 – 7 tahun: Pengembangan PLTA, PLT Gasifikasi Batubara
(PLTGB), PLT Gelombang Laut (PLTGL);
2. Upaya pemerataan energi melalui penyediaan akses energi modern dengan EBT
melalui Dana Alokasi Khusus (DAK);
3. Penyusunan Road Map Aneka EBT bidang Energi Samudera, Hidro, Surya, Angin,
Batubara Tergaskan dan Nuklir;
4. Penyusunan SNI dan SKKNI bidang Aneka EBT.
KEMENTERIANESDM16
VI. Tantangan
1. Penyamaan pola pikir dalam pengembangan EBTKE masih
perlu ditingkatkan;
2. Skema bisnis dan Insentif belum optimum;
3. Teknologi masih tergantung dari Luar Negeri (TKDN kecil);
4. Harga relatif masih mahal;
5. Potensi/Cadangan perlu diperbaharui;
6. Skala kecil dan tersebar;
7. Sistem Interkoneksi masih terbatas;
8. Masih terdapat resistensi masyarakat.
KEMENTERIANESDM17
VI. Kemitraan Strategis
Berperan aktif dalam mendorong pemanfaatan
EBTKE;
Sebagai penerima manfaat, ikut berkontribusi
dalam menjaga keberlanjutan pemanfaatan
EBTKE;
Ikut berkontribusi dalam diseminasi informasi
pemanfaatan EBTKE.
Government
Academy Bussiness
Community
Melakukan inovasi teknologi sekaligus
menyiapkan inkubator untuk komersialisasi
Melakukan survei dan kajian potensi EBTKE
Melakukan kajian kebijakan terutama
bagaimana memanfaatkan hasil riset
Melakukan kajian teknologi sebelum
dikembangkan pemerintah
Bersama-sama meningkatkan TKDN
Mendorong transfer teknologi informasi
Menyusun regulasi dan kebijakan;
Fasilitator;
Memberikan pembinaan dan pengawasan;
Melaksanakan program di bidang EBTKE;
Diseminasi informasi program EBTKE;
Pemerintah wajib mengembangkan sumber daya EBT
dan meningkatkan efisiensi energi
Melakukan pengusahaan EBTKE;
Memproduksi EBTKE;
Berkontribusi dalam penerimaan negara dan
kegiatan ekonomi.
EBTKE
KEMENTERIANESDM18
www.esdm.go.id
F-4
SIEP Final Report – January 2018
KEMENTERIANESDM19
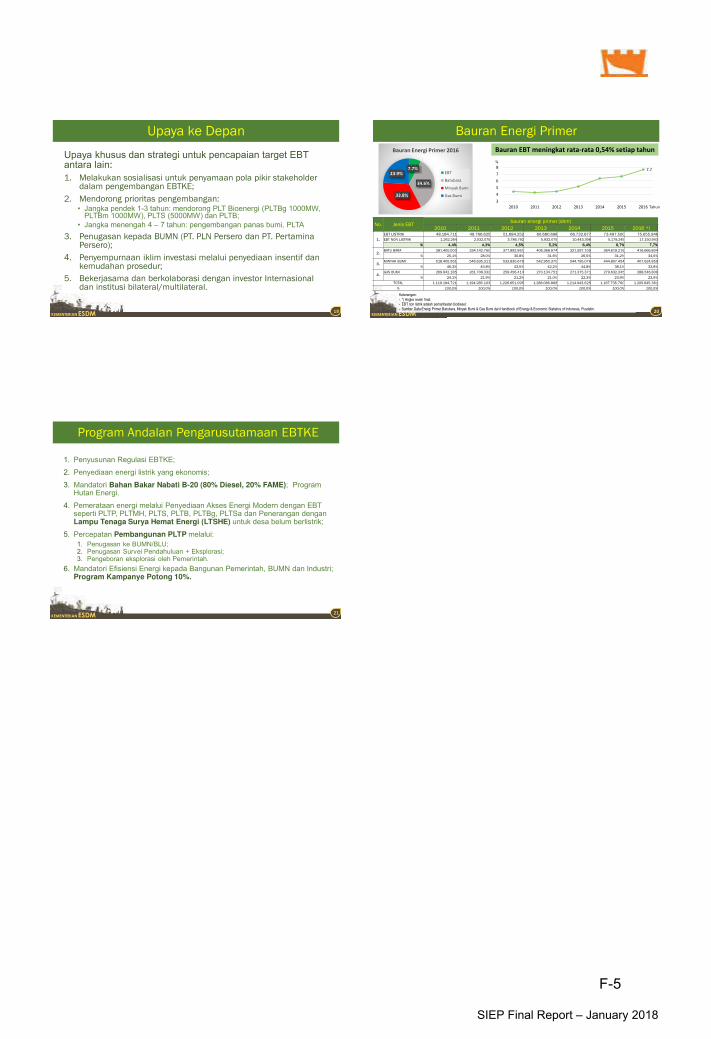
Upaya ke Depan
Upaya khusus dan strategi untuk pencapaian target EBTantara lain:
1. Melakukan sosialisasi untuk penyamaan pola pikir stakeholder dalam pengembangan EBTKE;
2. Mendorong prioritas pengembangan:• Jangka pendek 1-3 tahun: mendorong PLT Bioenergi (PLTBg 1000MW,
PLTBm 1000MW), PLTS (5000MW) dan PLTB;• Jangka menengah 4 – 7 tahun: pengembangan panas bumi, PLTA
3. Penugasan kepada BUMN (PT. PLN Persero dan PT. PertaminaPersero);
4. Penyempurnaan iklim investasi melalui penyediaan insentif dan kemudahan prosedur;
5. Bekerjasama dan berkolaborasi dengan investor Internasionaldan institusi bilateral/multilateral.
KEMENTERIANESDM20
7.7
3
4
5
6
7
8
2010 2011 2012 2013 2014 2015 2016
%
Tahun
Bauran Energi Primer
Keterangan:
- *) Angka revisi/ final;- EBT non listrik adalah pemanfaatan biodiesel;
- Sumber Data Energi Primer Batubara, Minyak Bumi & Gas Bumi dari Handbook of Energy & Economic Statistics of Indonesia, Pusdatin.
Bauran EBT meningkat rata-rata 0,54% setiap tahun
No. Jenis EBTbauran energi primer (sbm)
2010 2011 2012 2013 2014 2015 2016 *)
1.
EBT LISTRIK 48.184.711 49.766.625 51.684.252 60.680.698 66.732.677 73.497.500 75.655.946
EBT NON LISTRIK 1.262.264 2.032.075 3.786.792 5.932.075 10.443.396 5.179.245 17.150.943
% 4,4% 4,3% 4,5% 5,2% 6,4% 6,7% 7,7%
2.BATU BARA 281.400.000 334.142.760 377.892.961 406.368.974 321.597.105 364.619.216 416.666.804
% 25,1% 28,0% 30,8% 31,6% 26,5% 31,2% 34,6%
3.MINYAK BUMI 518.405.561 546.635.311 533.830.676 542.950.370 544.795.076 444.807.454 407.624.859
% 46,3% 45,8% 43,5% 42,2% 44,8% 38,1% 33,8%
4.GAS BUMI 269.942.185 261.708.332 259.456.414 270.134.751 271.375.371 279.632.345 288.546.809
% 24,1% 21,9% 21,2% 21,0% 22,3% 23,9% 23,9%
TOTAL 1.119.194.721 1.194.285.103 1.226.651.095 1.286.066.868 1.214.943.625 1.167.735.760 1.205.645.361
% 100,0% 100,0% 100,0% 100,0% 100,0% 100,0% 100,0%
7.7%
34.6%
33.8%
23.9%
Bauran Energi Primer 2016
EBT
Batubara
Minyak Bumi
Gas Bumi
KEMENTERIANESDM21
Program Andalan Pengarusutamaan EBTKE
1. Penyusunan Regulasi EBTKE;
2. Penyediaan energi listrik yang ekonomis;
3. Mandatori Bahan Bakar Nabati B-20 (80% Diesel, 20% FAME); Program Hutan Energi.
4. Pemerataan energi melalui Penyediaan Akses Energi Modern dengan EBT seperti PLTP, PLTMH, PLTS, PLTB, PLTBg, PLTSa dan Penerangan denganLampu Tenaga Surya Hemat Energi (LTSHE) untuk desa belum berlistrik;
5. Percepatan Pembangunan PLTP melalui:
1. Penugasan ke BUMN/BLU;2. Penugasan Survei Pendahuluan + Eksplorasi; 3. Pengeboran eksplorasi oleh Pemerintah.
6. Mandatori Efisiensi Energi kepada Bangunan Pemerintah, BUMN dan Industri; Program Kampanye Potong 10%.
F-5
SIEP Final Report – January 2018
© Badan Koordinasi Penanaman Modal, 2017
Jakarta, 31 Juli 2017
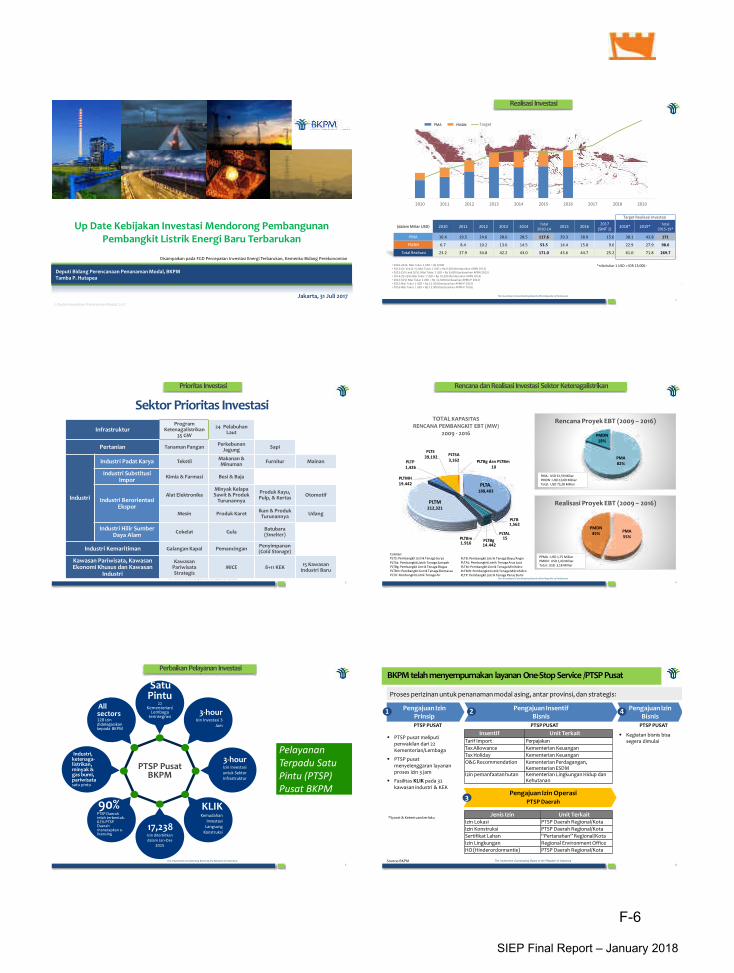
Up Date Kebijakan Investasi Mendorong Pembangunan Pembangkit Listrik Energi Baru Terbarukan
Deputi Bidang Perencanaan Penanaman Modal, BKPMTamba P. Hutapea
Disampaikan pada FGD Percepatan Investasi Energi Terbarukan, Kemenko Bidang Perekonomian
The Investment Coordinating Board of the Republic of Indonesia
2
2
Realisasi Investasi
(dalam Miliar USD) 2010 2011 2012 2013 2014Total
2010-142015 2016
2017
(SMT 1)2018* 2019*
Total
2015-19*
PMA 16.4 19.5 24.6 28.6 28.5 117.6 29.3 28.9 15.6 38.1 43.8 171
PMDN 6.7 8.4 10.2 13.6 14.5 53.5 14.4 15.8 9.6 22.9 27.9 98.6
Total Realisasi 23.2 27.9 34.8 42.2 43.0 171.0 43.6 44.7 25.2 61.0 71.8 269.7
Target Realisasi Investasi
*nilai tukar 1 USD = IDR 13,000.-• 2010-2012, Nilai Tukar 1 USD = Rp 9,000
• 2013 (Q I and Q II), Nilai Tukar 1 USD = Rp 9,300 (berdasarkan APBN 2013)
• 2013 (Q III and Q IV), Nilai Tukar 1 USD = Rp 9,600 (berdasarkan APBN 2013)
• 2014 (QI-QIII) Nilai Tukar 1 USD = Rp 10,500 (berdasarkan APBN 2014)
• 2014 (QIV) Nilai Tukar 1 USD = Rp 11,600 (berdasarkan APBN-P 2014)
• 2015 Nilai Tukar 1 USD = Rp 12.500 (berdasarkan APBN-P 2015)
• 2016 Nilai Tukar 1 USD = Rp 13.900 (berdasarkan APBN-P 2016)
2010 2011 2012 2013 2014 2015 2016 2017 2018 2019
FDI DDI TargetPMA PMDN
The Investment Coordinating Board of the Republic of Indonesia
3
InfrastrukturProgram
Ketenagalistrikan35 GW
24 PelabuhanLaut
Pertanian Tanaman PanganPerkebunan
JagungSapi
Industri
Industri Padat Karya TekstilMakanan &Minuman
Furnitur Mainan
Industri SubstitusiImpor
Kimia & Farmasi Besi & Baja
Industri BerorientasiEkspor
Alat ElektronikaMinyak KelapaSawit & Produk
Turunannya
Produk Kayu, Pulp, & Kertas
Otomotif
Mesin Produk KaretIkan & Produk
TurunannyaUdang
Industri Hilir SumberDaya Alam
Cokelat GulaBatubara (Smelter)
Industri Kemaritiman Galangan Kapal PemancinganPenyimpanan(Cold Storage)
Kawasan Pariwisata, KawasanEkonomi Khusus dan Kawasan
Industri
KawasanPariwisataStrategis
MICE 8+11 KEK15 Kawasan
Industri Baru
Sektor Prioritas Investasi
Prioritas Investasi
The Investment Coordinating Board of the Republic of Indonesia
4
PMA
55%
PMDN
45%
Realisasi Proyek EBT (2009 – 2016)
PPMA : USD 1,75 Milliar
PMDN : USD 1,43 Milliar
Total : USD 3,18 Milliar
PMA
82%
PMDN
18%
Rencana Proyek EBT (2009 – 2016)
PMA : USD 61,59 Miliar
PMDN : USD 13,69 Milliar
Total: USD 75,28 Milliar
Rencana danRealisasi Investasi Sektor Ketenagalistrikan
PLTA,
188,483
PLTAL15
PLTB1,562
PLTBg14.442
PLTBm1.916
PLTM212,321
PLTMH
19.442
PLTP
1,426
PLTS
39,192PLTSA
3,162 PLTBg dan PLTBm
10
TOTAL KAPASITAS
RENCANA PEMBANGKIT EBT (MW)
2009 - 2016
Catatan:
PLTS: Pembangkit Listrik Tenaga Surya
PLTSa: Pembangkit Listrik Tenaga Sampah
PLTBg: Pembangkit Listrik Tenaga Biogas
PLTBm: Pembangkit Listrik Tenaga Biomassa
PLTA: Pembangkit Listrik Tenaga Air
PLTB: Pembangkit Listrik Tenaga Bayu/Angin
PLTAL: Pembangkit Listrik Tenaga Arus Laut
PLTM: Pembangkit Listrik Tenaga Minihidro
PLTMH: Pembangkit Listrik Tenaga Mikrohidro
PLTP: Pembangkit Listrik Tenaga Panas Bumi
The Investment Coordinating Board of the Republic of Indonesia
5
Pelayanan
Terpadu Satu
Pintu (PTSP)
Pusat BKPM
SatuPintu
22 Kementerian/
Lembagaterintegrasi
3-hourIzin Investasi 3
Jam
All sectors128 izindidelegasikankepada BKPM
17,238Izin diterbitkan
dalam Jan-Des
2015
KLIKKemudahan
Investasi
Langsung
Konstruksi
90%PTSP Daerah telah terbentuk. 61% PTSP Daerah menerapkan e-licensing
3-hourIzin Investasi
untuk Sektor
Infrastruktur
Industri, ketenaga-listrikan, minyak & gas bumi, pariwisatasatu pintu
PTSP PusatBKPM
Perbaikan Pelayanan Investasi
The Investment Coordinating Board of the Republic of Indonesia
6
2 41Pengajuan Izin
PrinsipPTSP PUSAT
Pengajuan InsentifBisnis
PTSP PUSAT
Pengajuan IzinBisnis
PTSP PUSAT
Proses perizinan untuk penanaman modal asing, antar provinsi, dan strategis:
3Pengajuan Izin Operasi
PTSP Daerah
Jenis Izin Unit TerkaitIzin Lokasi PTSP Daerah Regional/Kota
Izin Konstruksi PTSP Daerah Regional/Kota
Sertifikat Lahan Pertanahan Regional/Kota
Izin Lingkungan Regional Environment Office
HO (Hinderordonnantie) PTSP Daerah Regional/Kota
Insentif Unit TerkaitTarif Import Perpajakan
Tax Allowance Kementerian Keuangan
Tax Holiday Kementerian Keuangan
O&G Recommendation Kementerian Perdagangan,Kementerian ESDM
Izin pemanfaatan hutan Kementerian Lingkungan Hidup danKehutanan
PTSP pusat meliputiperwakilan dari 22 Kementerian/Lembaga
PTSP pusatmenyelenggaran layananproses izin 3 jam
Fasilitas KLIK pada 32kawasan industri & KEK
Kegiatan bisnis bisasegera dimulai
*Syarat & Ketentuan berlaku
BKPM telah menyempurnakan layanan One-Stop Service /PTSP Pusat
Source: BKPM
F-5
SIEP Final Report – January 2018
F-6
SIEP Final Report – January 2018
The Investment Coordinating Board of the Republic of Indonesia 7
Des 2014Sistem Perizinan
Online
Jan 2015Pendirian PTSP Pusat
di BKPM
Okt 2015Layanan Izin Investasi
3 Jam (3 jenis izin)
Jan 2016Layanan Izin Investasi 3
Jam (8 izin + 1)
Jan 2017Layanan Izin
Investasi 3 Jam bidang ESDM
Juli 2017Izin Prinsip Digital
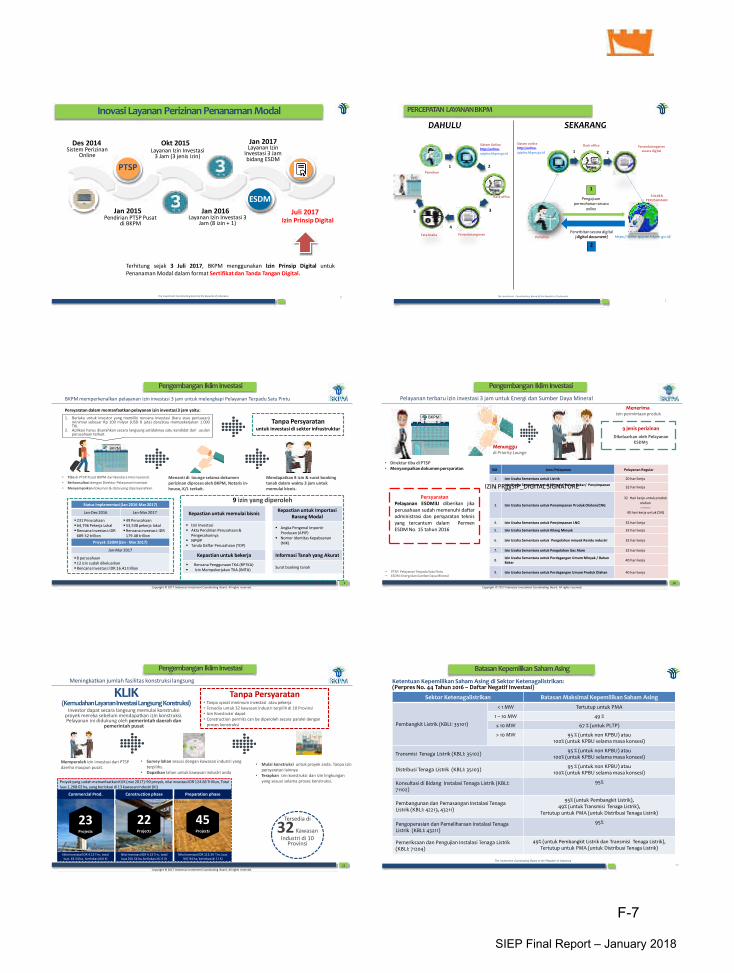
Inovasi Layanan Perizinan Penanaman Modal
PTSP
ESDM
Terhitung sejak 3 Juli 2017, BKPM menggunakan Izin Prinsip Digital untuk
Penanaman Modal dalam format Sertifikat dan Tanda Tangan Digital.
online-spipise.bkpm
5
2
DAHULU SEKARANG
Sistem onlinehttp://online-
spipise.bkpm.go.id
Sistem Onlinehttp://online-
spipise.bkpm.go.id
Back office Penandatanganansecara digital1
1 2
Pemohon
FOLDERPERUSAHAAN
Back officePengajuan
permohonan secaraonline3
4Penerbitan secara digital
(digital document)PenandatangananTata Usaha https:// .go.id/Pemohon
The Investment Coordinating Board of the Republic of Indonesia
1
2
1
PERCEPATAN LAYANANBKPM
Copyright © 2017 Indonesia Investment Coordinating Board. All rights reserved.
9
BKPM memperkenalkan pelayanan izin investasi 3 jam untuk melengkapi Pelayanan Terpadu Satu Pintu
Persyaratan dalam memanfaatkan pelayanan izin investasi 3 jam yaitu:
BKPM
1. Berlaku untuk investor yang memiliki rencana investasi (baru atau perluasan)minimial sebesar Rp 100 milyar (USD 8 juta) dan/atau mempekerjakan 1.000TKI.
2. Aplikasi harus diserahkan secara langsung setidaknya satu kandidat dari usulanperusahaan terkait.
• Tiba di PTSP Pusat BKPM dari Bandara Internasional.
• Berkonsultasi dengan Direktur Pelayanan Investasi.
• Menyampaikan dokumen & data yang dipersyaratkan.
Menanti di lounge selama dokumen
perizinan diproses oleh BKPM, Notaris in-
house, K/L terkait.
Mendapatkan 8 izin & surat booking
tanah dalam waktu 3 jam untuk
memulai bisnis.
9 izin yang diperoleh
Kepastian untuk memulai bisnisKepastian untuk Importasi
Barang Modal
Izin Investasi
Akta Pendirian Perusahaan &
Pengesahannya
NPWP
Tanda Daftar Perusahaan (TDP)
Angka Pengenal Importir
Produsen (APIP)
Nomor Identitas Kepabeanan
(NIK)
Kepastian untuk bekerja Informasi Tanah yang Akurat
Rencana Penggunaan TKA (RPTKA)
Izin Mempekerjakan TKA (IMTA)Surat booking tanah
Tanpa Persyaratanuntuk investasi di sektor infrastruktur
Status Implementasi (Jan 2016-Mar 2017)
Jan-Dec 2016 Jan-Mar 2017
231 Perusahaan
64,796 Pekerja Lokal
Rencana Investasi: IDR
689.52 trillion
49 Perusahaan
53,538 pekerja lokal
Rencana investasi: IDR
179.48 trillion
Proyek ESDM (Jan - Mar 2017)
Jan-Mar 2017
8 perusahaan
12 izin sudah dikeluarkan
Rencana Investasi: IDR 16.41 trillion
Pengembangan IklimInvestasi
Copyright © 2017 Indonesia Investment Coordinating Board. All rights reserved.
10
• Direktur tiba di PTSP• Menyampaikandokumen persyaratan.
MenerimaIzin permintaan produk
BKPM
9 jenis perizinan
Dikeluarkan oleh PelayananESDM3
Persyaratan Pelayanan ESDM3J diberikan jika
perusahaan sudah memenuhi daftar
administrasi dan persyaratan teknis
yang tercantum dalam Permen
ESDM No. 15 tahun 2016
Menunggudi Priority Lounge
• PTSP: Pelayanan Terpadu Satu Pintu• ESDM: Energi dan Sumber Daya Mineral
NO Jensi Pelayanan Pelayanan Regular
1. Izin Usaha Sementara untuk Listrik 20 hari kerja
2.Izin Usaha Sementara untuk Minyak/ Bahan Bakar/ Penyimpanan
LPG32 hari kerja
3. Izin Usaha Sementara untuk Penyimpanan Produk Olahan/CNG
32 Hari kerja untuk produk
olahan
---------
40 hari kerja untuk CNG
4. Izin Usaha Sementara untuk Penyimpanan LNG 32 hari kerja
5. Izin Usaha Sementara untuk Kilang Minyak 32 hari kerja
6. Izin Usaha Sementara untuk Pengolahan minyak Residu industri 32 hari kerja
7. Izin Usaha Sementara untuk Pengolahan Gas Alam 32 hari kerja
8.Izin Usaha Sementara untuk Perdagangan Umum Minyak / Bahan
Bakar40 hari kerja
9. Izin Usaha Sementara untuk Perdagangan Umum Produk Olahan 40 hari kerja
Pelayanan terbaru izin investasi 3 jam untuk Energi dan Sumber Daya Mineral
Pengembangan IklimInvestasi
IZIN PRINSIP_DIGITAL SIGNATURE
Copyright © 2017 Indonesia Investment Coordinating Board. All rights reserved.
11
Meningkatkan jumlah fasilitas konstruksi langsung
KLIK(Kemudahan Layanan Investasi Langsung Konstruksi)
Tanpa Persyaratan• Tanpa syarat minimum investasi atau pekerja
• Tersedia untuk 32 kawasan industri terpilih di 10 Provinsi
• Izin Konstruksi dapat
• Construction permits can be diperoleh secara paralel dengan
proses konstruksi
Investor dapat secara langsung memulai konstruksi proyek mereka sebelum mendapatkan izin konstruksi. Pelayanan ini didukung oleh pemerintah daerah dan
pemerintah pusat
Memperoleh izin investasi dari PTSP
daerha maupun pusat.
• Survey lahan sesuai dengan kawasan industri yang
terpilihs.
• Dapatkan lahan untuk kawasan industri anda
• Mulai konstruksi untuk proyek anda. Tanpa izin
persyaratan lainnya
• Terapkan izin konstruksi dan izin lingkungan
yang sesuai selama proses konstruksi.
23Projects
Commercial Prod.
Nilai investasi IDR 4.13 Trn, total
luas 63.54 ha, berlokasi di 6 KI
22Projects
Construction phase
Nilai investasi IDR 4.13 Trn, total
luas 256.54 ha, berlokasi di 11 KI
45Projects
Preparation phase
Nilai investasi IDR 113.34 Trn, luas
947.94 ha, berlokasi di 11 KI
Proyek yang sudah memanfaatkan KLIK (mei 2017): 90 proyek, nilai investasi IDR 124.66 Trilliun, Total
luas 1,268.02 ha, yang berlokasi di 13 kawasan industri (KI)
Tersedia di
32 Kawasan
Industri di 10 Provinsi
Pengembangan IklimInvestasi
The Investment Coordinating Board of the Republic of Indonesia
12
Sektor Ketenagalistrikan Batasan Maksimal Kepemilikan Saham Asing
Pembangkit Listrik (KBLI: 35101)
< 1 MW Tertutup untuk PMA
1 – 10 MW 49 %
≤ 10 MW 67 % (untuk PLTP)
> 10 MW 95 % (untuk non KPBU) atau100% (untuk KPBU selama masa konsesi)
Transmisi Tenaga Listrik (KBLI: 35102)95 % (untuk non KPBU) atau
100% (untuk KPBU selama masa konsesi)
Distribusi Tenaga Listrik (KBLI: 35103)95 % (untuk non KPBU) atau
100% (untuk KPBU selama masa konsesi)
Konsultasi di Bidang Instalasi Tenaga Listrik (KBLI: 71102)
95%
Pembangunan dan Pemasangan Instalasi Tenaga Listrik (KBLI: 42213, 43211)
95% (untuk Pembangkit Listrik), 49% (untuk Transmisi Tenaga Listrik),
Tertutup untuk PMA (untuk Distribusi Tenaga Listrik)
Pengoperasian dan Pemeliharaan Instalasi Tenaga Listrik (KBLI: 43211)
95%
Pemeriksaan dan Pengujian Instalasi Tenaga Listrik(KBLI: 71204)
49% (untuk Pembangkit Listrik dan Transmisi Tenaga Listrik), Tertutup untuk PMA (untuk Distribusi Tenaga Listrik)
Ketentuan Kepemilikan Saham Asing di Sektor Ketenagalistrikan:(Perpres No. 44 Tahun 2016 – Daftar Negatif Investasi)
Batasan Kepemilikan Saham Asing
F-5
SIEP Final Report – January 2018
F-7
SIEP Final Report – January 2018

The Investment Coordinating Board of the Republic of Indonesia
13
PAJAK PENGHASILAN(TAX ALLOWANCE)
PP No. 9/2016 jo PP No. 18/2015
145 bidangusaha(Daftar bidang usaha dalamLampiran PP 9/2016)
30% darijumlahinvestasiPengurangan penghasilannetto selama 6 (enam) tahun, yaitu sebesar 5% per tahun
Penyusutan dan amortisasi yang
dipercepat.
Pajak Penghasilan atas
penghasilan dividen yang
dibayarkan kepada subjek
pajak luar negeri selain
bentuk usaha tetap di
Indonesia
≤ 10%
• berlokasi di Kawasan
Industri dan/atau Kawasan
Berikat
• melakukan
pembangunan
infrastruktur• menggunakan bahan baku
dalam negeri ≥70%.
Kompensasi kerugian 5-10 tahun, bagi
perusahaan yang:• menyerap tenaga kerja
500-1.000 orang
• melakukan kegiatan
penelitian dan
pengembangan (R&D)
• melakukan reinvestasi
• melakukan ekspor ≥30% dari penjualan.
PEMBEBASAN PAJAK PENGHASILAN (TAX HOLIDAY)
PMK No.159/PMK.010/2015
5-15yearsPembebasan Pajak Penghasilan sejak TahunPajak dimulainya produksi komersial. Dapatdiperpanjang hingga maksimum 20 tahundengan diskresi Menteri Keuangan.
Industri Pionir1. Industri logam hulu
2. Industri pengilangan
minyak bumi;
3. Industri kimia dasar
organik yang
bersumber dari minyak
bumi dan gas alam
4. Industri permesinan yang
menghasilkan mesin
industri
5. Industri pengolahan
berbasis hasil pertanian,
kehutanan, dan
perikanan
6. Indsutri telekomunikasi,
informasi dan komunikasi
7. Industri transportasi
kelautan
8. Industri pengolahan yang
merupakan industri
utama di Kawasan
Ekonomi Khusus (KEK);
dan atau
9. Infrastruktur ekonomi
non KPBU.
Pengurangan Pajak Penghasilan Badan:
10% -1 00 % dari Pajak Penghasilan badanyang terhutang.
> IDR1TrilliunRencana Investasi: (USD 80 Juta)
Untuk industri telekomunikasi, informasi dankomunikasi (ICT):
≤ 50 % dari Pajak Penghasilanbadan yang terhutang.
IDR50Miliar - IDR1TrilliunRencana Investasi:
PEMBEBASAN BEA MASUK(IMPORT DUTY FACILITY)
PMK No.176/PMK.011/2009 jo.
PMK No. 76/PMK.011/2012 jo. PMK
188/PMK.010/2015
PMK No. 66/PMK.010/2015
Pembebasan Bea Masuk atas Impor
Barang Modal dalam rangka
Pembangunan atau Pengembangan
Industri Pembangkitan Tenaga Listrik
untuk Kepentingan Umum
2 tahunPembebasan bea masuk atasimpor mesin
2 tahunPembebasan bea masuk atas
impor barang dan bahan untuk
keperluan produksi sesuai
kapasitas terpasang
4 tahun (tambahan2 tahun)Pembebasan bea masuk atas impor
barang dan bahan untuk keperluan
tambahan produk apabila
menggunakan mesin dalam negeri:
>30% daritotal nilaimesin
Insentif Investasi Sektor Energi
The Investment Coordinating Board of the Republic of Indonesia 14
Fasilitas Impor Barang Modal
Percepatan dan kepastian dalam pemrosesan customs clearance
Lebih cepat dan pasti•Tidak perlu screening barangmodal.•Memotong waktu pemrosesan dari 3-5 hari menjadi hanya 30 menit.
Persyaratan mudah• Proyek dalam tahap konstruksi• Memenuhi kewajiban pelaporan
LKPM Triwulanan ke BKPM• Rekomendasi dari BKPM
PENYELESAIAN KEPABEANAN (CUSTOMS
CLEARENCE)
4 status pengecekan kepabeanan:
•Jalur Merah untuk perusahaan baru.
Dilakukan pemeriksaan fisik & dokumen
sebelum barang dipindahkan dari
pelabuhan.
•Jalur KuningHanya dilakukan pengecekan dokumen
sebelum barang dipindahkan dari
pelabuhan.
•Jalur HijauPengecekan dokumen dilakukan setelah
barang dipindahkan dari pelabuhan.
•Prioritas Mitra Utama untuk perusahaan
dengan track record yang terbukti baik. Tidak
diperlukan pengecekan.
Fasilitas Baru:
Peningkatan Statusdari jalur merah ke jalur hijau untuk
perusahaan baru yang dalam tahap
konstruksi
Perbaikan Iklim Investasi
The Investment Coordinating Board of the Republic of Indonesia
15
No.JenisEnergiTerbarukan
Pelaksanaan Pembelian
Tarif
Jika
BPP S ≤ BPP NJika
BPP S > BPP N
1. PLTS PV (Surya)Pelelangan berdasarkan kuota kapasitas yangditawarkan
100% x BPP S Maksimum 85% x BPPS
2. PLTB (Bayu/Angin)Pelelangan berdasarkan kuota kapasitas yangditawarkan
100% x BPP S Maksimum 85% x BPPS
3. PLTA (Air)
Harga Patokan Kesepakatan para pihak Maksimum 100% BPPS
Pemilihan Langsung Harga ditentukan pada proses pemilihan langsung
a. Tenaga Air ≤ MW: Capacity Factor paling sedikit 65%b. Tenaga Air > 10 MW: Capacity Factor tergantung kebutuhan sistem
4. PLTBm (Biomassa)Harga Patokan (Kapasitas ≤ MW) 100% x BPP S Maksimum 85% x BPPS
Pemilihan Langsung (Kapasitas > 10MW) Harga ditentukan pada proses pemilihan langsung
5. PLTBg (Biogas)Harga Patokan (Kapasitas ≤ MW) 100% x BPP S Maksimum 85% x BPPS
Pemilihan Langsung (Kapasitas > 10MW) Harga ditentukan pada proses pemilihan langsung
6.PLTSa (SampahPerkotaan)
Harga Patokan Kesepakatan para pihak Maximum 100% BPP S
7. PLTP (Panas Bumi) Harga Patokan Kesepakatan para pihak Maximum 100% BPP S
BPP Pembangkitan sistem setempat dan rata – rata BPP Pembangkitan nasional merupakan BPP Pembangkitan nasional pada tahun sebelumnyayang telah ditetapkan oleh Menteri berdasarkan usulan PT PLN (Persero).
(Permen ESDM No. 12 Tahun 2017 sebagaimana telah diubah dengan Permen ESDM No. 43 Tahun 2017)
Catatan: BPP S: Biaya Pokok Penyediaan Sistem SetempatBPP N: Biaya Pokok Penyediaan Nasional
Sumber: Kementerian ESDM, 2017
Harga Pembelian Tenaga Listrik EBT
The Investment Coordinating Board of the Republic of Indonesia
16
BPP Pembangkitan PT PLN (Persero) Tahun 2016(Periode 1 April 2017 – 31 Maret 2018)
Catatan:• Dalam hal sampai dengan akhir periode belum terdapat penetapan besaran BPP Pembangkitan terbaru, maka BPP Pembangkitan di atas tetap berlaku
sampai dengan ditetapkannya besaran BPP Pembengkitan terbaru.• Dalam hal terdapat lokasi tertentu yang belum terlistriki oleh PLN dan belum terdapat penetapan besaran BPP Pembangkitan, maka besaran BPP
Pembangkitan ditetapkan sebesar sama dengan besaran BPP Pembangkitan tertinggi.
Sumber: Kepmen ESDM 1404 K/20/MEM/2017
10.39
9.28
8.07
10.14
7.86 7.77
13.66
12.17
6.51 6.51 6.51 6.52 6.54 6.62
12.43
9.04
10.20
12.75
8.10
13.68
17.52 17.32
13.54
7.39
0.00
2.00
4.00
6.00
8.00
10.00
12.00
14.00
16.00
18.00
20.00(sen US$ per kWh)
BPP Sistem Setempat
BPP Pembangkitan Nasional
Produksi Tenaga Listrik
The Investment Coordinating Board of the Republic of Indonesia
17
2. One Stop Service
Deskripsi
Sejak diberlakukannya harga beli listrik EBT berdasarkan Permen No. 12/2017, maka pasar menganggap harga tersebut sangat
rendah dan tidak layak untuk investasi suatu proyek pembangkit listrik EBT di Indonesia. Bahkan berapa investor yang sudah
punya izin prinsip dan izin konstruksi tidak dapat merealisasikan proyeknya.
Hal ini terjadi karena dukungan pemerintah tidak berubah/belum optimal sejak penerbitan Permen tersebut. Padalah diketahui
rendahnya harga beli listrik di UEA yang dijadikan referensi/benchmark penerbitan Permen ESDM 12/2017 adalah karena adanya
dukungan dan insentif yang maksimal dari pemerintah negara tersebut.
Kondisi ini tentunya akan menjadikan target pengembangan pembangkit EBT 23 % tahun 2025 sulit tercapai.
Deskripsi
Batas kepemilikan saham asing hanya 49% untuk pembangkit di bawah 10 MW sangat tidak menarik, khususnya untuk EBT.
Karena karakteristik kapasitas pembangkit proyek EBT pada umumnya (PLTS, PLTB, PLTM) kecuali PLTP dan PLTA adalah di bawah
10 MW.
Harga Pembelian Listrik EBT
Batas Kepemilikan Saham Asing
Usulan Solusi
1.Perlunya insentif fiskal (tax holliday) baru untuk bidang usaha pembangkit EBT.
2.Perlu dukungan pemerintah yang lebih maksimal (Kementerian ESDM), misalnya pembebasan lahan ditanggung oleh
pemerintah lewat APBN atau pembebasan dilakukan oleh pengembang dan kemudian diganti oleh LMAN.
3.Khusus untuk PLTP, Insentif dan dukungan khusus dari pemerintah sangat diperlukan karena proyek ini membutuhkan
investasi besar dan risiko yang besar sejak tahap eksplorasi. Bentuknya selain pembebasan lahan oleh swasta, juga dukungan
perbankan nasional dalam memberikan bunga pinjaman yang murah dan, proses perizinan yang cepat.
Usulan Solusi
Perubahan DNI ketentuan maksimum kepemilikan saham asing khusus untuk pembangkit EBT diatas 1 MW adalah 95 %.
(1/3)Kendala Umumyang dihadapi Investor pada Proyek Pembangkit Listrik EBT
The Investment Coordinating Board of the Republic of Indonesia
18
Deskripsi
Penyelesaian perizinan untuk proyek pembangkit listrik terutama di daerah (Izin Lokasi, Izin Lingkungan, IMB) sering
membutuhkan waktu yang panjang dan tidak pasti. Salah satu penyebabnya adalah belum adanya standarisasi dokumen
perizinan dan Standard Operating Procedure (SOP), sehingga pelayanan perizinan tidak sama di setiap daerah. Seringkali proyek
pembangkit listrik EBT yang merupakan Proyek Strategis Nasional atau Prioritas Nasional terhambat pemberian izinnya karena
kurangnya dukungan pemerintah pusat dan daerah dalam mempercepat realisasi proyek-proyek dimaksud.
Sementara itu, investor memiliki batas waktu 1 tahun untuk menyelesaikan perizinannya sesuai waktu Financial Close yang
disepakti dengan pihak PT PLN.
Perizinan Pusat dan Daerah
.
Usulan Solusi
1. Perlu ada integrasi sistem perizinan pusat dan daerah untuk pelayanan perizinan EBT, diantaranya bagi proyek-proyek yang
diusulkan untuk masuk dalam RUPTL PLN dan proyek-proyek yang merupakan Proyek Strategis Nasional atau Prioritas
Nasional)
2. Mempertimbangkan bahwa pembangkit listrik merupakan fasilitas umum, yang mana menurut UU No 2/2012 pengadaan
lahannya menggunakan metoda penetapan lokasi, bukan izin lokasi. Sehingga keterlibatan pemerintah sudah ada sejak awal
proyek dan biayanya dibebankan kepada pemerintah
(2/3)Kendala Umum yang dihadapi Investor pada Proyek Pembangkit Listrik EBT
Deskripsi
Pembangunan jaringan transmisi dari lokasi pembangkit ke Gardu Induk menjadi tanggung jawab pengembang. Walaupun
dipertimbangkan dalam penentuan harga beli listrik, tetapi sering menambah beban investasi yang cukup besar, apalagi untuk
proyek pembangkit EBT dengan harga saat ini.
Jaringan Transmisi
Usulan Solusi
Jika dimungkinkan, pembangunan jaringan transmisi dilakukan oleh swasta tetapi kemudian diganti oleh PLN.
F-8
SIEP Final Report – January 2018
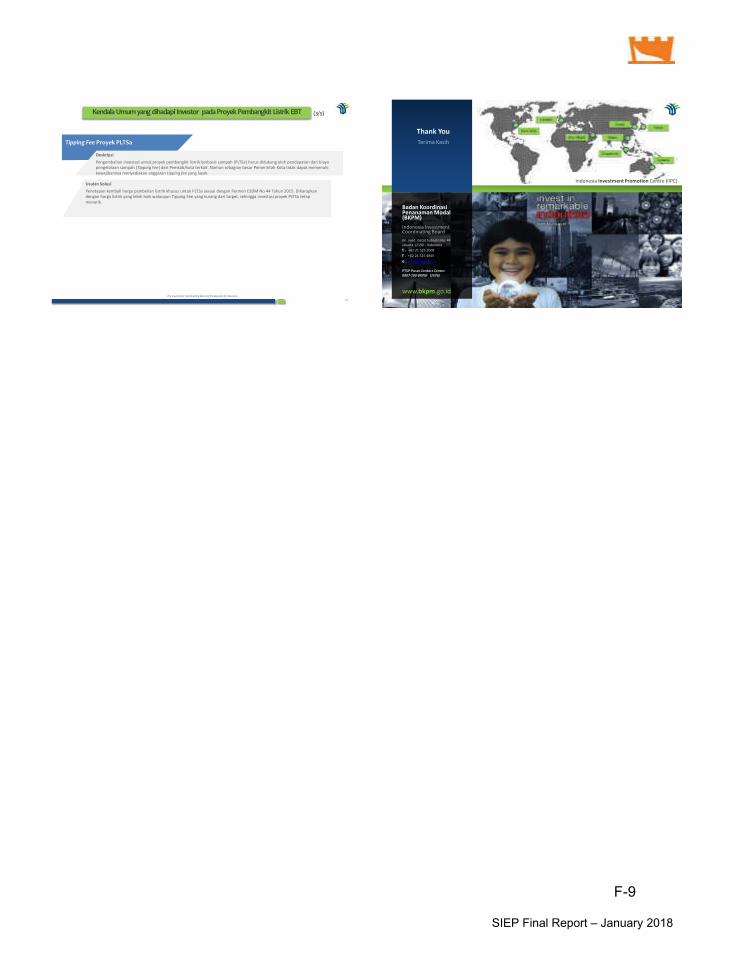
The Investment Coordinating Board of the Republic of Indonesia
19
Deskripsi
Pengembalian investasi untuk proyek pembangkit listrik berbasis sampah (PLTSa) harus didukung oleh pendapatan dari biaya
pengelolaan sampah (Tipping Fee) dari Pemkab/kota terkait. Namun sebagian besar Pemerintah Kota tidak dapat memenuhi
kewajibannya menyediakan anggaran tipping fee yang layak.
Tipping Fee Proyek PLTSa
Usulan Solusi
Penetapan kembali harga pembelian listrik khusus untuk PLTSa sesuai dengan Permen ESDM No 44 Tahun 2015. Diharapkan
dengan harga listrik yang lebih baik walaupun Tipping Fee yang kurang dari target, sehingga investasi proyek PLTSa tetap
menarik.
(3/3)Kendala Umumyang dihadapi Investor pada Proyek Pembangkit Listrik EBT
The Investment Coordinating Board of the Republic of Indonesia
20
Badan Koordinasi Penanaman Modal (BKPM)
Indonesia Investment Coordinating Board
Jln. Jend. Gatot Subroto No. 44
Jakarta 12190 - Indonesia
t . +62 21 525 2008
f . +62 21 525 4945
PTSP Pusat Contact Center:
0807-100-BKPM (2576)
www.bkpm.go.id
Indonesia Investment Promotion Centre (IIPC)
Thank You
Terima Kasih
F-9
SIEP Final Report – January 2018

TINJAUAN KEBIJAKAN SEKTOR ENERGI TERHADAP
PERKEMBANGAN INVESTASI ENERGI BARU TERBARUKAN
DEWAN ENERGI NASIONAL
Jakarta, 31 Juli 2017
ABADI POERNOMOANGGOTA UNSUR PEMANGKU KEPENTINGAN DEN
DEWAN ENERGI NASIONAL
UU No 30 Tahun 2017tentang Energi
KEBIJAKAN ENERGI NASIONALPeraturan Pemerintah No 79/2014
RUEN(Rencana Umum Energi
Nasional)
RUKN(Rencana Umum
Ketenagalistrikan Nasional)
RUPTL
(Rencana Usaha
Penyediaan Tenaga Listrik)
RUED - Provinsi
(Rencana Umum Energi
Daerah)
RUED – Kabupaten/Kota(Rencana Umum Energi
Daerah)
KEBIJAKAN DI SEKTOR ENERGI
DEWAN ENERGI NASIONAL
KEBIJAKAN ENERGI NASIONAL(PP NO. 79 TAHUN 2014 TENTANG KEBIJAKAN ENERGI NASIONAL)
DEWAN ENERGI NASIONAL
Kebijakan Utama Kebijakan Pendukung
Ketersediaan Energi untuk
Kebutuhan Nasional
Prioritas Pengembangan Energi
Pemanfaatan Sumber Daya Energi
Nasional
Cadangan Energi Nasioanl
Konservasi Energi, Diversifikasi Sumber Daya
Energi dan Diversifikasi Energi
Lingkungan Hidup dan Keselamatan
Harga, Subsidi dan Insentif Energi
Infrastruktur, Akses untuk Masyarakat, dan
Industri Energi
Penelitian, Pengembangan dan Penerapan
Teknologi Energi
Kelembagaan dan Pendanaan
1
2
3
4
1
2
3
4
5
6
ARAH KEBIJAKAN ENERGI NASIONAL
F-6
SIEP Final Report – January 2018
F-10
SIEP Final Report – January 2018
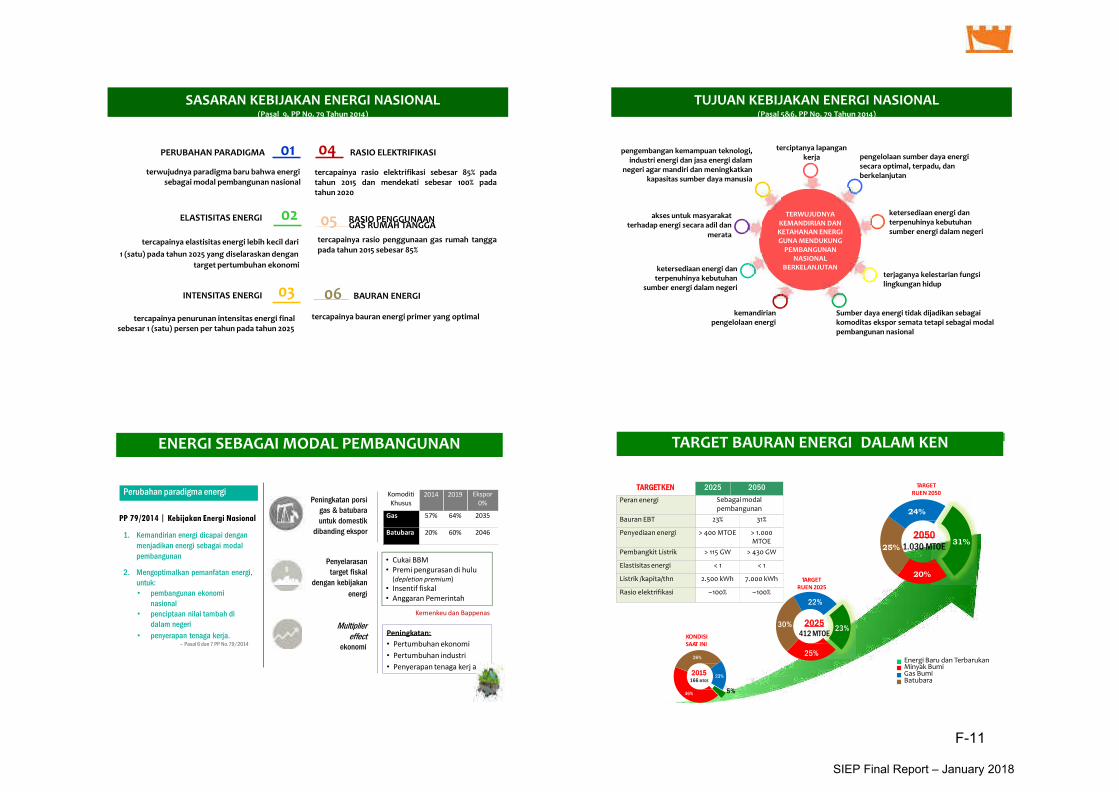
DEWAN ENERGI NASIONAL
01
03
PERUBAHAN PARADIGMA
terwujudnya paradigma baru bahwa energi sebagai modal pembangunan nasional
ELASTISITAS ENERGI
tercapainya elastisitas energi lebih kecil dari
1 (satu) pada tahun 2025 yang diselaraskan dengan
target pertumbuhan ekonomi
INTENSITAS ENERGI
tercapainya penurunan intensitas energi finalsebesar 1 (satu) persen per tahun pada tahun 2025
02
04 RASIO ELEKTRIFIKASI
tercapainya rasio elektrifikasi sebesar 85% padatahun 2015 dan mendekati sebesar 100% padatahun 2020
05 RASIO PENGGUNAANGAS RUMAH TANGGA
tercapainya rasio penggunaan gas rumah tangga pada tahun 2015 sebesar 85%
06 BAURAN ENERGI
tercapainya bauran energi primer yang optimal
SASARAN KEBIJAKAN ENERGI NASIONAL(Pasal 9, PP No. 79 Tahun 2014)
DEWAN ENERGI NASIONAL
TERWUJUDNYA KEMANDIRIAN DAN KETAHANAN ENERGI GUNA MENDUKUNG
PEMBANGUNAN NASIONAL
BERKELANJUTAN
TUJUAN KEBIJAKAN ENERGI NASIONAL(Pasal 5&6, PP No. 79 Tahun 2014)
terciptanya lapangan kerja
kemandirian pengelolaan energi
pengembangan kemampuan teknologi, industri energi dan jasa energi dalam
negeri agar mandiri dan meningkatkan kapasitas sumber daya manusia
akses untuk masyarakat terhadap energi secara adil dan
merata
terjaganya kelestarian fungsilingkungan hidup
Sumber daya energi tidak dijadikan sebagaikomoditas ekspor semata tetapi sebagai modal pembangunan nasional
ketersediaan energi danterpenuhinya kebutuhan
sumber energi dalam negeri
pengelolaan sumber daya energisecara optimal, terpadu, dan berkelanjutan
ketersediaan energi danterpenuhinya kebutuhan sumber energi dalam negeri
DEWAN ENERGI NASIONAL
Peningkatan:
• Pertumbuhan ekonomi
• Pertumbuhan industri
• Penyerapan tenaga kerj a
• Cukai BBM
• Premi pengurasan di hulu(depletion premium)
• Insentif fiskal
• Anggaran Pemerintah
Kemenkeu dan Bappenas
1. Kemandirian energi dicapai dengan
menjadikan energi sebagai modal
pembangunan
2. Mengoptimalkan pemanfatan energi,
untuk:
• pembangunan ekonomi
nasional
• penciptaan nilai tambah di
dalam negeri
• penyerapan tenaga kerja. Pasal 6 dan 7 PP No.79/2014
Perubahan paradigma energi
PP 79/2014 | Kebijakan Energi Nasional
Peningkatan porsi
gas & batubara
untuk domestik
dibanding ekspor
Penyelarasan
target fiskal
dengan kebijakan
energi
Multipliereffect
ekonomi
ENERGI SEBAGAI MODAL PEMBANGUNAN
Komoditi
Khusus
2014 2019 Ekspor
0%
Gas 57% 64% 2035
Batubara 20% 60% 2046
DEWAN ENERGI NASIONAL
46%
26%
23%
5%
2015166 MTOE
23%
25%
30%
22%
2025412 MTOE
31%
20%
25% 1.030 MTOE
TARGET
RUEN 2050
24%
2050
Energi Baru dan Terbarukan Minyak BumiGas Bumi Batubara
TARGET
RUEN 2025
KONDISI
SAAT INI
TARGET BAURAN ENERGI DALAM KEN
TARGET KEN 2025 2050
Peran energi Sebagai modal pembangunan
Bauran EBT 23% 31%
Penyediaan energi > 400 MTOE > 1.000MTOE
Pembangkit Listrik > 115 GW > 430 GW
Elastisitas energi < 1 < 1
Listrik /kapita/thn 2.500 kWh 7.000 kWh
Rasio elektrifikasi 100% 100%
F-11
SIEP Final Report – January 2018
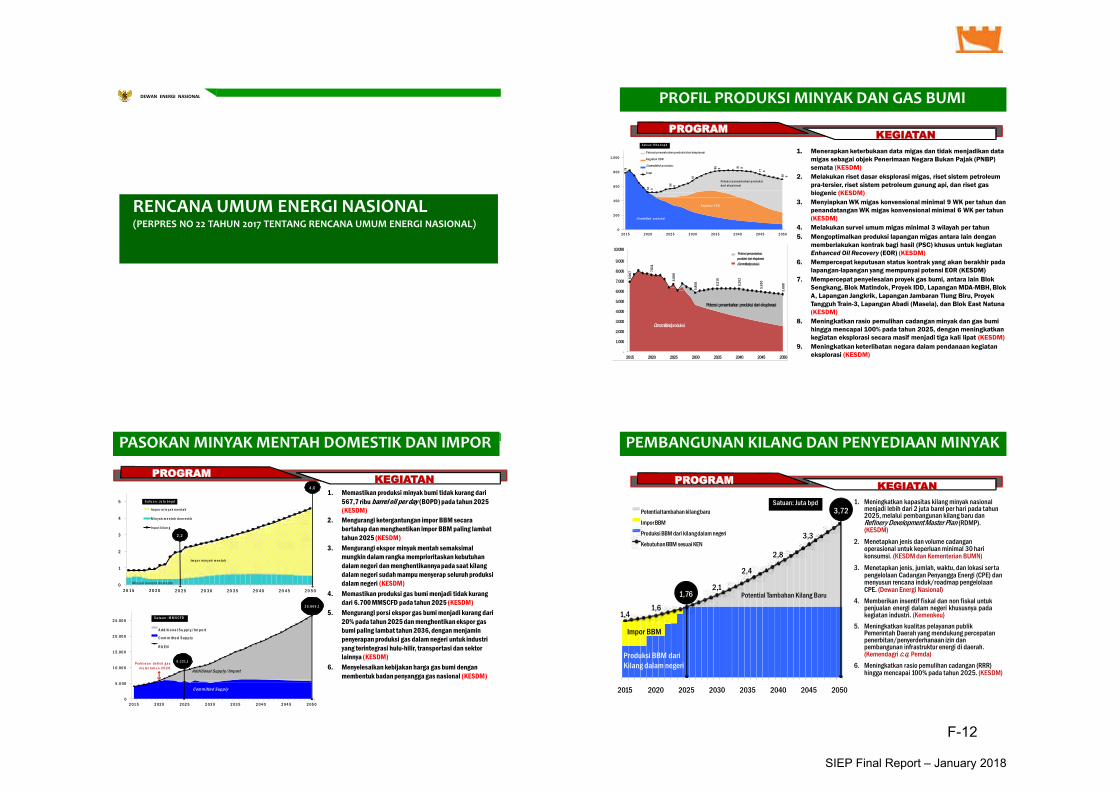
DEWAN ENERGI NASIONAL
RENCANA UMUM ENERGI NASIONAL(PERPRES NO 22 TAHUN 2017 TENTANG RENCANA UMUM ENERGI NASIONAL)
DEWAN ENERGI NASIONAL
6.9
07 7.
61
1
6.6
80
5.8
08
6.2
10
6.2
02
5.9
30
5.6
68
-
1.000
2.000
3.000
4.000
5.000
6.000
7.000
8.000
9.000
10.000 Satuan: MMSCFD
2015 2020 2025 2030 2035 2040 2045 2050
Potensi Penambahan Produksi
dari Eksplorasi
CommittedProduksi
Potensipenambahan
produksi dari eksplorasi
Commitedproduksi
Potensi penambahan produksidari eksplorasi
Committedproduksi
78
6
52
0
56
8
67
7
80
9 81 8
77
0
69
9
0
2 00
4 00
6 00
8 00
1 .0 00
P otensial tam bahan produksi dari eksplorasi
Com m itted produks i
Potensi p enamb ahan p rod uksi d ari eksplorasi
Keg iatan EOR
Committed p rod uksi
Total
Potensi p enam b ahan p rod uk si
dari ek s p lorasi
Kegiatan EOR
Committed p rod uk si
2 01 5 2 02 0 2 02 5 2 03 0 2 03 5 2 04 0 2 04 5 2 05 0
Satuan: Rib u b op d
1. Menerapkan keterbukaan data migas dan tidak menjadikan data
migas sebagai objek Penerimaan Negara Bukan Pajak (PNBP)
semata (KESDM)
2. Melakukan riset dasar eksplorasi migas, riset sistem petroleum
pra-tersier, riset sistem petroleum gunung api, dan riset gas
biogenic (KESDM)
3. Menyiapkan WK migas konvensional minimal 9 WK per tahun dan
penandatangan WK migas konvensional minimal 6 WK per tahun
(KESDM)
4. Melakukan survei umum migas minimal 3 wilayah per tahun
5. Mengoptimalkan produksi lapangan migas antara lain dengan
memberlakukan kontrak bagi hasil (PSC) khusus untuk kegiatan
Enhanced Oil Recovery (EOR) (KESDM)
6. Mempercepat keputusan status kontrak yang akan berakhir pada
lapangan-lapangan yang mempunyai potensi EOR (KESDM)
7. Mempercepat penyelesaian proyek gas bumi, antara lain Blok
Sengkang, Blok Matindok, Proyek IDD, Lapangan MDA-MBH, Blok
A, Lapangan Jangkrik, Lapangan Jambaran Tiung Biru, Proyek
Tangguh Train-3, Lapangan Abadi (Masela), dan Blok East Natuna
(KESDM)
8. Meningkatkan rasio pemulihan cadangan minyak dan gas bumi
hingga mencapai 100% pada tahun 2025, dengan meningkatkan
kegiatan eksplorasi secara masif menjadi tiga kali lipat (KESDM)
9. Meningkatkan keterlibatan negara dalam pendanaan kegiatan
eksplorasi (KESDM)
KEGIATANPROGRAM
PROFIL PRODUKSI MINYAK DAN GAS BUMI
DEWAN ENERGI NASIONAL
0
5 .0 00
1 0.00 0
1 5.00 0
2 0.00 0
2 5.00 0
2 01 5 2 02 0 2 02 5 2 03 0 2 03 5 2 04 0 2 04 5 2 05 0
A d d i tio n a l S u p p l y/ Im p o rt
C o m m it te d Su p p l y
R U E N
Com m itted Supply
Additional Supply/Import
P e rk ira a n d e f is it g a s
m u la i ta h u n 2 0 2 0
S a tu a n : M M S C F D
2 5 .8 6 9 ,1
9 .2 21,1
0
1
2
3
4
5
M in ya k m en ta h do m es tik
2 0 1 5 2 0 2 0 2 0 2 5 2 0 3 0 2 0 3 5 2 0 4 0 2 0 4 5 2 0 5 0
Im po r m in ya k m e n ta h
M in ya k m e n ta h do m estik
In pu t k ila n g
S a tu a n : Ju ta bo pd
Im po r min ya k m en ta h
2 ,2
4 ,6
1. Memastikan produksi minyak bumi tidak kurang dari
567,7 ribu barrel oil per day (BOPD) pada tahun 2025
(KESDM)
2. Mengurangi ketergantungan impor BBM secara
bertahap dan menghentikan impor BBM paling lambat
tahun 2025 (KESDM)
3. Mengurangi ekspor minyak mentah semaksimal
mungkin dalam rangka memprioritaskan kebutuhan
dalam negeri dan menghentikannya pada saat kilang
dalam negeri sudah mampu menyerap seluruh produksi
dalam negeri (KESDM)
4. Memastikan produksi gas bumi menjadi tidak kurang
dari 6.700 MMSCFD pada tahun 2025 (KESDM)
5. Mengurangi porsi ekspor gas bumi menjadi kurang dari
20% pada tahun 2025 dan menghentikan ekspor gas
bumi paling lambat tahun 2036, dengan menjamin
penyerapan produksi gas dalam negeri untuk industri
yang terintegrasi hulu-hilir, transportasi dan sektor
lainnya (KESDM)
6. Menyelesaikan kebijakan harga gas bumi dengan
membentuk badan penyangga gas nasional (KESDM)
KEGIATANPROGRAM
PASOKAN MINYAK MENTAH DOMESTIK DAN IMPORDEWAN ENERGI NASIONAL
1. Meningkatkan kapasitas kilang minyak nasional menjadi lebih dari 2 juta barel per hari pada tahun 2025, melalui pembangunan kilang baru dan Refinery DevelopmentMaster Plan (RDMP). (KESDM)
2. Menetapkan jenis dan volume cadangan operasional untuk keperluan minimal 30 hari konsumsi. (KESDM dan Kementerian BUMN)
3. Menetapkan jenis, jumlah, waktu, dan lokasi ser ta pengelolaan Cadangan Penyangga Energi (CPE) dan menyusun rencana induk/roadmap pengelolaan CPE. (Dewan Energi Nasional)
4. Memberikan insentif fiskal dan non fiskal untukpenjualan energi dalam negeri khususnya padakegiatan industri. (Kemenkeu)
5. Meningkatkan kualitas pelayanan publik Pemerintah Daerah yang mendukung percepatan penerbitan/penyerderhanaan izin dan pembangunan infrastruktur energi di daerah. (Kemendagri c.q. Pemda)
6. Meningkatkan rasio pemulihan cadangan (RRR) hingga mencapai 100% pada tahun 2025. (KESDM)
KEGIATANPROGRAM
2015 2020 2025 2030 2035 2040 2045 2050
Potentialtambahan kilangbaru
ImporBBM
Produksi BBM dari kilangdalam negeri
KebutuhanBBM sesuai KEN
Impor BBM
Produksi BBM dari
Kilang dalam negeri
Potential Tambahan Kilang Baru1,76
3,72Satuan: Juta bpd
1,41,6
2,1
2,4
2,8
3,3
PEMBANGUNAN KILANG DAN PENYEDIAAN MINYAK
F-12
SIEP Final Report – January 2018
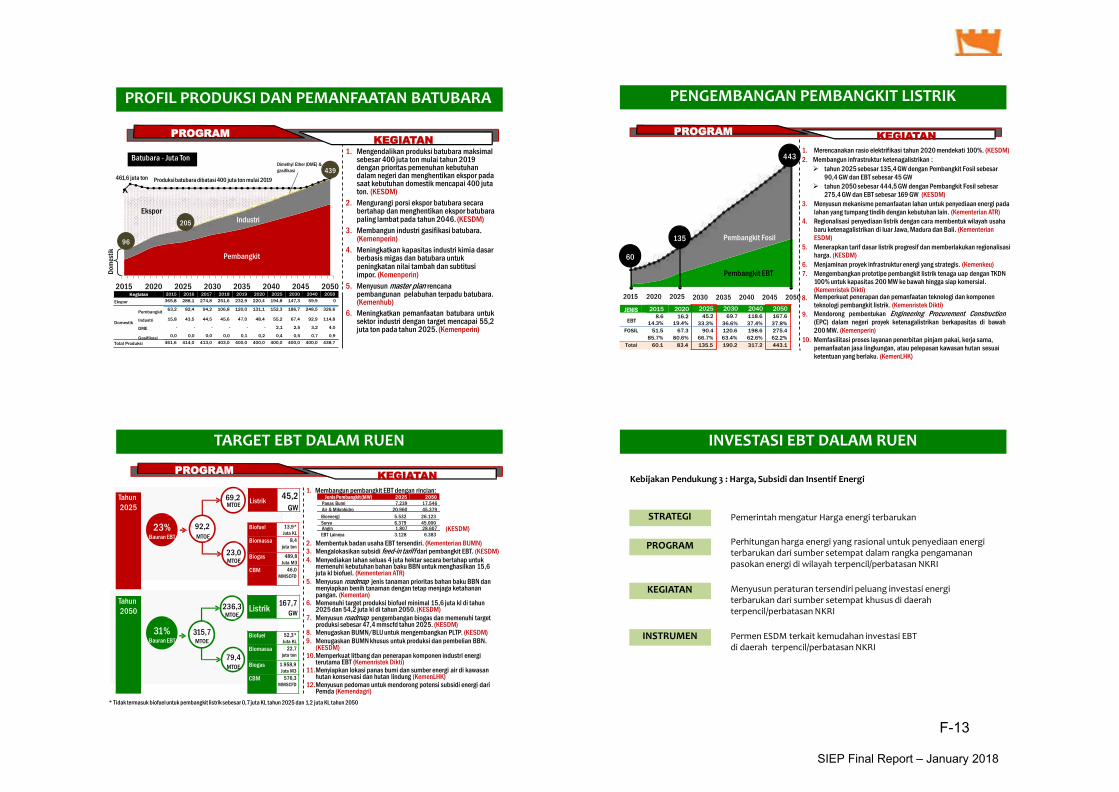
DEWAN ENERGI NASIONAL
2015 2020 2025 2030 2035 2040 2045 2050
1. Mengendalikan produksi batubara maksimal sebesar 400 juta ton mulai tahun 2019 dengan prioritas pemenuhan kebutuhan dalam negeri dan menghentikan ekspor padasaat kebutuhan domestik mencapai 400 jutaton. (KESDM)
2. Mengurangi porsi ekspor batubara secara bertahap dan menghentikan ekspor batubara paling lambat pada tahun 2046. (KESDM)
3. Membangun industri gasifikasi batubara. (Kemenperin)
4. Meningkatkan kapasitas industri kimia dasarberbasis migas dan batubara untuk peningkatan nilai tambah dan subtitusi impor. (Kemenperin)
5. Menyusun master plan rencana pembangunan pelabuhan terpadu batubara. (Kemenhub)
6. Meningkatkan pemanfaatan batubara untuksektor industri dengan target mencapai 55,2juta ton pada tahun 2025. (Kemenperin)
Kegiatan
Ekspor
Domestik
Pembangkit
Industri
DME
Gasifikasi
Total Produksi
96
439
205
Batubara - Juta Ton
Produksibatubara dibatasi 400 juta ton mulai 2019461,6 juta ton
Pembangkit
EksporIndustri
Dom
esti
k
Dimethyl Ether (DME) &
gasifikasi
KEGIATANPROGRAM
PROFIL PRODUKSI DAN PEMANFAATAN BATUBARA
2015 2016 2017 2018 2019 2020 2025 2030 2040 2050
365,8 288,1 274,8 251,6 232,9 220,4 194,8 147,3 59,9 0
63,2 82,4 94,2 106,8 120,0 131,1 152,3 186,7 248,5 326,6
15,8 43,5 44,5 45,6 47,0 48,4 55,2 67,4 92,9 114,8
- - - - - - 2,1 2,5 3,2 4,0
0,0 0,0 0,0 0,0 0,1 0,2 0,4 0,5 0,7 0,9
461,6 414,0 413,0 403,0 400,0 400,0 400,0 400,0 400,0 438,7
DEWAN ENERGI NASIONAL
2015 2020 2025
JENIS
EBT
135
443
60
1. Merencanakan rasio elektrifikasi tahun 2020 mendekati 100%. (KESDM)
2. Membangun infrastruktur ketenagalistrikan :
tahun 2025 sebesar 135,4 GW dengan Pembangkit Fosil sebesar90,4 GW dan EBT sebesar 45 GW
tahun 2050 sebesar 444,5 GW dengan Pembangkit Fosil sebesar275,4 GW dan EBT sebesar 169 GW (KESDM)
3. Menyusun mekanisme pemanfaatan lahan untuk penyediaan energi pada lahan yang tumpang tindih dengan kebutuhan lain. (Kementerian ATR)
4. Regionalisasi penyediaan listrik dengan cara membentuk wilayah usaha baru ketenagalistrikan di luar Jawa, Madura dan Bali. (Kementerian ESDM)
5. Menerapkan tarif dasar listrik progresif dan memberlakukan regionalisasi harga. (KESDM)
6. Menjaminan proyek infrastruktur energi yang strategis. (Kemenkeu)
7. Mengembangkan prototipe pembangkit listrik tenaga uap dengan TKDN 100% untuk kapasitas 200 MW ke bawah hingga siap komersial. (Kemenristek Dikti)
10. Memfasilitasi proses layanan penerbitan pinjam pakai, kerja sama, pemanfaatan jasa lingkungan, atau pelepasan kawasan hutan sesuai ketentuan yang berlaku. (KemenLHK)
KEGIATANPROGRAM
Pembangkit Fosil
Pembangkit EBT
PENGEMBANGAN PEMBANGKIT LISTRIK
2030 2035 2040 2045 2050 8. Memperkuat penerapan dan pemanfaatan teknologi dan komponen teknologi pembangkit listrik. (Kemenristek Dikti)
9. Mendorong pembentukan Engineering Procurement Construction(EPC) dalam negeri proyek ketenagalistrikan berkapasitas di bawah200 MW. (Kemenperin)
2015 20208.6 16.2
14.3% 19.4%
202545.2
33.3%
203069.7
36.6%
2040118.6
37.4%
2050167.6
37.8%
FOSIL 51.5
85.7%
67.3
80.6%
90.4
66.7%
120.6
63.4%
198.6
62.6%
275.4
62.2%
Total 60.1 83.4 135.5 190.2 317.2 443.1
DEWAN ENERGI NASIONAL
* Tidak termasuk biofueluntuk pembangkit listrik sebesar 0,7juta KL tahun 2025 dan 1,2 juta KL tahun 2050
1. Membangun pembangkit EBT dengan rincian:
(KESDM)
2. Membentuk badan usaha EBT tersendiri. (Kementerian BUMN)3. Mengalokasikan subsidi feed-in tariff dari pembangkit EBT. (KESDM)
4. Menyediakan lahan seluas 4 juta hektar secara bertahap untuk memenuhi kebutuhan bahan baku BBN untuk menghasilkan 15,6juta kl biofuel. (Kementerian ATR)
5. Menyusun roadmap jenis tanaman prioritas bahan baku BBN dan menyiapkan benih tanaman dengan tetap menjaga ketahanan pangan. (Kementan)
6. Memenuhi target produksi biofuel minimal 15,6 juta kl di tahun 2025 dan 54,2 juta kl di tahun 2050. (KESDM)
7. Menyusun roadmap pengembangan biogas dan memenuhi target produksi sebesar 47,4 mmscfd tahun 2025. (KESDM)
8. Menugaskan BUMN/BLU untuk mengembangkan PLTP. (KESDM)9. Menugaskan BUMN khusus untuk produksi dan pembelian BBN.
(KESDM)10.Memperkuat litbang dan penerapan komponen industri energi
terutama EBT (Kemenristek Dikti)11.Menyiapkan lokasi panas bumi dan sumber energi air di kawasan
hutan konservasi dan hutan lindung (KemenLHK)12.Menyusun pedoman untuk mendorong potensi subsidi energi dari
Pemda (Kemendagri)
Jenis Pembangkit (MW) 2025 2050
Panas Bumi 7.239 17.546
Air & Mikrohidro 20.960 45.379
Angin 1.807 28.607
EBT Lainnya 3.128 6.383
KEGIATANPROGRAM
Tahun
2025
23%Bauran EBT
92,2MTOE
23,0MTOE
Listrik45,2
GW
69,2MTOE
Tahun
2050
31%Bauran EBT
315,7MTOE
79,4MTOE
Listrik167,7
GW236,3
MTOE
TARGET EBT DALAM RUEN
Bioenergi 5.532 26.123
Surya 6.379 45.000Biofuel 13,9*
Juta KL
Biomassa 8,4juta ton
Biogas 489,8Juta M3
CBM 46,0MMSCFD
Biofuel 52,3*Juta KL
Biomassa 22,7juta ton
Biogas 1.958,9Juta M3
CBM 576,3MMSCFD
DEWAN ENERGI NASIONAL
INVESTASI EBT DALAM RUEN
Menyusun peraturan tersendiri peluang investasi energiterbarukan dari sumber setempat khusus di daerahterpencil/perbatasan NKRI
Kebijakan Pendukung 3 : Harga, Subsidi dan Insentif Energi
Pemerintah mengatur Harga energi terbarukan
Perhitungan harga energi yang rasional untuk penyediaan energiterbarukan dari sumber setempat dalam rangka pengamananpasokan energi di wilayah terpencil/perbatasan NKRI
Permen ESDM terkait kemudahan investasi EBTdi daerah terpencil/perbatasan NKRI
STRATEGI
PROGRAM
KEGIATAN
INSTRUMEN
F-13
SIEP Final Report – January 2018

DEWAN ENERGI NASIONAL
INVESTASI EBT DALAM RUEN
1. Memberikan insentif dan fasilitas investasi berupa penerapanjaminan resiko atas pemanfaatan hasil penelitian teknologienergi nasional kepada perguruan tinggi, perorangan,lembaga penelitian yang berhasil mengembangkan teknologi inti pada bidang EBT
2. Memberikan penghargaan bagi lembaga swasta atauperorangan yang telah berhasil mengembangkan teknologi inti dan inovasi untuk mendorong usaha EBT
Kebijakan Pendukung 3 : Harga, Subsidi dan Insentif Energi
Pemerintah memberikan insentif bagi lembaga swasta atauperorangan yang mengembangkan teknologi inti pada bidang EBT
Pemberian insentif dan fasilitas investasi bagi lembaga swasta atauperorangan yang mengembangkan teknologi inti pada bidang EBT
Rencana Strategis Kementerian Riset, Teknologidan Perguruan Tinggi
STRATEGI
PROGRAM
KEGIATAN
INSTRUMEN
DEWAN ENERGI NASIONAL
CAPAIAN BAURAN ENERGI NASIONAL
DEWAN ENERGI NASIONAL
BAURAN EBT MENINGKAT RATA-RATA
0,55% PER TAHUN 3)
Catatan:1) Target tahun 2016 berdasarkan RUEN;2) Angka Sementara;3) Dalam RUEN peningkatan EBT s.d tahun 2025 rata-rata ditargetkan 0,9% per tahun.
4,4% 4,3%4,5%
5,3%
6,4%6,7%
7,7%
9,8% 10,4%
00%
02%
04%
06%
08%
10%
12%
2010
Target RUEN
2011 2012 2013 2014 2015 2016
%
TAHUN
Capaian
19
RUEN 2025
Energi Baru dan TerbarukanMinyak Bumi
Gas Bumi
Batubara
TARGET KONDISI
2016
22%
23%
25%
30%400
MTOE
167,4
MTOE
23,9%
7,7%
33,8%
34,6%
CAPAIAN BAURAN ENERGI PRIMER
ENERGI
PRIMERTARGET 1)
2016 (MTOE)CAPAIAN 2)
2016 (MTOE)
Minyak Bumi 76,4 34,9% 56,6 33,8%
Gas Bumi 45,9 21,0% 40,1 23,9%
Batubara 73,5 33,6% 57,9 34,6%
EBT 22,8 10,4% 12,9 7,7%
TOTAL 218,6 100% 167,4 100%
DEWAN ENERGI NASIONAL
Dewan Energi Nasional
Jalan Gatot Soebroto Kav. 49 Jakarta Selatan 12950
Website: www.den.go.id
Phone: (021) 52921621Email: [email protected]
#EnergiBerkeadilan
@dewanenergi dewanenerginasional www.den.go.id
8
F-14
SIEP Final Report – January 2018

Pengembangan EnergiTerbarukan dalam Konteks
Ekonomi Berkelanjutan
Imaduddin Abdullah
INDEF
31 Juli 2017
Outline
Tren Investasi Energi Terbarukan
Urgensi Pengembangan Energi Terbarukan
Implikasi Kebijakan
Tren Investasi Energi TerbarukanGlobal
Investasi Energi Terbarukan di Level Global
47
72.7
112.7
159.3
181.4 178.3
243.6
281.2
255.5
234.4
278.2
312.2
241.6
0
50
100
150
200
250
300
350
2004 2005 2006 2007 2008 2009 2010 2011 2012 2013 2014 2015 2016
Sumber: Frankfurt School of Finance & Management gGmbH, dalam Global Trends in Renewable Energy Investment (2017)
Investasi Energi Terbarukan Tahun 2016 (USD Miliar)
Investasi Energi Terbarukan: Negara Berkembang vs Negara Maju
0
50
100
150
200
250
0
50
100
150
200
250
2004 2005 2006 2007 2008 2009 2010 2011 2012 2013 2014 2015 2016
China, India, Brazil Other Developing Developed
Sumber: Frankfurt School of Finance & Management gGmbH, dalam Global Trends in Renewable Energy Investment (2017)
Investasi Energi Terbarukan Tahun 2016 (USD Miliar)
Faktor Pendorong Investasi Energi Terbarukan
• Ketidakpastian Pasokan Energi dan Volatilitas Harga• Harga energi fosil cenderung sangat bergejolak dan biaya dari volatilitas sangat
mahal
• Pengalaman krisis energi tahun 70an
• Meningkatnya Skala Ekonomi dan Perkembangan Teknologi• Sebagai contoh: investasi solar panel sudah semakin efisien
• Kebijakan Sejumlah Negara• Pada 2011, setidaknya terhadap 118 yang memiliki target bauran energi dan
kebijakan mendukung energi terbarukan, meningkat dari 55 negara pada awal 2005
• Meningkatnya Perhatian Terhadap Masalah Lingkungan• COP 21 yang memiliki target untuk menurukan emisi CO2
• Sustainable Development Goals: Poin 7 -> Clean Energy
F-6
SIEP Final Report – January 2018
F-15
SIEP Final Report – January 2018

Investasi Energi Terbarukan Tahun 2016
0
0.2
0.4
0.6
0.8
1
1.2
1.4
1.6 NO ENERGY RESOURCESINSTALLED CAPACITY
(IC)RATIO (%)
1 2 3 4 5 = 4/3
1 Hydro 75.000 MW 7.572,00 MW 10,1 %
2 Geothermal 28.910 MW 1.403,50 MW 4,9 %
3 Biomass 32.654 MW 1.717,90 MW 5,4 %
4 Solar4,80
kWh/m2/day48,05 MW -
5 Wind 3 – 6 m/s 1,87 MW -
6 Marine 49 GW ***) 0,01 MW ****) -
7 Nuclear 3.000 MW *) 30,00 MW **) -
• Investasi sektor energi terbarukan di Indonesia
rendah
• Padahal Indonesia memiliki potensi pengembangan
energi terbarukan yang tinggi
Sumber: Frankfurt School of Finance & Management gGmbH, dalam Global
Trends in Renewable Energy Investment (2017)
Sumber: ESDM (2014)
Investasi Energi Terbarukan Tahun 2016 (USD Miliar)
Urgensi Pengembangan EnergiTerbarukan
Urgensi Pengembangan Energi Terbarukan
Mendorong Pertumbuhan Ekonomi
Menopang Peningkatan Permintaan Energi
Menjamin Ketahanan Energi
Menyelesaikan Kegagalan Pasar
1. Energi untuk Menopang Ekonomi
4.56
5.74 5.875
4.32
5.12
6.275
0
1
2
3
4
5
6
7
2001-2005 2006-2010 2011-2015
GDP Energy
Sumber: BPS dan ESDM (2017), diolah
1. Mendorong Pertumbuhan Ekonomi UntukKeluar dari MIC
$-
$2,000.00
$4,000.00
$6,000.00
$8,000.00
$10,000.00
$12,000.00
$14,000.00
$16,000.0010%
11%
12%
Indonesia harus mencapai pertumbuhan 12% untuk keluar dari middle income trap pada tahun 2025
Sumber: Nazara (2014), diolah
Energi Terbarukan dan Membangun dariPinggiran
22%
58%
3%
8%
6% 3%
Sumatera Jawa Bali dan NT
Kalimantan Sulawesi Maluku dan Papua0
5
10
15
20
25
Sumatera Jawa-Bali Kalimantan Sulawesi NT-Maluku-Papua
Persentase Kemiskinan di Sejumlah Pulau di
Indonesia (%)Kontribusi dalam Pembentukan PDB Nasional
Sumber: BPS (2017), diolah Sumber: BPS (2017), diolah
F-16
SIEP Final Report – January 2018

Energi Terbarukan dan Membangun dariPinggiran
• Sejumlah daerah memiliki rasioelektrifikasi yang rendah
• Padahal, ketersediaan listrikadalah salah satu prasyaratpembangunan
• Sejumlah sumber energiterbarukan tersebar di seluruhIndonesia, seperti panas bumi, air, matahari, dan sampah
• UU No 30 2009 tentangKetenagalistrikanmengamantkan: penyediaanlistrik merupakan tanggungjawab pemerintah daerah(district)
Sumber: ESDM (2016)
Dampak Energi Terbarukan terhadap Ekonomi
Sumber: IRENA (2016)
• Meningkatkan porsi dari Energi
Terbarukan sebesar dua kali
lipat akan membuat GDP dunia
tahun 2030 1,1 persen lebih
tinggi dibandingkan Business as
Usual
• Peningkatan ini didorong oleh
efek multiplier yang tercipta
dari investasi energi terbarukan
• Pada kasus Indonesia,
peningkatan GDP dapat
mencapai 0,3-1,3 persen pada
tahun 2030
Dampak Energi Terbarukan terhadap Ekonomi2. Menopang Pertumbuhan PermintaanEnergi: Meningkatnya Jumlah Penduduk
200
220
240
260
280
300
320
2010 2015 2020 2025 2030 2035
Jumlah Penduduk
• Pada 2035, jumlah penduduk Indonesia mencapai 305 juta jiwa
• Sepanjang 2010- 2035, pertumbuhan penduduk rata-rata 5,09
• Hal ini secara otomatis akan meningkatkan permintaan energi
Sumber: BPS (2017)
2. Menopang Pertumbuhan Permintaan Energi: Meningkatnya Konsumsi Listrik per Kapita
0
2
4
6
8
10
12
0.6
0.7
0.8
0.9
1
1.1
1.2
2011 2012 2013 2014 2015 2016 2017 2018 2019 2020
Konsumsi Listrik per Kapita di Sejumlah Negara (MWh) Konsumsi Listrik per Kapita di Indonesia (MWh)
Sumber: Aviliani (2017) Sumber: ESDM (2017), diolah INDEF
3. Jaminan Pasokan Energi
SUMBER : PKK-ITB
F-17
SIEP Final Report – January 2018

Volatilatas Harga Energi dan Kesejahteraan
Net Oil Imporiteres Net Oil Exporter
Pendapatan per
Kapita
Perubahan
terhadap GDP
Pendapatan per
Kapita
Perubahan
terhadap GDP
<300 -1,47 <300 +5,21
300-900 -0,76 900-9000 +4,16
900-9000 -0.56
>9000 -0.44
Sumber: Bank Dunia (2015)
Ketergantungan energi yang bersumber dari impor memberikan dampak negatif
terhadap kesejahteraan
4. Energi Terbarukan dan PerlindunganLingkungan
• Energi fosil bertanggung jawab terhadap pencemaran lingkungan, dimana energi fosil menyumbang emisi
gas rumah kaca dalam jumlah yang besar
• Sejak revolusi industri, konsentrasi CO2 meningkat 390 ppm atau 39 persen lebih tinggi
• Studi yang dilakukan oleh Boren (2015), coal plants berkontribusi terhadap 6,500 kematian prematur.
Peningkatan 1 GW coal plants memakan biaya 600 jiwa
SUMBER : IPCC (2012)SUMBER : IPCC (2012)
Energi Terbarukan dan Target MenurunkanEmisi GRK
• Target pemerintah:• Tahun 2030, GRK turun 29 persen
dan 41 persen
• Pengembangan energiterbarukan dapat berkontribusiterhadap penurunan GRK karenarendahnya produksi emisisejumlah energi terbarukan
• Pengembangan energiterbarukan juga bagian dariintergenerational contract
Energi tonnes CO2e/GWh
Rata-Rata Rendah Tinggi
Batubara 888 756 1.310
Minyak 733 547 935
Gas 499 362 891
Solar PV 85 13 731
Biomassa 45 10 101
Nuklir 29 2 130
Air 26 2 237
Angin 26 6 124
Sumber: WNA, 2010
Produksi Emisi Sejumlah Sumber Energi
Implikasi Kebijakan
Pemerintah Perlu Terlibat Untuk MengatasiKegagalan Pasar
• Eksternalitas negatif dari konsumsi energi fosil antara lain adalah:
• Studi yang dilakukan oleh Boren (2015), coal plants berkontribusi terhadap 6,500 kematianprematur. Peningkatan 1 GW coal plants memakan biaya 600 jiwa
• Pada tahun 2010, biaya akibat polusi udara di Jakarta mencapai USD 535 juta (ICCT, 2014)
• Eksternalitas negatif konsumsi energi fosil muncul karena kegagalan pasar:
• Konsumsi energi tidak terinternalisasi pada biaya, sehingga menurunkan insentif bagikonsumen untuk menurunkan konsumsi energi fosil
• Tidak bisa mengandalkan mekanisme pasar untuk memberikan sinyal insentif kepadakonsumen
• Salah satu faktor utama yang menghambat transisi ke energi terbarukan adalahkarena selama ini aspek eksternalitas tidak diperhitungakan sehingga energi fosildianggap lebih murah dibandingkan energi terbarukan
Eksternalitas Negatif
• Biaya eksternalitas sejumlah energi terbarukanlebih rendah
• Energi fosil saat ini cenderung lebih jika hanyaberdasarkan kepada harga pasar
• Jika biaya eksternalitas negatif ini dimasukkandalam harga, maka energi terbarukan akanmenjadi sumber energi yang murah terutamauntuk angin, panas bumi, dan biomassa
• Di sini lah peran pemerintah dalam mengoreksieksternalitas negatif
• Dengan harga yang tepat , akan memberikansinyal yang kuat baik kepada pelaku usaha, konsumen, dan pemerintah bahwa energi fosiltidak menguntungkan secara ekonomi
• Mengakhiri perdebatan energi murah vs energibersih
Sumber: Owen, 2006.
F-18
SIEP Final Report – January 2018
Fokus Kebijakan dalam PengembanganInvestasi Energi Terbarukan
• Aspek Regulasi• Belum adanya peraturan perundang-undangan yang menjadi payung dalam
mendorong pengembangan energi terbarukan
• Perlu disusun payung hukum dalam bentuk UU yang mengatur energiterbarukan
• Pengembangan Kapasitas Sumber Daya Manusia dan MendorongRiset Energi Terbarukan
• Negara yang investasi pada pengembangan energi akan mendapatkankeunggulan kompetitif di masa yang akan datang
• Perlu mengubah visi dari pengguna menjadi pengembang inovasi danteknologi
• Dana Ketahanan Energi untuk investasi riset energi terbarukan
Fokus Kebijakan dalam PengembanganInvestasi Energi Terbarukan• Penguatan Industri Dometik Penunjang Energi Terbarukan
• Studi menujukkan bauran energi dapat meningkatkan GDP sebesar 0,6-1,1 persenlebih tinggi dibandingkan Business as Usual (IRENA, 2016)
• Pertumbuhan GDP dapat lebih tinggi jika industri domestik dapat menopang industrienergi terbarukan (IRENA and CEM, 2014; Poyry and Cambridge Econometrics, 2014)
• Pengembangan Konsep Green Mining dan Hilirasi Sektor Pertambangan
• Meningkatkan Iklim Investasi• Kepastian kebijakan• Insentif untuk investasi di Indonesia. Sejumlah opsi selain Feed in tariff adalah green
certificate dan tax credit
• Mencari Sumber Pendanaan Lain• Skema kerjasama pembangunan dengan negara mitra pembangunan: Kasus
Geothermal di Aceh
Terima Kasih
F-19
SIEP Final Report – January 2018
REPORT
FOCUS GROUP DISCUSSION 1
NEW AND RENEWABLE ENERGY DESIGNS
Moderator: bapak Wawan
Opening by Mr. Montty (Coordinating Ministry for the Economy):
FGD series initiatives to be undertaken are in order to encourage renewable energy
programs to return, to at least be able to achieve the targets set in writing.
FGD series initiatives to be undertaken are in order to encourage the targets set in writing.
If the achievement cannot be reached, based on the results of the discussion, then the
target should be revised based on the current state.
There are still many geothermal or renewable energy projects that are constrained by price
issues and relationships with surrounding communities.
In this first FGD, the objectives to be achieved are:
o Mapping and identifying existing problems, then what needs to be done to solve the
issue?
o In addition, the purpose of the FGD is also to build communication and
understanding among stakeholders and industry to align and in accordance with the
current conditions
Speaker 1: Bpk Abadi Poernomo (National Economic Council)
Indonesia already has a fairly complete set of energy sector policies. Starting from Law
No.30/2007 about Energy, PP. 79/2014 about the National Energy Policy, which is further
translated into the RUEN (National General Plan of Energy) and RUKN (National General
Electricity Plan), is in discussion with the legislature).
Bottom-up policy of RUED (Regional General Plan of Energy) at district and provincial level
RUED (Regional General Plan of Energy). RUED (Regional General Plan of Energy) at the
provincial level requires synchronization with RUEN (National General Plan of Energy).
National energy policy consists of key policies and supporting policies. The issues most often
the main topics in support policy are price issues, subsidies and energy incentives.
The main target of the national energy policy is the paradigm shift from energy as a
commodity to energy as a development capital. But this paradigm shift is not easy due to
short-term energy interests as a commodity that can directly support the state budget. With
this paradigm shift:
o Aims to realize energy independence by making energy as development capital
o Seeks to realize the optimization of energy utilization for national development, creation
of domestic added value and job creation
The current challenges of energy independence are:
o Trends in energy production decline compared to consumption targets
o Increased demand for crude oil supplies that cause higher imports
o Current oil and gas production is at the level of 800 thousand barrels per day, in the
absence of large exploration and EOR (Enhaced Oil Recovery) business, by 2050 it isF-20
predicted that production will be 105 thousand per day. Gas will also experience
significant depreciation of reserves.
o In the year 2020 there will be a crisis of gas availability that must be imported, if there is
no effort to find new gas reserves.
o Fuel imports have been suppressed by the construction of refineries, but the
construction of refineries must be done again beyond planned ones, in order to meet
the increasing needs in the future
o Coal production stamped’ at 400 million tons per year, including for exports, but in the
future demand from domestic plants will increase so that it will absorb the entire
production.
o The target of energy mix in 2025 is set at 23%. Without regulatory support and
incentives, this target will not be achieved.
The portion of Renewable Energy target in the energy mix in 2025 comes from the electricity
sector (45.2 MW or 69.2 MTOE) and fuel oil & gas (biofuel, biomass, biogas and CBM, total of
23.0 MTOE)
Support policy instruments on prices, subsidies and energy incentives for RENEWABLE ENERGY:
o Regulation of the Minister of Energi and Mineral Resources related to the ease of
Renewable Energy investment in remote / border areas of NKRI
Regulation of renewable energy prices by the Government
Calculation of rational energy prices from local sources
o Strategic plan Kemenristekdikti:
Provide incentives to private institutions or individuals who develop core
technologies in the EBRENEWABLE ENERGYT field
Incentives include:
Implementation of risk guarantee on utilization of national energy
technology research results
Provide rewards for private institutions or individuals who have successfully
developed core technology and innovation to drive the RENEWABLE ENERGY
business
The energy mix achievement is still below the target set in the RUEN. In 2015 there is a gap
between the target of 9.8% with a performance of 6.7%. While in 2016 the gap is between
10.4% with 7.7%. Increased performance increased by only 0.55% per year, lower than the 0.9%
per year targeted in RUEN.
F-21

It is difficult to achieve the RENEWABLE ENERGY portion target in the energy mix as set out in
the RUEN. But the development of RENEWABLE ENERGY is a must.
Second Speaker: Mr. Rida Mulyana (Director General of EBTKE ESDM)
The RENEWABLE ENERGY should be placed in the context of energy security
The challenge for RENEWABLE ENERGY is the policy of the President to provide electricity at low
cost. The goal is for the country's competitiveness to improve and electricity becomes affordable
for people who currently cannot afford the connection fees and monthly charges of electricity
consumption. In addition there is also a target electrification ratio reached 99% in 2019.
Therefore the price of electricity needs to be forced to be cheap.
The policy is followed by the Minister of Energy and Mineral Resources with an equitable energy
tagline. In other words, energy (electricity) can be enjoyed by all people, including in eastern
Indonesia. This has been reflected in the incident, the not allowed quarterly Basic Electricity
Tariff (TDL) increase. In this case PLN should reduce costs so it will choose to buy cheap energy
sources today, namely coal and other fossil fuels. It also causes this year's coal production to be
allowed more than 400 million tons of 'stamp', ie 470 million tons. The EMR minister does not
really blame whether the energy source used is RENEWABLE ENERGY or fossils, the important
thing is the affordability of electricity prices can be achieved. PLN is more 'fond of' being fined
by PGE for not buying electricity (de-rating) to get cheaper primary energy. In such
circumstances, how can the target portion of RENEWABLE ENERGY in the energy mix be
achieved?
Regulations for the development of RENEWABLE ENERGY already exist but not enough.
Therefore, there needs to be a law or government regulation that facilitates the development of
RENEWABLE ENERGY.
The Directorate General of EBTKE has coordinated with Fiscal Policy Agency (BKF) informally to
provide a new scheme, for example the People’s Business Credit (KUR) for the scale of
development of RENEWABLE ENERGY scale of Micro Small Medium Enterprises (UMKM) starting
2018.
Fiscal and non-fiscal incentives available today:
o Tax allowance:
PP No.1 / 2007 jo PP No.62 / 2008 jo PP No.52 / 2011: net income tax reduction
facility 30% of investment value for 6 years, accelerated depreciation and
amortization
PMK 144/2012: net income tax reduction facility 30% of investment value for 6
years, depreciation and amortization; for investment in certain business fields
and / or in certain areas
PMK 159/2015: tax deductions of at most 100% and at least 10%
PMK 89/2015: procedures for granting income tax facilities for investment in
certain business sectors and / or certain areas and transfer of assets and
sanctions for corporate taxpayers provided with income tax facilities
PMK 268/2015: procedures for granting facilities shall be exempted from the
imposition of value added tax on the import and / or delivery of certain taxable
goods of a strategic character and procedures for payment of value added tax
subject to certain strategic taxes that have been released and the imposition of
F-22
sanctions
o Customs entry:
KMK 766/1992: facilities for the import of operational goods by entrepreneurs
for the purposes of the operation of geothermal resources are not levied of
import duty, value added tax, sales tax on luxury goods and income tax
PMK 78/2005: import duty exemption facility on the import of goods for
geothermal exploitation activities under contract before the enactment of Law
no. 27/2007 on Geothermal
MK 177/2007: import duty exemption facility on the import of goods for
upstream oil and gas and geothermal business activities
PMK 21/2010: tax and customs facilities
o Funding:
PMK 139/2011: procedures for granting PT PLN's business feasibility warranty
(persero) for the construction of power plants using renewable energy, coal and
gas through partnerships with private power developers
PMK 3/2012: procedures for the management and accountability of geothermal
fund facilities
Currently, simulation is still being done to reduce the electricity tariff by lowering the average
cost of electricity production (BPP) but cannot be too far because it cannot use the subsidy.
Currently the use of subsidies is a sensitive issue.
Ministry of Energy and Mineral Resources Decree No.12 / 2017 on Utilization of Renewable
Energy Sources for the Provision of Electricity has been amended by ESDM Regulation No.
43/2017. The changes are based on input from various institutions at home and abroad,
including from Mc Kinsey. However, this Permen 43/2017 is also planned to be revamped to
accommodate BPP in some areas higher than the national BPP. But this change is not necessarily
done if there is a change of leadership (minister), unless there is a regulating PP.
The key of RENEWABLE ENERGY developers is:
o How the electricity tariff can be low. This needs to be supported by the existence of low
bank credit interest. Currently available interest is in the range of 8% -9%, compared to
2.5% that can be obtained overseas (masdar Dubai). There is no access to cheap green
funds.
o Fiscal incentives that are not currently elaborated although incentives for VAT import
duties for RENEWABLE ENERGY (except spare parts) have been made.
o Promotion by BKPM is hampered by the cheap electricity from fossil energy, although the
price trend of solar technology has dropped exponentially.
o Licensing has been made easier, except for safety issues; this has already been done
o Need for market creation to reduce price / BPP.
o Reduced energy subsidies for BBM and LPG; at the same time there is an increase in
RENEWABLE ENERGY portion. For example, B20 policy succeeds with the cooperation of
8 ministries without the use of additional state budget.
o Change of Permen 43 to make the purchase price more attractive, although Permen 12
is still effective for some areas where BPP is good. Permen 43 revises until Microhydro
Power Plants (PLTMH) could better its BPP.
In relation to energy, the government's current agenda is that energy subsidies must go down
because the state needs money.
There are currently new Microhydro Power Plants (PLTMH) operating with 58 units with a
capacity of 300 MW. There are 6 partners of Solar Power Plant (PLTS) and some Bayu Power
F-20F-20
F-20
F-23
Station (PLTBayu); which proves that Permen 12 can still be implemented in some areas where
the BPP is good, so the electricity purchase tariff also goes up.
Currently DPD (not DPR) is working on draft RENEWABLE ENERGY Act.
Third Speaker: Mr.Tamba Hutapea (BKPM)
The change of EMR paradigm has been splendid from the side of bureaucracy, but the regulation
that often change makes investors difficult. Uncertainty such as change from Permen 12 to
Permen 43. If tariff regime is inconsistent, at the time of exploration would make investors
difficult.
Constraints in the RENEWABLE ENERGY sector are expensive investment costs:
o The electricity purchase tariff of Waste to Energy (PLTSampah) in accordance with the
Permen ESDM No. 44/2015 should be higher to compensate for the low tipping fee from
local governments. Otherwise, there should be interest subsidies.
o In the strategic project there are institutions that assist land acquisition, namely
LMAN(State Asset Management Agency); in the RENEWABLE ENERGY sector does not
exist.
o There is yet fiscal incentives such as tax holiday for investors who have income after a
long period of time.
o There needs to be a monetary incentive to lower the interest rate for RENEWABLE
ENERGY development. For example, the development of Gothermal Power Plant (PLTP)
needs lower interest banking support in addition to licensing support
o Licensing constraints, the current licensing at the central level has been trimmed, from
958 permissions to only 250 permits so as to speed up the management. But this has
not been followed by the region. Suppose location permission, the time period is not
clear and very long.
o Need for transmission support for RENEWABLE ENERGY in remote areas. Need to be
assessed if investors, who build the transmission to be connected with the PLN network,
then get reimbursement.
o Negative investment list related to RENEWABLE ENERGY, 49% foreign ownership limit to
10 MW downward scales; whereas investors seek funding from abroad for the scale; this
needs to be reexamined.
o The level of domestic components (TKDN) checking problem: TKDN policy is very good
but the checking procedure is not clear. As an example for Java-7, the Ministry of
Industry's master list has still not been issued, unclear checks and licensing. Many
energy projects are constrained by TKDN
F-20
F-24
Fourth Speaker: Mr. Imaddudin (Indef)
Renewable energy investments in China, India and Brazil and other developing countries by 2015
are higher than total investments in developed countries. This trend proves that investment in
the RENEWABLE ENERGY sector is not only related to climate change issues but also to
employment.
This conclusion is also reinforced by the results of the IRENA study which found that an increase
in the share of RENEWABLE ENERGY investments actually increased GDP due to the resulting
multiplier effect.
o There are four drivers of RENEWABLE ENERGY investment:
o Uncertainty of energy supply and price volatility
o Increased economies of scale and technological developments
o Policies of a number of countries that support RENEWABLE ENERGY
o Increased attention to environmental issues
The urgency of RENEWABLE ENERGY development is mainly due to supply and demand energy.
Energy is a prerequisite for economic growth. On the other hand, for Indonesia to get out of the
middle income trap, it needs 12 percent growth per year. Increased electricity consumption per
capita in line with economic growth.
The importance of developing RENEWABLE ENERGY for Indonesia besides economic growth is to
improve environmental protection. The government has a target to reduce GHG (Greenhouse
Gases) by 29 percent by 2030 by self-effort and 41 percent with foreign aid.
Discussion of energy policies related to efforts to increase the share of RENEWABLE ENERGY in
the energy mix: a market failure that inhibits the transition from fossil energy to RENEWABLE
ENERGY because fossil energy is considered cheaper even though in the long term its economic
cost is higher. Suppose when considering the cost of health and the environment.
The policy focus in RENEWABLE ENERGY development is:
o Strengthening of domestic industry supporting RENEWABLE ENERGY
o Increased investment climate through tax credit and green certificate
o Looking for other cheap funding sources
Development of RENEWABLE ENERGY is a necessity because investment costs will become
cheaper. The government should be the front liner of RENEWABLE ENERGY development or just
become a follower and ultimately too late to realize it.
Respondent 1: Bpk Wijayanto (Office of Setwapres)
Cheap energy is important, but the question is, cheap energy for whom? Will pressing the
purchase price of PLN will provide cheap electricity prices as well?
The target subsidy should be clear, namely the poor and certain industries that are used as
cheap electricity targets. Model subsidies are now detrimental to the industry as a whole.
The existing regulations are good. But unfortunately if sacrificed for short-term needs. The
F-25
policies taken should be consistent with the positive points contained in the regulation.
The same is the interest subsidy. The interest subsidy is not appropriate because it is based on
experience of extraordinary complexity. More simple direct subsidies, while industry still gets
market interest.
In terms of fiscal policy, the finance ministry is targeted for revenue. This raises the perception
of the opportunity loss of the incentives given. This view needs to be changed; it is precisely the
incentive to create an opportunity. Suppose that VAT is low or zero for some specific product
To improve the licensing problem, what is done by BKPM and ESDM is good. However, 80% of the
problems are beyond that, namely: local government, State-Owned Enterprises (SOE), Ministry of
Environment and Land. Suppose licensing in the area is still a problem that becomes obstacles.
Discussion about the RPP that has been around 65% - 75% completed should be immediately
followed by non-geothermal equipped. The unsolved issue is about the purchase price, but this is
a sensitive issue. The price component of Independet Power Producer (IPP) to PLN should be
negotiable, depending on the specific circumstances. But this needs to be regulated in ministerial
regulations.
Despite the obstacles, efforts to improve the industry should not stop.
Respondent 2: Bpk Yudi (Kemenko Maritim)
Energy utilization planning has been regulated through General Plan of National Energy (RUEN)
and General Plan of National Electricity (RUKN) based on central government. We must keep
pushing the region in preparing for the regional level, because many regions have not been able
to prepare it.
Determination of electricity tariff, for example, could be an area that offers a high tariff to
attract investors. But this is not done because the area feels the planning is still coming from the
central government. Whereas based on existing legislation, the region must prepare Regional
General Plan of Energy (RUED) and Regional Electricity General Plan (RUKD). It has not been
executed.
To encourage this, it is necessary to create a toolkit that can be used by the region in making the
Regional General Plan of Energy (RUED) and Regional Electricity General Plan (RUKD). This will
facilitate the planning, because now existing regional plans are difficult to combine because of
the different ways of calculation.
Agree with energy not as commodity but as development capital. In addition, cheap electricity
prices should also be clear to whom.
The purchase price of electricity from RENEWABLE ENERGY should use international prices.
There needs to be a more transparent calculation in the calculation of BPP, taking into account
the specification of primary energy type, location and technology used. A toolkit is needed to
establish a fair tariff for both parties (IPP and PLN).
F-20F-20
F-26
The view of the employers' association does not think about how much the purchase price of
electricity, which is important, is the certainty of the price. With the certainty of the price, it's
economic value can be calculated. If it is not economical then it does not enter, or it can ask
allowance for economic feasibility can be achieved.
Related to the level of domestic components (TKDN), currently there is a new Presidential
Decree to monitor the implementation of level of domestic components (TKDN).
In the development of RENEWABLE ENERGY projects, planning is an important phase. Although
this plan only takes 2% of the total cost, but its influence reaches 90%. That is, the design done
by the people in the country can give a big influence in the procurement phase and so on.
Respondent 3: Mrs. Ema (Ministry of LHK)
The Ministry of LHK strongly supports this kind of meeting because it has long discussed with the
Directorate General of EBTKE related to climate change
The energy sector is a priority sector (11%, after forestry of 17.2%) for achievement of 29% GHG
emission reduction target with total 314 MTOE emission reductions. But it should be discussed
further how concrete actions to reduce emissions to be more detailed and measurable; including
how much investment is needed to achieve these targets. This refers to National Energy Policy
(KEN) and General Plan of National Energy (RUEN) which provide a benchmark 23% portion of
RENEWABLE ENERGY in the primary energy mix in 2025.
It is hoped that not only energy issues will be achieved, but also environmental issues. Because if
the emission reduction target of the energy sector is not met, then there should be another
sector that replaces.
Respondent 4: Mrs. Ferike Indah (BKF Kemenkeu - Fiscal Policy Agency Kemenkeu)
The issue of climate change is getting attention from the Ministry of Finance, especially some
centers in BKF
Income-related fiscal incentives are readily available but not yet fully understood. For example:
o PP 52 (or 50) / 2011 (income tax facility for investment): 30% net income tax reduction
for 6 years for RENEWABLE ENERGY investment, accelerated depreciation and
amortization.
o PMK 11 (or 13) / 2011 (tax exemption facility): exemption and reduction of VAT and tax
holiday for a period of 5-10 years for the pioneer industry tax payer. In addition there is
customs clearance for import of technology goods for the RENEWABLE ENERGY sector
F-27

o PP 13/2007 on the import of strategic goods
o Law 10/1995 on customs handed down in FMD for import of goods machines, may be
subject to exemption of import duty.
The possibility of private business entities not yet informed about these regulations. For
example, PLTSa with local government, such as Jakpro DKI, the above incentives are not yet
known. Though the rules already exist. In the case of Jakpro DKI, the TKDN is too low so it is
against the existing regulations.
From the APBN side, efforts to make the RENEWABLE ENERGY sector attractive are quite heavy.
RENEWABLE ENERGY, although with the internalization of environmental and health costs
become cheaper, its initial cost is high. While the ability of the state budget is limited. Then it
will be difficult.
But initiatives such as Waste to Energy /PLTSa need to be assisted by the level of feasibility. The
solution of the State Bugdet (APBN) is direct subsidies to the right targeted users.
Government Cooperation with Business Entities /KPBu opportunities should be developed to
overcome limitations. There needs to be a discussion with ESDM for the most appropriate
initiative. In addition, there are more problems in the regions, if necessary; the DAK / Special
Allocation Fund mechanism is used.
Respondent 5: Mr. Andi Asmoro (Bank Mandiri)
Financing conditions (in total) in 2016:
o Banking: 319 T
o Non-bank: 24,5 T
o Corporate bond: 110 T
o Equity: 200 T
So there is a potential of around 600 - 700 T domestic financing per year for all sector
Potential financing at large RENEWABLE ENERGY in Indonesia. Make the bank visible is promising
but related source of financing and source of funds it does not match with the RENEWABLE
ENERGY financing profile that requires credit in the long term. The largest source of bank
financing is still Third-party Funds (46% and around 50% - down from 69% - is a 1 month tenor,
only 11% are above 12 months).
Potential of project infrastructure financing:
o Oil & gas: 58 T (2019)
o Logistics: 158 T (2019)
o Utilities: 321 T (2019
Investment risks associated with these investment opportunities are: (1) conformity of central and
regional policies; (2) the capacity of the bank's human resources to conduct an assessment of the
sector, in particular RENEWABLE ENERGYKE (The Directorate-General of New Renewable Energy
and Energy Conservation); (3) sustainability of the project's settlement by the government.
With the condition of banks in 2016 where the problem of Non Performing Loans (NPL) still make
the low aggressiveness of banks in disbursing credit, in 2017 is doing consolidation, in 2018 is
expected to begin to increase apptetitena. There are 4 potential financing alternatives namely
through:
o Project bond
o project financing,
o asset securitization, as well as
o financing from multinational donors institution.
Risk mitigation is more towards investment risk: eg conformity between synchronization of central
F-28
and local rules and changes in government regulation
There is an operational bank risk: the bank’s human resources capacity and ability in acessing
financing in the RENEWABLE ENERGY sector.
Respondent 6: Mr. Handy Yuniarto (Mandiri Sekuritas)
The current condition of the AAA corporate bond rating is 8 percent (yiel government bond to 6.9
percent after receiving investment grade), overseas there are many green bonds, while in
Indonesia it is not available.
What’s interesting is that if the rules of OJK want to address the investment in the RENEWABLE
ENERGY sector will be equated to bond investment in the infrastructure sector, with the rules of
OJK that education and insurance funds must hold government bonds as well as corporate bonds
of state-owned enterprises create holding education funds and insurance for bond SOE
construction up 50%.
The total outstanding corporate bond is currently only 350 T which is much smaller than 3% of
GDP. Thus there is still plenty of room to grow.
The most important is also an example for a RENEWABLE ENERGY pilot project that has been
successful as a reference for investors entering and investing in this sector bond.
Respondent 7: Mr. Darwin (PT SMI)
Must be united between banking and non-banking institutions such as PT SMI to develop
RENEWABLE ENERGY.
There are two main factors:
o risk profile: most important for SMI because to be justified giving loan for RENEWABLE
ENERGY
o source of fund: SMI has a slightly different source of funds with banks so the financing
time frame can be longer, so it can help the development of RENEWABLE ENERGY sector,
and SMI is also accredited green climate fund (but this requires ZERO from the
government). SMI is poised to become a catalyst in advancing RENEWABLE ENERGY
financing. There is already a sustainable financing division, for example for exploration
financing
Respondent 8: Mr. Riza (Bank Muamalat)
Since 5 years ago, Bank Muamalat has entered in minihydro with portfolio outstanding 1 trilliun,
spread in Java, Sulawesi, Kuala lumpur
The main problem of banks to finance RENEWABLE ENERGY is the source-fund mismatch where
RENEWABLE ENERGY financing can be up to 10 years, but now it's getting better where our
portfolio examples can payback period 7 years in the present. Needs further cooperation with
related parties for RENEWABLE ENERGY financing.
Needs relaxation incentives from OJK, for example in the form of relaxation of reserve policy
F-20
F-29

Bank and non-bank financial institutions should work together for RENEWABLE ENERGY financing
Must be united between banking and non-banking financial institutions such as PT SMI for
Respondent 9: Mr. Ali Mundakir (Pertamina Geothermal Energi)
For RENEWABLE ENERGY especially geothermal, if not exploited soon, its potential will be lost,
if the government does let this happen, then every day we lose its potential reserve, because
its geothermal nature to evaporate over time through hot water, volcano etc, this mindset
need to be underlined so that government does not get stuck with subsidies. So the
government does not throw away the potential of geothermal for free.
Pertamina Kamojang with geothermal size 100MW, can reduce 500.000 ton CO2 per year, if
1000MW then it can reduce emission 5juta ton CO2.
1 month ago, released by Swedish embassy and OECD country research, where the coal
industry enjoys subsidies through various government regulations. This mindset should be
changed where according to pareto law, this RENEWABLE ENERGY is given a 2 T subsidy, but
why a small subsidy like RENEWABLE ENERGY is disadvantaged and constantly suppressed.
Respondent 10: Mr. Paul (METI)
There are several points to support RENEWABLE ENERGY if we carry it out, BKPM proposal is
beneficial but whether we can do it, METI will not refuse the affordable energy but what can
be a tradeoff of the cheap energy.
The main goal of electricity developers is to achieve economics, if the VAT is not withdrawn by
the government then the cost of developers will decrease hence the price of electricity can go
down as well, along with facilities such as tax holiday.
Suppose also if there is a government guarantee then the bond cost can fall both in USD and
IDR
The government is legitimate just to make cheap energy but supporting policies must also be
qualified
The future is the time of renewable energy, now it is cheap coal and oil but when RENEWABLE
ENERGY is already developed then the scale economics of fossil fuel will be reduced and
highten the cost of exploration and production of fossil fuel and make fossil energy price
expensive, we then must move now to become a pioneer of RENEWABLE ENERGY
development.
Changes planned for Permen 12 regulatory changes. Whereas before the Permen 12
there are regulations that also regulate the price of RENEWABLE ENERGY. If you want to make
prices cheap, it is necessary to have support policy that makes the price of RENEWABLE
ENERGY cheap.
F-30
Respondent 11: Representatives from Kadin
Somewhat confusing if the government directs the prices of electricity to be cheap, but there
is also a 29% emission reduction, and also still leases diesel generators. Though Diesel price is
quite expensive, but it is still being subsidized.
One solution is to close the Diesel Power Station / PLTD to zero in 2020 and replace it with
RENEWABLE ENERGY. Suppose in the archipelago area. Compared with diesel, renewable
energy prices are still cheaper. (could be saving 17 Trillion Rupiah)
Until now the Government is still using linear economy which is undated, now, it is a circular
economy. How does the Coordinating Ministry, BKF (Fiscal Policy Agency), and other
government institutions implement the circular economy? Only Indonesia that has yet to
concept. If this can be done, RENEWABLE ENERGY will be the top 3 in the sector of interest to
be developed. Cap 400 million coal production can be reduced.
Related to low cost funding, Kadin had just come back from New York and met with mcc,
there is 600 million USD which can be used as RENEWABLE ENERGY development. However,
the government is silent. Kadin is asked by Bappenas to coordinate how to utilize the fund in
Indonesia.
Kadin also assumes the government does not have good coordination between agencies
hence the country risk is high and ultimately credit interest to follow high.
EuroCham is a monthly meeting. They hold all investments in the RENEWABLE ENERGY sector
until Permen 12 reaches clarity.
Kadin also assumes that all parties should synchronize the policy
Respondent 12: Bu Tri Mumpuni
The government should think outside the mainstream: eg community empowerment for
RENEWABLE ENERGY development. Providers of electricity can be PLN, private business
entities or the community (local). Localization of electricity supply businesses by the
community can make the economy achieved.
3 main issues in the energy sector: (i) resources are owned by a handful of elites,(ii) unequal
opportunities (no social justice), and(iii) low public education.
F-20
F-31
Closing
Mr. Rida (The Directorate-General of New Renewable Energy and Energy Conservation / EBTKE):
Permalasahan (what) has been identified but its "HOW" to achieve this RENEWABLE ENERGY
target which must be answered in concrete and detail. Communication must be kept open.
The RENEWABLE ENERGY and environmental issues are important and crucial to continue to grow
in the future.
Permen ESDM 43 which is later revised for other renewable energy types, will be the same as the
revision of Microhydro Power Plant / PLTMH ie BPP negotiable B2B.
Pak Montty (Coordinating Ministry for Economic Affairs):
Need to define related energy pricing, cost of electricity production must go down but must be
reevaluated on how economic cost or financial cost. If the pricing is economic cost many things
needs to be considered, but if it is financial cost alone, then the issue must be in terms of project
financing needs to be addressed immediately by the relevant ministers.
For prices, scale below 10MW is definitely more expensive than large scale eg. 50 or 100 MW due
to economies of scale.
For premium investment in RENEWABLE ENERGY, it is necessary to examine the ability of any
company to pay premium investment in RENEWABLE ENERGY compared to coal investment.
Licensing problem: must be resolved issues related to synchronization of central and regional
licensing.
---000---
F-32

G-1
SIEP Final Report – January 2018
APPENDIX G: RENEWABLE INCENTIVES FGD 2 – FINANCING GAPS
This appendix contains two presentations, summary matrix and executive summary notes from the Focus Group Discussion regarding financing gaps needed for renewable energy development acceleration, which conducted on 15 August 2017:
1. METI presentation2. PLN presentation3. Summary matrix4. Executive summary after FGD 2
These presentations are provided below.

29 September 2015
Pandangan METI – Kebijakan Harga Energi
`
Dr. Surya Darma, MBAKetua Umum METI
Jakarta, 15 Agustus, 2017
FGD Kelayakan Investasi ET
Kantor Menko Perekonomian 2017
Kebijakan Energi Nasional
2
Paragraph (2) of article 11 Government Regulation Number 79 Year 2014concerning National Energy Policy (KEN)
1. Maximize renewable energy utilization;
2. Optimize gas and new energy utilization;
3. Minimize oil utilization.
4. Utilization of coal as the main national energysupply;
5. Utilization of Nuclear Power Plant as the lastoption.
G-1
SIEP Final Report – January 2018
G-2
SIEP Final Report – January 2018

23%
25%30%
22%5%
46%31%
18%
194 MTOE
~ 400
MTOE
Energi Baru dan Terbarukan
Minyak BumiGas Bumi
Batubara Tahun 2025Kondisi Saat ini
Target Bauran Energi Nasional Tahun 2025
Saat ini Tahun 2025
Pembangkit Listrik 51 GW 115 GW
Konsumsi Energi 0,8 TOE/kapita 1,4 TOE/kapita
Konsumsi Listrik 776KWh/kapita
2.500 KWh/kapita
EBT
Minyak
Gas
Batubara
Target Penyediaan Energi Primer EBT
Tahun 2025 sesuai RUEN
23%Bauran EBT
92,2MTOE
69,2MTOE
23,0MTOE
Biofuel 13,69*)juta kilo liter
Biomassa 8,4juta ton
Biogas 489,8juta m3
CBM46,0
mmscfd
Listrik
EBT 45
GW
1. PLT Panas Bumi, 7,2
GW
2. PLT Hidro, 17,9 GW
3. PLT Mikrohidro, 3 GW
4. PLT Bioenergi, 5,5 GW
5. PLT Surya, 6,5 GW
6. PLT Angin, 1,8 GW
7. PLT EBT lainnya, 3 GW
EBT
Minyak
Gas
Batubara*) tidak termasuk biofuel untuk
pembangkit listrik sebesar 0,7 juta kL tahun 2025
23%
25%30%
22%
~ 400
MTOE
Kapasitas Pembangkit Listrik Nasional 135 GW
Kapasitas Pembangkit Listrik EBT 45 GW
G-3
SIEP Final Report – January 2018

Batubara; 50%
Gas, 25%
EBT; 25%
10 GW - PLN;
25 GW – IPP
RE Portion is about 25%, or 8.750 MW, compose of:
Geothermal (1,751 MW, 20%),
Hydro (2,438 MW, 28%),
Bioenergy (1,156 MW, 13%),
Solar, wind, Ocean and others (3,405 MW, 39%).
Total investment is USD 29.8 Billion or about IDR 402 Triliun.
5
The Portion of RE in the 35
GW acceleration project
Go Green –DJEBTKE
Proyeksi Pengembangan Pembangkit Listrik EBTTahun 2015–2050
Energi 2015 2016 2017 2018 2019 2020 2025 2030 2040 2050
Panas Bumi 1.439 1.654 2.004 2.344 2.979 3.804 7.239 9.300 13.423 17.546
Air & Mikrohidro 5.024 5.139 5.266 5.619 7.154 7.735 20.960 25.844 35.611 45.379
Bioenergi 1.740 1.886 2.093 2.359 2.674 3.024 5.532 9.651 17.887 26.123
Surya 79 229 429 679 979 1.379 6379 14.103 29.551 45.000
Angin 7 57 107 207 307 507 1.807 7.167 17.887 28.607
EBT lainnya 372 1.860 1.860 1.860 1.861 1.863 3.128 3.779 5.081 6.383
Total 8.660 10.842 11.758 13.067 15.953 18.310 45.044 69.843 119.440 169.038
Satuan: megawatt (MW)
2015 2016 2017 2018 2019 2020 2025 2030 2040 2050
Biofuel* Juta KL 2,4 3,6 4,6 5,8 7,2 8,8 15,6 22,9 37,4 57,5
Biomassa Juta Ton 5,6 5,7 5,9 6,2 6,4 6,7 8,3 10,6 16,0 22,0
Biogas Juta m3 25,2 35,4 49,6 68,9 95,6 131,9 489,8 783,5 1.346,3 1.958,9
CBM mmscfd 0,29 0,31 0,45 0,64 0,74 0,89 46,0 68,82 223,5 576,3
* Catatan: Tidak termasuk produksi biofuel yang dimanfaatkan sebagai campuran BBM pada PLTD
Pengembangan EBT - Pemanfaatan Langsung
6
G-1
SIEP Final Report – January 2018
G-4SIEP Final Report - January 2018

Go Green –DJEBTKE
Pertumbuhan EBTKE (rata2 0.36%/thn)
BAHAN BAKAR NABATI (BBN) dalam Juta KL
PEMBANGUNAN PLT PANAS BUMI dalam MW
PEMBANGUNAN PLTS dan PLTM/MH dalam MW
1.438,5 (2015) 1.643,5 (2016)
273,1 (2015) 282,5 (2016)
1.767,1 (2015) 1.787,9
(2016)
PEMBANGUNAN PLT BIOENERGI dalam MW
1,65 (2015) 3,03 (2016)
• Kebijakan mandatory campuran BBN ke BBM sebesar 20%
(B20) pada tahun 2016;
• Tantangan pengembangan BBN: Rendahnya harga minyak
dunia, menyebabkan selisih harga BBN & BBM tinggi;
• Subsidi BBN telah berjalan.
• Tambahan PLTP tahun 2016 sebesar 205 MW, dari PLTP
Sarulla Unit 1 (110 MW), PLTP Lahendong Unit 5&6 (2x20
MW), & PLTP Ulubelu Unit 3 (55 MW);
• Evaluasi feed in tarif yang lebih kompetitif dan mencerminkan
efektifitas biaya dengan regionalisasi.
Evaluasi feed in tarif yang lebih kompetitif dan mencerminkan
efektifitas biaya dengan regionalisasi.
Evaluasi feed in tarif yang lebih kompetitif dan
mencerminkan efektifitas biaya dengan regionalisasi.
Kenapa Belum Optimal ?
Kebijakan tidak menarik investor untuk investasidi bisnis ET.
Regulasi di ET sering berubah dan tidakkonsisten, mengancam kepastian hukum dankepastian berusaha
G-5SIEP Final Report - January 2018

Kenapa Bisnis ET Perlu PeranPemerintah?
1. High Upfront Capital Cost:
2. High risk investment.
3. Long Lead Time:
4. Cost of development varies: (dari satulokasi ke lokasi lainnya) – utk PLTP, PLTA,PLTB, Arus laut
5. Unique Investment (Pabum, dll):
6. Single Buyer: Tidak bisa dilepaskan melaluiB to B, Perlu peran sentral dari Pemerintahdalam kebijakan harga
1. UNDANG-UNDANG NO. 30 TAHUN 2007 TENTANG ENERGI
• Prioritas penyediaan dan pemanfaatan EBT salah satunya Bioenergi
2. PERATURAN PEMERINTAH NO. 79 TAHUN 2014 TENTANG KEBIJAKAN ENERGINASIONAL
• Meningkatkan target kontribusi EBT di dalam bauran energi nasional sebesar 23% padatahun 2025 dan 31% pada tahun 2050
4. PERATURAN MENTERI ESDM NO. 12 TAHUN 2017 YG DIUBAH dgn PERMENNo.432017 dan PERMEN No. 502017 TENTANG PEMANFAATAN SUMBER ENERGITERBARUKAN UNTUK PENYEDIAAN TENAGA LISTRIK
• Menentukan harga patokan untuk listrik yang berasal dari energi terbarukan
3. PERATURAN PRESIDEN NO. 22 TAHUN 2017 TENTANG RENCANA UMUM ENERGINASIONAL
RUEN dijadikan sebagai rujukan dalam penyusunan RUED, RUKN, RUPTL, APBN danAPBD
10
Regulasi Pengembangan ET
G-6SIEP Final Report - January 2018
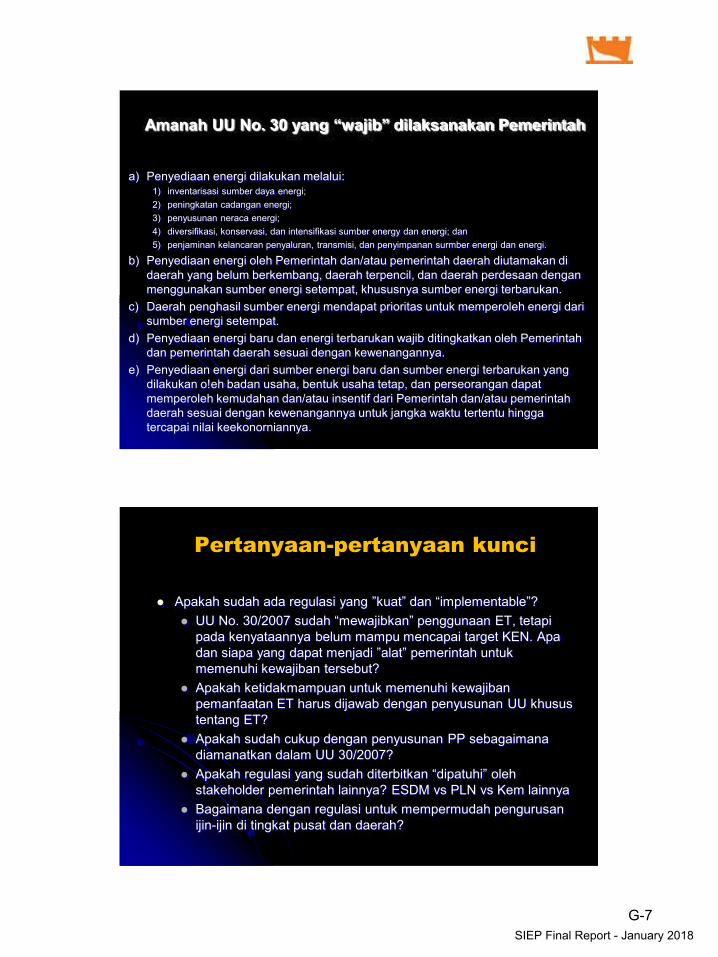
Amanah UU No. 30 yang “wajib” dilaksanakan Pemerintah
a) Penyediaan energi dilakukan melalui:1) inventarisasi sumber daya energi;
2) peningkatan cadangan energi;
3) penyusunan neraca energi;
4) diversifikasi, konservasi, dan intensifikasi sumber energy dan energi; dan
5) penjaminan kelancaran penyaluran, transmisi, dan penyimpanan surmber energi dan energi.
b) Penyediaan energi oleh Pemerintah dan/atau pemerintah daerah diutamakan didaerah yang belum berkembang, daerah terpencil, dan daerah perdesaan denganmenggunakan sumber energi setempat, khususnya sumber energi terbarukan.
c) Daerah penghasil sumber energi mendapat prioritas untuk memperoleh energi darisumber energi setempat.
d) Penyediaan energi baru dan energi terbarukan wajib ditingkatkan oleh Pemerintahdan pemerintah daerah sesuai dengan kewenangannya.
e) Penyediaan energi dari sumber energi baru dan sumber energi terbarukan yangdilakukan o!eh badan usaha, bentuk usaha tetap, dan perseorangan dapatmemperoleh kemudahan dan/atau insentif dari Pemerintah dan/atau pemerintahdaerah sesuai dengan kewenangannya untuk jangka waktu tertentu hinggatercapai nilai keekonorniannya.
Pertanyaan-pertanyaan kunci
Apakah sudah ada regulasi yang ”kuat” dan “implementable”? UU No. 30/2007 sudah “mewajibkan” penggunaan ET, tetapi
pada kenyataannya belum mampu mencapai target KEN. Apadan siapa yang dapat menjadi ”alat” pemerintah untukmemenuhi kewajiban tersebut?
Apakah ketidakmampuan untuk memenuhi kewajibanpemanfaatan ET harus dijawab dengan penyusunan UU khusustentang ET?
Apakah sudah cukup dengan penyusunan PP sebagaimanadiamanatkan dalam UU 30/2007?
Apakah regulasi yang sudah diterbitkan “dipatuhi” olehstakeholder pemerintah lainnya? ESDM vs PLN vs Kem lainnya
Bagaimana dengan regulasi untuk mempermudah pengurusanijin-ijin di tingkat pusat dan daerah?
G-7SIEP Final Report - January 2018
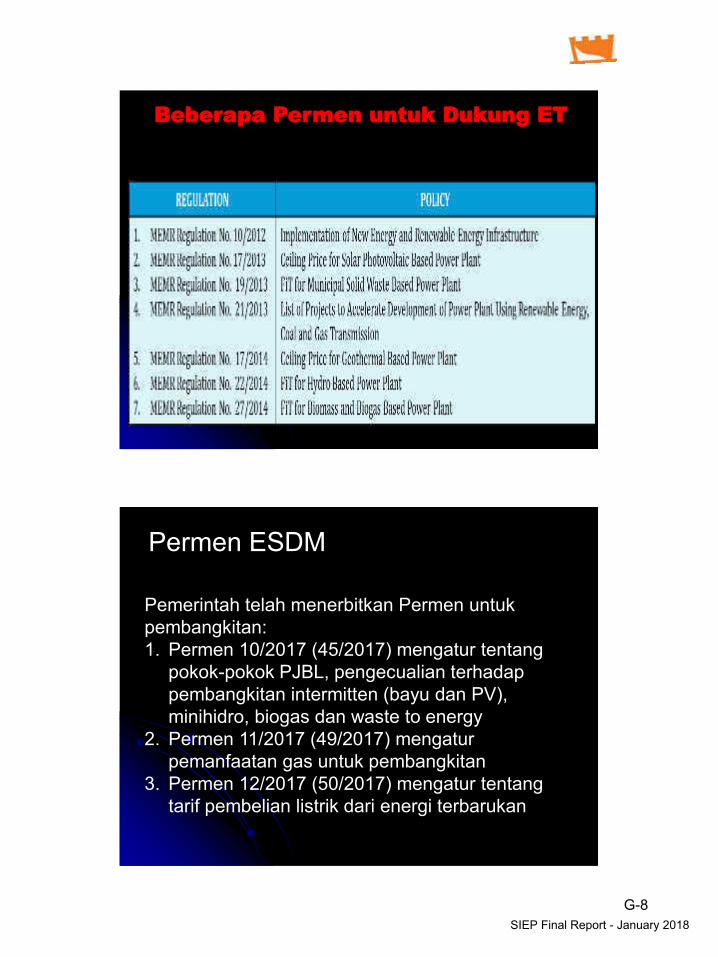
Beberapa Permen untuk Dukung ET
Pemerintah telah menerbitkan Permen untukpembangkitan:1. Permen 10/2017 (45/2017) mengatur tentang
pokok-pokok PJBL, pengecualian terhadappembangkitan intermitten (bayu dan PV),minihidro, biogas dan waste to energy
2. Permen 11/2017 (49/2017) mengaturpemanfaatan gas untuk pembangkitan
3. Permen 12/2017 (50/2017) mengatur tentangtarif pembelian listrik dari energi terbarukan
Permen ESDM
G-8SIEP Final Report - January 2018

• Tidak konsisten: Presiden menyatakan bahwa pemerintah akanmemprioritaskan pengembangan ET. Tetapi disisi lain, Permen inimencantumkan bahwa pemanfaatan ET bertujuan untuk mengurangi BPPPLN. Hal ini berarti bahwa apabila harga ET > BPP, maka PLN, tidakakan memanfaatkan ET;
• Keinginan menjadikan ET untuk mengurangi BPP PLN merupakan bentuksubsidi ET terhadap energi berbasis fosil
• Penetapan harga patokan ET berdasarkan BPP PLN bertentangandengan UU 30/2007 (harga ET ditetapkan berdasarkan nilai keekonomianberkeadilan: biaya produksi dengan mempertimbangkan lingkungan dankonservasi);
Permasalahan dalam Permen ESDM
• UU 30/2007 Pasal 7 menyatakan bahwa “Harga energi ditetapkarl
berdasarkan nilai keekonomian berkeadilan”. Selanjutnya dalampenjelasan disebutkan bahwa “Yang dimaksud nilai keekonomianberkeadilan adalah suatu nilai/biaya yang merefleksikan biaya produksi
energi, termasuk biaya lingkungan dan biaya konservasi serta
keuntungan yang dikaji berdasarkan kemampuan masyarakat dan
ditetapkan oleh Pemerintah”• UU 30/2009 Pasal 2 Ayat 2 menyatakan bahwa “Pembangunan
ketenagalistrikan bertujuan untuk menjamin ketersediaan tenaga listrik
dalam jumlah yang cukup, kualitas yang baik, dan harga yang wajar
dalam rangka meningkatkan kesejahteraan dan kemakmuran rakyat
secara adil dan merata serta mewujudkan pembangunan yang
berkelanjutan”• UU 30/2009 Pasal 33 Ayat 1 menyatakan bahwa “Harga jual tenaga listrik
dan sewa jaringan tenaga listrik ditetapkan berdasarkan prinsip usaha
yang sehat”• Hal diatas menunjukkan bahwa Permen 12/2007 tidak sesuai dengan UU
UU vs Permen ESDM 12/2017
G-9SIEP Final Report - January 2018
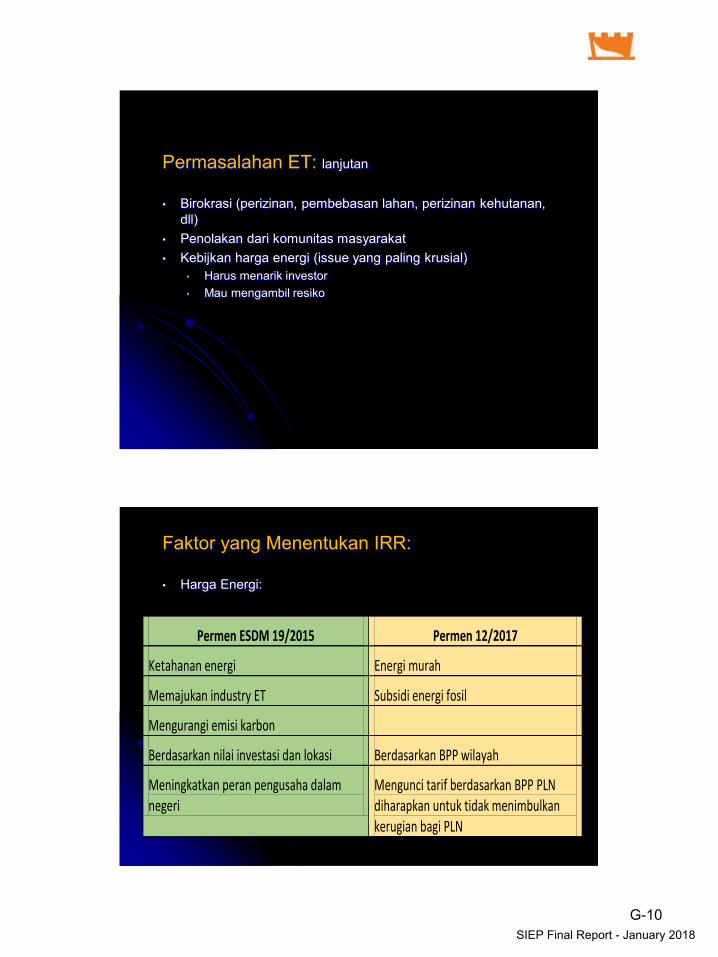
Permasalahan ET: lanjutan
• Birokrasi (perizinan, pembebasan lahan, perizinan kehutanan,dll)
• Penolakan dari komunitas masyarakat
• Kebijkan harga energi (issue yang paling krusial)
• Harus menarik investor
• Mau mengambil resiko
Faktor yang Menentukan IRR:
• Harga Energi:
Permen ESDM 19/2015 Permen 12/2017
Ketahanan energi Energi murah
Memajukan industry ET Subsidi energi fosil
Mengurangi emisi karbon
Berdasarkan nilai investasi dan lokasi Berdasarkan BPP wilayah
Meningkatkan peran pengusaha dalam
negeri
Mengunci tarif berdasarkan BPP PLN
diharapkan untuk tidak menimbulkan
kerugian bagi PLN
G-10SIEP Final Report - January 2018

Kebijakan Harga dan Pasar Untuk Energi Terbarukan Indonesia
Harga Energi harus berdasarkan nilai ekonomik yang berasaldari biaya produksi, lingkungan & biaya konservasi sertakeuntungan yang wajar.
Karena Harga Energi ditetapkan agar terjangkau, maka untukmemenuhi keekonomian, perlu ada subsidi, atau insentif fiskaldan kemudahan lainnya
Pemerintah harus meregulasi pasar ET, termasuk pengaturankuota minimum untuk ET untuk pembangkit listrik, liquid fueldan gas yang dihasilkan dari sumber ET.
G-11SIEP Final Report - January 2018

1. Besaran kapasitas yang dibahas: 10 MW, 20 MW, 55 MW, 110+ MW.2. Asumsi biaya untuk high enthalpy. Asumsi biaya untuk medium/low
enthalpy perlu mendapat perhatian khusus.3. Asumsi biaya untuk pengembangan geothermal greenfield dengan masa
pengembangan dan konstruksi selama 7 tahun (1 tahun untuk studigeoscience, 3 tahun untuk pembangunan infrastruktur, pemboraneksplorasi dan uji sumur serta resource assessment, 3 tahun untukproses financing dan pengembangan/EPC).
4. Asumsi biaya adalah untuk tahun 2015, USD real. Untuk biaya nominalharus memperhitungkan tingkat inflasi dan kondisi pasar.
5. Asumsi teknis sebagai berikut:a. Success ratio eksplorasi = 50%, pengembangan = 80%b. Kedalaman sumur eksplorasi = 2,500 m, pengembangan = 2,000 mc. Depletion rate = 4%d. Capacity and Availability Factor = 95%
Bagaimana Struktur Biaya Dalam PenentuanHarga ET (Keekonomian) – FiT: Case Pabum
6. Asumsi finansial sebagai berikut:a. PPN 10% sudah termasuk dalam asumsi biaya.b. Production Bonus (0.5%) sudah termasuk dalam Royalty sebesar 3%.c. Tidak termasuk biaya Ijin Pemanfaatan Jasa Lingkungan.d. PPh badan = 25%
7. Sudah memperhitungkan insentif pajak penghasilan (depresiasidipercepat, investment allowance, tax loss carry forward)
8. Bea masuk dan pajak impor = 0% (dibebaskan/tidak dipungut)9. Take or pay = 90%10. Inflasi = 2% per tahun11. Eskalasi tarif = 25% dari tarif atau sekitar 0.6% per tahun12.Target IRR proyek = 16%
Bagaimana Struktur Biaya Dalam PenentuanHarga ET (Keekonomian) - FiT
G-7SIEP Final Report - January 2018
G-12SIEP Final Report - January 2018

1. Pungutan cukai untuk pemanfaatan bahan bakar fosil dalamnegeri dengan tujuan untuk mengurangi konsumsi bahan bakarfosil tersebut. Besarnya pungutan yang dikenakan terhadappenggunaan bahan bakar fosil ditetapkan berdasarkan biayaeksternalitas dari pemanfaatan bahan bakar fosil tersebut (Salahsatu studi dari BPPT - Agus Sugiyono, BPPT, 2013 - menghitungbiaya eksternalitas pembangkit PLTU Batubara sebesar US cent2.8830/kWh).
2. Pungutan untuk ekspor bahan bakar fosil (depletion premium);3. Kontribusi dari masyarakat untuk pengembangan energi
terbarukan, terutama konsumen listrik PLN dengan instalasi >2200 kVA dengan besaran bervariasi tergantung besaraninstalasi dan konsumsi
Pendanaan kreatif untuk membiayaipengembangan ET kurangi beban APBN
1. Penyediaan listrik di daerah-daerah terpencil dan perbatasan untukmeningkatkan rasio elektrifikasi nasional;
2. Pemberian kompensasi kepada PLN dan Pertamina untuk menanggulangigap antara harga energi dan BPP PLN, dan gap antara biaya produksiPertamina dan harga jual BBN;
3. Penyediaan loan guarantee untuk investasi energi terbarukan, sehinggapihak perbankan bersedia memberikan pinjaman investasi kepadapengembang energi terbarukan tanpa keharusan untuk penyediaan physical
collateral;4. Penyediaan dana bergulir dengan bunga murah untuk menurunkan cost of
fund investasi energi terbarukan;5. Penyediaan dana untuk pengembangan bankable projects, yang mana dana
tersebut akan dikembalikan oleh pengembang apabila proyek sudah berhasildibangun;
6. Pembiayaan riset teknologi energi terbarukan;7. Pembiayaan capacity building, sertifikasi teknisi, dan sosialisasi energi
terbarukan;8. Dan lain-lain yang secara strategis bermanfaat untuk menunjang
pengembangan energi terbarukan.
Pendanaan yang diperoleh hendaknya dikelola oleh satubadan khusus untuk ET :
G-13SIEP Final Report - January 2018
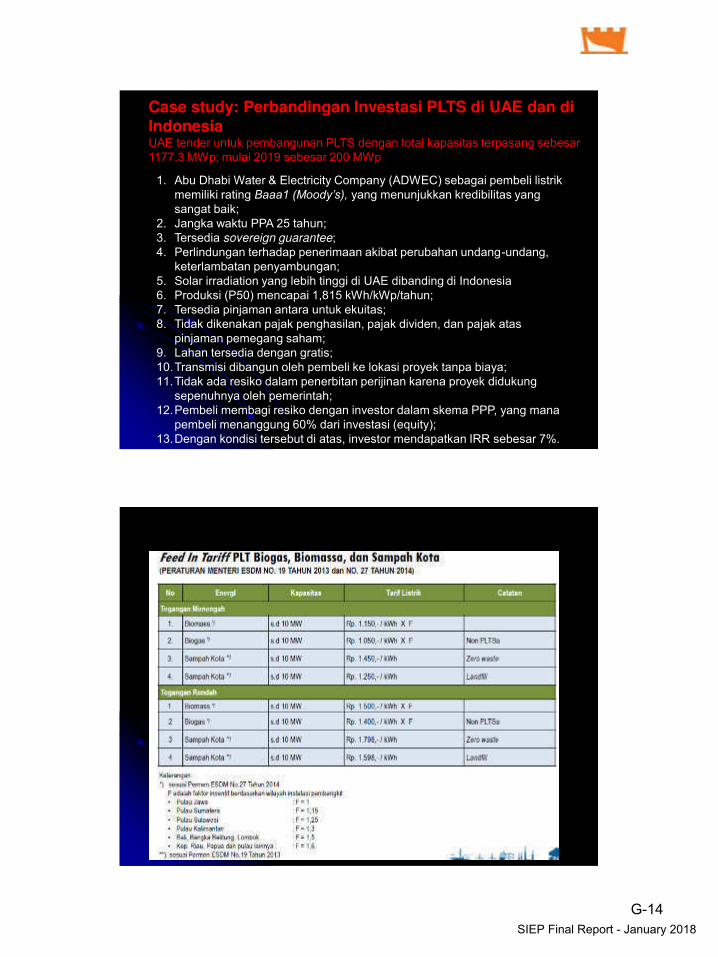
1. Abu Dhabi Water & Electricity Company (ADWEC) sebagai pembeli listrikmemiliki rating Baaa1 (Moody’s), yang menunjukkan kredibilitas yangsangat baik;
2. Jangka waktu PPA 25 tahun;3. Tersedia sovereign guarantee;4. Perlindungan terhadap penerimaan akibat perubahan undang-undang,
keterlambatan penyambungan;5. Solar irradiation yang lebih tinggi di UAE dibanding di Indonesia6. Produksi (P50) mencapai 1,815 kWh/kWp/tahun;7. Tersedia pinjaman antara untuk ekuitas;8. Tidak dikenakan pajak penghasilan, pajak dividen, dan pajak atas
pinjaman pemegang saham;9. Lahan tersedia dengan gratis;10.Transmisi dibangun oleh pembeli ke lokasi proyek tanpa biaya;11.Tidak ada resiko dalam penerbitan perijinan karena proyek didukung
sepenuhnya oleh pemerintah;12.Pembeli membagi resiko dengan investor dalam skema PPP, yang mana
pembeli menanggung 60% dari investasi (equity);13.Dengan kondisi tersebut di atas, investor mendapatkan IRR sebesar 7%.
Case study: Perbandingan Investasi PLTS di UAE dan di
IndonesiaUAE tender untuk pembangunan PLTS dengan total kapasitas terpasang sebesar1177.3 MWp; mulai 2019 sebesar 200 MWp
G-14SIEP Final Report - January 2018
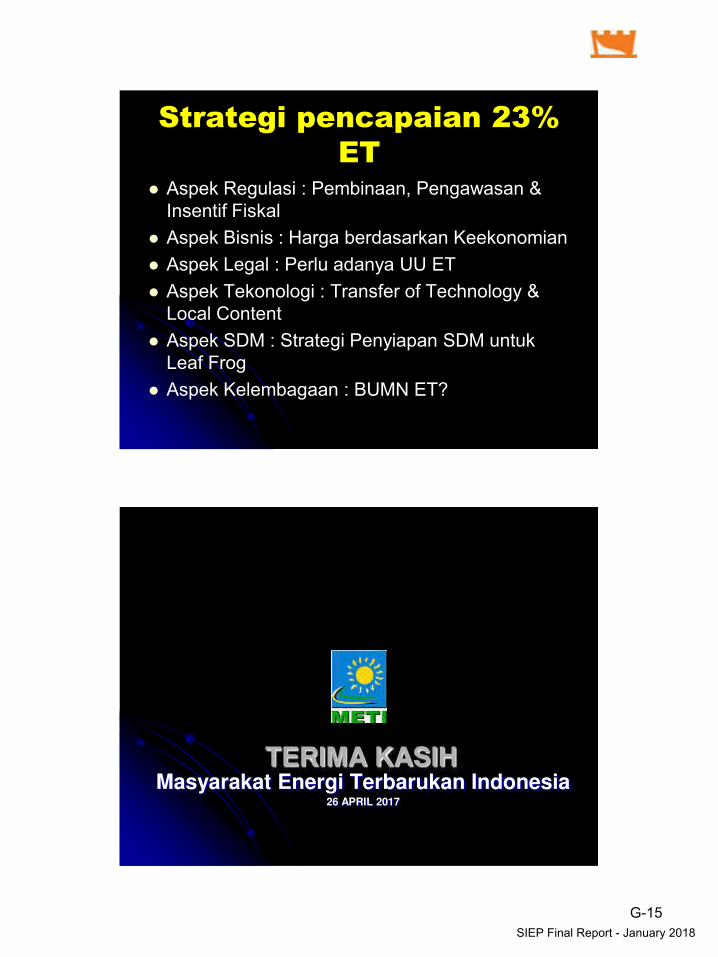
Strategi pencapaian 23%
ET Aspek Regulasi : Pembinaan, Pengawasan &
Insentif Fiskal
Aspek Bisnis : Harga berdasarkan Keekonomian
Aspek Legal : Perlu adanya UU ET
Aspek Tekonologi : Transfer of Technology &Local Content
Aspek SDM : Strategi Penyiapan SDM untukLeaf Frog
Aspek Kelembagaan : BUMN ET?
Masyarakat Energi Terbarukan Indonesia26 APRIL 2017
TERIMA KASIH
G-15SIEP Final Report - January 2018

Investasi PLN dalam
Pengembangan Energi Baru
Terbarukan
Jakarta, 15 Agustus 2017
Dipresentasikan oleh :
Nicke Widyawati
Direktur Pengadaan Strategis I

www.pln.co.id |CONFIDENTIAL !! Any use of this material without specific permission of PLN is strictly prohibited.
Peran PLN dalam pengembangan EBT
BUMN
• Sebagai BUMN, PLN harus mendapatkan profit dari kegiatan usahayang dilakukan
Agen Pemerintah
• Sebagai agen Pemerintah dalam menyediakan ketersediaan listrik yangterjangkau bagi masyarakat.

www.pln.co.id |CONFIDENTIAL !! Any use of this material without specific permission of PLN is strictly prohibited.
Rencana Pengembangan Infrastruktur Tenaga Listrik 2017-2026
• 3
JAWA-BALI
Pembangkit 39.1 GW
Transmisi 18.494 kms
Gardu Induk 98.339 MVA
SUMATERA
Pembangkit 21.0 GW
Transmisi 23.077 kms
Gardu Induk 45.620 MVA
KALIMANTAN
Pembangkit 6.9 GW
Transmisi 10.611 kms
Gardu Induk 7.590 MVA
SULAWESI & NUSA TENGGARA
Pembangkit 8.6 GW
Transmisi 12.805 kms
Gardu Induk 11.582 MVAMALUKU & PAPUA
Pembangkit 2.1 GW
Transmisi 2.479 kms
Gardu Induk 2.100 MVA
TOTAL INDONESIA
Pembangkit 77.9 GW
Transmisi 67.465 kms
Gardu Induk 165.231 MVA
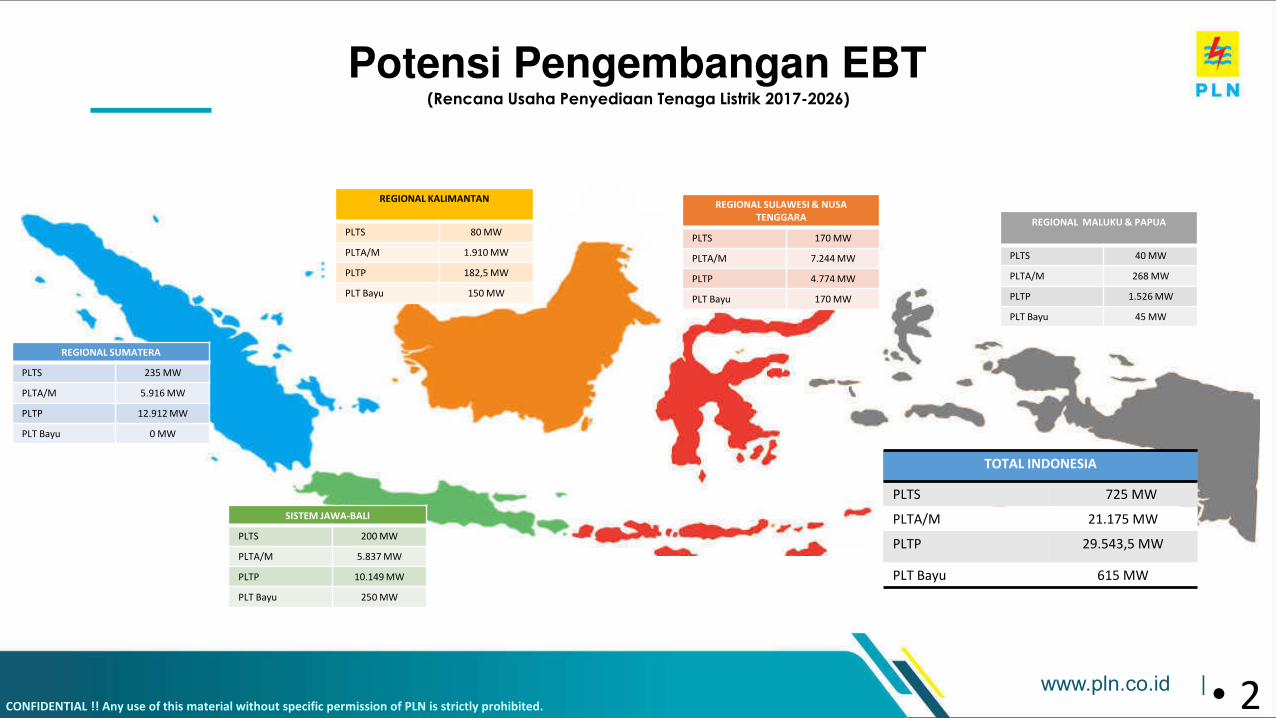
www.pln.co.id |CONFIDENTIAL !! Any use of this material without specific permission of PLN is strictly prohibited. • 2
Potensi Pengembangan EBT (Rencana Usaha Penyediaan Tenaga Listrik 2017-2026)
SISTEM JAWA-BALI
PLTS 200 MW
PLTA/M 5.837 MW
PLTP 10.149 MW
PLT Bayu 250 MW
REGIONAL SUMATERA
PLTS 235 MW
PLTA/M 5.916 MW
PLTP 12.912 MW
PLT Bayu 0 MW
REGIONAL KALIMANTAN
PLTS 80 MW
PLTA/M 1.910 MW
PLTP 182,5 MW
PLT Bayu 150 MW
REGIONAL SULAWESI & NUSA
TENGGARA
PLTS 170 MW
PLTA/M 7.244 MW
PLTP 4.774 MW
PLT Bayu 170 MW
REGIONAL MALUKU & PAPUA
PLTS 40 MW
PLTA/M 268 MW
PLTP 1.526 MW
PLT Bayu 45 MW
TOTAL INDONESIA
PLTS 725 MW
PLTA/M 21.175 MW
PLTP 29.543,5 MW
PLT Bayu 615 MW

www.pln.co.id |CONFIDENTIAL !! Any use of this material without specific permission of PLN is strictly prohibited.
PENAMBAHAN PEMBANGKIT EBT2017-2026
• 3
No Pembangkit - EBT Kapasitas Jumlah
1 PLTP MW -
2 PLTA MW 1,056
3 PLTMH MW 10
4 PLT Surya MWp -
5 PLT Bayu MW 150
6 PLT Biomass/Sampah MW 41
7 PLT Kelautan MW -
8 PLT Bio-Fuel Ribu Kilo Liter 548
MW 1,257 Jumlah
No Pembangkit - EBT Kapasitas Jumlah
1 PLTP MW 3,305
2 PLTA MW 4,284
3 PLTMH MW 983
4 PLT Surya MWp 5
5 PLT Bayu MW -
6 PLT Biomass/Sampah MW 274
7 PLT Kelautan MW -
8 PLT Bio-Fuel Ribu Kilo Liter 958
MW 8,851 Jumlah
No Pembangkit - EBT Kapasitas Jumlah
1 PLTP MW 2,510
2 PLTA MW 4,562
3 PLTMH MW 437
4 PLT Surya MWp -
5 PLT Bayu MW 250
6 PLT Biomass/Sampah MW 206
7 PLT Kelautan MW -
8 PLT Bio-Fuel Ribu Kilo Liter 474
MW 7,965 Jumlah
No Pembangkit - EBT Kapasitas Jumlah
1 PLTP MW 400
2 PLTA MW 2,323
3 PLTMH MW 221
4 PLT Surya MWp 52
5 PLT Bayu MW 170
6 PLT Biomass/Sampah MW 21
7 PLT Kelautan MW -
8 PLT Bio-Fuel Ribu Kilo Liter 686
MW 3,186 Jumlah
No Pembangkit - EBT Kapasitas Jumlah
1 PLTP MW 75
2 PLTA MW 118
3 PLTMH MW 43
4 PLT Surya MWp -
5 PLT Bayu MW 45
6 PLT Biomass/Sampah MW 10
7 PLT Kelautan MW -
8 PLT Bio-Fuel Ribu Kilo Liter 375
MW 290 Jumlah

www.pln.co.id |CONFIDENTIAL !! Any use of this material without specific permission of PLN is strictly prohibited. • 4
No Pembangkit - EBT Kapasitas 2017 2018 2019 2020 2021 2022 2023 2024 2025 2026 Jumlah
1 PLTP MW 305 165 315 186 365 790 345 1,015 2,510 294 6,290
2 PLTA MW 18 87 323 154 1,800 1,555 2,035 1,697 3,675 1,000 12,342
3 PLTMH MW 68 112 163 198 388 326 178 30 150 81 1,694
4 PLT Surya MWp 20 13 24 - - - - - - - 57
5 PLT Bayu MW - - 215 280 120 - - - - - 615
6 PLT Biomass/Sampah MW 43 76 243 93 91 6 - - - - 552
7 PLT Kelautan MW - - - - - - - - - - -
8 PLT Bio-Fuel Ribu Kilo Liter 930 731 331 263 197 108 112 116 123 129 3,041
MW 453 453 1,282 911 2,764 2,676 2,557 2,742 6,335 1,375 21,549 Jumlah
Pengembangan EBT sesuai RUPTL 2017 - 2026

www.pln.co.id |CONFIDENTIAL !! Any use of this material without specific permission of PLN is strictly prohibited.
Proyeksi Bauran Energi 2017 - 2026
• 5
Panas Bumi
8.9%
BBM
0.4% Gas 8.3%LNG
18.4% Lainnya
1.2%
2026
EBT : 11.9%
GAS: 25.8%
Air 12.4%
Batubara 50.4%
EBT : 22.5%
GAS: 26.6%
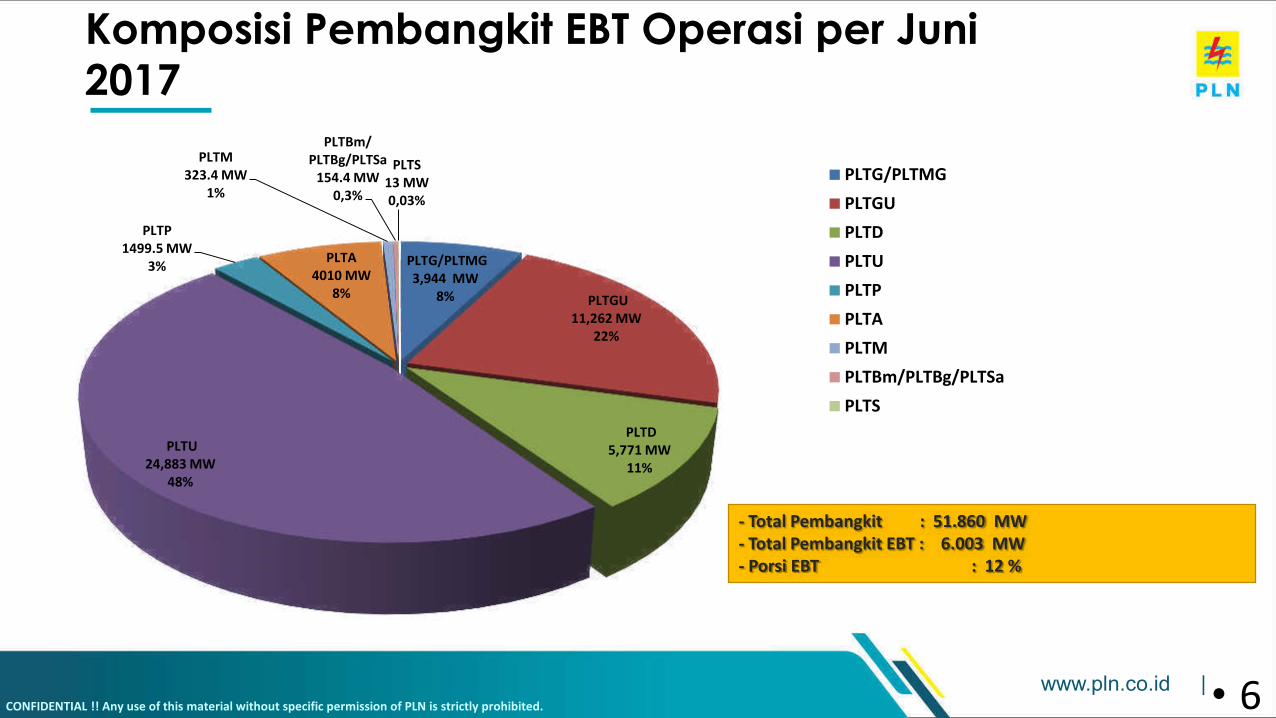
www.pln.co.id |CONFIDENTIAL !! Any use of this material without specific permission of PLN is strictly prohibited.
PLTG/PLTMG
3,944 MW
8% PLTGU
11,262 MW
22%
PLTD
5,771 MW
11%
PLTU
24,883 MW
48%
PLTP
1499.5 MW
3%PLTA
4010 MW
8%
PLTM
323.4 MW
1%
PLTBm/
PLTBg/PLTSa
154.4 MW
0,3%
PLTS
13 MW
0,03%
PLTG/PLTMG
PLTGU
PLTD
PLTU
PLTP
PLTA
PLTM
PLTBm/PLTBg/PLTSa
PLTS
Komposisi Pembangkit EBT Operasi per Juni
2017
- Total Pembangkit : 51.860 MW
- Total Pembangkit EBT : 6.003 MW
- Porsi EBT : 12 %
• 6
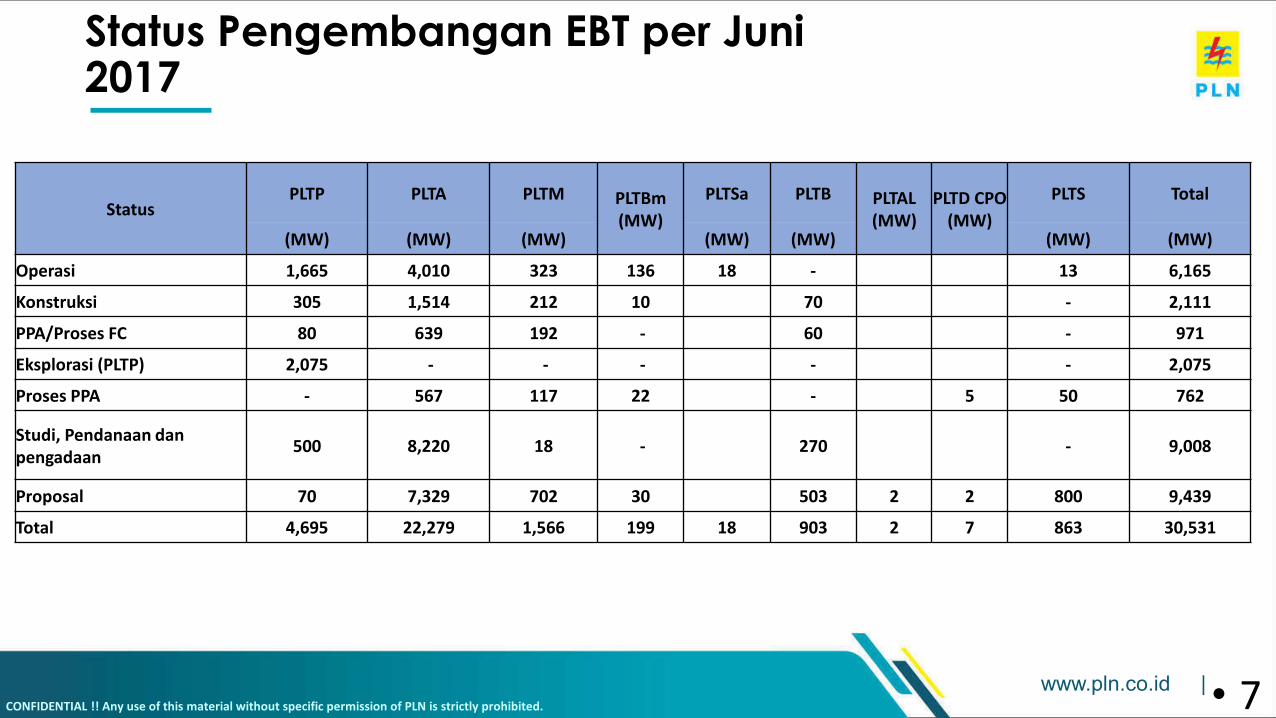
www.pln.co.id |CONFIDENTIAL !! Any use of this material without specific permission of PLN is strictly prohibited.
Status Pengembangan EBT per Juni 2017
• 7
StatusPLTP PLTA PLTM PLTBm
(MW)
PLTSa PLTB PLTAL
(MW)
PLTD CPO
(MW)
PLTS Total
(MW) (MW) (MW) (MW) (MW) (MW) (MW)
Operasi 1,665 4,010 323 136 18 - 13 6,165
Konstruksi 305 1,514 212 10 70 - 2,111
PPA/Proses FC 80 639 192 - 60 - 971
Eksplorasi (PLTP) 2,075 - - - - - 2,075
Proses PPA - 567 117 22 - 5 50 762
Studi, Pendanaan dan
pengadaan500 8,220 18 - 270 - 9,008
Proposal 70 7,329 702 30 503 2 2 800 9,439
Total 4,695 22,279 1,566 199 18 903 2 7 863 30,531
www.pln.co.id |CONFIDENTIAL !! Any use of this material without specific permission of PLN is strictly prohibited.
Tantangan Dan Peluang Pengembangan EBT
1

www.pln.co.id |CONFIDENTIAL !! Any use of this material without specific permission of PLN is strictly prohibited.
Tantangan Pengembangan EBT (1)
• 13
Biaya Pengembangan EBT selalu dibandingkan dengan Biaya Pembangkit Listrik dari Energi Fosil yang belum memperhitungkan faktor lingkungan
BPP di beberapa Wilayah Indonesia sudah relatif rendah.
Take Or Pay untuk beberapa Pembangkit Thermal IPP
Keterbatasan Sistem untuk menerima Pembangkit EBT Intermittent

www.pln.co.id |CONFIDENTIAL !! Any use of this material without specific permission of PLN is strictly prohibited.
Tantangan Pengembangan EBT (2)
• 13
Potensi Energi Hydro yang tersisa kurang ekonomis dikembangkan dengan tarif mengacu pada BPP
Untuk pembangkit Panas Bumi (PLTP), biaya eksplorasi terutama untuk drilling yang cukup besar dengan succes ratio yang kecil.
Untuk PLTP besaran kapasitas antara potensi dengan cadangan terbukti yang berbeda
Biaya Pengembangan PLTSa lebih tinggi dari harga patokan tertinggi yang bisa diterima oleh PLN
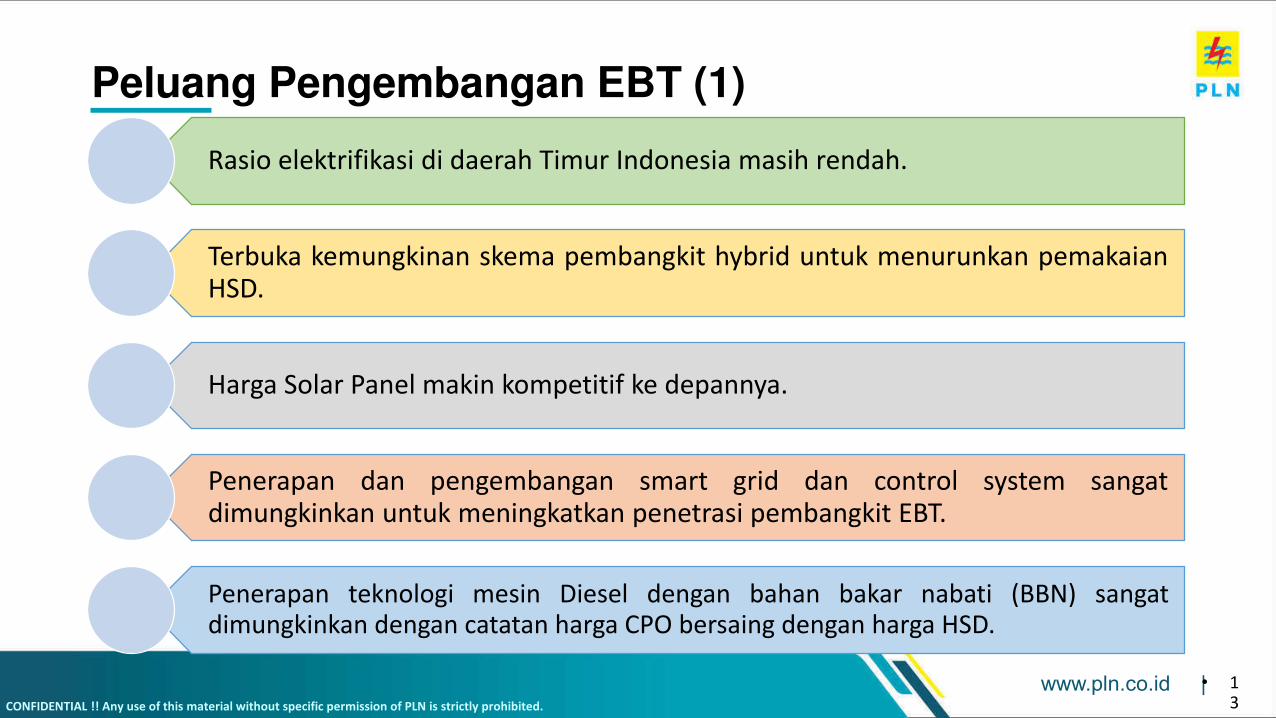
www.pln.co.id |CONFIDENTIAL !! Any use of this material without specific permission of PLN is strictly prohibited.
Peluang Pengembangan EBT (1)
• 13
Rasio elektrifikasi di daerah Timur Indonesia masih rendah.
Terbuka kemungkinan skema pembangkit hybrid untuk menurunkan pemakaianHSD.
Harga Solar Panel makin kompetitif ke depannya.
Penerapan dan pengembangan smart grid dan control system sangatdimungkinkan untuk meningkatkan penetrasi pembangkit EBT.
Penerapan teknologi mesin Diesel dengan bahan bakar nabati (BBN) sangatdimungkinkan dengan catatan harga CPO bersaing dengan harga HSD.
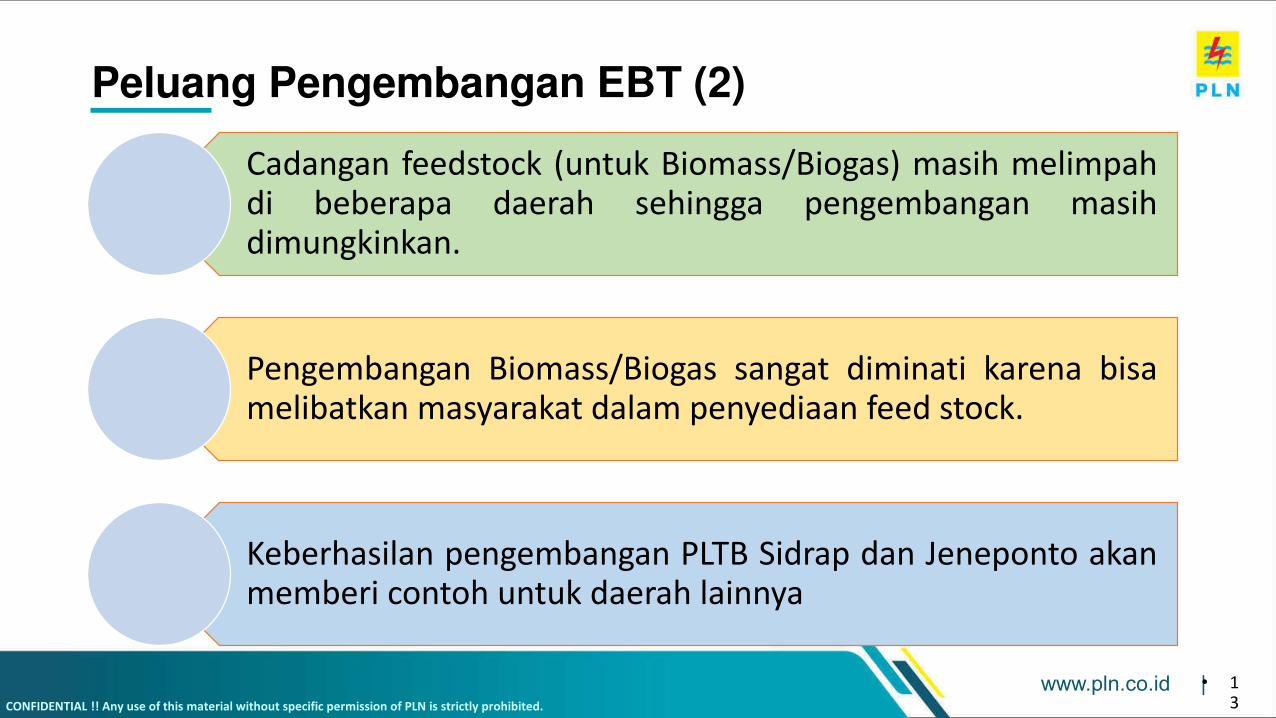
www.pln.co.id |CONFIDENTIAL !! Any use of this material without specific permission of PLN is strictly prohibited.
Peluang Pengembangan EBT (2)
• 13
Cadangan feedstock (untuk Biomass/Biogas) masih melimpahdi beberapa daerah sehingga pengembangan masihdimungkinkan.
Pengembangan Biomass/Biogas sangat diminati karena bisamelibatkan masyarakat dalam penyediaan feed stock.
Keberhasilan pengembangan PLTB Sidrap dan Jeneponto akanmemberi contoh untuk daerah lainnya

www.pln.co.id |CONFIDENTIAL !! Any use of this material without specific permission of PLN is strictly prohibited.
Peluang Pengembangan EBT (3)
• 13
Untuk Hydro, metoda pelaksanaan proyek Hidro makin efisiensehingga kalkulasi biaya proyek bisa memungkinkan tarif disekitar BPP dapat diterima pengembang.
Untuk Panas Bumi, pembahasan PJBTL panas bumi dengan PLNdilakukan setelah ada cadangan terbukti/hasil eksplorasi sehinggabesaran kapasitas pengembangan menjadi lebih akurat.
Ijin-ijin pengembangan hidro dan panas bumi yang telahditerbitkan namun belum berjalan untuk dapat diberikanpenugasannya ke PLN.
www.pln.co.id |CONFIDENTIAL !! Any use of this material without specific permission of PLN is strictly prohibited.
Intervensi Pemerintah dalam pengembangan EBT
1

www.pln.co.id |CONFIDENTIAL !! Any use of this material without specific permission of PLN is strictly prohibited.
Contoh: Program Percepatan PLTSa 7 Kota
Fit PLTSa Permen ESDM No. 44 tahun 2015
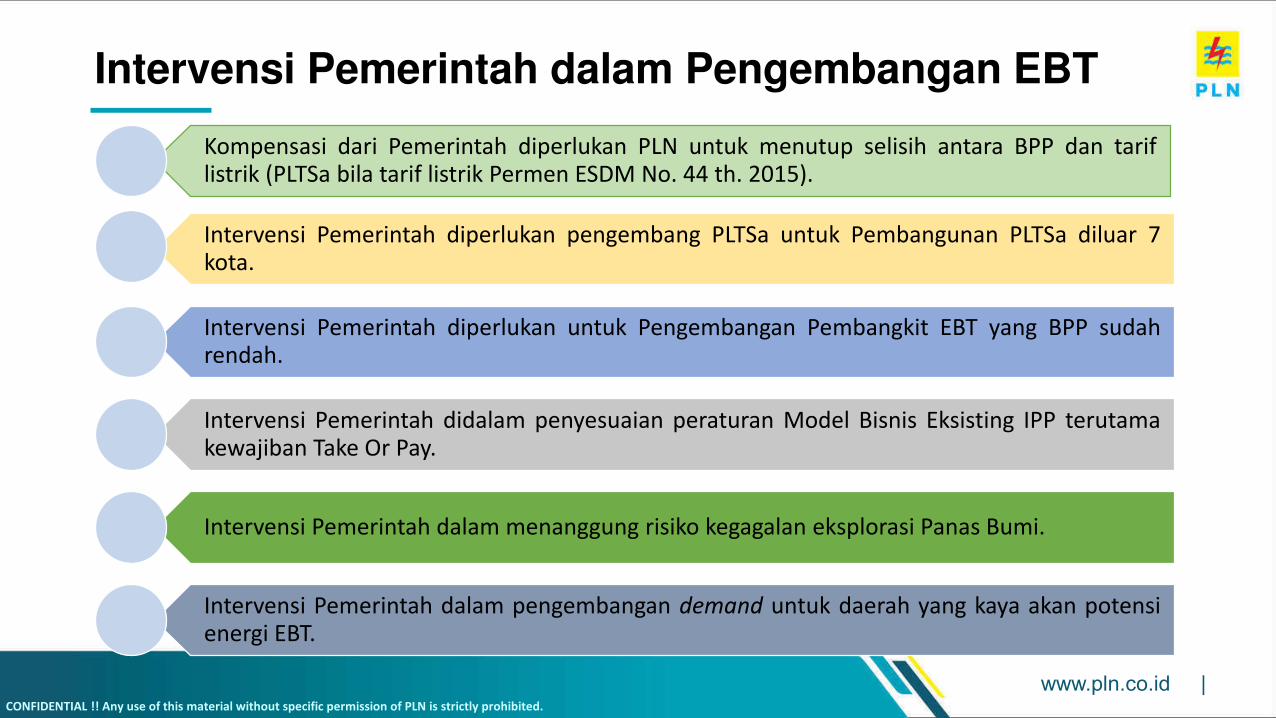
www.pln.co.id |CONFIDENTIAL !! Any use of this material without specific permission of PLN is strictly prohibited.
Intervensi Pemerintah dalam Pengembangan EBT
Kompensasi dari Pemerintah diperlukan PLN untuk menutup selisih antara BPP dan tariflistrik (PLTSa bila tarif listrik Permen ESDM No. 44 th. 2015).
Intervensi Pemerintah diperlukan pengembang PLTSa untuk Pembangunan PLTSa diluar 7kota.
Intervensi Pemerintah diperlukan untuk Pengembangan Pembangkit EBT yang BPP sudahrendah.
Intervensi Pemerintah didalam penyesuaian peraturan Model Bisnis Eksisting IPP terutamakewajiban Take Or Pay.
Intervensi Pemerintah dalam menanggung risiko kegagalan eksplorasi Panas Bumi.
Intervensi Pemerintah dalam pengembangan demand untuk daerah yang kaya akan potensienergi EBT.

Kerja Nyata, Terangi Nusantara
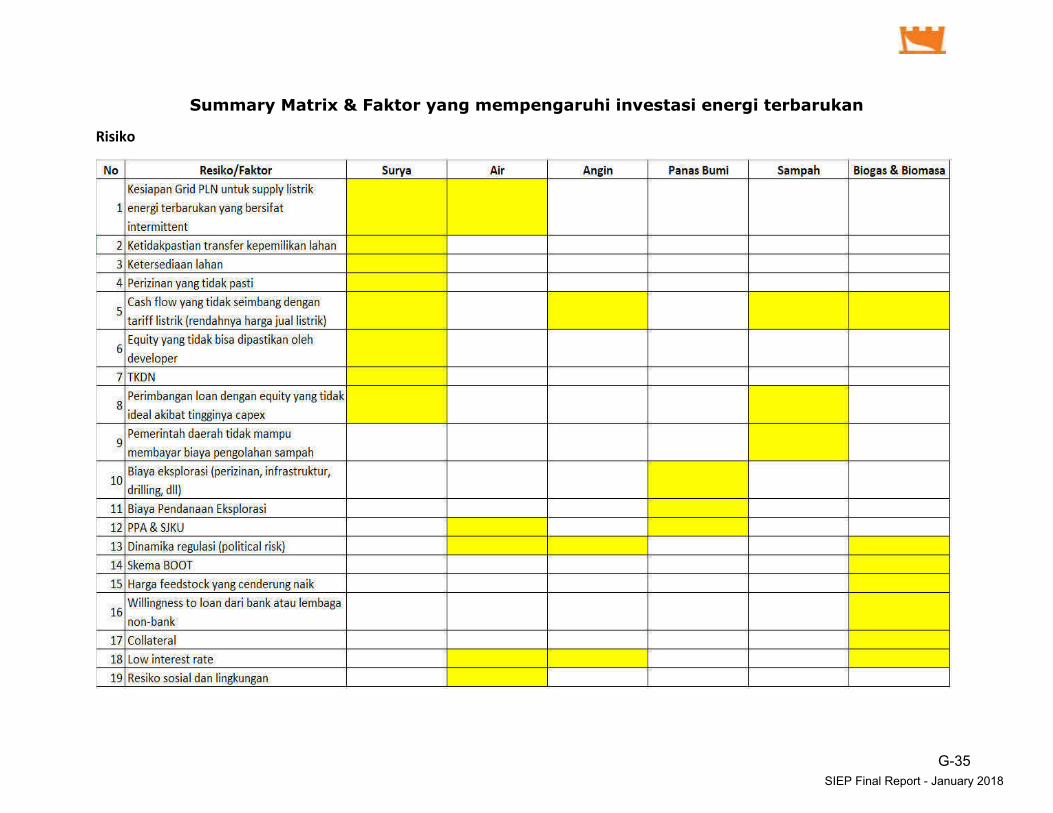
Summary Matrix & Faktor yang mempengaruhi investasi energi terbarukan
Risiko
G-12SIEP Final Report - January 2018
G-11SIEP Final Report - January 2018
G-35SIEP Final Report - January 2018

Usulan Mitigasi Fiskal
G-36SIEP Final Report - January 2018
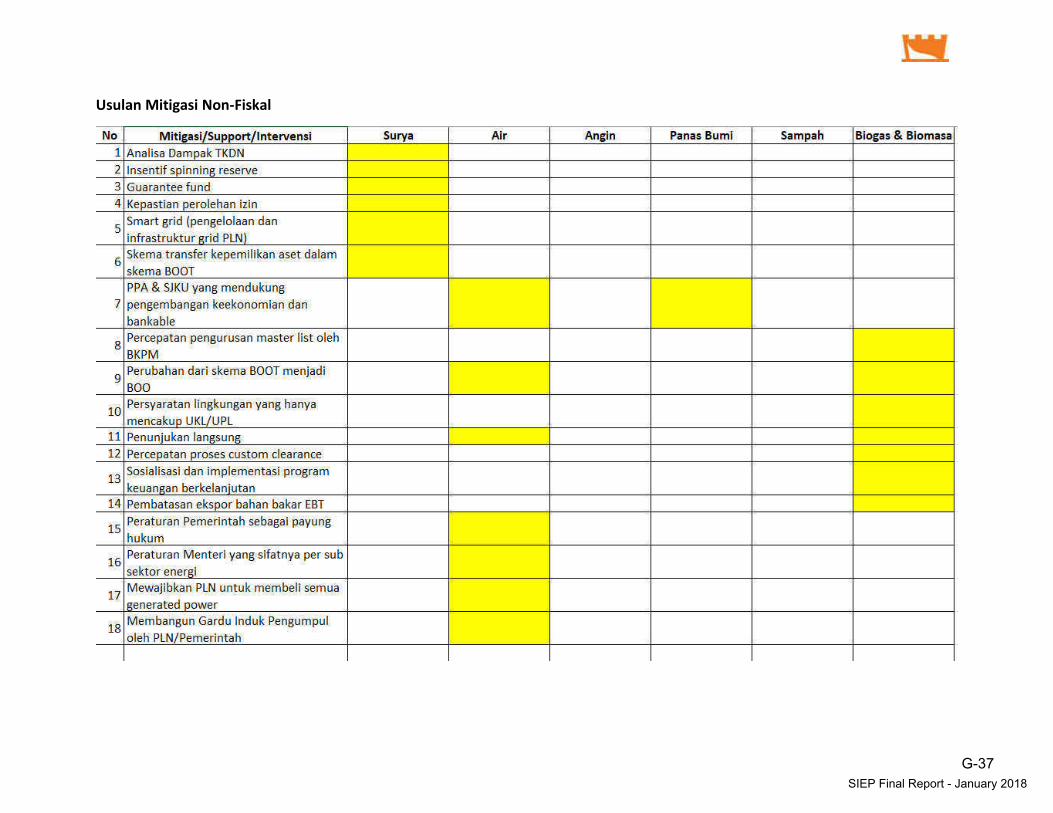
Usulan Mitigasi Non-Fiskal
G-37SIEP Final Report - January 2018

EXECUTIVE SUMMARY
FOLLOWING FGD 1 & FGD 2
ACCELERATION OF RENEWABLE ENERGY INVESTMENTS Prepared by Bely Utarja
18/08/2017
There are many reasons for Indonesia to immediately accelerate investment in new and renewable
energy generation plants. Some of the main reasons that arise from the first focus group discussion are:
1. Limited availability of support from the availability of fossil energy reserves to development.
2. The tremendous trend of uncertainty and volatility in prices and supply of fossil energy.
3. Negative externality of the utilization of fossil energy that is not internalized to its supply price.
4. The magnitude of the multiplier effect of renewable energy investment development and at the
same time Indonesia needs the acceleration of economic growth apart from middle income
trap.
5. The Government has decided to have energy mix targets in accordance with the General Plan of
National Energy and is committed to reducing greenhouse gas emissions from the electricity
sector.
Indonesia already has a fairly complete set of energy sector policies. Starting from Law No. 30/2007
about Energy, PP. 79/2014 about the National Energy Policy, which is further translated into the RUEN
(National General Plan of Energy) and RUKN (National General Electricity Plan), is in discussion with the
legislature. This policy tool will be supplemented by a bottom-up policy, ie the district-level RUED and
the provincial level RUED. RUED at the provincial level requires synchronization with RUEN.
In addition, the Government has also provided policy instruments related to prices, subsidies and energy
incentives of EBT. The policy instruments include:
1. Renewable energy price settings: Permen ESDM 43/2017 change of Permen ESDM 12/2017
2. Core technology developer incentives in the field of EBT: risk assurance on the utilization of
research results and rewarding awards for technology developers; from Kemenristekdikti
3. Tax allowance:
o PP 1/2007 jo PP 62/2008 jo PP 52/2011; PMK 144/2012: PPH reduction and accelerated
depreciation / amortization
o PMK 159/2016: tax deductions of 10% to 100%
o PMK 89/2015: procedure for granting income tax facility
o PMK 268/2015: procedures for granting facilities are exempted from VAT on the import
and or delivery of certain taxable goods which are of a strategic nature
4. Import duties:
o KMK 766/1992: duty free, VAT, PPBM, and income tax on imports of operation goods
for the geothermal resource operations
o PMK 78/2005: duty-free on imports of goods for geothermal operations
G-38 SIEP Final Report - January 2018

o PMK 177/2007: import duty on the import of goods for upstream oil, natural gas and
geothermal activities
o PMK 21/2010: taxation and customs facilities
5. Funding:
o PMK 139/2011: granting of PT PLN (Persero) business feasibility guarantee for EBT, coal
and gas power plants; through cooperation with private power developers
o PMK 3/2012: geothermal fund facility
However, the performance of EBT investments is not in accordance with the established targets. For
example, data from the Investment Coordinating Board show that there is a huge gap between the
investment target and its outcome. The investment target of domestic investment for this sector in 2006
- 2009 was USD 13.69 billion, but its achievement was only USD 1.43 billion. As for foreign investment,
the target is USD 61.69 billion but the achievement is only USD 1.75 billion. On the other hand, the
growth of energy mix was not in accordance with the target of National General Energy Plan, which is
only 0.55% per year, compared to 0.9% per year. By 2016, the EBT mix is only 7.7%, less than the 10.7%
target.
In macro, the cause of not reaching the target is caused by some phenomenon as follows:
1. Weak cross-sectorial coordination:
a. Ease of licensing at the central level was not followed by the same at the regional level
b. Most of the sources of problems that arise come from the local government, State-
Owned Enterprises, The Ministry of Environment and land
c. The unavailability of RUED and RUKD to be harmonious with RUEN and RUKN
2. The incompatibility of the purchase price policy with the fiscal incentive policy so as to improve
the economics of investment of EBT power plant optimally:
a. The changes of Permen ESDM 12/2017 to the Permen ESDM 43/2017 is still inadequate;
still to be changed again,
b. The ESDM Ministry with the Ministry of Finance (BKF) still feels the need to jointly
reformulate fiscal support that is more suitable to the needs.
The above phenomenon results from the interaction between the main actors in the arena of EBT policy.
The main actors are: Government, PT PLN and Private Developers.
1. Government: The government's position in achieving the target achievement of the mix and the
reduction of greenhouse gas emissions does not look solid. On one hand, the national energy
policy has mandated the targets of these achievements. And on the other hand, the
Government is currently facing fiscal constraints:
a. Although the internalization of health and environmental costs does make the cost of
providing fossil energy more expensive, but the initial cost for high EBT thus burden the
current state budget.
G-39 SIEP Final Report - January 2018

b. The current low cost of fossil energy supports more just energy policies that seek to
provide cheap electricity access to the less fortunate
2. PT PLN: PLN has a unique position in the electricity sector. As a State-Owned Enterprise
(Persero), PLN must maintain margin to maintain sustainability. On the other hand, as a
government agency, PLN must provide electricity to the public and users in general at an
affordable price.
3. Private developers: have a profit motive so expect an adequate rate of return to grow and
expand. Private developers need legal certainty and business certainty; and prefer the FIT
scheme.
The uncertainty of the Government's position and the current economic downturn led to a growing
conflict of interest between PT PLN and private developers:
1. PLN has a purpose to reduce the cost of electricity supply, which causes PT PLN to only purchase
electricity from EBT plants if it offers lower tariff compared to the cost of electricity supply of PT
PLN in the area.
2. PT PLN follows a fair energy policy which means that at present it will prioritize fossil-fuel power
plants. Although at the same time the development of private electricity EBT tries to offer
electricity with lower external costs.
3. Take or pay agreements from old generators - including fossil-generating plants - cause new
plants - including EBT plants - cannot simply replace the role of old generators.
Therefore, the Government must immediately establish the position and apply the appropriate
regulatory approach to direct incentives of PT PLN and Private Power Developers so that the
acceleration program of EBT investment can be realized. Related to this, in the second FGD, the
Coordinating Ministry of Economic Affairs designed roundtable discussion for each type of EBT
generator: solar, water, wind, geothermal, biomass and waste. Each technology uses a single table.
The output of each table is a Government support proposal - both fiscal and non-fiscal - that match the
technological characteristics. To produce the output, the steps are:
1. Identify risks that may affect the cost of Capex, Opex and funding.
2. Mapping identified risks to the impact probability matrix.
3. Select the risks that are in the upper right position of the resulting matrix to be the focus of
further discussion.
4. Formulate the allocation of risks at: central government, local government, PT PLN, private
developers and / or third parties.
5. Formulate the types of non-fiscal support that can be provided on risks allocated to the Central
Government or the Regional Government.
6. If non-fiscal support is available, what kind of incentive instrument is effective to improve the
financial feasibility of private developers?
The preliminary results of the roundtable discussion are as follows (based on suggestions from each
table):
1. Related to the contract structure with PT PLN:
a. Change the BOOT scheme to BOT: Solar, Water and Biogas / Biomass.
G-40 SIEP Final Report - January 2018
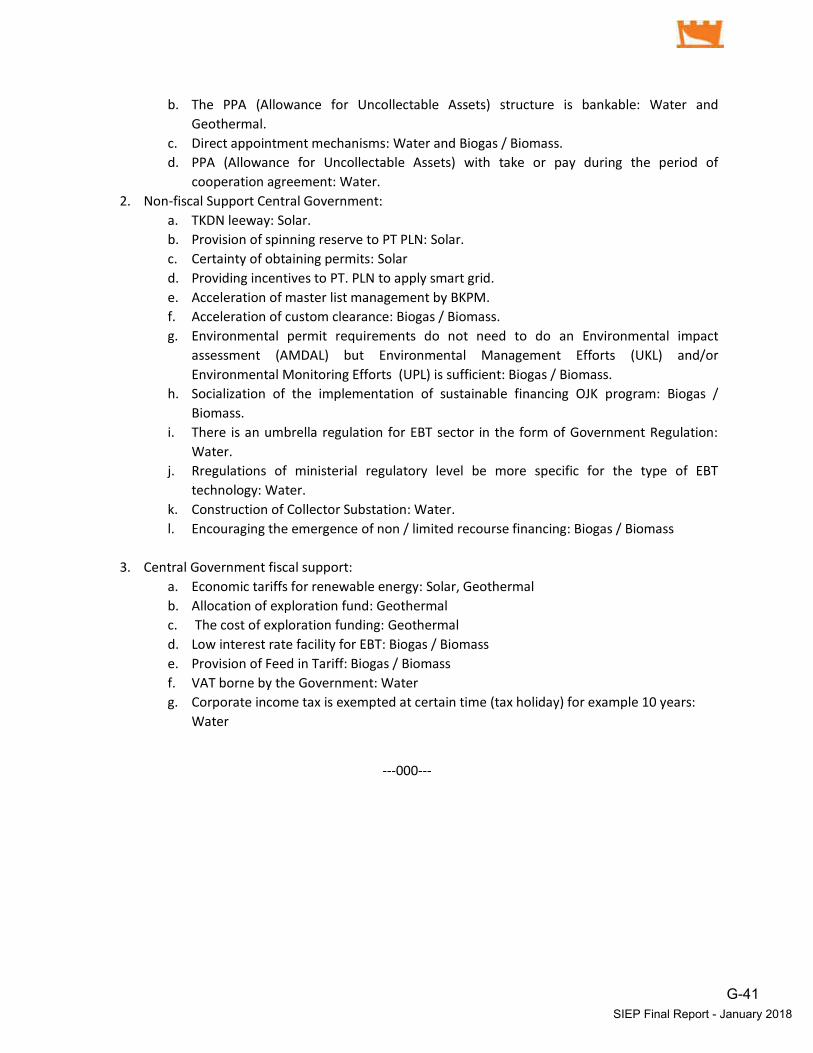
b. The PPA (Allowance for Uncollectable Assets) structure is bankable: Water and
Geothermal.
c. Direct appointment mechanisms: Water and Biogas / Biomass.
d. PPA (Allowance for Uncollectable Assets) with take or pay during the period of
cooperation agreement: Water.
2. Non-fiscal Support Central Government:
a. TKDN leeway: Solar.
b. Provision of spinning reserve to PT PLN: Solar.
c. Certainty of obtaining permits: Solar
d. Providing incentives to PT. PLN to apply smart grid.
e. Acceleration of master list management by BKPM.
f. Acceleration of custom clearance: Biogas / Biomass.
g. Environmental permit requirements do not need to do an Environmental impact
assessment (AMDAL) but Environmental Management Efforts (UKL) and/or
Environmental Monitoring Efforts (UPL) is sufficient: Biogas / Biomass.
h. Socialization of the implementation of sustainable financing OJK program: Biogas /
Biomass.
i. There is an umbrella regulation for EBT sector in the form of Government Regulation:
Water.
j. Rregulations of ministerial regulatory level be more specific for the type of EBT
technology: Water.
k. Construction of Collector Substation: Water.
l. Encouraging the emergence of non / limited recourse financing: Biogas / Biomass
3. Central Government fiscal support:
a. Economic tariffs for renewable energy: Solar, Geothermal
b. Allocation of exploration fund: Geothermal
c. The cost of exploration funding: Geothermal
d. Low interest rate facility for EBT: Biogas / Biomass
e. Provision of Feed in Tariff: Biogas / Biomass
f. VAT borne by the Government: Water
g. Corporate income tax is exempted at certain time (tax holiday) for example 10 years:
Water
---000---
G-41 SIEP Final Report - January 2018