technical assessment and redesign of the polaroid captiva
TRANSCRIPT
Technical Assessment and Redesign of the PolaroidCaptiva Film Rail Component
by
Diana Velez Garcia
B.S., Materials Science and EngineeringMassachusetts Institute of Technology, 1992
Submitted to the Department of Materials Science and Engineering andthe Alfred P. Sloan School of Management in Partial Fulfillment
of the Requirements for the Degrees of
MASTER OF SCIENCE IN MATERIALS SCIENCE AND ENGINEERING
and
MASTER OF SCIENCE IN MANAGEMENT
at theMassachusetts Institute of Technology
May, 1994
© 1994 Massachusetts Institute of Technology
Signature of AuthorDepartment of Materials Science and Enginering and the Sloan S/9,ol of Management
May 6, 1994
5/Certified by
Certified by
Accepted by
Frederick_.Mcaryy. Professor of Polymer Engineering
Karl Ulrich. Associate Professor of Management Science
Carl V. Thompson II, Professo of Electronic MaterialsChair. Departmental Committee on Graduate Students
ScienceMASSACH{ !'e-i.TF" INS'ra, TU'
I r : fi ' 9: if (3,I
AUG 18 1994

2

Technical Assessment and Redesign of the Polaroid Captiva Film RailComponent
by
Diana Velez Garcia
Submitted to the Alfred P. Sloan School of Management and the Department of MaterialsScience and Engineering on May 6, 1994, in partial fulfullment of the requirements for
the Degrees of
Master of Science in Management
and
Master of Science in Materials Science and Engineering
Abstract
'The inner rail component in Polaroid Captiva integral instant film is crucial formaintaining the desired gap between the negative and positive sheets, containing thereagent liquid inside the film packet and maintaining the structural integrity of the filmwhen it is forced through a 0.5" radius chute after a picture is taken. A technicalassessment of the current seven layer laminate rail structure was undertaken for theidentification of sources of material and process variability. Based on the technicalassessment a novel three layer rail based on a polymer blend material was developed.Production trial data of the three layer redesign are documented and indicate significantlyimproved performance over the standard seven layer rail. The performance improvementsof the redesign can be translated into several million dollars in annual savings. Acharacterization of the polymer blend material is also presented to serve as an informationbase for the development of relevant supplier specifications.
Thesis Advisors:
Frederick J. McGarry, Professor of Polymer Science
Karl Ulrich, Associate Professor of Management Science
3

4

Acknowledgements
My thanks go to the members of Polaroid's Materials Laboratory for their hospitality andassistance during my thesis internship. In particular I would like to thank Bill Carnes,Tony Mangano, Ed Grant, Jack Dennis and Warren Dillman for their invaluable support.
I would like to acknowledge Saroj Roy, Ralph Burpee, Bob Murphy and other membersof the Polaroid research organization for their generous input of time and significantcontributions to the project. I would like to thank Harry Jen, Kathy Macchiarola, andMary McCann for making the equipment of the Polaroid Microstructure CharacterizationLab available to me and assisting me in its use.
I would also like to thank Rexham Industrial for access to its manufacturing operationsand Tom Bezek and Rick Brooks for their assistance throughout the project.
At MIT, my thanks go to Maureen Fahey for help with the single fiber tester, LeeRockford for his work on the project as a UROP, and George Margaritis, Mary Chan-Park and Ramnath Subramanian for many helpful discussions and suggestions.
I would also like to thank my advisors, Frederick McGarry from the MlT MaterialsScience Department and Karl Ulrich from the MIT Sloan School of Management.
Finally, I would like to gratefully acknowledge the support and resources made availableto me through the Leaders for Manufacturing Program.
5

6

Table of Contents
CHAPTER 1: Introduction
1.1 Statement of Objectives ........................... ............................. 111.2 Project Approach ........................ ................................ 121.3 Financial Impact .......................... .............................. 131.4 Thesis Organization ........................................................ 14
CHAPTER 2: Background
2.1 Integral Instant Film Structure ........................................................ 152.2 Rail Structure ........................................................ 162.3 Film Processing Through Camera Chute ...................................................... 172.4 Rail Manufacturing Process ........................................................ 19
CHAPTER 3: Technical Assessment
3.1 SEM Sample Preparation ........................... ............................. 233.2 Microscope Settings ........................................................ 243.3 Baseline Appearance of Rail ........................................................ 243.4 Variability Identified in Micrographs ........................................................ 253.5 Assembled Frames: Side Seal Cross-Sections .............................................. 253.6 Assembled Frames: Deformation of Side Seal .............................................. 253.7 Assembled Frames: Peeling Stress Deformation .......................................... 263.8 SEM Findings: Summary ............................ ................. ........... 263.9 Dynamic Mechanical Analysis ........................................ ................ 273.10 DMA Results ........................................................ 293.11 Three Point Bend Testing ............................................................................ 30
3.11.1 Three Point Bend Testing Sample Preparation ............................. 313.11.2 Three Point Bend Testing Results ................................................ 31
3.12 Crack Initiation .......................... .............................. 323.13 Areas Targeted for Material Variability Reduction ..................................... 32
CHAPTER 4: Rail Redesign
4.1 Design Guidelines ........................................................ 674.2 Rail Redesign .............. ................. ......................... 684.3 Polymer Substrate Screening ........................................................ 694.4 Production Trials .................................. ...................... 714.5 Conclusions ........................................................ 72
CHAPTER 5: New Rail Characterization
5.1 SEM Cross-Sections ........................................................ 765.2 Surface Roughness ........................................................ 775.3 Contact Angle ........................................................ 795.4 Conclusions ........................................................ 80
CHAPTER 6: Conclusions and Recommendations
6.1 Research and Development's Role in Manufacturing Support ..................... 976.2 Redesign for Manufacturing Robustness ...................................................... 98
7

8

List of Figures
2.1 Integral film component structure ................................... ............. .... 20
2.2 Schematic of instant film structure and cross-section ............................................. 15
2.3 Side view and cross-section schematic of film between camera rollers ........... ...... 16
2.4 Cross-section of rail structure in film packet ........................................ ............ 17
2.5 Film path through chute .................... ................................ 18
2.6 Shear and peel forces imposed on rame ..................................... ............... 21
2.7 Rail manufacturing process ............................ ........................ 19
3.1 Baseline appearance of the rail .................................................... 33
:3.2 Porosity diferences in tissue layer .................................................... 35
:3.3 Cracking in laminating adhesive layer .................................................... 37
:3.4 Cracking in laminating adhesive layer .................................................... 39
:3.5 Voids in laminating adhesive layer .................................................... 41
3.6 Discontinuities in tissue layer ........................................ ............ 43
3.7 Cross-section of fully assembled frame .................................................... 45
3.8 Frame side seal under slight deformation .................................................... 473.9 Frame side seal under moderate deformation .................................................... 49
3.10 Frame side seal under severe deformation ........................................ ............ 51
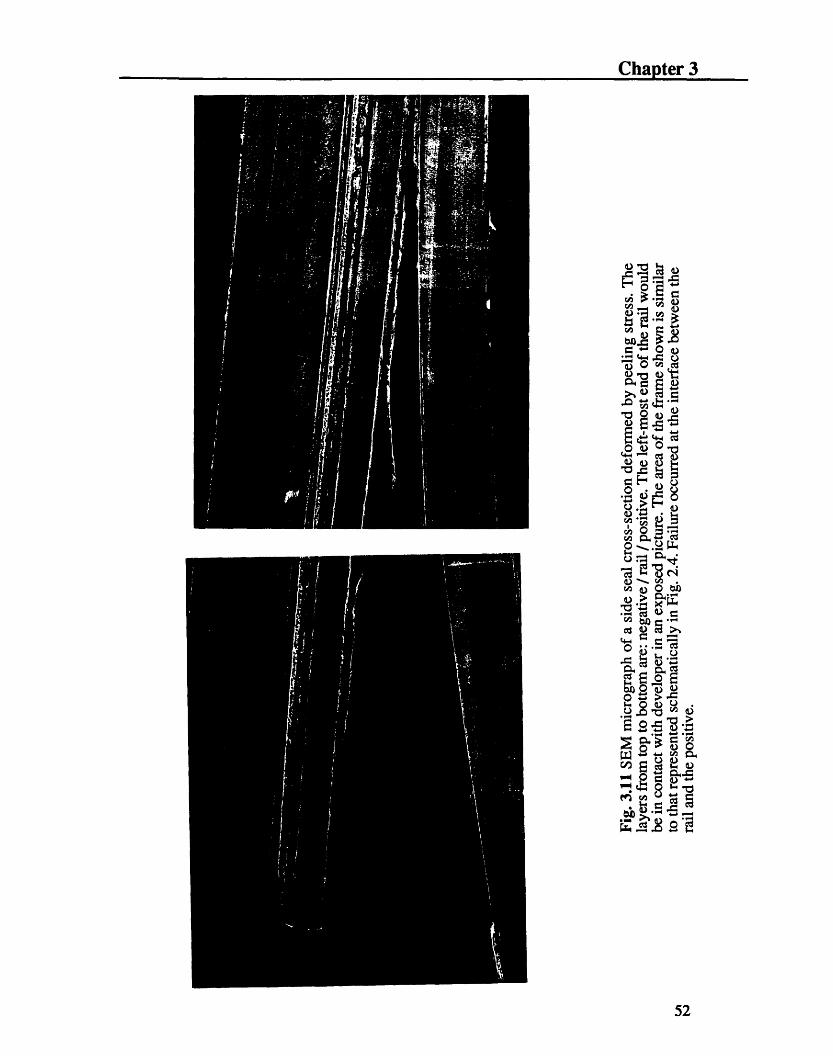
3.11 Side seal cross-section deformation by peeling forces .......................................... 52
3.12 Typical behavior of modulus versus temperature fora polymeric material .................................................... 53
3.13 Relations between various DMA parameters ....................................... 53
3.14 DMA curve of modulus versus temperature for Heat Seal 1 ................................ 54
3.15 DMA curve of modulus versus temperature forlaminating adhesive .................................................... 55
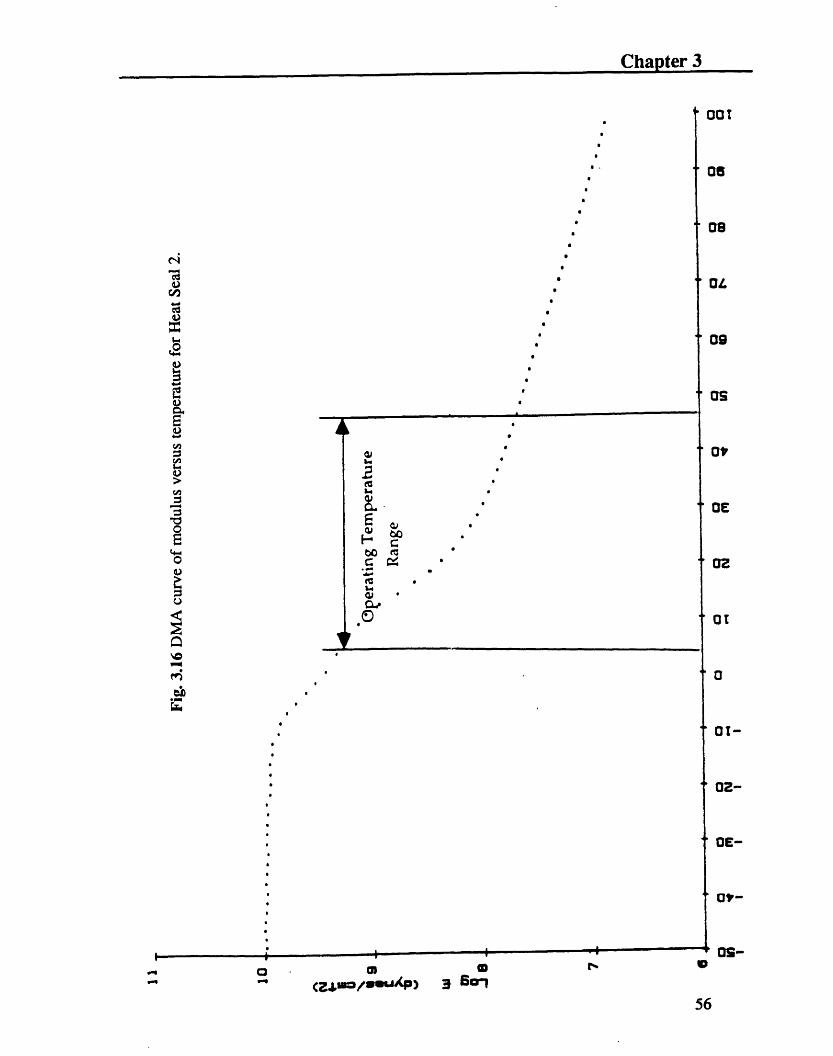
3.16 DMA curve of modulus versus temperature forHeat Seal 2 .................................................... 56
3.17 DMA curve of modulus and tan delta versus temperature forUrethane Adhesive 2 .................................................... 57
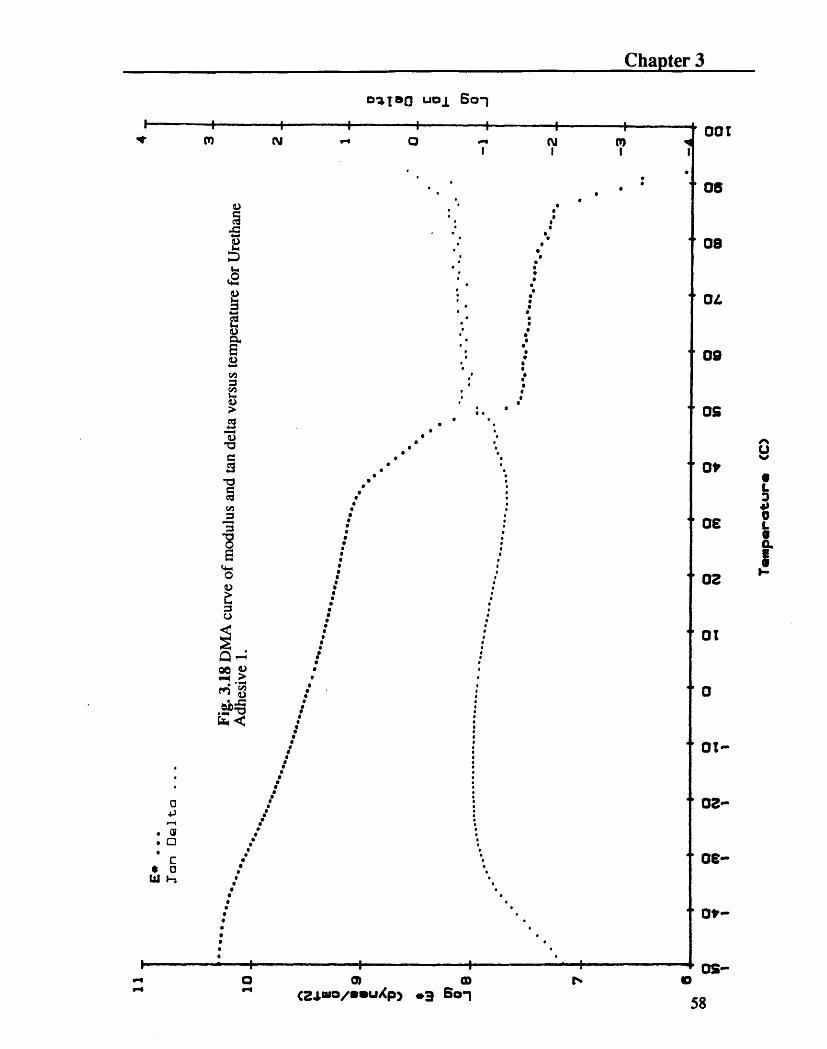
3.18 DMA curve of modulus and tan delta versus temperature forUrethane Adhesive 1 .................................................... 58
3. 19a DMA curve of modulus and tan delta versus temperature forlaminating adhesive exposed to an environment at 20% RH ............................. 59
9

3.19b DMA curve of modulus and tan delta versus temperature forlaminating adhesive exposed to an environment at 45% RH .............................. 60
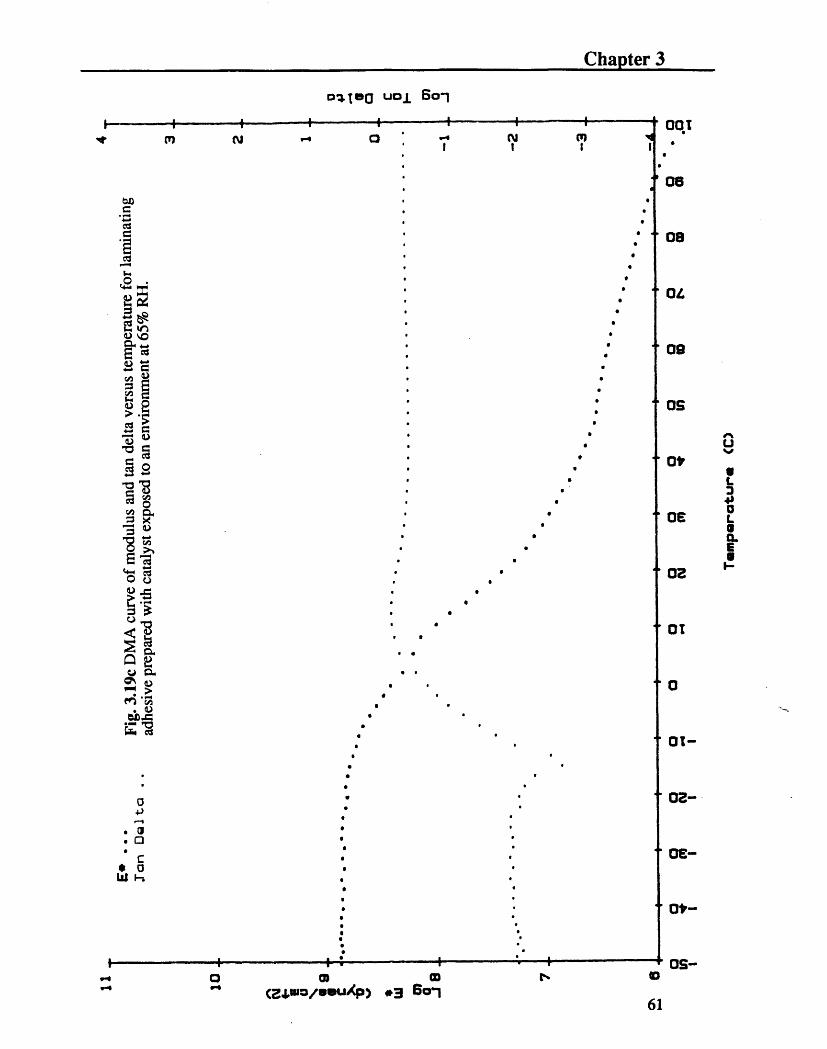
3.19c DMA curve of modulus and tan delta versus temperature forlaminating adhesive exposed to an environment at 65% RH .............................. 61
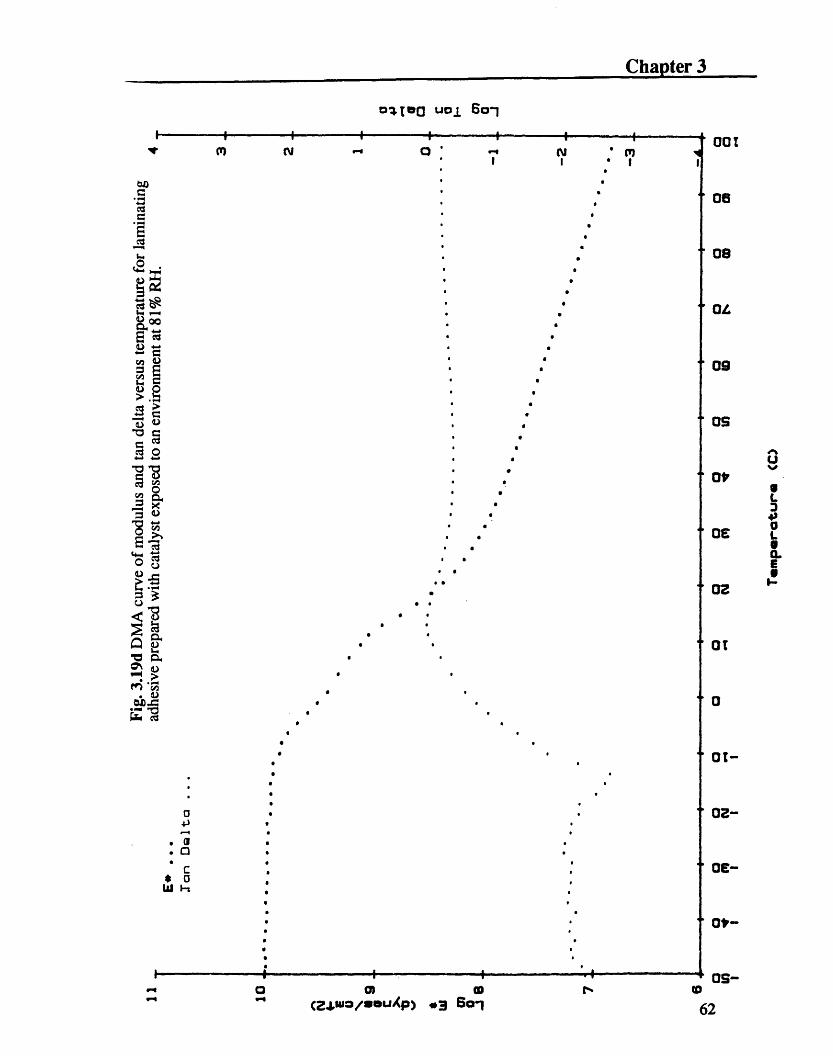
3.19d DMA curve of modulus and tan delta versus temperature forlaminating adhesive exposed to an environment at 81% RH .............................. 62
3.20 Schematic diagram of apparatus used for three point testing ................................ 63
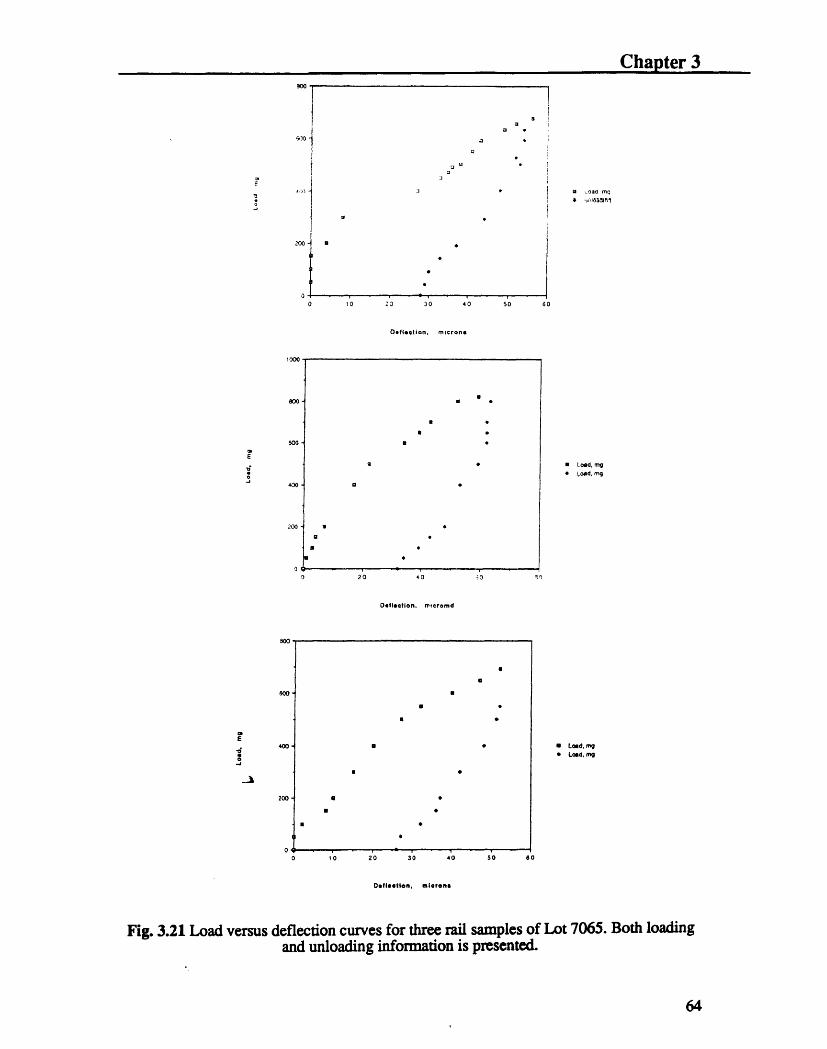
3.21 Load versus deflection curves for three rail samples of Lot 7065 ........................ 64
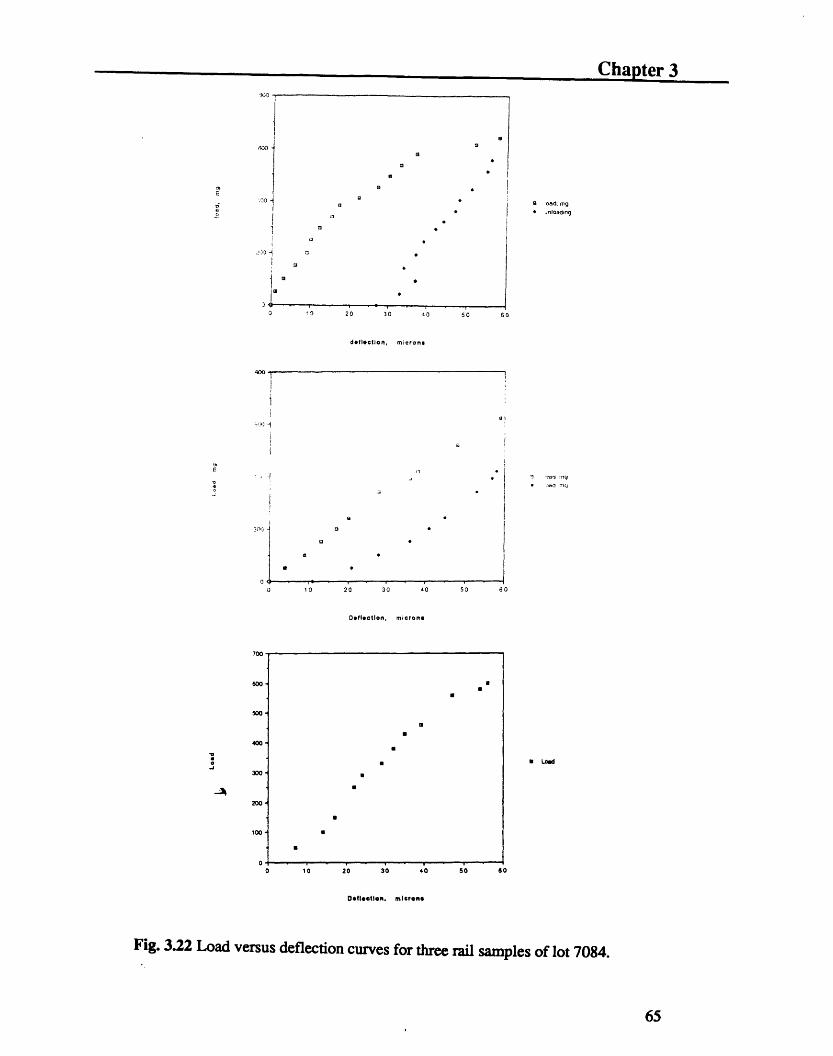
3.22 Load versus deflection curves for three rail samples of Lot 7084 ........................ 65
4.1 Schematic of seven layer redesign and three layer monobase redesign ............... 68
4.2 Relative leakage at three temperatures for film made usingcontrol and Candidate 2, 3, 9 rails .................................................. 72
4.3 Modulus versus Energy ar Break for monobase substrate candidates .................... 73
5.1 Schematic of Candidate 9 material morphology at different stagesin the forming process .................. ................................ 76
5.2 SEM micrograph of Candidate 9 cross-section .................................................. 77
5.3 Surface profile of Candidate 9 sample Side A #1 ................................................... 81
5.4 Surface histogram of Candidate 9 sample Side A #1 ........................................ 83
5.5 Surface profile of Candidate 9 sample Side A #2 .................................................. 85
5.6 Surface histogram of Candidate 9 sample Side A #2 .............................................. 87
5.7 Surface profile of Candidate 9 sample Side B #1 ...................................... ....... 89
5.8 Surface histogram of Candidate 9 sample Side B #1 .............................................. 91
5.9 Surface profile of Candidate 9 sample Side B #2 ................................................... 93
5.10 Surface histogram of Candidate 9 sample Side B #2 ............................................ 95
10

Chapter 1
1. INTRODUCTION
Along with the thermal imaging system Helios, the new Captiva instant camera is
considered crucial to the future profitability of Polaroid. Captiva, an auto focus, single
lens reflex instant camera, is the culmination of one of the most extensive market
research and development efforts in the company's history. It is designed to appeal to
current 35mm camera users by being smaller than previous instant models and
incorporating many of the automated exposure and focusing features associated with
cameras using conventional film.
Shortly after the Captiva camera's introduction in 1992, unexpected variability in the
performance of the filra side seals was encountered because of high stress levels imposed
on the film inside the camera. The basic configuration of the integral film used with the
Captiva camera is very similar to that used in the older Spectra line of cameras. However,
there is a major difference in the stresses imposed on the two types of film during
processing within the camera. Spectra film is not significantly strained as it is exposed
and ejected from the camera whereas the Captiva film sees significant shear and peeling
stresses as it is forced through a chute with a radius of curvature of 0.5" before it is
ejected. In a small percentage of frames, the shear and peeling stresses cause a failure in
the side of the film packet leading to reagent leakage.
1.1 Statement of Objectives
The ultimate goal of this work was to increase the yield and performance of Captiva
film by decreasing the probability of side seal leakage that takes place after the film is
forced through the chute in the camera. The work focused on increasing the energy
11

Chapter 1
absorption capabilities of the rail component to increase the overall performance of the
side seal in the product's operating temperature range.
This thesis can be viewed as part of a three faceted effort to improve the performance
of the Captiva film side seal. Parallel to the rail improvement efforts, other Polaroid
groups have focused on making mechanical design changes to the camera chute
configuration to reduce the stresses imposed on the film during deformation and changes
to the positive and negative sheets to improve their mechanical performance without
sacrificing photographic performance.
1.2 Project Approach
The approach used to improve the performance of the Captiva rail can be broken
down into four steps: 1. reevaluation of rail sub-components; 2. identification of
variability; 3. optimization of existing materials and 4. investigation of new material
systems. The starting point of the project was a technical assessment of the current rail
components. The sub-components of each layer in the rail structure were identified and
evaluated for their contributions to the mechanical and adhesive properties of the rail.
Next, the major sources of material variability were identified.
An optimization of existing rail materials was not undertaken because it was
concluded that the current seven layer rail structure was intrinsically non-robust from a
manufacturing stand-point and significant performance gains could not easily be achieved
through a strategy of incremental improvement of the existing rail design. Instead, the
project was redirected toward investigating new material systems which would more
adequately fulfill the Captiva film product requirements. A new rail redesign which
12

Chapter 1
incorporates less intrinsic material variability and is able to withstand higher stress levels
during processing, thereby improving overall film yield, was developed.
1.3 Financial Impact
Production trial data of the three layer rail redesign are documented and indicate
significantly improved performance over the standard seven layer rail. The performance
improvements of the redesign can be translated into several million dollars in annual
savings. The several million dollar estimate was calculated by considering the cost of
scrap and incremental labor attributed only to the side seal leakage defect. The
incremental labor figure consists of additional sampling/auditing, warehouse/inventory
handling, and technician costs. The calculations used to determine the annual savings
value, presented in Fig. 1.2, are stated only in general terms for proprietary reasons.
Fig. 1.2 General equations used in the calculation of annual savings fromelimination of side seal defect.
13
( annual production ) x ( % yield loss due to side seal leakage ) = # of unshippablepacks per year
( # of unshippable packs per year ) x ( manufacturing and ) = material and productionnot used for camera testing material cost per pack cost of defective packs
material and production + incremental labor cost = annual savings attributed tocost of defective packs attributed to side seal leakage elimination of side seal defect
(on the order ofseveral million dollars)
Chapter 1
1.4 Thesis Organization
Chapter 2 provides an overview of the basic structure of instant film and the
terminology associated with it as well as a general description of the product
requirements and manufacturing processes. Chapter 3 documents a technical assessment
of the rail and its subcomponents performed to identify sources of material and process
variability. The work in Chapter 3 serves as a basis for the redesign strategy presented in
Chapter 4. Chapter 4 summarizes the guidelines developed for a redesign of the rail and a
novel three layer rail structure is presented. Chapter 4 presents production trial data for
the three layer redesign which indicate performance gains that would translate into
several million dollars in annual savings for Captiva film production. Chapter 5 focuses
on the characterization of the primary substrate material used in the most successful
redesign to serve as an information base for the future development of relevant and
meaningful supplier specifications for the new design. Chapter 6 offers conclusions and
closing recommendations.
14

Chapter 2
2. BACKGROUND
2.1 Integral Instant Film Structure
Integral instant film provides a finished print several minutes after exposure using a
system that is outwardly dry. As opposed to peel-apart films, which are comprised of sheets that
are separated after processing, integral films remain intact, with exposure and viewing occurring
through the same surface. In general, the integral film structure consists of a sealed sandwich
with the negative and positive sheets as outer layers and a pod containing reagent attached
between them. During processing, the pod is ruptured and the reagent is spread as a thin layer
between the two main sheets.
fljno a4UI l I U)' CLLIUII
Film Frame
- Gap - Positive
Ra NegativeFig.2.2 Schematic of instant film structure and cross-section
The major photographic components of instant film are the positive (also known as the
sheet), the negative and the reagent. The major non-photographic components are the mask, the
rails, the pod tape, the jump tape, and the trap (see Fig. 2.1). The area where the positive, rails
and negative come together is referred to as the side seal (see Fig. 2.2).
The thickness of the reagent layer spread within the film is controlled by the thickness of
the mask layer and the thickness of two thin material components called rails. The white mask
15

Chapter 2
white mask layer, which is bonded over the clear positive sheet and frames the picture
area, affects the reagent thickness by contributing to the spacing of the rollers through
which the film is forced during processing within the camera (see Fig. 2.3). The thicker
the mask layer, the farther apart the camera rollers are maintained, the less the picture is
compresswte and the larger the gap remains between the layers. The rails, which are
bonded between the negative and positive sheets and along their edges also act as
mechanical spacers. In addition, the rails prevent reagent leakage through the edges of the
film. Once the viscosity of the reagent to be used for a run of film is characterized, the
reagent gap is set by using the appropriate thickness of rail and mask.
Mask
PositiveRailNegative
Plane of
Roller
bRoller
MaskPositive
Raill Gp Rail
Neqative
Cross-Section
(A) (B)Fig. 2.3 (A) Side view schematic of film between camera rollers (B) Cross-section
schematic of film between camera rollers.
2.2 Rail Structure
The rail component is a seven layer laminate structure made to total thicknesses
ranging from .00217" to .00297". The rails consist of a .00142" core of white polyester
sheet to which two layers of tissue paper are bonded using a polyester based laminating
adhesive to which carbon black and an isocyanate cross-linking agent are added. The
tissue layers range in thickness between .00025" to .00045" in .00005" increments and
are used to vary the total thickness of the rail. The outer surface of each tissue layer is
also coated with a layer of heat seal for adhesion either to the positive or negative sheet of
16
4L
....- ...-- ... -- - - - 0
�I�E�B�I� MWI~
Chapter 2
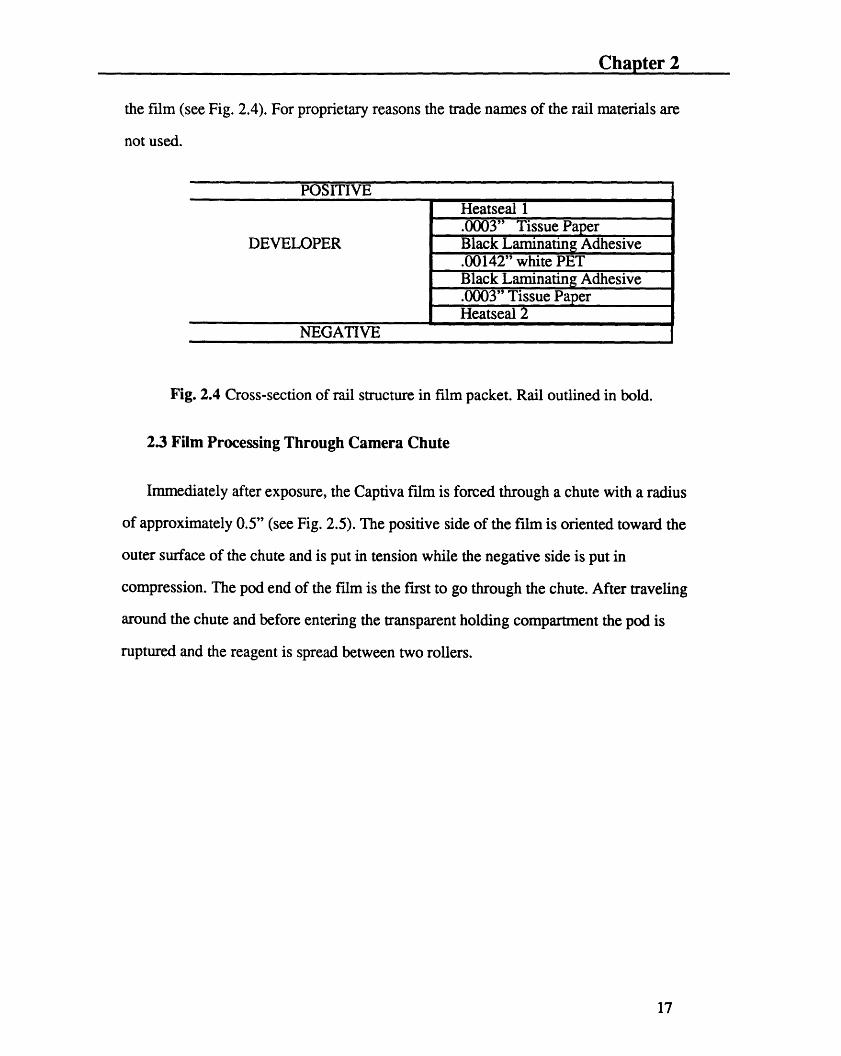
the film (see Fig. 2.4). For proprietary reasons the trade names of the rail materials are
not used.
POSITIVEHeatseal 1
.0003" Tissue PaperDEVELOPER Black Laminating Adhesive
.00142" white PETBlack Laminating Adhesive.0003" Tissue PaperHeatseal 2
NEGATIVE
Fig. 2.4 Cross-section of rail structure in film packet. Rail outlined in bold.
2.3 Film Processing Through Camera Chute
Immediately after exposure, the Captiva film is forced through a chute with a radius
of approximately 0.5" (see Fig. 2.5). The positive side of the film is oriented toward the
outer surface of the chute and is put in tension while the negative side is put in
compression. The pod end of the film is the first to go through the chute. After traveling
around the chute and before entering the transparent holding compartment the pod is
ruptured and the reagent is spread between two rollers.
17

Chapter 2
Film
Positive Siin Tension
Fig. 2.5 Film path through chute.
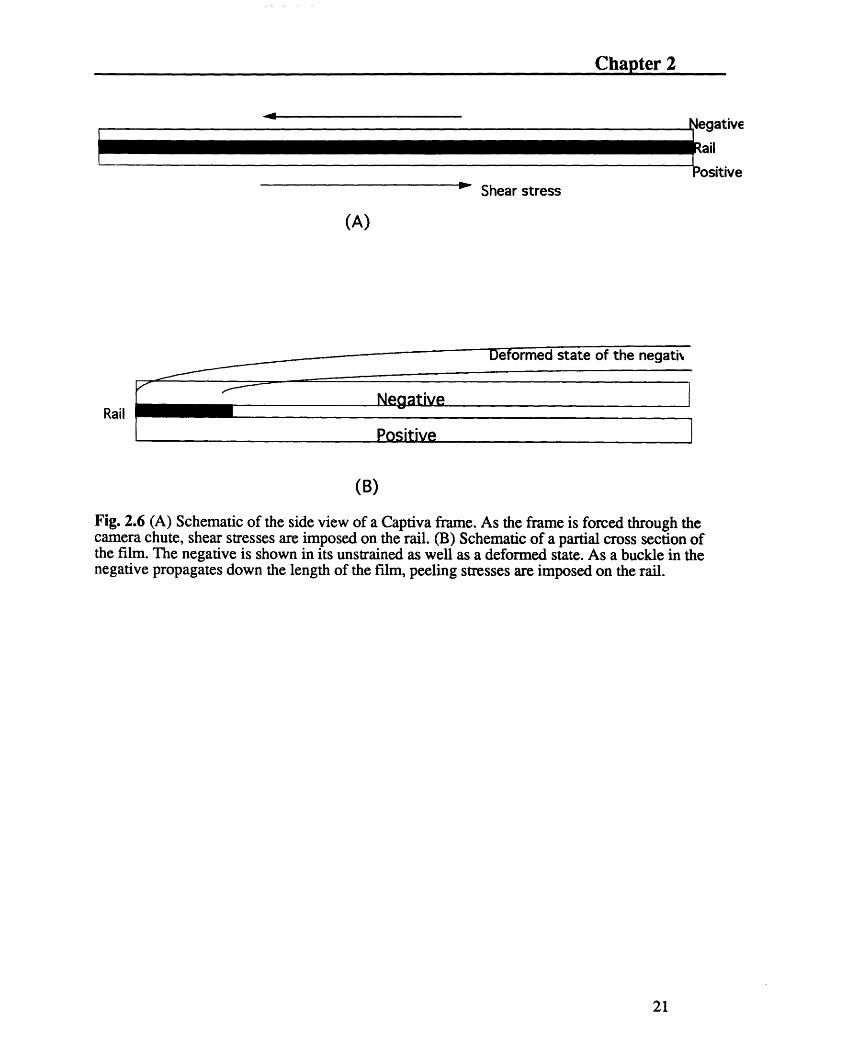
The rail is subjected to both shear and peeling stresses as it is forced through the
chute. The positive sheet is deformed to a slightly larger radius than the negative and the
mismatch imposes a shear force on the rail which is sandwiched in between (see Fig. 2.6).
The peeling stresses are imposed by a wave that builds up and propagates from the pod
end to the trap end where it reaches its maximum. The peeling stresses do not occur
normal to the edge of the film. Most of the failures in the side seal occur near the trap end
where the wave reaches its maximum amplitude.
It is interesting to note that there is a propensity for failure to occur in the frames
which are the first ones to be used from the frame pack. The geometry that the frames are
stressed to during storage in the film cartridge depends on their position from the top. The
film cartridge that holds the unexposed film frames in the camera is not symmetrical in
geometry. It is skewed to one side so that the top frames are held horizontally while the
bottom frames are held with a curve to one side. It follows intuition that the bottom
frames are prestrained to a slight curvature and therefore are not as severely stressed
18
Chapter 2
when they are forced through the chute whereas the top frames remain straight and do not
have any curvature fixed into them and fail because they undergo more stress in the
chute.
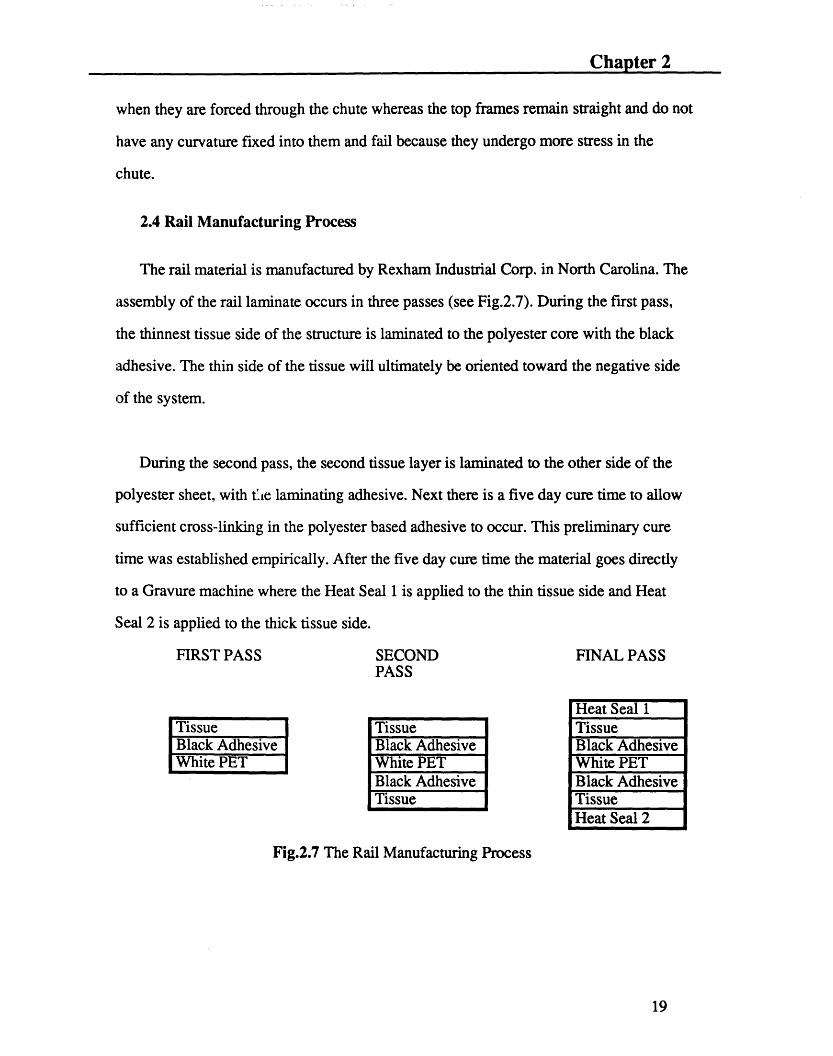
2.4 Rail Manufacturing Process
The rail material is manufactured by Rexham Industrial Corp. in North Carolina. The
assembly of the rail laminate occurs in three passes (see Fig.2.7). During the first pass,
the thinnest tissue side of the structure is laminated to the polyester core with the black
adhesive. The thin side of the tissue will ultimately be oriented toward the negative side
of the system.
During the second pass, the second tissue layer is laminated to the other side of the
polyester sheet, with tle laminating adhesive. Next there is a five day cure time to allow
sufficient cross-linking in the polyester based adhesive to occur. This preliminary cure
time was established empirically. After the five day cure time the material goes directly
to a Gravure machine where the Heat Seal 1 is applied to the thin tissue side and Heat
Seal 2 is applied to the thick tissue side.
FIRST PASS SECOND FINAL PASSPASS
TissueBlack AdhesiveWhite PET
Tissue TissueHeat Seal 2
Fig.2.7 The Rail Manufacturing Process
19
TissueBlack AdhesiveWhite PETBlack Adhesive
Heat Seal 1TissueBlack AdhesiveWhite PETBlack Adhesive

Chapter 2
11--4
Chapter 2
Negative
ail
Positive- Shear stress
(A)
Rail
(B)
Fig. 2.6 (A) Schematic of the side view of a Captiva frame. As the frame is forced through thecamera chute, shear stresses are imposed on the rail. (B) Schematic of a partial cross section ofthe film. The negative is shown in its unstrained as well as a deformed state. As a buckle in thenegative propagates down the length of the film, peeling stresses are imposed on the rail.
21

Chapter 2
22

Chapter 3
3. TECHNICAL ASSESSMENT OF THE RAIL
A technical assessment of the standard seven layer laminate rail structure was
conducted to gain a fundamental understanding of the failure mechanisms and sources of
material and process variability contributing to the final performance of the side seal.
A characterization of the rail component's internal appearance using scanning electron
microscopy was the starting point for investigating material and process variability. Rail
samples, from lots representative of the extremes of rail quality as established by
assembled film leakage levels, were examined in cross-section after surface cutting with a
microtome to produce a smooth surface. The sample size that the micrographs
represented was small, .5" samples were taken from initial rail web widths of 39" and
web lengths of 5,000 to 10,000 feet. Therefore, the micrographs were not used to
quantitatively characterize the rail lots but rather were used as an aid to determine areas
for investigation that would lead to the reduction of material variability.
3.1 SEM Sample Preparation
A .5" x .4" piece of rail material to be studied was put between two pieces of clear
plastic of the same size for structural support during cutting. The plastic and rail
sandwich was then put into a sample vice holder and mounted in a Sorvall MT-2 Porter-
Blum microtome. At a speed setting of .63 the surface was cut with a glass blade in -30
micron steps until the excess plastic was cut off. Once the face was roughly even, a fresh
glass knife was inserted and the cutting proceeded in 3 micron steps. The final cuts were
done in 1 micron increments. The quality of the glass blades and the depth of the cuts
largely determined the final quality of the surface. The quality of the cut could be
23

Chapter 3
determined by the amount of distortion in the plastic. Smearing, streaking, rippling or
opaqueness of the plastic material indicated a poor cut. If the surface of the material did
not show any streaks and was smooth with a generally uniform thickness overall the cut
was considered acceptable. At least three fresh glass knives were used in preparing each
sample. After microtoming, the rail samples were coated with gold and palladium.
3.2 Microscope Settings
An accelerating voltage of 2 kV was found to be optimal for detailed micrographs of
the rail cross-sections. Higher voltages resulted in unclear and uninformative
micrographs. The probe current setting was 5. A Joel JSM-6300F Field Emission
Scanning Electron microscope was used. The sample preparation procedure and
microscope settings were determined by Ralph Burpee.
3.3 Baseline Appearance of Rail
After the examination of multiple samples, a model of the expected appearance of the
rails in cross-section was developed as a baseline of information from which to identify
material defects and variation.
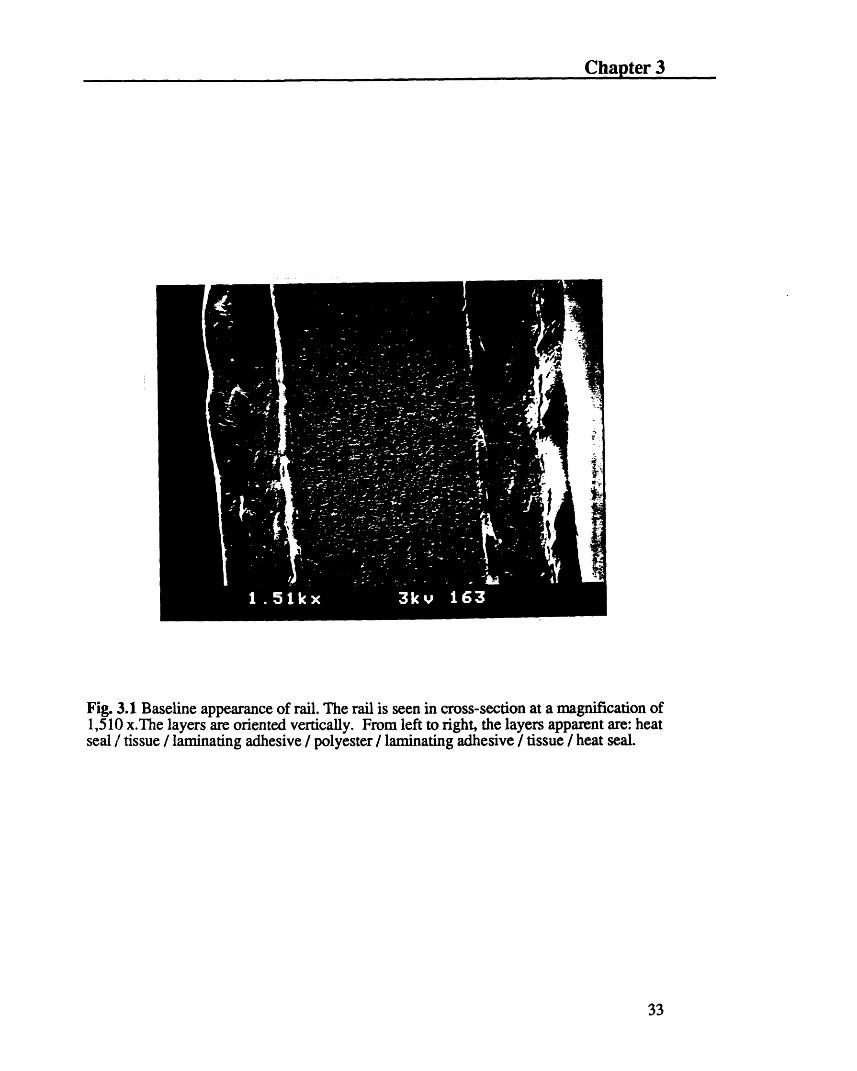
The rail micrographs indicated a polyester core layer that was consistently uniform in
thickness (see Fig. 3.1). The polyester core had a grainy surface texture with small pores.
The laminating adhesive layers and the heat seal layers were characterized by smooth
surfaces but varied more widely in thickness than the polyester layer. In the majority of
the samples the tissue seemed to be porous. However, the porosity of the tissue layers
varied between lots. It ranged from porous to dense (see Fig. 3.2). The thickness of the
tissue also varied, in some areas by 2 times the specified thickness. There where also
discontinuities in the tissue layer were the laminating adhesive came in contact with the
heat seal layers. The variation of the tissue layer was considered to be intrinsic to the
24
Chapter 3
paper material and the paper making process and was considered to be characteristic of
all rail lots.
3.4 Variability Identified in Micrographs
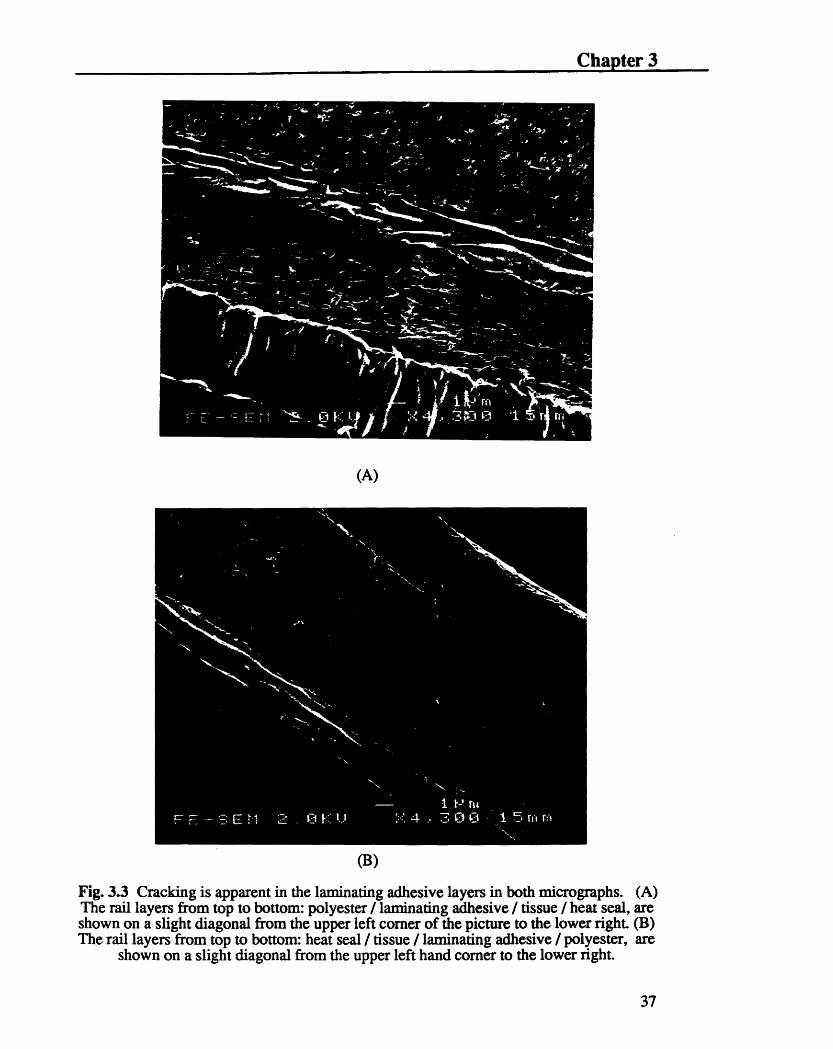
The microscopy work done on the rail material indicated variation in the adhesive
layer between the polyester core and the tissue layers. In the majority of the rail material
the layer appeared uniform. However, in several lots the layer appeared cracked (see Fig.
3.3-3.4). Even though there is a possibility that the cracks were caused by the cutting
action of the microtome, the cracking seems to indicate a real difference between lots of
material because cracking was not apparent in all of the samples that were polished
similarly.
Variability at the interfaces between layers was observed in the majority of the
micrographs. Voids and areas were the laminating adhesive layer was missing were
common (see Fig. 3.5). Voids in the tissue layer which caused laminating adhesive to
come in contact with a heat seal layer were also observed (see Fig. 3.6).
3.5 Assembled Frames: Side Seal Cross-Sections
Fully assembled frames were also studied using the sample preparation techniques
described in sections 3.1 and 3.2. Photomicrographs were taken of the frame side seals
(the area where the positive, negative and rail come in contact). It was possible to identify
the mask, positive, rail, negative dye, and negative base layers (see Fig. 3.7).
3.6 Assembled Frames: Deformation of Side Seal
A series of experiments was conducted in an attempt to identify the failure
mechanisms of the side seal components during deformation through the camera chute. A
3/4" x 1/8" piece of frame was polished to expose the side seal cross-section. The
25

Chapter 3
sample's outer non-polished edges were then dipped in fast drying epoxy and sealed.
After the epoxy had dried the sample was placed in the center slit of an SEM sample
holding stud into which a 5/8" diameter hole had been machined slightly off center.
Using the sample holder's small side screw which is typically used only to secure the
sample, the polished cross-section was forced from the side into the gap created by the
drilled hole into a semi-circle. This type of deformation paralleled only the shear stresses
imposed in the film during deformation in the camera, not the peeling stresses.
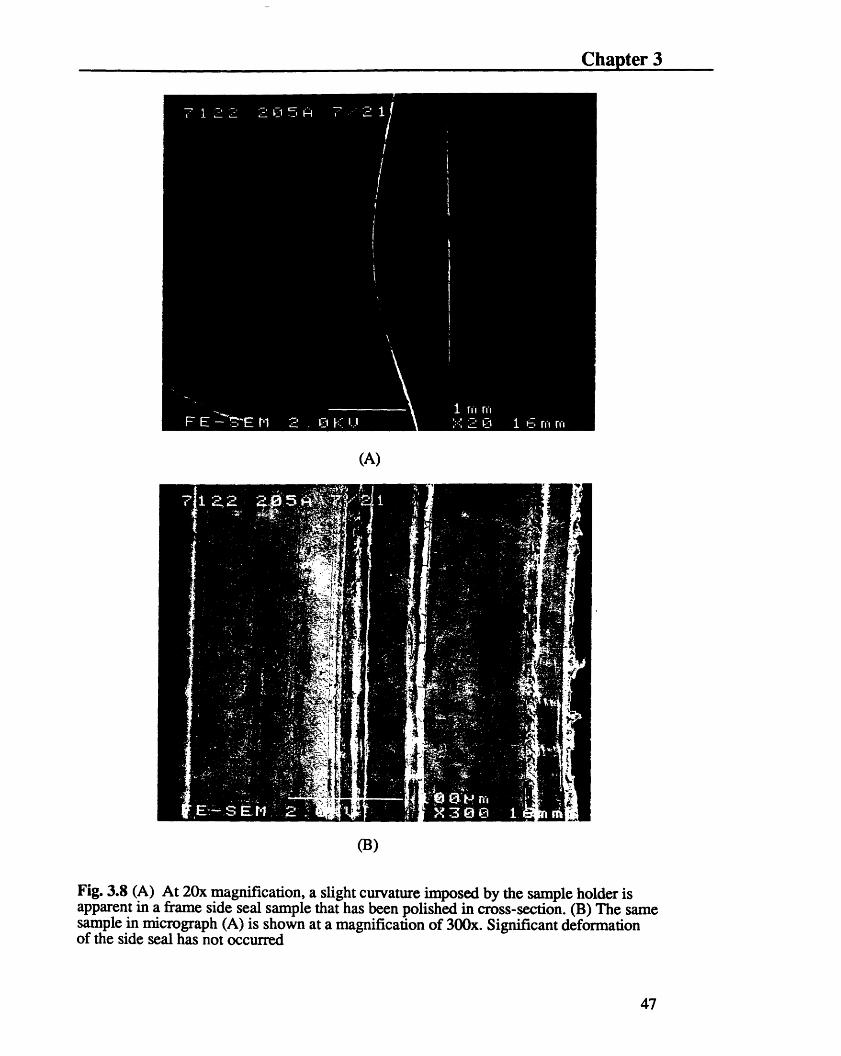
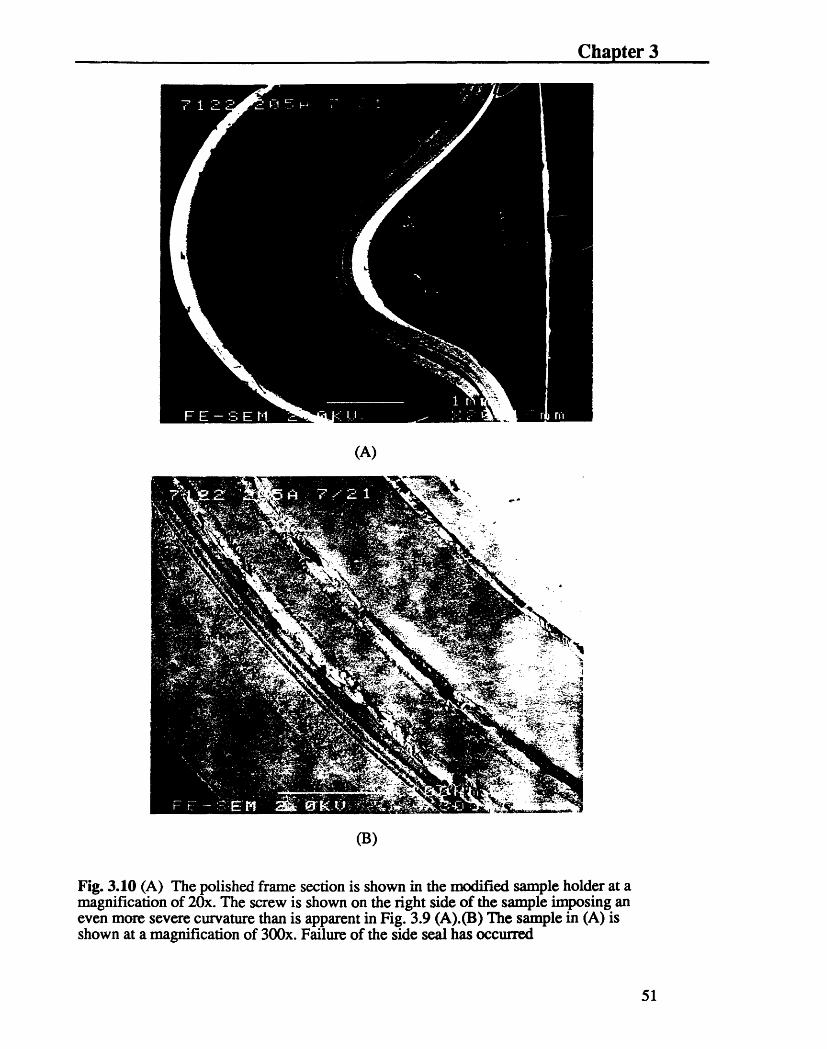
A series of photomicrographs were taken along the entire surface of the cross-section
at four different intervals during the deformation (see Fig. 3.8 - 3.10). From this series of
micrographs it is possible to observe the progression of failure in the sample. However, it
is not possible to pin-point the exact defect that initiated ultimate failure which is likely to
have originated deeper in the sample and not on the surface.
3.7 Assembled Frames: Peeling Stress Deformation
To study the effect that peeling stresses have on the frames, samples of side seal were
prepared so that the polished surface included positive and negative sheet beyond their
area of contact with the rail. The negative and positive were then forced apart using a
wedge of plastic (see Fig. 3.11). Failure appeared to occur along the heat seal layer while
the tissue layer appeared to remain mostly intact.
3.8 SEM Findings - Summary
The SEM micrographs provided significantly more information than the
previous optical microscopy work that had been done on the structure. It was possible to
26
Chapter 3
establish a baseline of information about the characteristic appearance and properties of
the major rail sub-components. This work led to several preliminary findings:
1. Cracks in the adhesive layer, between the tissue and polyester,
are roughly correlated with poor side seal performance.
2. The interfaces between layers are highly variable. Different
levels of voids and non-uniformities were observed.
3. The tissue layer is highly variable in thickness, uniformity,
adhesive penetration and density.
3.9 Dynamic Mechanical Analysis
The variation in appearance of the laminating adhesive layers between different lots
of rail prompted an in estigation of the mechanical properties of the adhesive layers in
the material. Dynamic Mechanical Analysis was used to characterize the modulus of
various rail components as a function of temperature.
Polymers are viscoelastic materials which have characteristics of both viscous liquids
and elastic solids. Elastic materials have the capacity to store mechanical energy without
dissipating any energy while viscous fluids have the capacity for dissipating energy but
none for storing it. Therefore when polymeric materials are deformed part of the energy
is stored as potential energy and part is dissipated as heat.
Typically, a material undergoes a several order of magnitude transition in modulus
from a high level and brittle/elastic behavior at low temperatures to a low level and
rubbery/viscous behavior at high temperatures. The typical behavior of modulus versus
temperature for a polymeric material is shown in Fig. 3.12.
27

Chapter 3
To determine the mechanical properties of a material as a function of temperature
Dynamic Mechanical Analysis (DMA) was used. DMA is a vibrational method that
measures the response (deformation) of a material to periodic forces.
In the case of sinusoidal excitation and response the applied force and the resultinit
deformation both vary sinusoidally with time. For linear viscoelastic behavior the strain
will alternate sinusoidally but will be out of phase with the stress. This phase lag results
from the time necessary for molecular rearrangements and is associated with relaxation
phenomena.
During DMA analysis the specimen is subjected to an alternating strain and the stress
is measured simultaneously. The stress and strain can be expressed as follows:
a= 8 sin(ot + 6)E = Eosin ot
where w is angular frequency and S is the phase angle.
Then a = a o sin olrcos S + a o cos r sin S. The stress can be considered to consist of
two components, one in phase with the strain ( aocos6) and the other 90' out of phase
( aosin 6). When these are divided by the strain, the modulus can be separated into an in-
phase (real) and out-of-phase (imaginary) component. These relationships are
a = EoE' sin wt + EoE"cos ot ,
E'=-cos6 and E"=Csin ,Eo Eo
where E' is the real part of the modulus, and E" the imaginary part. The complex
representation for the modulus as shown in Fig. 3.13 can be expressed as follows:
e = eoexpiot
a = aoexpi(wt + ) .
28

Chapter 3
Then
a = E* = ae = = (cos6 +isin6)E Eo Eo
E* = E' +iE"
3.10 DMA Results
A Rheovibron DMA was used to scan samples of the two heat seals as well as the
laminating adhesive from -50 C to 100 C at a frequency of 1 Hz (see Fig. 3.14 - 3.16).
The optimal place for the rail component's transitions to occur would be at low
temperatures outside of the product assembly and operating range. If this was the case,
the mechanical behavior of the components would be rubbery and approximately stable
in operating temperature changes. However, it was found that the transition from brittle to
rubbery behavior in the laminating adhesives and heat seals occurred near room
temperature. Therefore, it is predicted that order of magnitude changes in the modulus of
the adhesives and heat seals occurs within small temperature changes in the product
operating range.
In an attempt to identify other adhesives that would be more mechanically stable in
the operating range of the product and would be suitable substitutes for the laminating
adhesive, two urethane adhesives were analyzed. It was found that these adhesives did
not have a more desirable DMA curve that the standard laminating adhesive (see Fig.
3.17 - 3.18). The glass transition temperatures of the two urethane adhesives were not
farther from room temperature than the standard laminating adhesive nor were their
moduli any lower in the operating temperature range.
Experiments were conducted to investigate the effects of humidity on the mechanical
properties of the laminating adhesive. This was done in an attempt to determine the role
29

Chapter 3
that exposure to moisture during lamination plays in determining the effective amount of
cross-linking of the highly moisture sensitive catalyst that is added to the adhesive. It was
thought that varying levels of catalyst in the adhesive might contribute to the sometimes
cracked appearance of the layer as observed in the photomicrographs.
Different amounts of the isocyanate catalyst were exposed to 20% RH, 45% RH, 65%
RH, 81% RH for time varying from one to eight hours. The catalyst material used in the
experiments was acquired directly from the manufacturer. Its history of exposure to
moisture was identical to that of the material received by Rexham and before use in their
manufacturing process. After humidity exposure, the samples of catalyst were transferred
to a dry box and mixed with a corresponding amount of polyester resin in a 0% RH
environment. A one week cure at room temperature was also conducted a zero humidity.
After the one week cure the adhesive samples were characterized using Dynamic
Mechanical Analysis.
There was not a significant difference in the DMA profiles of the different samples
nor were there any clear trends in mechanical behavior as a function of exposure to
different levels of humidity (see Fig. 3.19a-d). The glass transition temperatures and
rubbery and brittle moduli of the samples did not show either an increasing or decreasing
trend.
3.11 Three-Point Bend Testing
Three Point bend tests were conducted on the rail material to measure force versus
deflection. It was initially thought that it would be possible to detect internal failures,
possibly in the tissue layer, as the load was increased giving the curves a saw toothed
shape. Instead, the large part of the information that was gathered indicates that
characteristically good material is less stiff than the bad material.
30

Chapter 3
The apparatus that the three point bend tests were performed on was initially
developed to measure the axial compressive and transverse tensile properties of single
polymer fibers.1 With the apparatus it is possible to measure the deflection of a sample
caused by a load of dead weights (see Fig. 3.20). The sample sits on a stage that also acts
as the two stationary points in the tests. A hooked probe attached to a gas bearing
supported movable grip is used to apply a load in the center of the specimen as weights
are added to the basket. The movable grip is attached to a cable which also runs over a
gas bearing ending in a holder for the dead weights. For the approximation of linear
behavior to hold, the deflections are kept small, on the order of 60 microns. An optical
microscope was used to measure the deflections.
3.11.1 Sample Preparation
Two lots of rail were studied using the three point bending technique; lot 7084 and lot
7065. Lot 7084 was considered a very high quality lot resulting in zero side seal leakage
after assembly whereas lot 7065 was considered to be of very poor quality resulting in
high leakage levels after assembly. Samples of each rail were prepared to a thickness of
50 microns using a LKB Bromma 2218 microtome. The wooden end of a cotton swab
was used to gather the rail slivers in a sample holder between passes of the microtome
arm.
3.11.2 3PT Results
Curves documenting deflection versus load during loading and unloading are
presented in figures 3.21 and 3.22. The samples of lot 7084 required a load of 600 mg. to
reach a deflection of 60 microns whereas the samples of lot 7065 required a load of 750-
1McGarry, FJ. and J.. Moalli. Mechanical Behaviour of Rigid Rod Polymer Fibres: Measurement of AxialCompressive and Transverse Properties. Polymer. Vol. 32, No. 10, 1991.
31
Chapter 3
800 mg. to reach the same deflection. This data supports the hypothesis that stiff material
is undesirable for the Captiva side seal application.
3.12 Crack Initiation
The force required to initiate failure due to peeling in a layer of the rail was studied.
The apparatus described in section 3.10 was modified for crack force initiation
measurements. The hooked probe and the stage were replaced with micro alligator clips.
The fixed clip was attached to the polyester core and the movable clip was attached to the
tissue layer. The edge cuts of rail were used in the experiments. In the rail manufacturing
process a small width of the rail edges remain uncoated with black laminating adhesive.
This provided an area of unlaminated tissue and polyester core for the attachment of the
grips. Several attempts were made to peel the tissue layer away from the polyester core
but in each case the tissue ripped and the attempts were unsuccessful.
3.13 Areas Targeted for Material Variability Reduction and Optimization of theCurrent Rail Structure
Work is currently being done to reduce material variability in the heat seal and
laminating adhesive layers. An effort has been initiated with the suppliers of the heat
seals to modify their products in such a way that the transition in modulus is shifted to a
temperature below the operating range of the product while maintaining the required
adhesive and laminating properties.
32
Chapter 3
Fig. 3.1 Baseline appearance of rail. The rail is seen in cross-section at a magnification of1,510 x.The layers are oriented vertically. From left to right, the layers apparent are: heatseal / tissue / laminating adhesive / polyester / laminating adhesive / tissue / heat seal.
33

Chapter 3
34

Chapter 3
7 4> ' Y plt A . - i . .: .1y
_, A -- s t I''- ,/.
W - b - - U I ,
r: ' . . ' -,A,-.; <i Ho .;..:,. .- ....- (^)4, ·
,~~~~~ry
(B)
Fig. 3.2 Two micrographs are shown to contrast the different levels of porosity observedin the tissue layer. In both the micrographs the layers are oriented horizontally. Completecross-sections are not shown. From top to bottom the layers shown are: heat seal / tissue /laminating adhesive / polyester. Only the top section of the polyester is shown. A dense
tissue layer is apparent in micrograph (A) and a more porous one is apparent in (B).
35

Chapter 3
36
Chapter 3
(A)
(B)
Fig. 3.3 Cracking is apparent in the laminating adhesive layers in both micrographs. (A)The rail layers from top to bottom: polyester / laminating adhesive / tissue / heat seal, areshown on a slight diagonal from the upper left corner of the picture to the lower right. (B)The rail layers from top to bottom: heat seal / tissue / laminating adhesive / polyester, are
shown on a slight diagonal from the upper left hand corner to the lower right.
37

I Chapter 3
38

Chapter 3
Fig. 3.4 Cracking is apparent in the laminating adhesive layer. From top to bottom therail layers shown are: heat seal / tissue / laminating adhesive / polyester, are shown on a
slight diagonal from the upper left hand corner to the lower right.
39

Chapter 3
40
----u -' I -· --- I I

Chapter 3
(A)
(B)
Fig. 35 Voids are apparent in the laminating adhesive layers in both micrographs. (A) Acomplete cross-section of the rail is shown with the layers oriented horizontally. (B) Onlya partial cross-section of the rail is shown in a vertical orientation. From left to right the
layers are: polyester / laminating adhesive / tissue / heat seal.
41

Chapter 3
42

Chapter 3
Fig. 3.5 (C) Another example of voids in the laminating adhesive layer. The horizontallyoriented rail layers shown from top to bottom are: heat seal/tissue/laminating adhesive/PE
Fig. 3.6 A discontinuity in the left-most tissue layer has caused the heat seal layer tocome in contact with the laminating adhesive layer. The vertically oriented rail layers,from left to right are: heat seal/tissue/laminating adhesive/polyester/laminating adhesive /tissue/heat seal.
43

Chapter 3
44

Chapter 3
Fig. 3.7 Cross-section of the side seal of a fully assembled frame. The layers are orientedvertically beginning with the negative on the left-side. The mask, positive, rail, negative
dye, and negative base layers are apparent.
45

Chapter 3
46
Chapter 3
(A)
(B)
Fig. 3.8 (A) At 20x magnification, a slight curvature imposed by the sample holder isapparent in a frame side seal sample that has been polished in cross-section. (B) The samesample in micrograph (A) is shown at a magnification of 300x. Significant deformationof the side seal has not occurred
47

Chapter 3
48

Chapter 3
(A)
(B)
Fig. 3.9 (A) The polished frame section is shown in the modified sample holder at amagnification of 20x. The screw is shown on the right side of the sample imposing aslightly more severe curvature than is apparent in Fig. 3.8 (A).(B) The sample in (A) isshown at a magnification of 300x. Some deformation of the side seal is apparent.
49

Chapter 3
50
Chapter 3
(A)
(B)
Fig. 3.10 (A) The polished frame section is shown in the modified sample holder at amagnification of 20x. The screw is shown on the right side of the sample imposing aneven more severe curvature than is apparent in Fig. 3.9 (A).(B) The sample in (A) isshown at a magnification of 300x. Failure of the side seal has occurred
51
Chapter 3
'g
-o t= .=
o o
4-4
9 a) 0k
a ) C
' _ c- .
c, _ . o'Q
52

Chapter 3
MOdU1US
Temperature
Fig. 3.12 The typical behavior of modulus versus temperature for a polymeric material.
-z 3az a:
C) n(f)ZU1c
0-
70
-t
I7/
Fig. 3.13 Relations between various parameters used to express the results of a dynamicmechanical measurement.
53
tr
t

Chapter 3
06
0e
OGI
09
OS
as
L0
a
fL
E0
I-O0
O
01-
OE-
I I
.0 0-4 cz,4,Wo/wouIP)
I0
0U)0
CU
.E0cn
3
en
Q):1
CZ
EQ)
._
C)
o
-4 Ca
3 601
54
p

Chapter 3
00ot
05
08
OL.
09
aS
tLg
OE L
r
0CZ-
I t
O E-
0tr-
I j, aI (24wCZ~o/wou4p)
4
4.,ct'I
0
eU0
In._
;To
A
t.
aJ
E c X
-oF- cr: .
.
0*Or1
3 Sar-
OS-
55
-
6. I
r
I I I
I
.
I1
I
A
I,- I
0 wI .
[- c
oe.
0
¢ D/BU )_.S CZ&u=/wuIp)
Chapter 3
lzaUCA
0
CIO
C-
:3uU
00U0f=1ltn90·d
Q
11W2en
Ot
06
a08
OL
09
Os
oa
at01
at-
02-
OE-
nc-!'.9 V
3 5onl
56
0
I1
6
m&li
P

Chapter 3
DoXTea uo1
OSt
Ott
0E;!
OZI
Ott
00T
06
08
09 o
L00
0.a
Ot
0
Ot-
at-
Os-0 a" (U.,WO/wwuXp)
U*3 Boj1
57
C', N
601
a 4
IN I
0
a
0
S
0O
4u
I.44)
00
l)
f;i
0
S
a-4
'-I
· a3
C
Wo
'4
r r & i I
r 1 ·
I
I
I
.
I
i
Chapter 3
Dotsa uol 60o
N ',,
0)U
0
'I
C I
IS
0
I0
* S
a
..
I
-0
o S
E
00 0o:
CR) O I>
.
0.,<g1
"0 0)0" (2 &WO/wwuAp
4. C I(v)I
Ot1
06
O8
Ot
09
Os09
U
L4)a
O
I-
at
O
OZ-
0O-
a4-'
C
W,W t
03 60-a
58
r __
- - -
-,q
0
II
I
II
II
III
IIII
OS-

Chapter 3
0o4t0 U1 60o
6*
00o
06
08
OZ
09
OS
. U
a0t uIat L
).0
* at- OOZ
OI-
*08-
0t-
nc_i i a a6..l
0(¢gjtmlmmeu,<p
0.03 Ba'1
Cq NU 0*4 q NI
II
C:Ur-
M
0 .
0.N
UBm3e v
*Q
§n a
;00W~
a~
C4 Q0 .
·
0
.ci.0
C *
,-U..
to
59
I I 1
I
I
I
d
II
f
a
a
r

Chapter 3
os L U01 60o
N !
.
(3
· 4
* 0I. 3
C S~~~~~~~~
p" cZ.LW/wwuuP)
I N)IJ
aSS
S
S
S
S
S
S
..
cl
c~elT
:. W)
s "Icd
am:3W
:39
§ * -
IZ2 10* Bm
.aC0
= 0wc 5's 41
oC0
06
08
oL
09
Os
U
0OttOE L
E
__ 1F
Ot
'0
Ct-
0oz-
.e-
0t-
3 60'1
Os-to
60
_ --- --
II . I_
. I
0
ar
r
r
r
r
r
r
r
t
r
r
r
r
r
I
.
.
.
r
r
r
r
P.
Chapter 3
ole Uo1 6olI I I
'-4 C3 I-
ItUI
II
0
a
S
S
0
S
S0S
S
S
S
Sa
al)
03 60-1
I
C N I
ME:
· 3
cr3
'E�VI\Oa ,
Ed
rn1
Br/Jb B�4e
9-·�a3·1ocn a3X
Q)
t;cwE
Oo
·fi
ao
ccj '5�
ah.I
OOT
0O
08
08
09
Os
U_
GE L0) L
EaU-
O
OE-
Or-
Os-
a a
. o0
W .
v'
I ,, ! - - ,0 CD' (¢ 4wz/9wuAp)
061
! * @· I
ii
0
e
. .
I
r~
Chapter 3
oTeo uo 6o1
00
06
08
09
* OSOS
U
.O
0.L
O a
O
ot-
'4 CZJ,IIo /3seU 4)0
*3 Bo-I 62
C') N 64 0I
NI ° I6()
St
4-.
.I 0w
Cg_ _
S
tI0
t
4
II
e
4..
. (.DC
I 3
-
- 1 ---. L
·· I· ·r· r· r
_- _I-_
F
I
I
I
1
.
a 0
.
6
9
e
II
$
· II~I .fN.-

Chapter 3
Grin -unntwAd hv Gas. Reint
Nlurgen Feed
Uey supported by Gasanng (Bearing No Shown)
Microscope Base
Fig. 3.20 Schematic diagram of device used for three point bend testing.
63
Chapter 3
0r -0 .l 020 30 40 50
Load mqS 6i6laClInI
60
De.le.tion, micron
20 40 d
· Load. mng* Load, mg
Deflection., mcromd
0 10 20 30 40 50
* Loa, mg* Lod, mg
80
Dollction, microns
Fig. 3.21 Load versus deflection curves for three rail samples of Lot 7065. Both loadingand unloading information is presented
64
6o0-
ZO-
0
800*
600
E-aII
* S
aB ·
* ·a ·*~~~~~~
4OO-
200 -
0
800
2
o
I-.
400
U :
* S
* a
U a
a X
a 0
200
I ooo
800
o I . . .. . . . . . .
i
-i
.
iu3
O
I
deflltIlon, microns
-7
i~
10 20 30 40 50 60
DOtI.cton, microns
600.
500
400
300
200
100
· Load
0 10 20 30 40 50 60
Defletlon. microes
Fig. 3.22 Load versus deflection curves for three rail samples of lot 7084.
65
Chapter 3
0ar, mg
* Jnloadlng
iI
0- 0
a
a
a
U~~~~~~
qYoo
. .~ ...... ,, .,, . ·
700
. . . . . . .

Chapter 4
66
Chapter 4
4. RAIL REDESIGN
The technical assessment of the standard seven layer laminate rail identified sources
of material variability and provided a strategy for incremental improvement. However, it
was concluded that the seven layer structure was intrinsically non-robust from a
manufacturing stand-point and significant performance gains could not be easily achieved
through a strategy of incremental improvement of the existing rail design. Instead, the
project was redirected toward achieving a redesign of the standard rail which would more
adequately fulfill the Captiva film product requirements. The goal of the redesign was a
rail which would incorporate less intrinsic material variability and would be able to
withstand higher stress levels during processing and thereby improve overall film yield.
4.1 Design Guidelines
The insights gained in the preliminary assessment of the standard rail led to the
development of the following guidelines for the redesign to the rail component:
1. The total number of material sub-components should be reduced to eliminate
processing defects at material interfaces.
2. Non-synthetic material sub-components, such as the tissue, should be replaced
with synthetic and less variable materials or should be eliminated altogether.
3. The new rail should have a lower modulus, lower yield stress and higher toughness
than the existing structure to enable more energy absorption before failure.
67
Chapter 4
4. The new design must also fulfill all existing product requirements such as
dimensional stability at assembly laminating temperatures, resistance to reagent, and
compatibility with the negative and positive side heat seals.
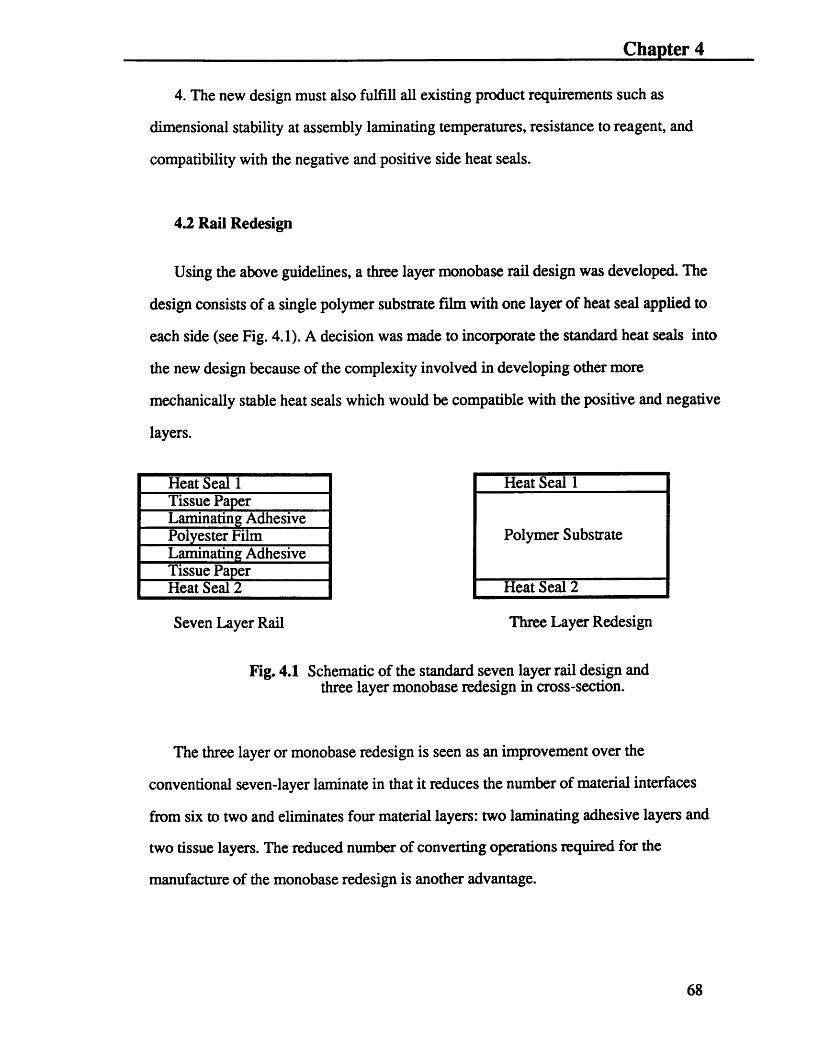
4.2 Rail Redesign
Using the above guidelines, a three layer monobase rail design was developed. The
design consists of a single polymer substrate film with one layer of heat seal applied to
each side (see Fig. 4.1). A decision was made to incorporate the standard heat seals into
the new design because of the complexity involved in developing other more
mechanically stable heat seals which would be compatible with the positive and negative
layers.
Heat Seal 1Tissue PaperLaminating AdhesivePolyester FilmLaminating AdhesiveTissue PaperHeat Seal 2
Heat Seal 1
Polymer Substrate
Heat Seal 2
Seven Layer Rail Three Layer Redesign
Fig. 4.1 Schematic of the standard seven layer rail design andthree layer monobase redesign in cross-section.
The three layer or monobase redesign is seen as an improvement over the
conventional seven-layer laminate in that it reduces the number of material interfaces
from six to two and eliminates four material layers: two laminating adhesive layers and
two tissue layers. The reduced number of converting operations required for the
manufacture of the monobase redesign is another advantage.
68

Chapter 4
4.3 Polymer Substrate Screening
Nine materials were initially identified as potential candidates for the substrate inner
layer of the monobase design by fulfilling the following criteria:
1. resistance to alkali for compatibility with the developer
2. dimensional stability at 180 C (laminating temperature)
3. low modulus and high toughness relative to the current rail
4. availability in film form
5. resistance to MEK for compatibility with the heat seals
The candidates and selected material properties are listed below in Table 4.1. The
commercial names of the candidate materials are not listed for proprietary reasons.
TEST MODULUS Yld. %LABEL PSI Strength ElongationCandidate 1 150,000 25,000 375-500Candidate 2 330,000 6,500 150Candidate 3 200,000 2,000 100Candidate 4 100,000 12,300 300Candidate 5 24,000 20,000 600Candidate 6 53,000 5,300 350Candidate 7 53,000 5,500 300Candidate 8 230,000Candidate 9 360,000 12,000 180
Table 4.1 Polymer substrate candidates and selected material properties
The substrate candidates identified were put through a battery of bond
measurements to determine their compatibility with the two heat seals and to determine if
sufficient adhesion to the negative and positive sheets was possible. The bond testing was
69

Chapter 4
done at Rexham Industrial by Tom Bezek and the results are listed in Table 4.2. The bond
strengths are listed in grams.
NAME GAUGE NEGATIVE POSITIVEmils BOND gins BOND grins
Candidate 1 2 500 120Candidate 2 3 40 500Dull side
400w/P8 primer40 with4050 primer
Candidate 2 3 40 700Shiny side
440w/P8 primer40 with4050 primer
Candidate 3 3 760 120Candidate 4 2 400 460
300w/P8 primer200 with4050 primer
Candidate 5 760 640Candidate 6 4200 200Candidate 7 2 960 200Candidate 8 2.5 500 600
700w/P8 primer500 with4050 primer
Candidate 9 1100-1200 1100-1200
Table 4.2 Polymer substrate bond values to negative and positive sheet .
On the basis of the measured bond strengths candidates 6 and 7 were eliminated from
consideration. Bond strengths below 200 grams are considered unacceptable.
70

Chapter 4
4.4 Production Trials
Production trials were successfully conducted with candidates 2, 3, and 9. A trial was
attempted with candidate 1 but final frame assembly was unsuccessful because the knife
on the assembly machine was unable to adequately cut the film. Trials were not
conducted with the remaining candidate materials because of time constraints.
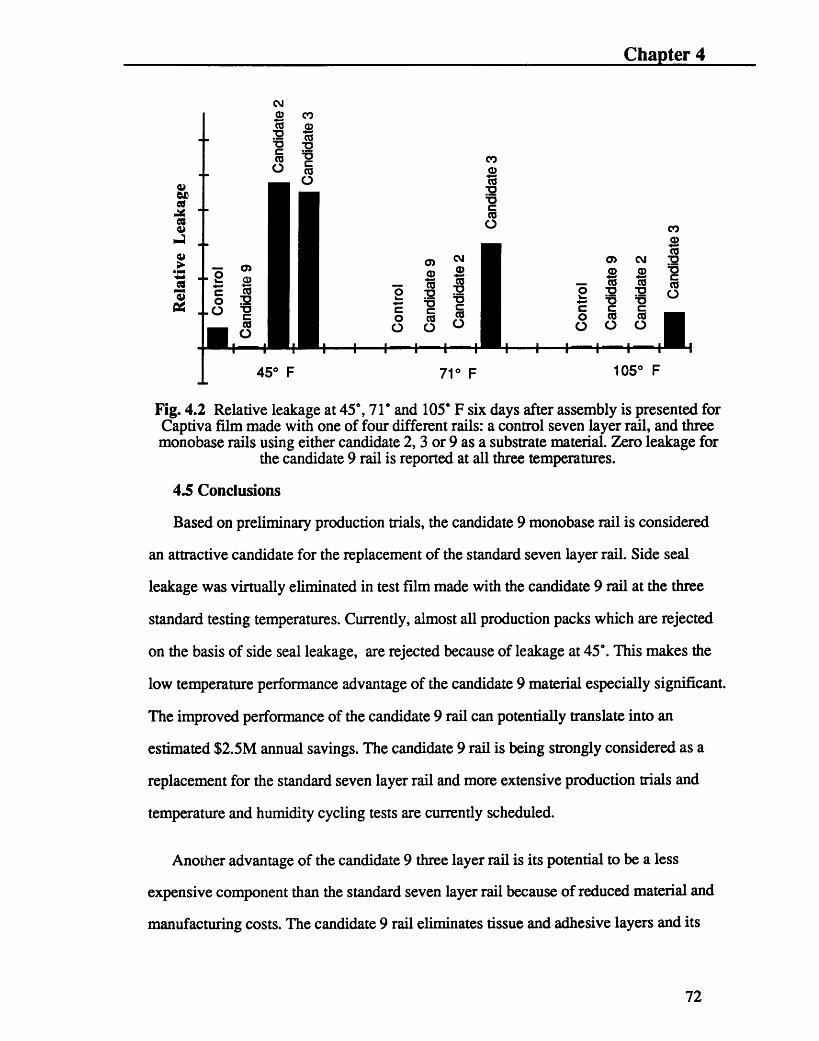
Film, incorporating monobase rails using candidates 2, 3, and 9 as substrates, was
assembled and tested for leakage at 45', 71' and 105' F. Leakage data for the film made
with the experimental rails along with that for film made with a control lot of standard
seven layer rail is presented in Fig. 4.2. For proprietary reasons the data are not presented
in absolute terms. Fig. 4.2 presents the relative leakage levels of film made with the
control rail and the monobase rails at three different temperatures.
The candidate 3 rail was clearly the poorest performer among the three candidates. At
all three temperatures the candidate 3 rail contributed to significantly higher levels of
leakage than did the control. The candidate 2 rail was comparable to the control at 71'
and 105' but was significantly worse than the control at 45'.
Zero leakage was reported for the candidate 9 rail at all three temperatures. The most
significant improvement over the performance of the control occurred at 45' at which the
performance of the candidate 9 rail was clearly superior.
71
04
Q/;I
at
Chapter 4
CY
Fig. 4.2 Relative leakage at 45', 71' and 105' F six days after assembly is presented forCaptiva film made with one of four different rails: a control seven layer rail, and threemonobase rails using either candidate 2, 3 or 9 as a substrate material. Zero leakage for
the candidate 9 rail is reported at all three temperatures.
4.5 Conclusions
Based on preliminary production trials, the candidate 9 monobase rail is considered
an attractive candidate for the replacement of the standard seven layer rail. Side seal
leakage was virtually eliminated in test film made with the candidate 9 rail at the three
standard testing temperatures. Currently, almost all production packs which are rejected
on the basis of side seal leakage, are rejected because of leakage at 45'. This makes the
low temperature performance advantage of the candidate 9 material especially significant.
The improved performance of the candidate 9 rail can potentially translate into an
estimated $2.5M annual savings. The candidate 9 rail is being strongly considered as a
replacement for the standard seven layer rail and more extensive production trials and
temperature and humidity cycling tests are currently scheduled.
Another advantage of the candidate 9 three layer rail is its potential to be a less
expensive component than the standard seven layer rail because of reduced material and
manufacturing costs. The candidate 9 rail eliminates tissue and adhesive layers and its
72
Chapter 4
three layer design requires fewer converting operations. The monobase rail also has the
potential to be a much less variable component because of the reduced number of
interfaces and better material uniformity of the candidate 9 material.
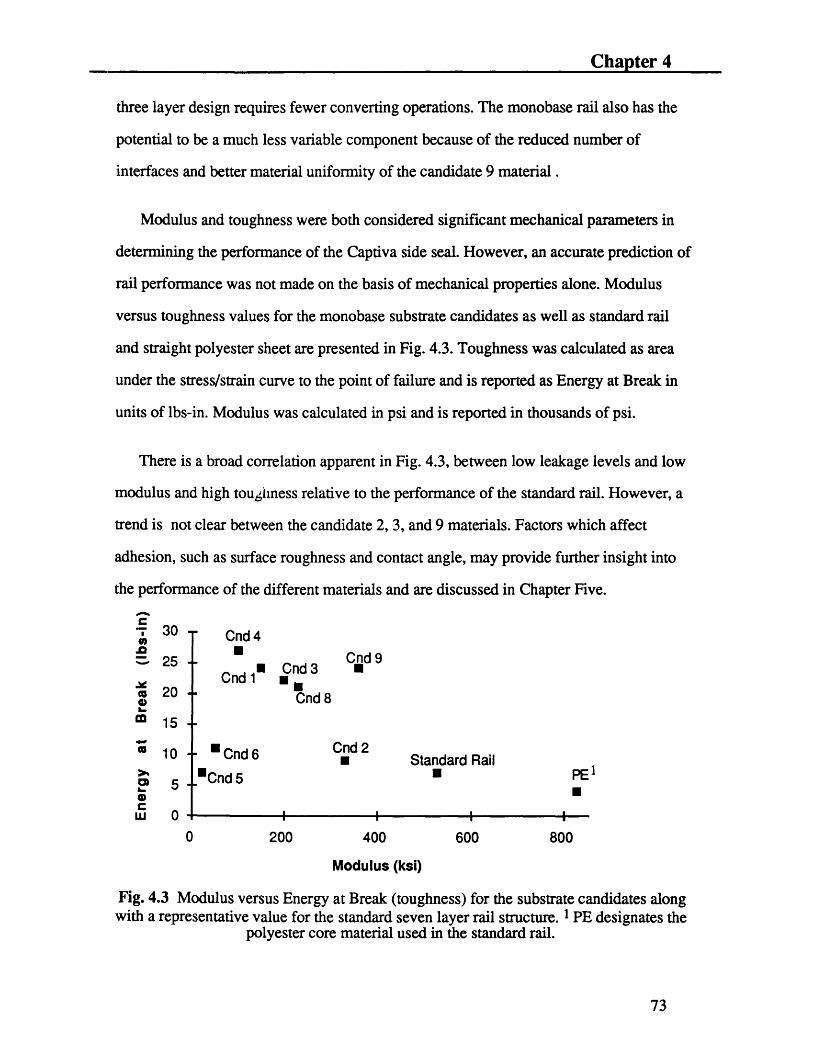
Modulus and toughness were both considered significant mechanical parameters in
determining the performance of the Captiva side seal. However, an accurate prediction of
rail performance was not made on the basis of mechanical properties alone. Modulus
versus toughness values for the monobase substrate candidates as well as standard rail
and straight polyester sheet are presented in Fig. 4.3. Toughness was calculated as area
under the stress/strain curve to the point of failure and is reported as Energy at Break in
units of lbs-in. Modulus was calculated in psi and is reported in thousands of psi.
There is a broad correlation apparent in Fig. 4.3, between low leakage levels and low
modulus and high toughness relative to the performance of the standard rail. However, a
trend is not clear between the candidate 2, 3, and 9 materials. Factors which affect
adhesion, such as surface roughness and contact angle, may provide further insight into
the performance of the different materials and are discussed in Chapter Five.
e-30 Cnd 4
25 Cnd 9n Cnd 3 ·Cnd 1 ·
a 20 Cnd 8
m 15
Co 10 Cnd6 Cnd 210 * Cnd 6 ·Cnd2 Standard Rail>C 1Cnd5 * PE
W 0w 0 I I!
0 200 400 600 800
Modulus (ksi)
Fig. 4.3 Modulus versus Energy at Break (toughness) for the substrate candidates alongwith a representative value for the standard seven layer rail structure. 1 PE designates the
polyester core material used in the standard rail.
73

Chapter 5
74

Chapter 5
5. NEW RAIL CHARACTERIZATION
The development of relevant supplier specifications for key material components is
considered crucial for the support of robust, high quality manufacturing processes. If
relevant material properties for product performance and their acceptable ranges are not
well established, key parameters may shift undetected and affect manufacturing processes
adversely. It is not uncommon for a material supplier to provide the same product to
several customers, each of which may have vastly different applications for the material
and correspondingly different requirements. A material parameter may be changed
slightly to accommodate one customer or the supplier itself, causing problems for other
customers, who without a thorough understanding of their key parameters may not be
able to identify the cause of the change in their process.
The work documented in this chapter is an effort to lay the foundation for
developing relevant material specifications for the Captiva rail redesign by characterizing
a lot of high level performing candidate 9 material. The fact that different lots of standard
rail, having met all supplier specifications, varied widely in performance for no
identifiable reason indicated that all the key variables in the Captiva side seal system
were not understood. Several material properties, such as wetting angle and surface
roughness, are presented in this chapter in an attempt to document other parameters that
might be factors in determining rail performance. Conclusions are not drawn as to
whether or not the material properties studied have a significant impact on rail
performance. Rather, the data are presented as an aid for correlating rail properties and
performance when sufficient production and test data are available which in turn will
enable the development of relevant supplier specifications for the three layer Candidate 9
material based rail.
75

Chapter 5
5.1 SEM Cross - Sections
The candidate 9 material is a blend of two incompatible polymers. When the two
materials are mixed initially, the polymer that is added in the lowest percentage forms
small voids where it pulls away from the other polymer matrix (see Fig. 5.1). As the
blend is processed and heated, the inner surfaces of the voids in the matrix become coated
with the other polymer. Later, as the material is formed into a film, the circular voids in
the matrix take on an elongated shape.
,_EWr-,-i(A) (B) (C)
Fig. 5.1 A schematic of the candidate 9 material morphology at different stages in itsforming process. (A) After initial mixing voids are formed where one polymer pullsaway from the other (B) When heated the inner surfaces of the voids become coated (C)During final film forming the voids become elongated.
The elongated voids are visible in SEM cross-sections taken of the candidate 9
material (see Fig. 5.2). The voids are approximately 10 microns in length. The quantity
and size of the voids potentially may have a significant impact on the ability of the
material to absorb energy during deformation. The sample preparation procedure used for
taking SEM micrographs of the candidate 9 material is described in sections 3.1 and 3.2.
76

Chapter 5
I
1
! iI t
- I,=
Fig. 5.2 SEM micrograph of the candidate 9 material in cross-section. Elongated voidsare visible.
5.2 Surface Roughness
Surface roughness measurements were taken of candidate 9 film samples using a
WYKO Roughness/Step Tester with a l0x objective. Surface roughness was studied
because of its potential impact on adhesion. The WYKO tester is a vertically scanning
interference microscope system. The microscope objective contains an interferometer
which consists of a reference mirror and beam splitter that produce interference fringes
when light reflected off the reference mirror combines with light reflected off the sample.
The RST uses a standard microscope lamp emitting short-coherence length white light as
light source so interference fringes are only present over a very shallow depth on sample
77

Chapter 5
surfaces. Samples are profiled by scanning vertically so that each point on the surface
produces an interference signal.
The RST starts a measurement sequence by focusing above the top of the surface
being profiled and quickly scanning downward. At evenly spaced intervals during the
scan, frames of interference data imaged by the video camera are captured and processed.
As the system scans downward, an interference signal for each point on the surface is
formed. The system uses a series of computer algorithms to precisely locate the peak of
the interference signal for each point on the surface.
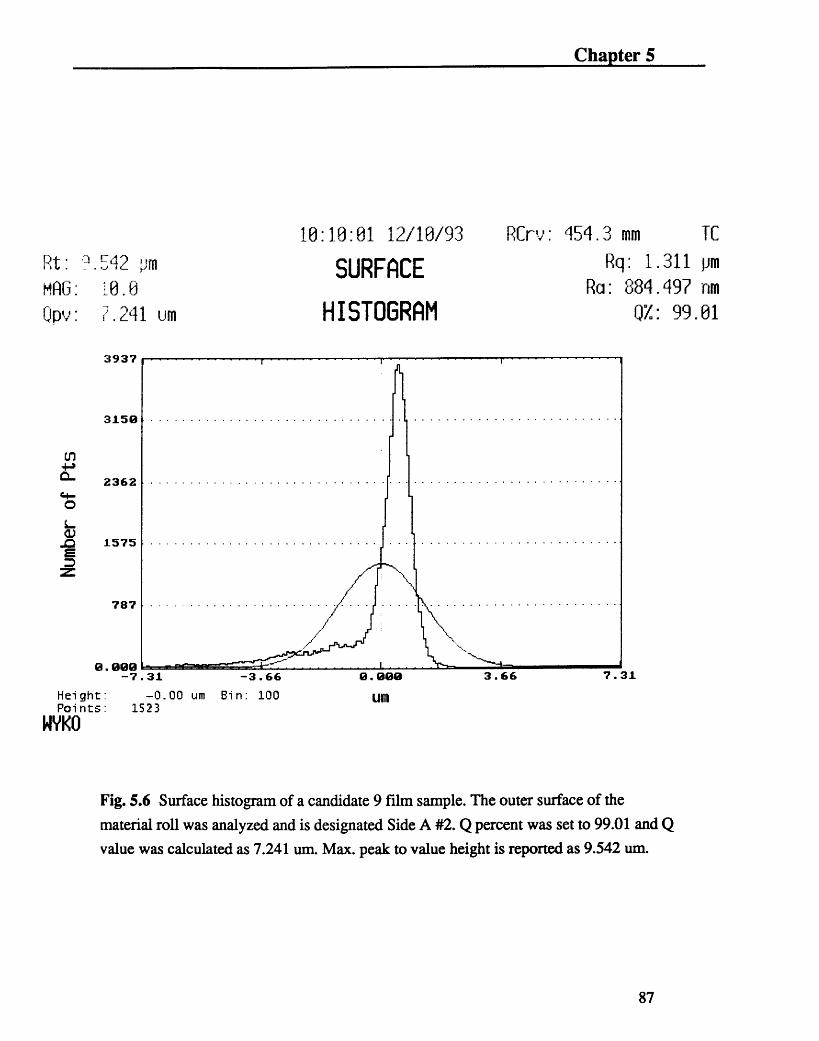
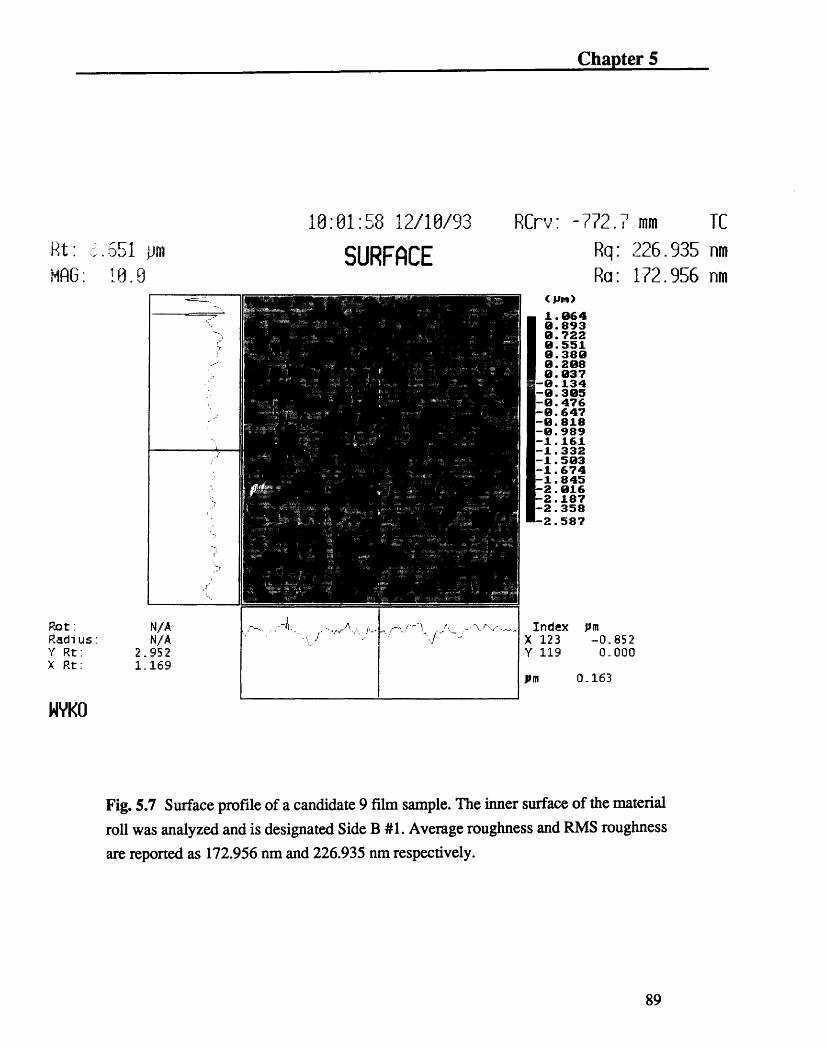
Two surface roughness measurements were taken of each side of a sample candidate
9 film which was used in the production trials of the monobase rails, the results of which
are summarized in section 4.4. This work was done under the direction of Saroj Roy.
Average roughness (Ra), root mean squared roughness (Rq), maximum peak to valley
height (Rt) are presented for the four areas tested in Table 5.1 along with values for Q
value and Q percent. Q value is a modification of the standard peakto-valley difference,
the difference between the highest and the lowest point in the data set. However, Q value
differs in that it eliminates the data values outside of the Q percent, which tend to be
infrequently occurring heights. If the Q percent is set to 99% the Q value is calculated
without the extreme 1% of data points. The Q value may depict the overall surface figure
more realistically than the standard Rt by not considering extreme data points which may
represent surface contaminants. The inner surface of the material roll is referred to as
Side B and the outer surface as Side A.
78

Chapter 5
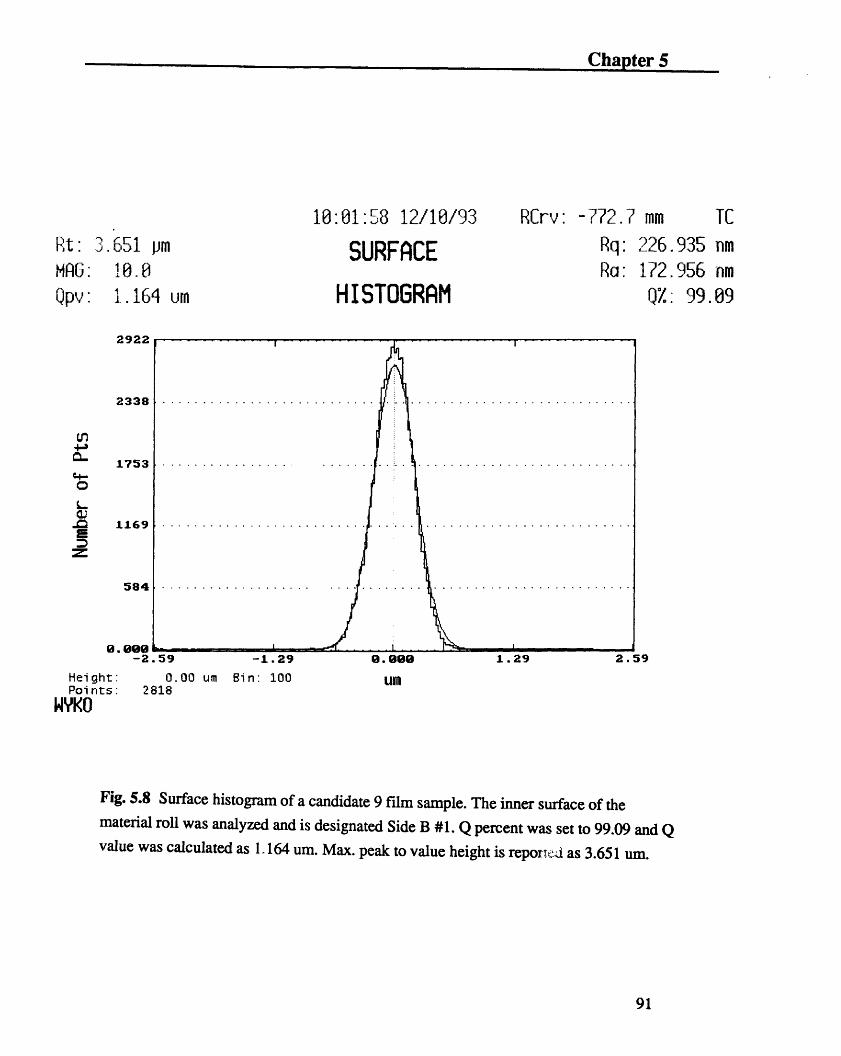
Average RMS Max. Peak to Q Percent Q ValueRoughness Roughness Valley Height
Side A #1 802.37 nm 1.180 um 11.585 um 99.05 6.243 umSide A #2 884.497 nm 1.311 um 9.542 um 99.01 7.241 umSide B #1 172.956 nm 226.935 nm 3.651 um 99.09 1.164 umSide B #2 181.863 nm 274.858 nm 6.040um 99.04 1.178 um
Table 5.1 Surface Roughness Parameters
Two types of plots for each surface were generated; a two-dimensional surface profile
and a surface histogram at Q percent set to 99 and are presented in Figs 5.3 - 5.10. Each
histogram of surface values indicates how often various heights occur in the data. Surface
histograms are useful because they "filter-out" a percentage of the highest peaks and
lowest valleys effectively smoothing the data of the inadvertent presence of dirt or
contaminants.
5.3 Contact Angle
The contact angle of a standard liquid on a materials surface characterizes surface
energy and affinity for bonding which has an effect on the adhesive properties of the
material. For that reason, the contact angle of water was measured along various spots
across the length of a strip of candidate 9 film. An average of five to eight measurements
were taken from which an average was calculated. The average value for contact angle of
side A was 78' with a range from 75' to 80' and the average for side B was 101' with a
range from 100' to 104'. The measurements were done under the supervision of Saroj
Roy.
79

Chapter 5
5.4 Conclusions
Mechanical property information alone was shown to be insufficient in explaining the
improved performance of the three layer candidate 9 based rail. The work presented in
this chapter is the first step in laying the foundation for determining what other material
parameters significantly effect rail performance. To ensure a robust, high quality Captiva
manufacturing process, rail properties and performance must be correlated as sufficient
production and test data become available. Without such a base of information, relevant
supplier specifications cannot be developed.
80

Chapter 5
Rt: 11.585 pm
MAfG. iG 0.
09:53:33 12/10/93
SURFACE
RCrv: 1.927 m TC
Rq: 1.180 pm
Ra: 802.370 nm
(pm)
4.7994.2563.7133.1702.6272.9841.5418.9980.455-0. 88-8.631-1.174-1.717-2.260-2.884-3.347-3.890-4.433-4.976-5.519-6.062-6.786
i* ! , - , -,,! !,y-U ~~~~~ it)~~~·
i i"'] r- -- ' '.Index m
X 123 -0.852Y 119 0.000
Pm -0.421
Fig. 5.3 Surface profile of a candidate 9 film sample. The outer surface of the material
roll was analyzed and is designated Side A #1. Average roughness and RMS roughness
are reported as 802.37 nm and 1.180 um respectively.
81
Pot:Radi us:Y Rt:X Rt:
N/AN/A
6.3096.797
WYKO.
i
----1
-=-
-e
--

Chapter 5
82

Chapter 5
09:53:33 12/10/93
SURFACEI 1.585 pm
10.06.243 um HISTOGRAM
t: 0.00 um Bin: 100s: 1471
RCrv: 1.927 m TC
Rq: 1.180 pm
Ra: 802.3780 nm
Q%: 99.05
79
Un
Fig. 5.4 Surface histogram of a candidate 9 film sample. The outer surface of the
material roll was analyzed and is designated Side A #1. Q percent was set to 99.05 and Q
value was calculated as 6.243 um. Max. peak to value height is reported as 11.585 um.
83
Rt.MAG:
Qpv :
4323
3458
LO
E-a0a)-o2r=
2594
1729
865
0. 0ee-6
Hei ghPoint
WYKO
.

Chapter 5
84

Chapter 5
Rt: -. 542 m
HfiAG: 10.0
10:10:01 12/10/93
SURFACE
RCrv: 454.3 mm TC
Rq: 1.311 pm
Ra: 884.497 nm(pm)·(n an.m mm
. 7801.3330.8860.43980.09
-0.456-9.903-1.350-1.798-2.245-2.692-3.139-3.587-4.834-4.481-4.929-5.376-5.823-6.270-6.718-7 14
Index PmX 123 -0.852Y 119 0. 000
pm 0.797
Fig. 5.5 Surface profile of a candidate 9 film sample. The outer surface of the material
roll was analyzed and is designated Side A #2. Average roughness and RMS roughness
are reported as 884.497 nm and 1.311 um respectively.
85
Rot:Radi usY Rt:X Rt:
N/A-_
N/AN/A7.8618.068
WYKO

Chapter 5
86
Chapter 5
10:10:01 12/108/93
SURFACE3 . 2 pjm
.241 um HISTOGRAM
RCrv: 454.3 mm
Rq: 1.
Ra: 884.
Qx:
787
0. 900-7Hei ght:Poi nts: 1
WYKO
-0.00 um Bin: 100 Uro523
Fig. 5.6 Surface histogram of a candidate 9 film sample. The outer surface of the
material roll was analyzed and is designated Side A #2. Q percent was set to 99.01 and Q
value was calculated as 7.241 um. Max. peak to value height is reported as 9.542 um.
87
Opv:WVS:
3937
3158
TC
pm
nm
01
311
49799.
U,)
I-0L
Ez=
2362
1575
31

Chapter 5
88
Chapter 5
Rt: £.651 jim
M f G I W O.
Rot:Radi us:Y Rt:X Rt:
N/AN/A
2.9521 169
WYKO
10:01:58 12/10/93
SURFACE
RCrv: -772.?
Rq:
Ra:
mm TC
226.935 nm
172.956 nm( Jim)
1. 640.8930.7229.5519.3800.2088.837-0.134-0.385-9.476-9.647-9.818-9.989-1.161-1.332-1.503-1.674-1.845-2.016-2.187-2.358
-2.587
IndexX 123Y 119
pm
ym-0 8520.000
0.163
Fig. 5.7 Surface profile of a candidate 9 film sample. The inner surface of the material
roll was analyzed and is designated Side B #1. Average roughness and RMS roughness
are reported as 172.956 nm and 226.935 nm respectively.
89
---,
--
1
i
ITr
r
",-4- r- ," "" , '''~~~~~~~~~~~~~~~~~~~~~~~, ,
I-
- ' I I
I- :,

Chapter 5
90
Chapter 5
Rt: 3.651 m
HAG: 0!8.8
Qpv: 1.164 um
2922
2338
Ul
C40L.
fFM
1753
1169
584
10: 01:58 12/10/93
SURFACE
HISTOGRAM
RCrv: -772.7 mm
Rq: 226
Ra: 172
Qz
Hei ghPoint
WYKO
0. 08-2.59 -1.29it: 0.00 um Bin: 100
2 818
0.99 1.29 2.59Um
Fig. 5.8 Surface histogram of a candidate 9 film sample. The inner surface of thematerial roll was analyzed and is designated Side B #1. Q percent was set to 99.09 and Qvalue was calculated as 1.164 urn. Max. peak to value height is report cx as 3.651 um.
91
TC
.935 nm
.956 nm
: 99.09
ts '

Chapter 5
92

Chapter 5
10:16:15 12/10/93
SURFACE
RCrv: -619.6 mm TC
Rq: 274.858 nm
Ra: 181.863 nm(Jm)0.9180.6350.3520.968
-0.215-8.498-0.781-1.064-1.347-1.630-1.914-2.197-2.480-2.763-3.946-3.329-3.612-3.895-4.179-4.462-4.745-5.122
N/AN/A
0.8280.874
IndexX 123Y 119
Pm-0.8520.000
pm -0.085
Fig. 5.9 Surface profile of a candidate 9 film sample. The inner surface of the materialroll was analyzed and is designated Side B #2. Average roughness and RMS roughness
are reported as 181.863 nm and 274.858 nm respectively.
93
Rt: 6.48 pmHAG: 108.80
Rot:Radi us:Y Rt:X Rt:
WYKOI
I
i
IIII
I
I,I
I
h -.·.-A--_

Chapter 5
94

Chapter 5
10:6:15 2/180/93
SURFACE
HISTOGRAM
RCrv: -619.6
Rq:
Ra:
Eilm TC
274.858 nm
181.863 nm
QZ: 9 804
-5.12 -2.56it: 0.00 um Bin: 100:s : 5444
0.SGO 2.56 5.12um
Fig. 5.10 Surface histogram of a candidate 9 film sample. The inner surface of thematerial roll was analyzed and is designated Side B #2. Q percent was set to 99.04 and Qvalue was calculated as 1.178 um. Max. peak to value height is reported as 6.040 um.
95
Rt:HAG.
Opv:
I). 040 r
. 178 m
4442
ul+i-a0L4-0L.Z,
=:D
3332
2221
1111
Hei ghPoi nt
WYKO
0. B00

Chapter 6
96

Chapter 6
6. CONCLUSIONS AND RECOMMENDATIONS
The Captiva rail redesign project reflects the cumulative efforts of many individuals
from organizations across Polaroid, Polaroid suppliers and MIT. The project provides an
example of the technical and bottom line improvements that can be achieved by
effectively coordinating the appropriate resources with a clear and coherent project
strategy. Many of the project's contributions can be attributed to the utilization of key
technical resources outside the manufacturing organization and a project strategy aimed
toward improving manufacturing robustness.
6.1 Research and Development's Role in Manufacturing Support
Polaroid's Research and Development organization consists of top-notch technical
personnel and outstanding analytical resources which are not frequently utilized for the
support of on-going manufacturing operations. Over the course of the rail project, key
individuals in the R&D organization were brought in as internal consultants through
informal means. Individuals with expertise in areas relevant to the rail project were
identified through word of mouth and their time spent on the project was outside of their
official responsibilities. They were invaluable in providing technical expertise in the
fields of polymer mechanics and adhesion and contributed to the definition of the project
strategy. Benefits from that contact with the R&D individuals goes beyond contributions
made to the rail project. Many of the analytical techniques and much of the engineering
theory that they introduced to the team can be applied to future manufacturing problems.
To encourage the type of cross-functional collaboration that occurred on the rail
project, Polaroid should create a mechanism for recognizing and rewarding individuals'
97
Chapter 6
contributions to projects that benefit the company as a whole but are not part of their
official responsibilities and facilitate the identification of individuals throughout the
company who might act as technical resources by creating a directory listing people and
their areas of technical expertise. As a company Polaroid can realize significant gains by
tapping into resources that traditionally focus on new product development to support
existing production without adversely affecting the performance of its R&D organization.
6.2 Redesign for Manufacturing Robustness
The strategy of redesigning the rail component to achieve manufacturing robustness
proved to be very effective. By working toward a rail design whose performance was
inherently less sensitive to input parameters, not only were the desired gains in film yield
achieved, but a reduction in material and sub-component assembly costs were also
realized. Many other integral film components are as complex or more complex than the
standard seven layer rail (see Fig. 2.1). It is likely that the proactive reevaluation and
redesign of other integral film components using the strategy that was outlined in this
thesis would lead to gains similar to those achieved by the monobase rail redesign.
98

References
McGarry, F.J. and J.E. Moalli. Mechanical Behaviour of Rigid Rod Polymer Fibres:Measurement of Axial Compressive and Transverse Tensile Properties. Polymer. Vol. 32,No. 10, 1991.
Murayama, T. Dynamic Mechanical Analysis of Polymeric Materials. New York:Elsevier Scientific Publishing, 1978.
Timoshenko, Stephen and James Gere. Mechanics of Materials. Monterey,California:Litton Educational Publishing, Inc. 1972.
Ward, I.M. Mechanical Properties of Solid Polymers. New York: Wiley, 1983.
99
MITLibrariesDocument Services
Room 14-055177 Massachusetts AvenueCambridge, MA 02139Ph: 617.253.5668 Fax: 617.253.1690Email: [email protected]://libraries. mit. edu/docs
DISCLAIMER OF QUALITYDue to the condition of the original material, there are unavoidableflaws in this reproduction. We have made every effort possible toprovide you with the best copy available. If you are dissatisfied withthis product and find it unusable, please contact Document Services assoon as possible.
Thank you.
Some pages in the original document containpictures or graphics that will not scan or reproduce well.