technical analysis workshop series ichimoku … introduction • originally developed by japanese...
TRANSCRIPT
Technical Analysis Workshop Series
Ichimoku Cloud Charting
13th March 2014

Profile
Year 1 Business Administration
Started trading since 2012
Actively trading FX and keen on Technical Analysis
Currently pursuing a professional qualification in TA,
Certified Financial Technician (CFTe)
Running a small import-export business

DISCLOSURES & DISCLAIMERSThis research material has been prepared by NUS Invest.
NUS Invest specifically prohibits the redistribution of this material in whole or in part without thewritten permission of NUS Invest.
The research officer(s) primarily responsible for the content of this research material, in wholeor in part, certifies that their views are accurately expressed and they will not receive direct orindirect compensation in exchange for expressing specific recommendations or views in thisresearch material.
Nothing in this research material constitutes a representation that any investment strategy orrecommendation contained herein is suitable or appropriate to a recipient’s individualcircumstances or otherwise constitutes a personal recommendation. It is published solely forinformation purposes, it does not constitute an advertisement and is not to be construed as asolicitation or an offer to buy or sell any securities or related financial instruments.
No representation or warranty, either expressed or implied, is provided in relation to theaccuracy, completeness or reliability of the information contained herein. The research materialshould not be regarded by recipients as a substitute for the exercise of their own judgement.Any opinions expressed in this research material are subject to change without notice.
Outline
1. Introduction2. Key Components of Ichimoku3. Piecing the Puzzle4. Trade Examples5. Conclusion
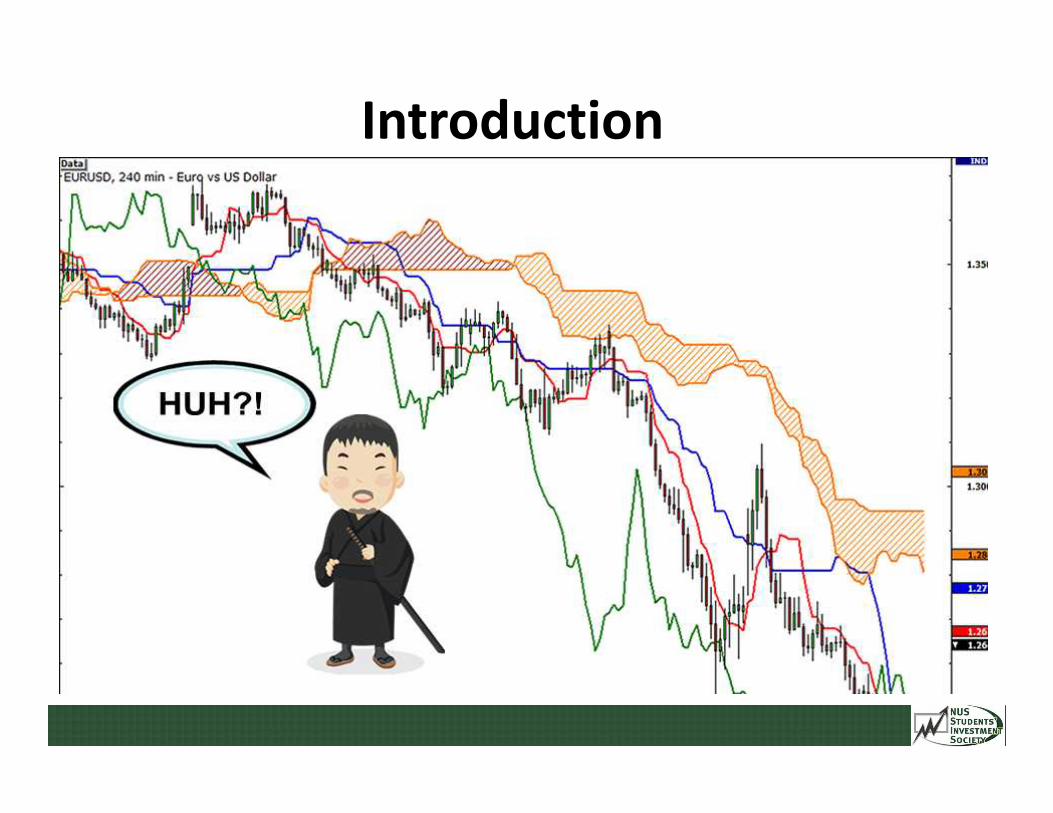
Introduction
Brief Introduction• Originally developed by Japanese journalist Goichi Hosada as
he was looking to develop ‘The Ultimate Indicator’
• Full name is the (均衡表 Ichimoku Kinkō Hyō) whichtranslates to “one glance equilibrium chart”
• Successfully used in nearly every tradable market, not justlimited to those linked to Japan e.g. Yen-pairs on FX
• Works on all timeframes but recommended for longer-termpositions e.g. 4hr and above
How it works• Moving average-based trend identification system factoring in
both time and price components
• Illustrates the current trend, helps you time entries, displayssupport and resistance, clarifies momentum, and shows youwhen a trend has likely reversed – all in one package
• Considered a self-contained system where no additionalindicators are necessary
• Standard settings for an Ichimoku chart indicator are 9, 26, 52
• Ichimoku shows the past, present and the future
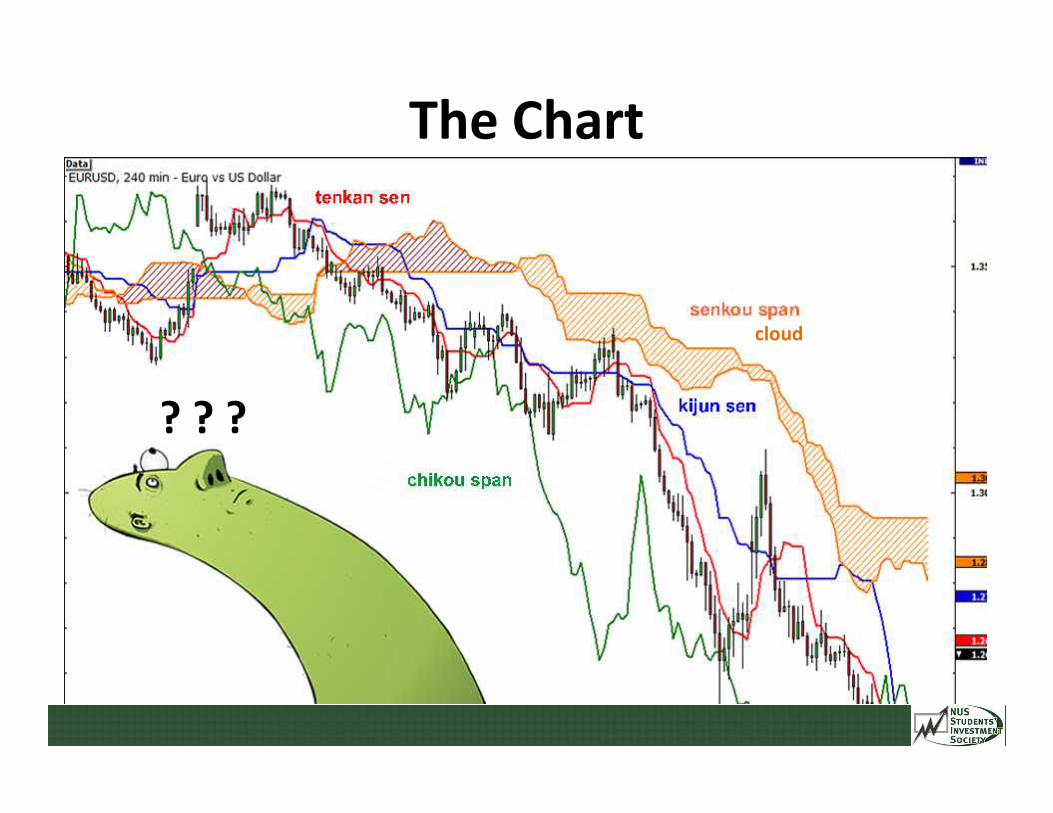
The Chart
? ? ?
cloud

Key Concept
The Trend IsYour Friend!

The 4 Key Componentsof Ichimoku
Tenkan Line Kijun Line
Chikou Line Kumo Cloud
Tenkan-sen (Trigger line)• Tenkan-sen (転換線) calculation: (highest high + lowest low)/2
for the last 9 periods.
• Derived by calculating the overall midpoint between thehighest high and the lowest low for the past nine periods.
• Primarily used as a signal line and a minor support/resistanceline
• Indicator of the market trend

Tenkan-sen (Trigger line)
• Called the Trigger Line because this is where all the actiontakes place

Comparison with MAs
• From the notion that taking average of the extremes >taking average of the closing prices (Moving Averages)
Kijun-Sen (Base line)• Kijun-sen (基準線) calculation: (highest high + lowest low)/2
for the past 26 periods.
• Calculated exactly the same way as Tenkan line but with alonger look back period of 26 days
• Used as a support/resistance level and as a confirmation line
• If the price is higher than the Kijun line, it could continue toclimb higher and vice versa for lower prices.
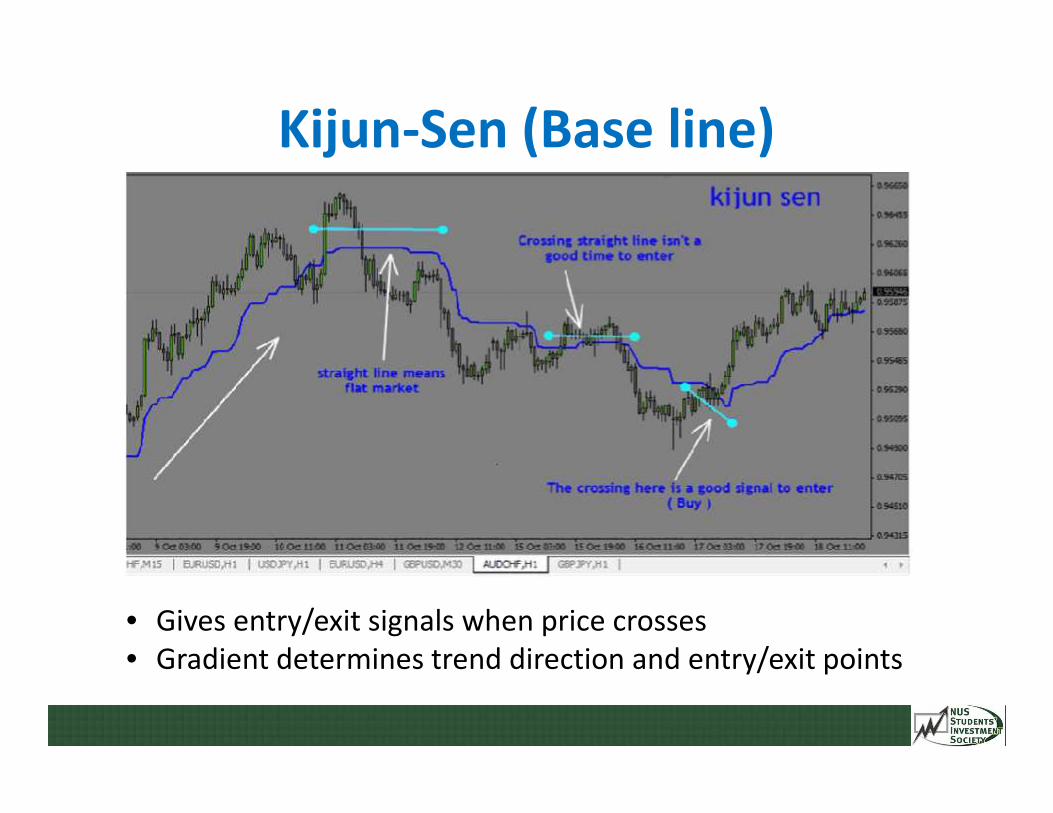
Kijun-Sen (Base line)
• Gives entry/exit signals when price crosses• Gradient determines trend direction and entry/exit points
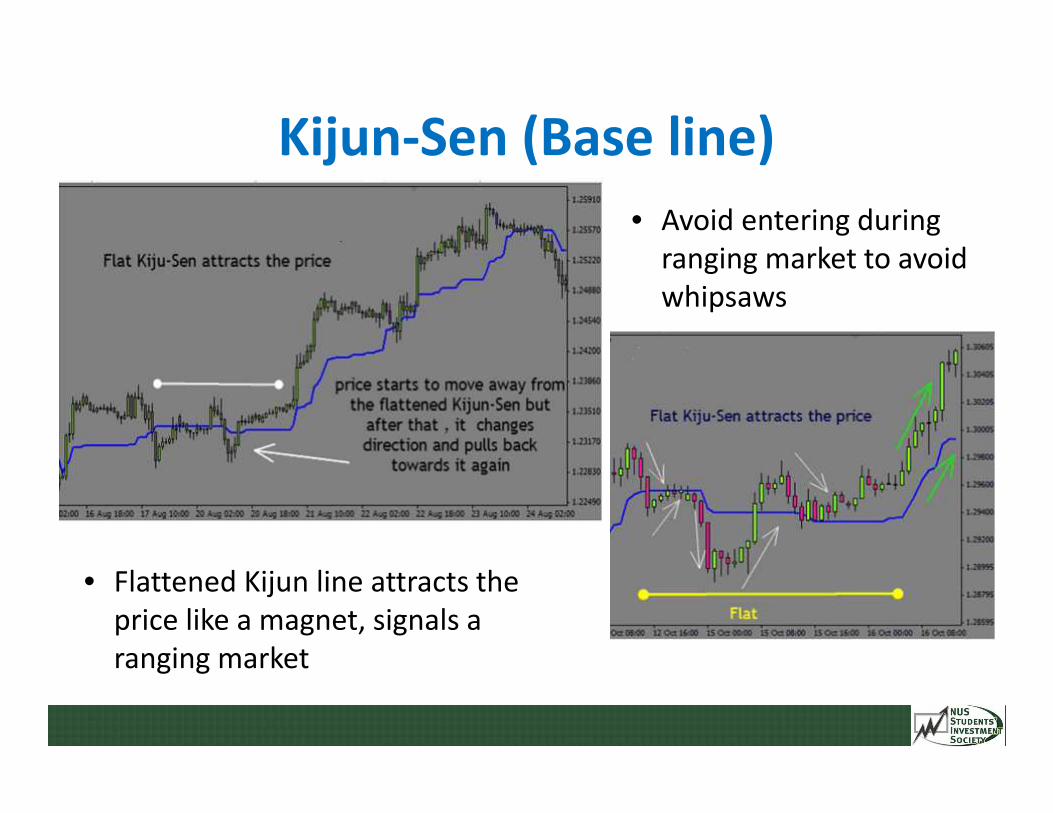
Kijun-Sen (Base line)
• Flattened Kijun line attracts theprice like a magnet, signals aranging market
• Avoid entering duringranging market to avoidwhipsaws

Support/Resistance Level
• Kijun line acts as support/resistance levels, irregardlessof gradient
Chikou Span (Lagging line)• Chikou (遅行) span calculation: today's closing price projected
back 26 days on the chart
• Used as a support/resistance aid
• Is the last ‘concluding’ signal in cloud chart analysis – commonlyknown as “The Filter”
• If the Chikou Span (Lagging line) crosses the price in the bottom-up direction, that's a buy signal. If the green line crosses the pricefrom the top-down direction, that's a sell signal
Interpretation
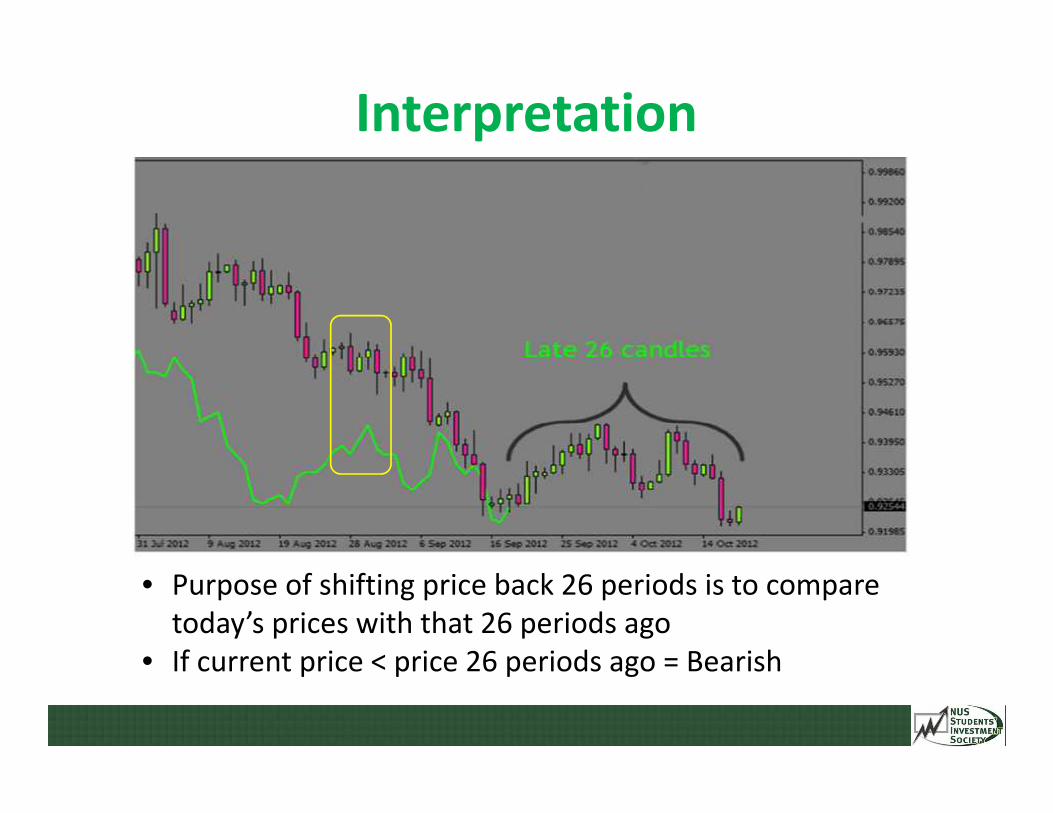
• Purpose of shifting price back 26 periods is to comparetoday’s prices with that 26 periods ago
• If current price < price 26 periods ago = Bearish
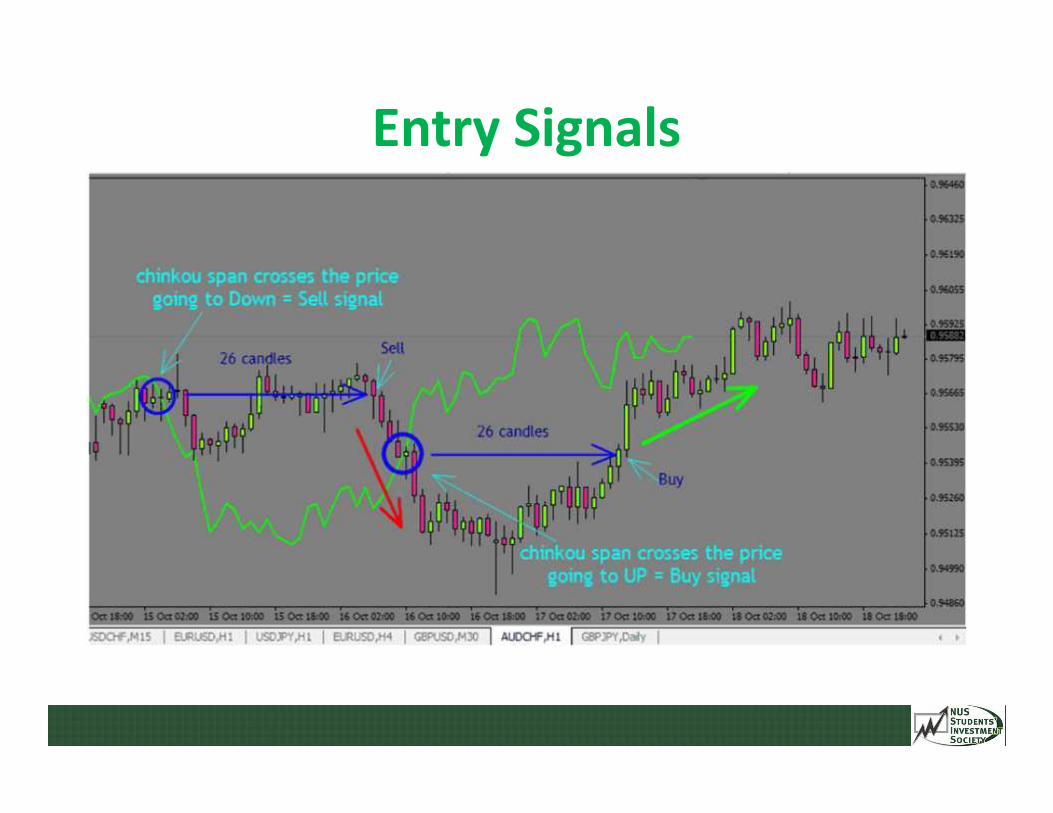
Entry Signals

Entry Signals
• Chikou span (26 periodsbehind) crossing belowprice = SELL
• Chikou span (26 periodsbehind) crossing aboveprice = BUY
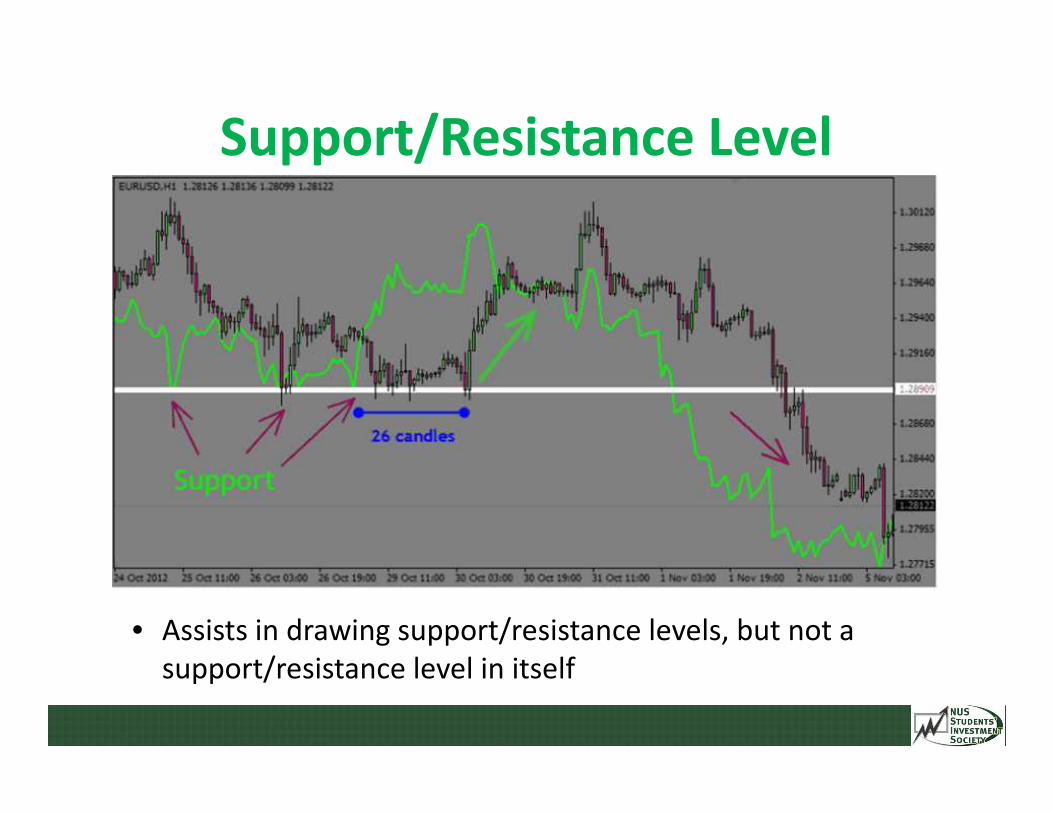
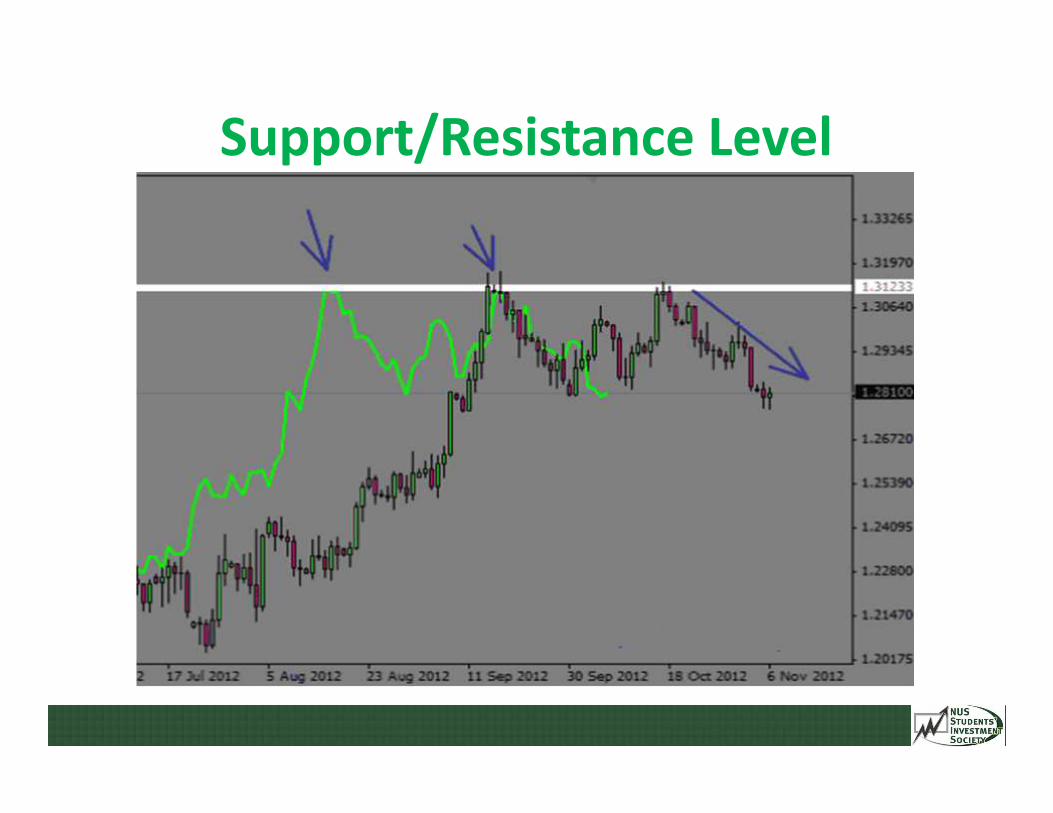
Support/Resistance Level
• Assists in drawing support/resistance levels, but not asupport/resistance level in itself
Support/Resistance Level
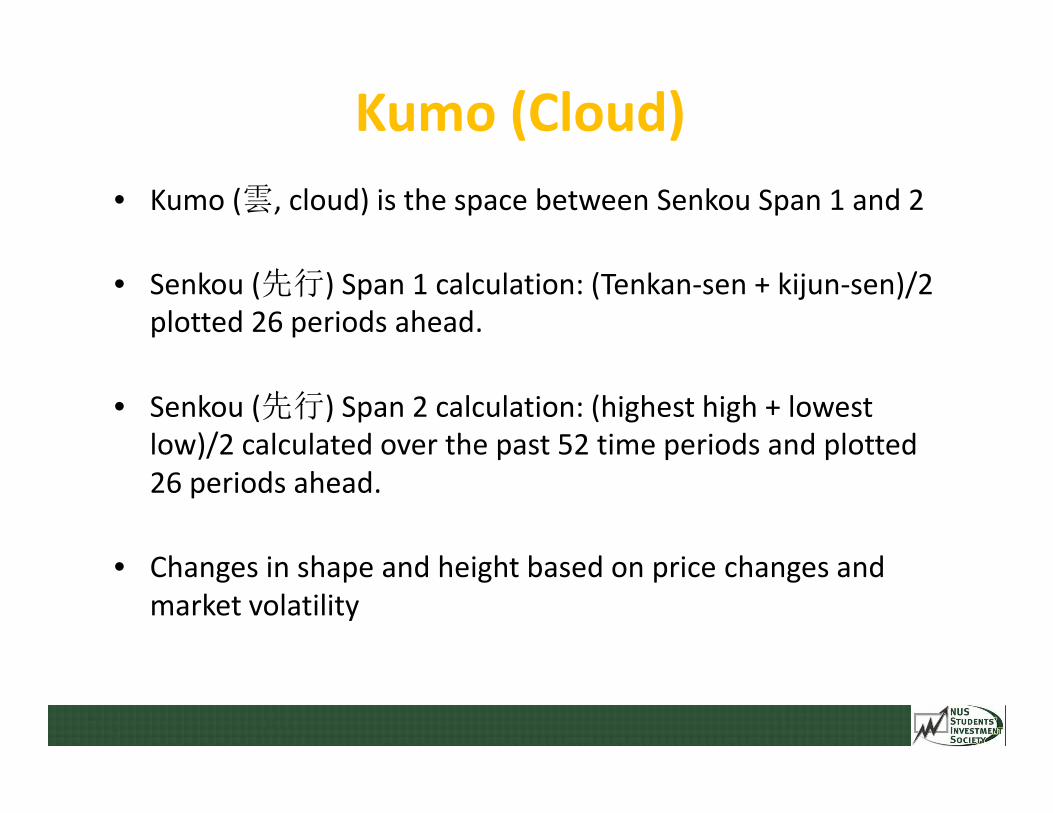
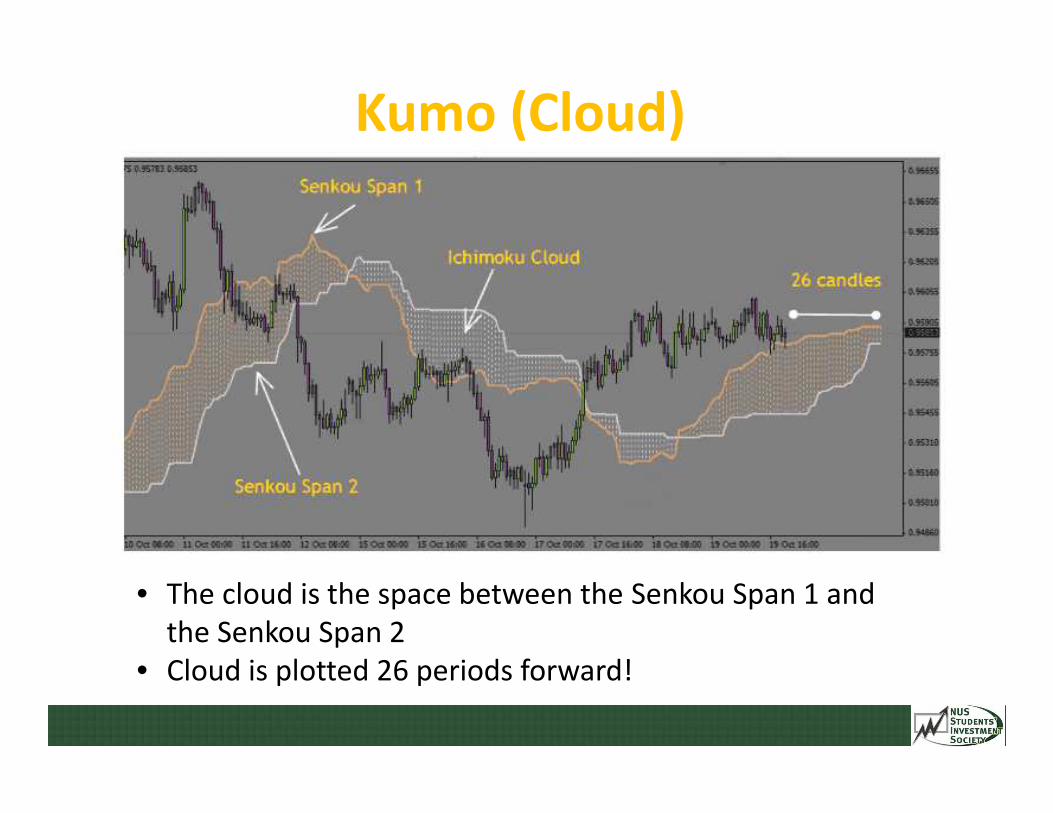
Kumo (Cloud)• Kumo (雲, cloud) is the space between Senkou Span 1 and 2
• Senkou (先行) Span 1 calculation: (Tenkan-sen + kijun-sen)/2plotted 26 periods ahead.
• Senkou (先行) Span 2 calculation: (highest high + lowestlow)/2 calculated over the past 52 time periods and plotted26 periods ahead.
• Changes in shape and height based on price changes andmarket volatility
Kumo (Cloud)
• The cloud is the space between the Senkou Span 1 andthe Senkou Span 2
• Cloud is plotted 26 periods forward!
Trend Direction
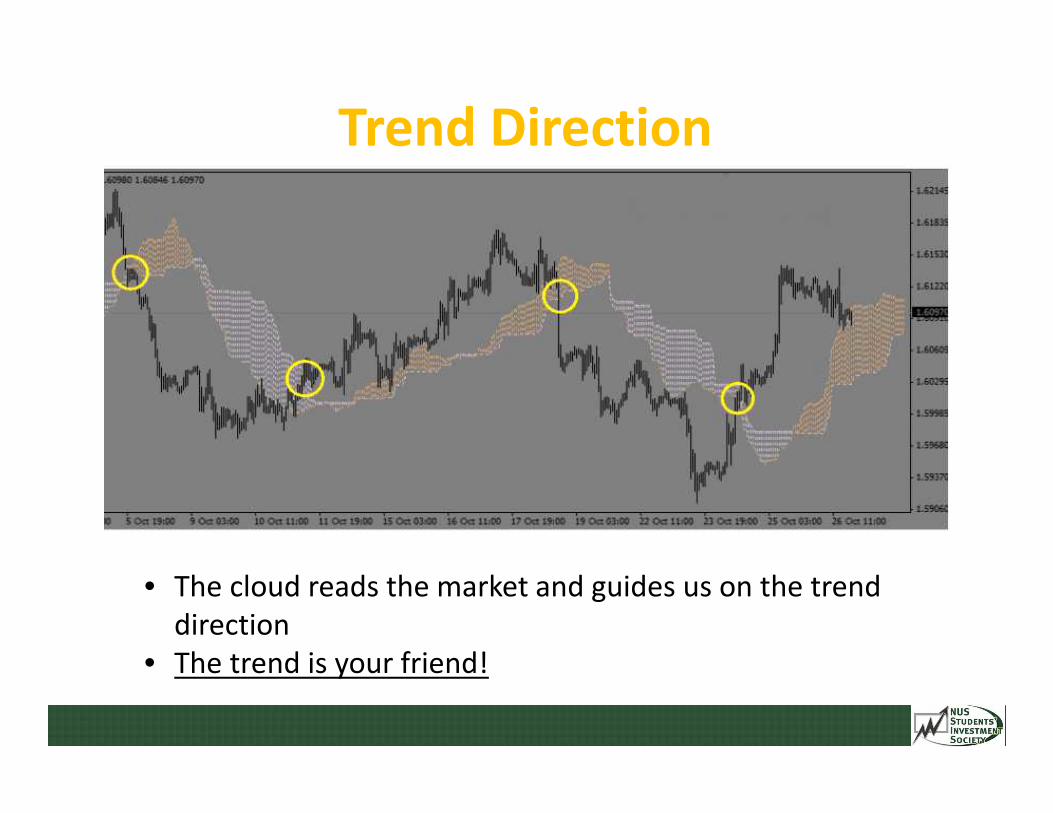
• The cloud reads the market and guides us on the trenddirection
• The trend is your friend!
Trend Direction
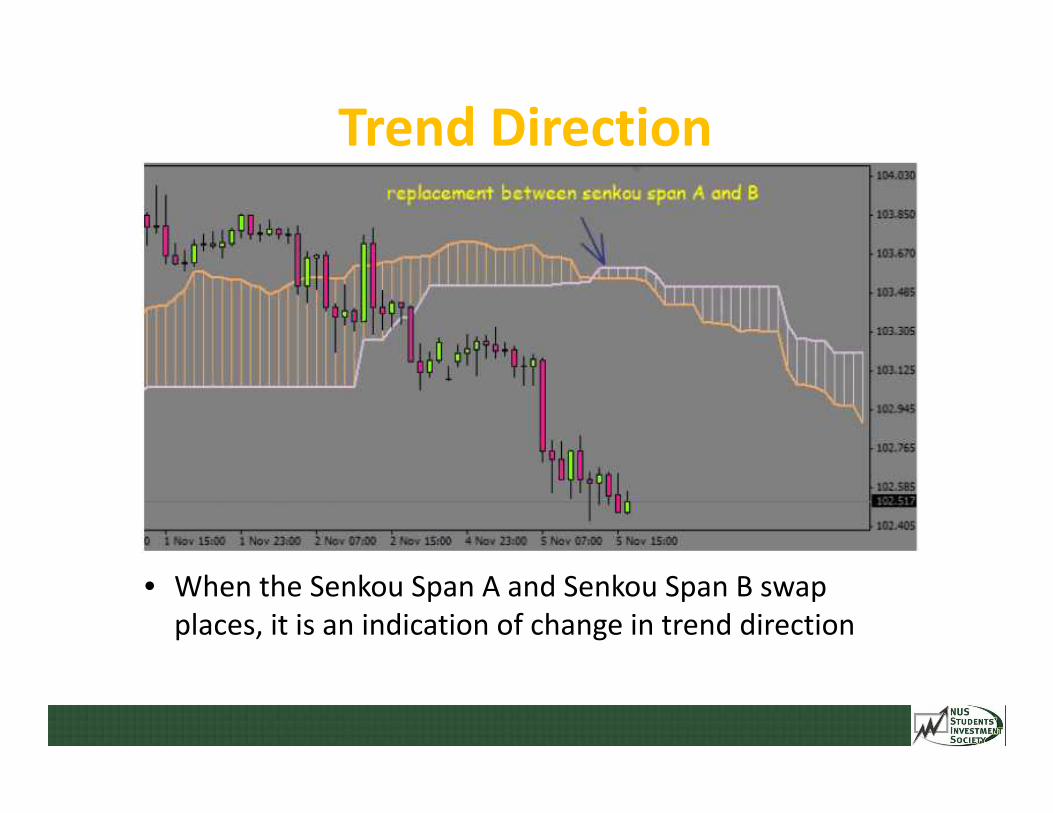
• When the Senkou Span A and Senkou Span B swapplaces, it is an indication of change in trend direction

Trend Direction
• The “Kumo Twist” is a replacement of cloud spans 26candles forward that gives us an indication of trend change
Interpretations
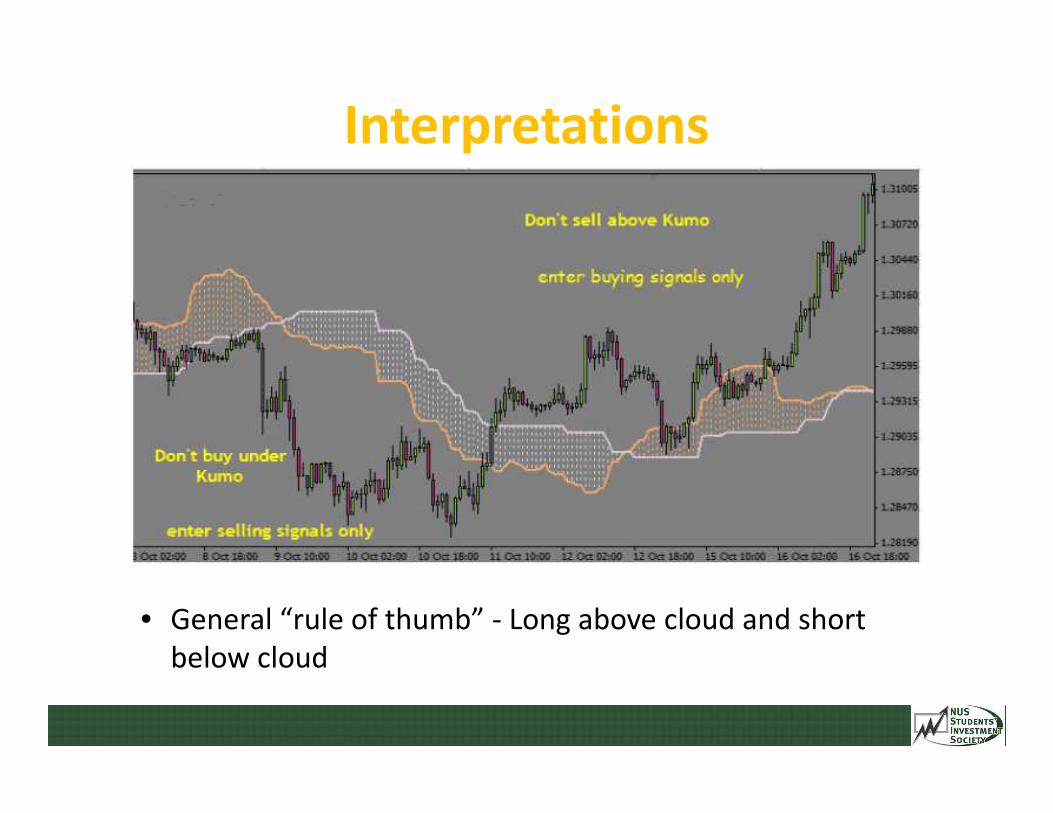
• General “rule of thumb” - Long above cloud and shortbelow cloud

Support/Resistance Levels
• Thick cloud = High liquidity and good support/resistancelevels
• Thin cloud = Low liquidity and easy to break• Trending vs. Ranging market
In Summary• The Chikou Span represents the past, the Tenkan and Kijun
lines represent the present and the Cloud represents thefuture
• Ichimoku works best in a trending market, staying clearfrom any potential ranging markets that may causewhipsaws
• Avoid using these components individual – Ichimoku is allabout the mess, use them all together!

Putting the Pieces
Together
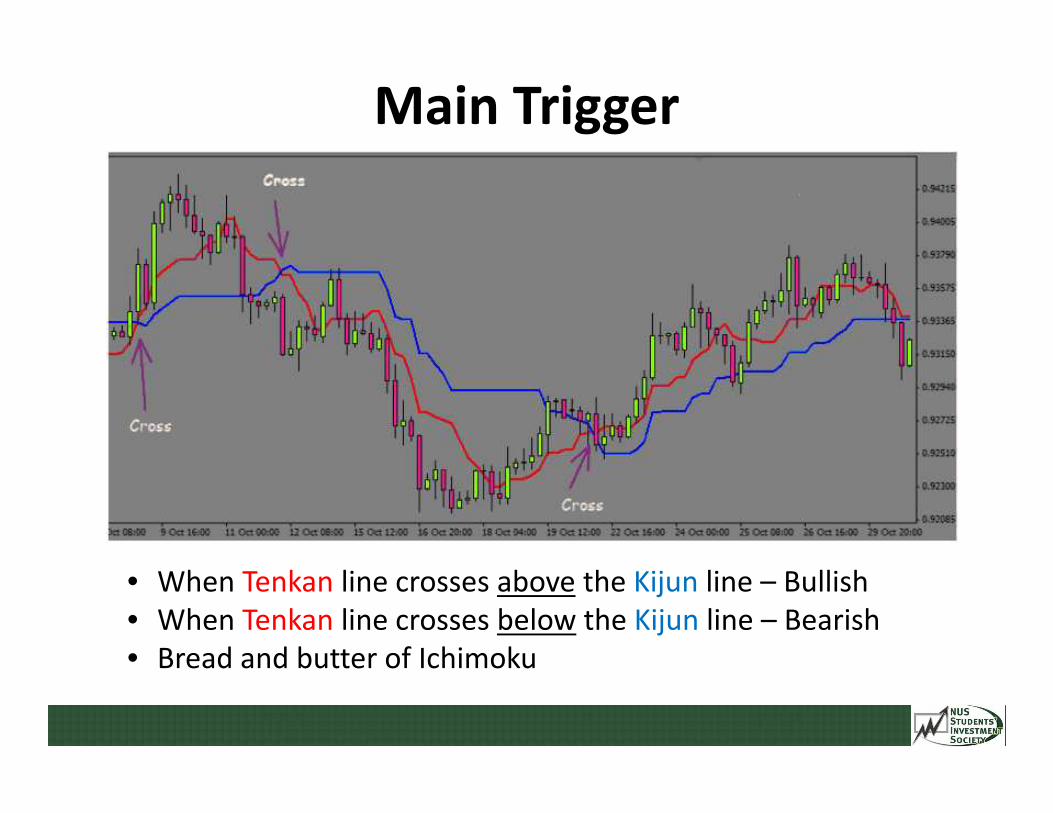
Main Trigger
• When Tenkan line crosses above the Kijun line – Bullish• When Tenkan line crosses below the Kijun line – Bearish• Bread and butter of Ichimoku
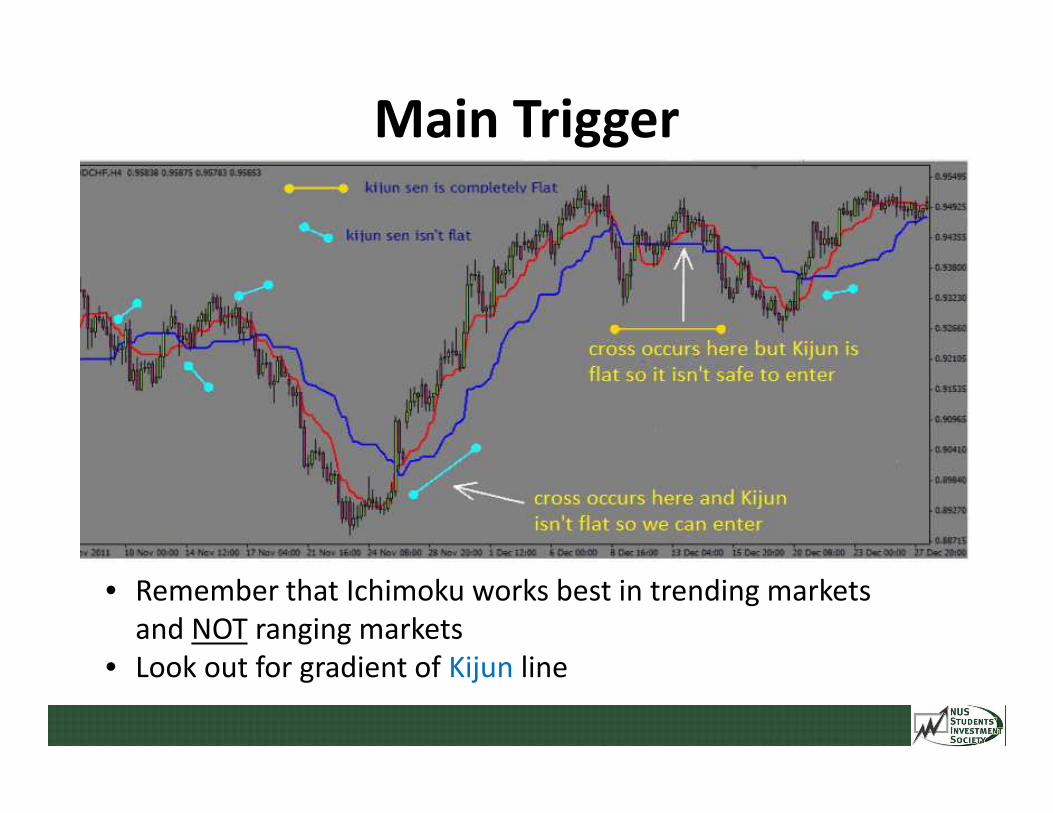
Main Trigger
• Remember that Ichimoku works best in trending marketsand NOT ranging markets
• Look out for gradient of Kijun line
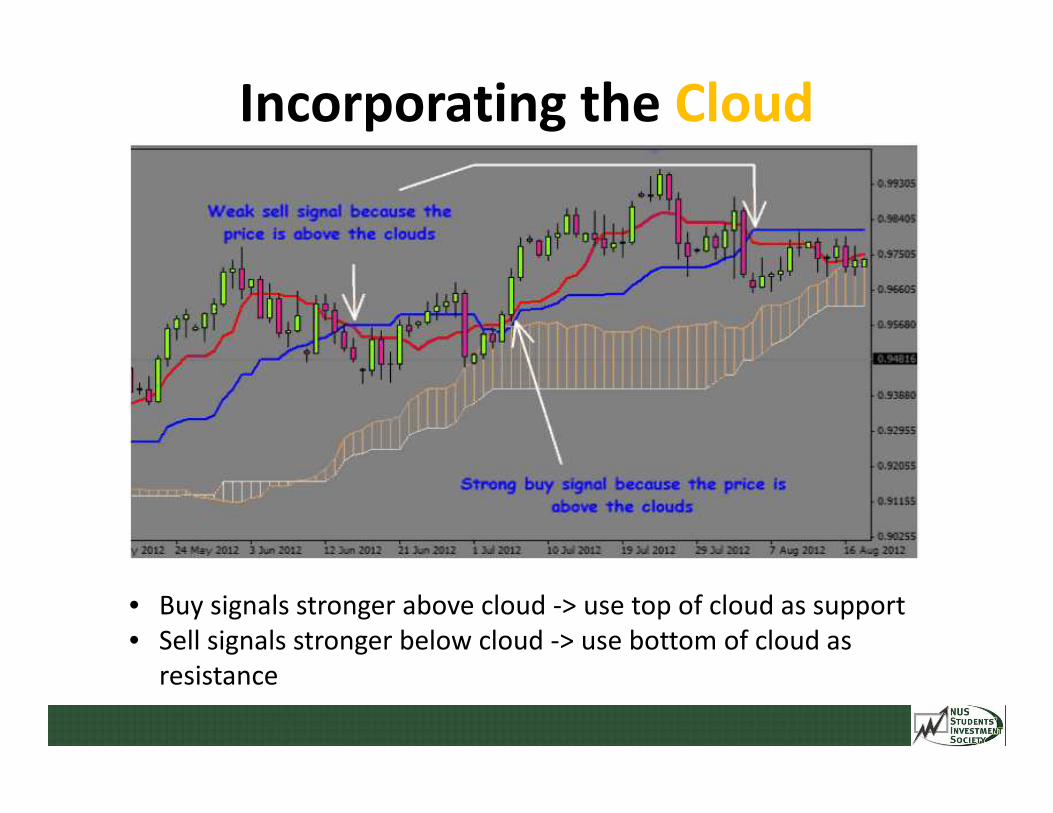
Incorporating the Cloud
• Buy signals stronger above cloud -> use top of cloud as support• Sell signals stronger below cloud -> use bottom of cloud as
resistance
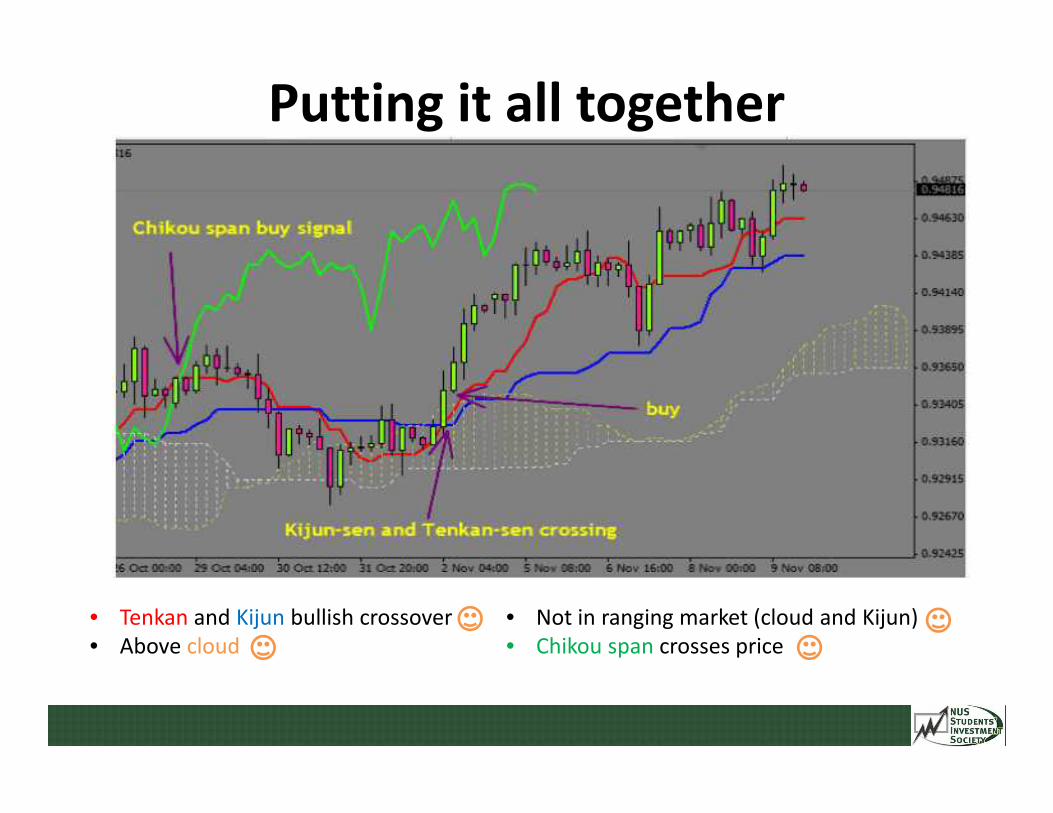
Putting it all together
• Tenkan and Kijun bullish crossover• Above cloud
• Not in ranging market (cloud and Kijun)• Chikou span crosses price
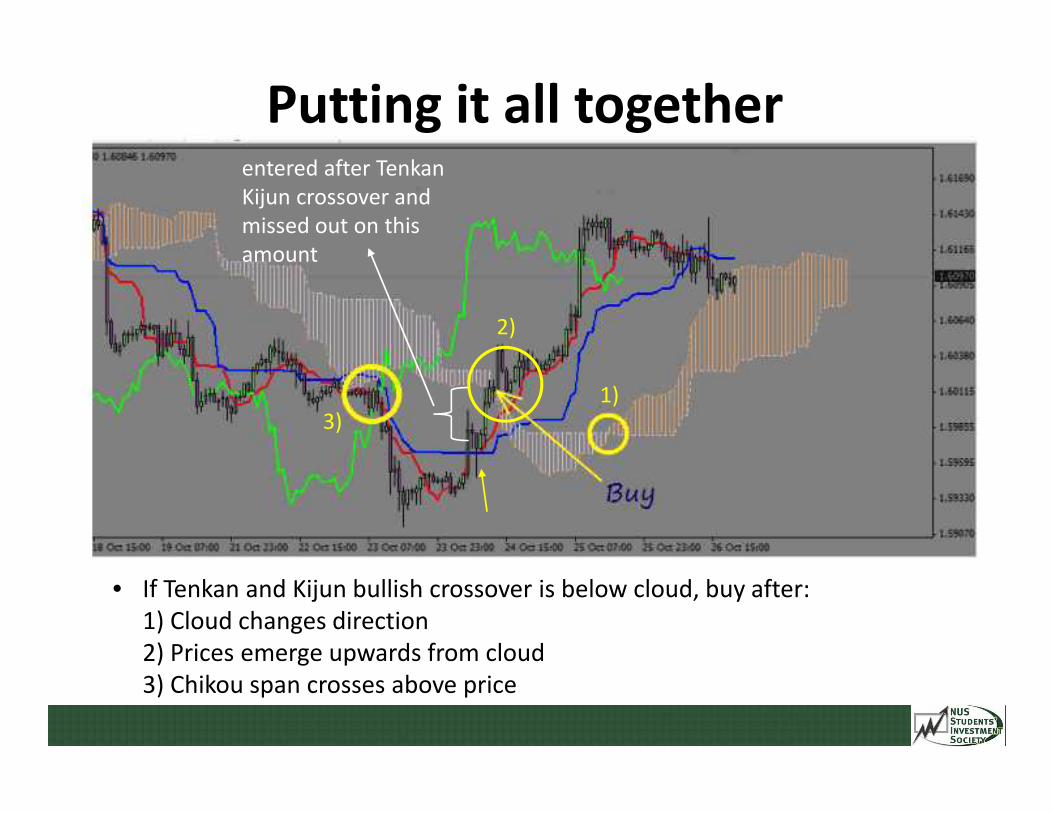
Putting it all together
• If Tenkan and Kijun bullish crossover is below cloud, buy after:1) Cloud changes direction2) Prices emerge upwards from cloud3) Chikou span crosses above price
entered after TenkanKijun crossover andmissed out on thisamount
1)
2)
3)

Putting it all together
• If Tenkan and Kijun bearish crossover is above cloud, sell after:1) Cloud changes direction2) Prices emerge downwards from cloud3) Chikou span crosses below price
entered after TenkanKijun crossover andmissed out on thisamount
1)
2)
SELL
3)
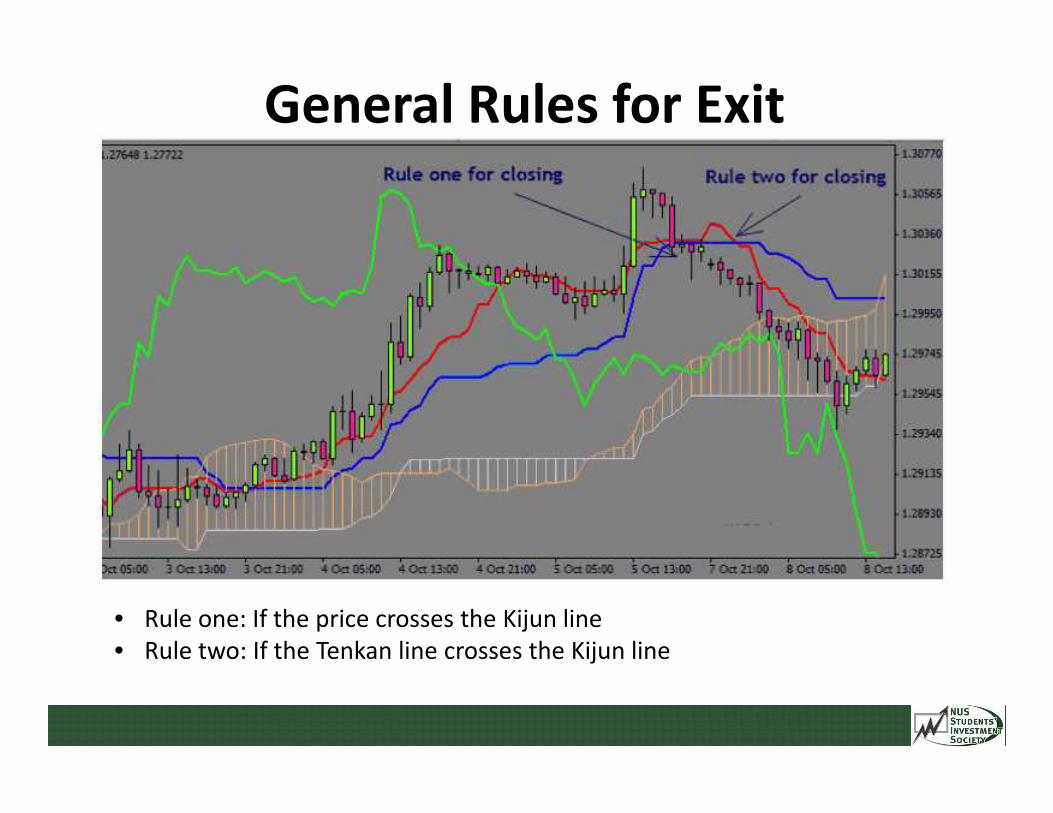
General Rules for Exit
• Rule one: If the price crosses the Kijun line• Rule two: If the Tenkan line crosses the Kijun line
1)
2)
SELL
3)
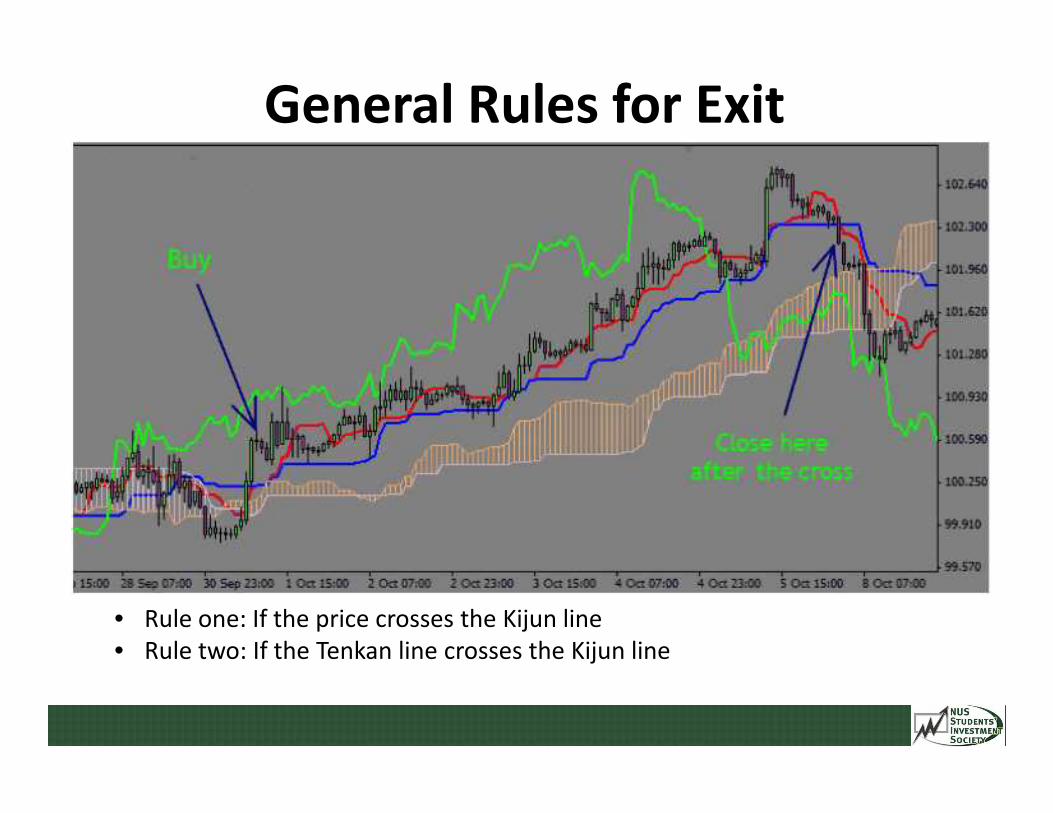
General Rules for Exit
• Rule one: If the price crosses the Kijun line• Rule two: If the Tenkan line crosses the Kijun line
1)
2)
SELL
3)
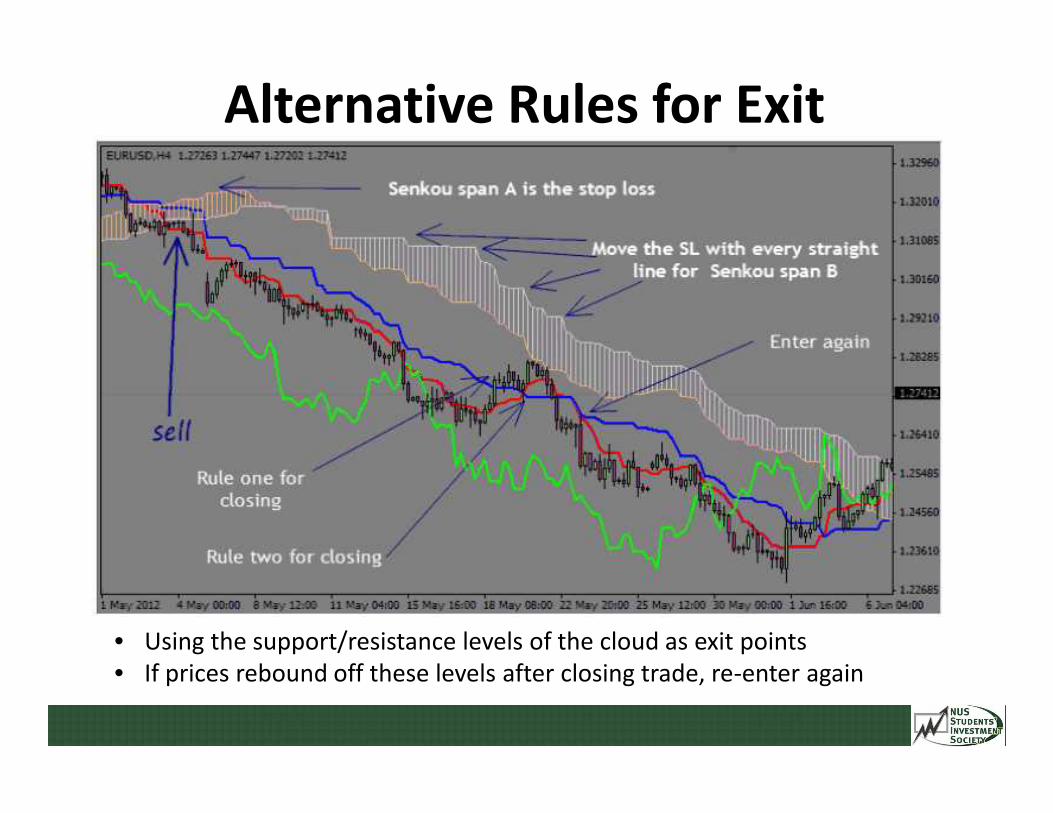
Alternative Rules for Exit
• Using the support/resistance levels of the cloud as exit points• If prices rebound off these levels after closing trade, re-enter again
1)
2)
SELL
3)
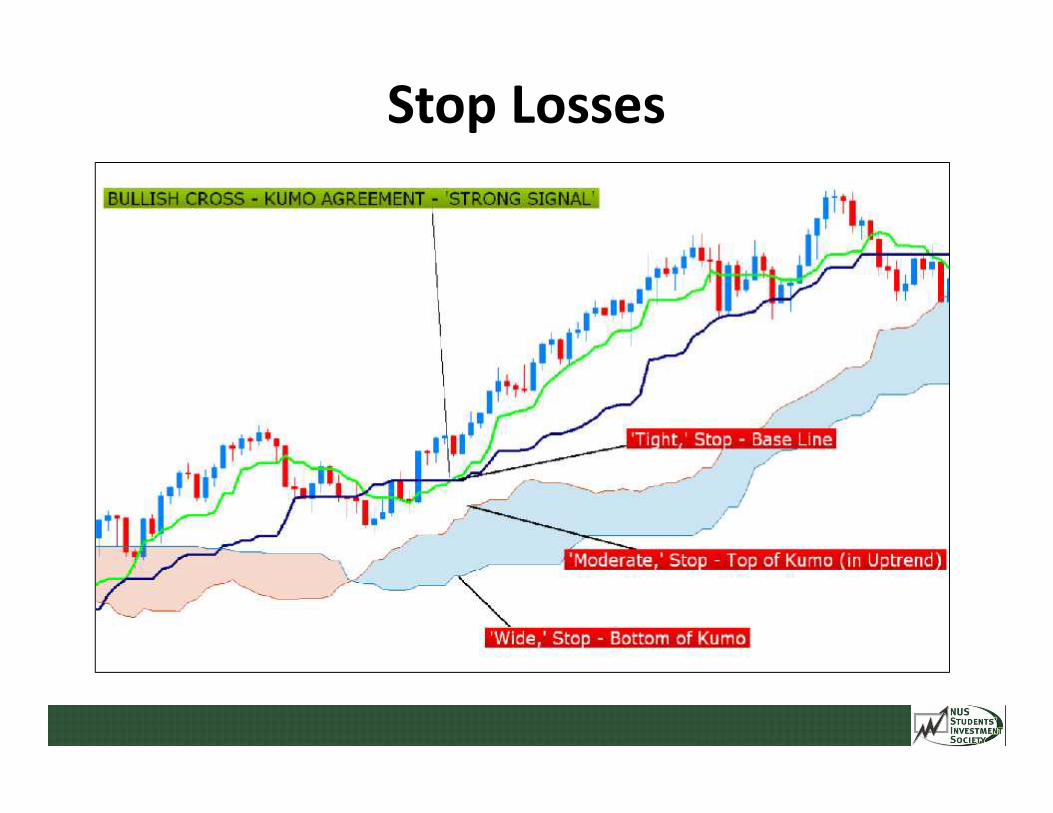
Stop Losses
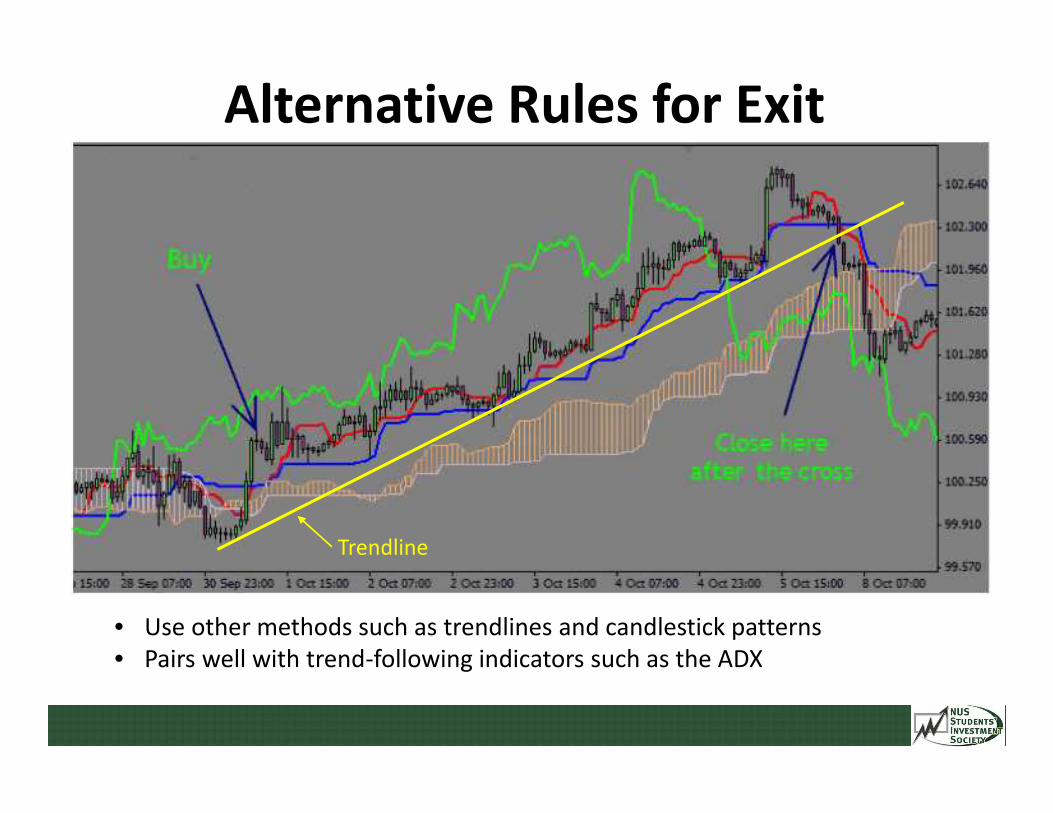
Alternative Rules for Exit
• Use other methods such as trendlines and candlestick patterns• Pairs well with trend-following indicators such as the ADX
1)
2)
SELL
3)
Trendline
Market Makers
Trade Examples
Market Makers
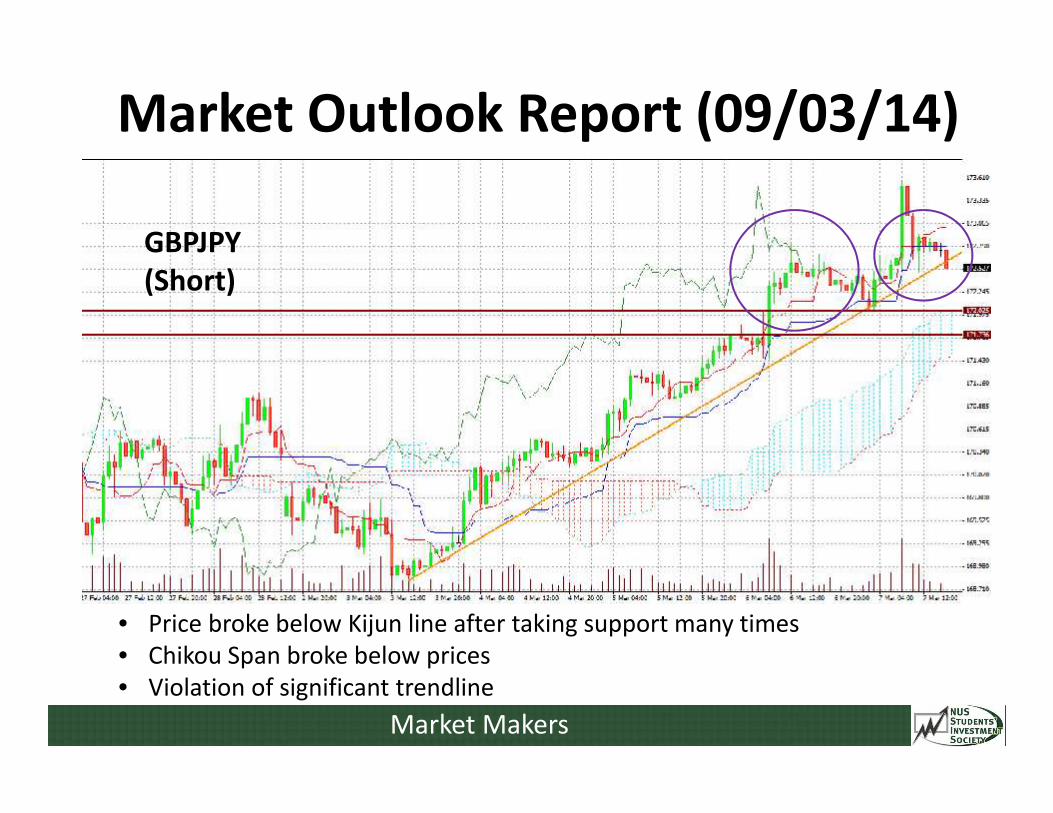
Market Outlook Report (09/03/14)
• Price broke below Kijun line after taking support many times• Chikou Span broke below prices• Violation of significant trendline
GBPJPY(Short)
Market Makers
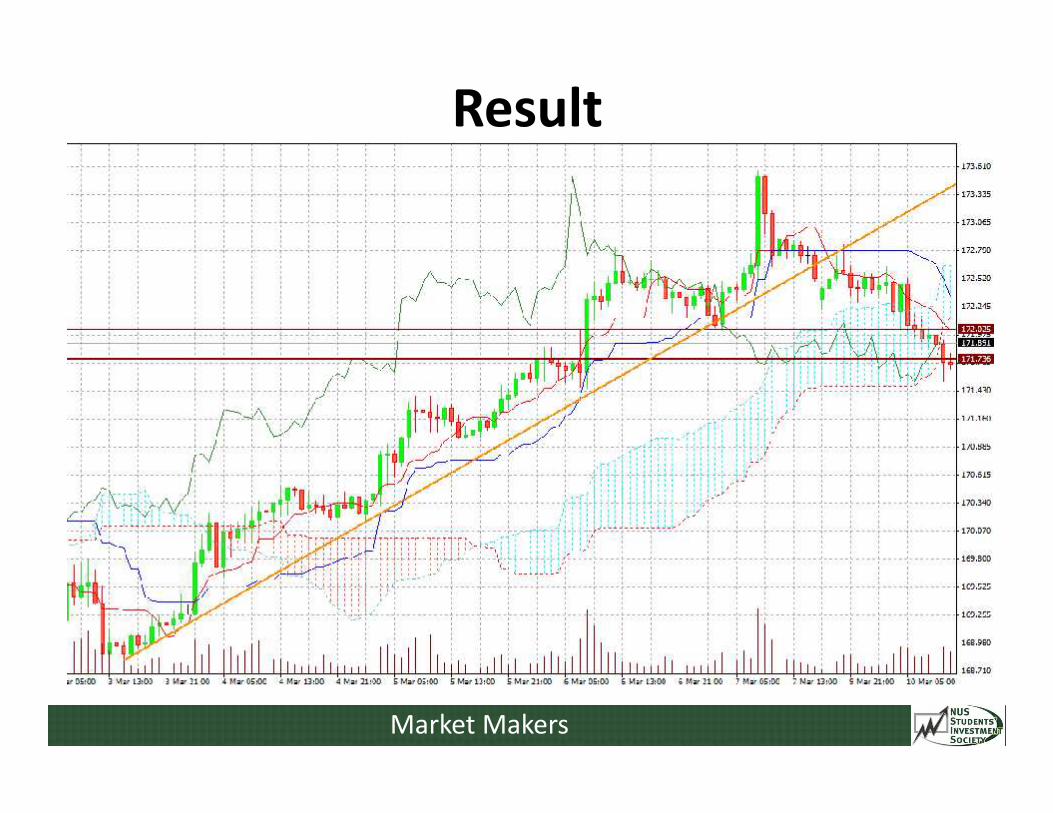
Result
Market Makers
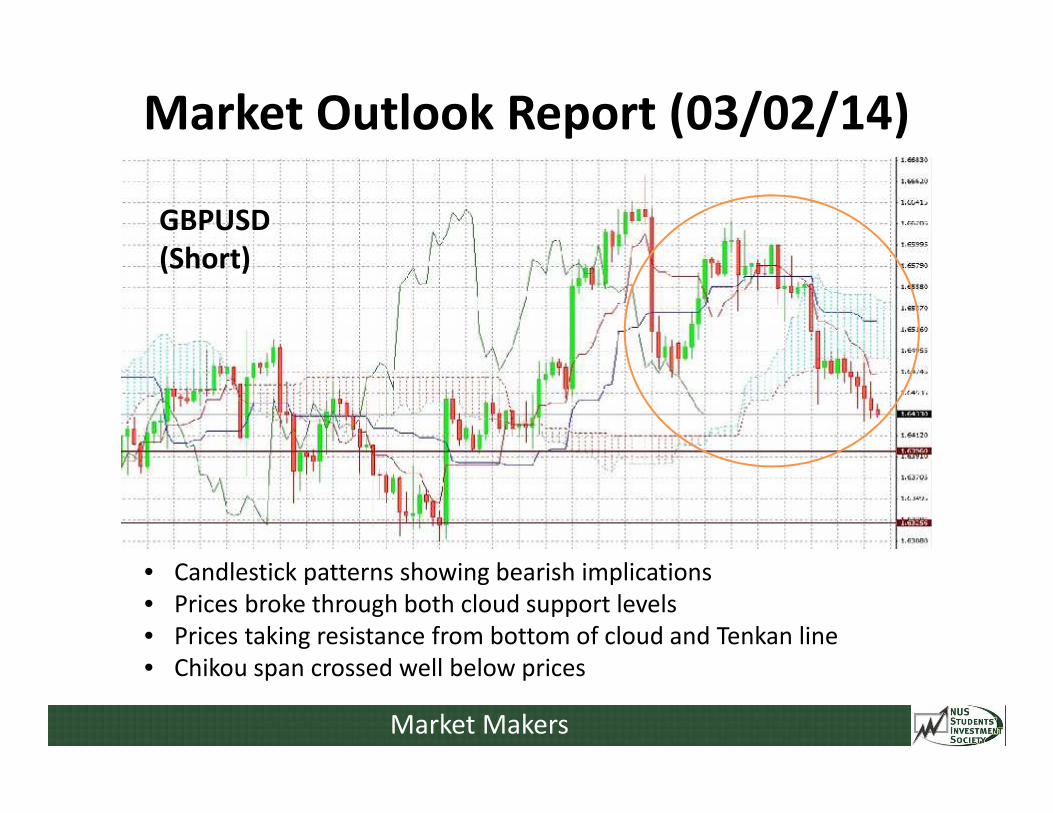
Market Outlook Report (03/02/14)
• Candlestick patterns showing bearish implications• Prices broke through both cloud support levels• Prices taking resistance from bottom of cloud and Tenkan line• Chikou span crossed well below prices
GBPUSD(Short)
Market Makers
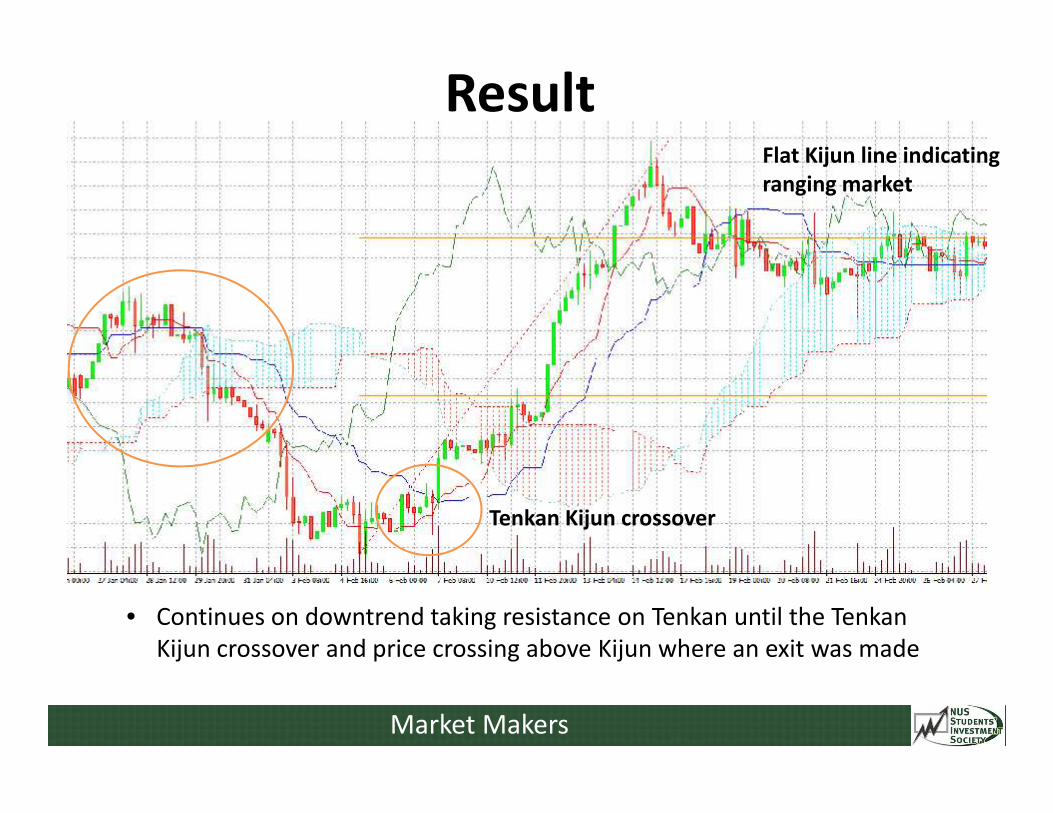
Result
• Continues on downtrend taking resistance on Tenkan until the TenkanKijun crossover and price crossing above Kijun where an exit was made
Tenkan Kijun crossover
Flat Kijun line indicatingranging market