tec 2009 a ttende e survey results - media.govtech.netmedia.govtech.net/digital_communities/quest...
TRANSCRIPT

TEC
Highlig
2009 A
ghts and A
Attende
Analysis
ee Surveey Res
Clarity
Busin
ults
WritteIan H
y Consulting,
ness Br
en by Hayes g, Inc.
ief
© 2009 Quest Software, Inc. All rights reserved.
This document contains proprietary information, which is protected by copyright. The software described in this document is furnished under a software license or nondisclosure agreement. This software may be used or copied only in accordance with the terms of the applicable agreement. No part of this document may be reproduced or transmitted in any form or by any means, electronic or mechanical, including photocopying and recording for any purpose other than the purchaser's personal use without the written permission of Quest Software, Inc.
WARRANTY
The information contained in this document is subject to change without notice. Quest Software makes no warranty of any kind with respect to this information. QUEST SOFTWARE SPECIFICALLY DISCLAIMS THE IMPLIED WARRANTY OF THE MERCHANTABILITY AND FITNESS FOR A PARTICULAR PURPOSE. Quest Software shall not be liable for any direct, indirect, incidental, consequential, or other damage alleged in connection with the furnishing or use of this information.
TRADEMARKS
Quest, Quest Software, the Quest Software logo, AccessManager, Aelita, Akonix, AppAssure, Benchmark Factory, Big Brother, BusinessInsight, ChangeAuditor, DataFactory, DeployDirector, DirectoryAnalyzer, DirectoryTroubleshooter, DNS Analyzer, DSExpert, ERDisk, Foglight, GPOAdmin, iToken, I/Watch, Imceda, InLook, IntelliProfile, InTrust, Invirtus, I/Watch, JClass, Jint, JProbe, LeccoTech, LiteSpeed, LiveReorg, LogADmin, MessageStats, Monosphere, NBSpool, NetBase, NetControl, Npulse, NetPro, PassGo, PerformaSure, Quest Central, Quest vToolkit, Quest vWorkSpace, ReportADmin, RestoreADmin, SelfServiceADmin, SharePlex, Sitraka, SmartAlarm, Spotlight, SQL LiteSpeed, SQL Navigator, SQL Watch, SQLab, Stat, StealthCollect, Storage Horizon, Tag and Follow, Toad, T.O.A.D., Toad World, vAutomator, vControl, vConverter, vFoglight, vOptimizer Pro, vPackager, vRanger, vRanger Pro, vSpotlight, vStream, vToad, Vintela, Virtual DBA, VizionCore, Vizioncore vAutomation Suite, Vizioncore vBackup, Vizioncore vEssentials, Vizioncore vMigrator, Vizioncore vReplicator, Vizioncore vTraffic, Vizioncore vWorkflow, Xaffire, and XRT are trademarks and registered trademarks of Quest Software, Inc in the United States of America and other countries. Other trademarks and registered trademarks used in this guide are property of their respective owners.
World Headquarters 5 Polaris Way Aliso Viejo, CA 92656 www.quest.com e-mail: [email protected] U.S. and Canada: 949.754.8000
Please refer to our Web site for regional and international office information.
June, 2009

i
CONTENTS
EXECUTIVE SUMMARY .................................................................................................. 1
SURVEY KEY POINTS ........................................................................................................ 1
INTRODUCTION ............................................................................................................ 3
ABOUT TEC .................................................................................................................... 4
GENERAL INFORMATION ..................................................................................................... 4 2009 HIGHLIGHTS .......................................................................................................... 4
SURVEY DEMOGRAPHICS ............................................................................................. 6
MOST SURVEY PARTICIPANTS ARE TECHNICIANS ........................................................................ 6 A MAJORITY WORK IN LARGE CORPORATE OR GOVERNMENT IT ORGANIZATIONS .................................. 7 TEC ATTENDEES SUPPORT LARGE NUMBERS OF USERS ................................................................ 7 MOST RESPONDENTS HAVE MULTIPLE RESPONSIBILITIES .............................................................. 8
HIGHLIGHTS AND ANALYSIS ........................................................................................ 9
I. CHALLENGES ........................................................................................................... 9 II. JOB SATISFACTION .................................................................................................. 12 III. CURRENT PRACTICES ................................................................................................ 18 IV. TECHNICAL ENVIRONMENTS ........................................................................................ 20 V. EXCHANGE ............................................................................................................ 24 VI. AUTOMATED TOOLS .................................................................................................. 26
ABOUT THE SURVEY ................................................................................................... 29
ABOUT QUEST SOFTWARE, INC. ................................................................................. 30
CONTACTING QUEST SOFTWARE ......................................................................................... 30 CONTACTING QUEST SUPPORT ........................................................................................... 30

Business Brief
1
EXECUTIVE SUMMARY
As a leading systems management vendor, Quest is committed to helping organizations leverage the power of Microsoft Windows through innovation, expertise and focus. Understanding the issues and needs of the directory, identity and Exchange management communities helps us build better products as well as provide organizations with knowledge and best practices that improve their productivity and efficiency.
This document summarizes the findings of a survey conducted at The Experts Conference (TEC) 2009, which Quest held March 22–25 in Henderson, Nevada. Our goal was to better understand our attendee organizations’ issues and how they prioritize them; their current tool usage; and their common practices for Windows infrastructure management tasks. In addition to providing the 2009 responses and analysis, this survey report also examines data from previous annual surveys to illustrate trends in areas such as practices and technology use.
Since 2005, Ian Hayes of Clarity Consulting, Inc. has been commissioned to conduct and analyze this survey. As a management consultant and industry analyst, Hayes has advised many Fortune 1000 companies on IT issues and is considered an expert on product positioning, service offerings and methodologies. He is a regular contributor to numerous business and IT publications and has authored three books.
Survey Key Points
Demographics
• TEC 2009 attracted 475 delegates from 217 companies in 20 countries.
• 240 attendees responded to this survey, representing a good cross section of organizations.
• Survey respondents are primarily technicians working for large corporate and governmental IT organizations; they are responsible for Active Directory (82%), Exchange (37%), Identity Lifecycle Manager (33%), and other Microsoft infrastructure technologies.
Findings
• Single sign-on is the toughest challenge for IT organizations. About 35% of respondents rate this area as “problematic” or “out of control.”
• User provisioning and de-provisioning (30%) and compliance reporting (28%) are the second and third toughest challenges.
• Getting better tools and automation is at the top of the respondents’ wish lists for the third year in a row.
• Despite the economy, the survey found that 70% of respondents are satisfied or very satisfied with their jobs, although strain is showing among the most experienced employees.
• Workload and work hours continue to top the respondents’ list of their jobs’ worst aspects.

TEC 2009 Attendee Survey Results
2
• Fulfilling audit requests still requires at least some manual effort for most IT organizations; only 11% of the respondents say they are fully automated, and half of them are not satisfied with the results.
• Only 31% of IT organizations consider their infrastructure management efforts to be well automated, showing no improvement in automation from 2008.
• About 22% of respondents rate the effectiveness of their organization’s identity and access management performance as “less effective.”
• SCOM/MOM is the most used IT management framework. It is used by 48% of respondents, easily besting second-place HP OpenView at 20%.

Business Brief
3
INTRODUCTION
As a leading provider of systems management solutions, Quest is a strong believer in performing and using research to better understand the issues, needs and best practices of the IT community. This knowledge that we acquire enables us to build superior products. It also provides us with vital information that we share freely with our partner community and other stakeholders.
The 2009 survey builds on the results of similar surveys conducted since 2005 at the Directory Experts Conference (DEC), TEC’s predecessor, enabling us to examine trends and industry changes across four years. We will continue to conduct these surveys at future TEC events and welcome suggestions for future questions and analysis areas.
This document summarizes the information captured through the survey, along with data analysis and trend highlights, as well as our insights on the implications of the findings. We believe it provides solid data for comparisons with peer organizations as well as issues for organizations to consider as they evaluate high-value opportunities for improvement and investment in directory, identity and Exchange management.

TEC 2009 Attendee Survey Results
4
ABOUT TEC
General Information
TEC began with the Directory Experts Conference (DEC) in 2002. This conference was originally designed to be a forum for experienced Active Directory users to meet, share experiences and advance their skills. Over the years, DEC expanded from its Active Directory roots to cover a broader scope of Microsoft identity and access (IDA) technologies. In 2009, we expanded our mission and included tracks for Directory Services, Identity Lifecycle Management, Federated Identity, Information Protection, and Exchange. To better reflect the skill level of our attendees, we renamed the event The Experts Conference. TEC emphasizes topics and best practices that help IT professionals manage and leverage their Microsoft technologies on a daily basis.
2009 Highlights
TEC is considered the premier conference for highly experienced users of Microsoft directory, identity and Exchange technologies. The eighth annual event was sponsored by Quest in partnership with Microsoft. TEC 2009 offered:
• In-depth, highly technical content
• One-on-one access to industry leaders and Microsoft program management
• Valuable networking
• Career advancement opportunities
The conference had two themes:
• The directory and identity theme was "Identity without Borders: Bringing the Identity Metasystem to the Enterprise." Attendees participated in three days of intense technical education on driving the security and manageability of the next generation enterprise.
• The Exchange theme was “Under the Hood: Architecting and Administering Exchange 2007, the Foundation for Unified Communications.” Exchange sessions focused on advanced education on Windows Exchange Server.
From its four preconference workshops to evening receptions and “birds of a feather” sessions, TEC 2009 was an exciting mix of fun, education and networking. During nearly 90 sessions, participants enjoyed presentations, interactive discussions and thought-provoking commentary by a renowned group of IDA and Exchange authorities, including top-rated strategists and speakers from Microsoft.

Business Brief
5
The many popular speakers and topics from the 2009 sessions included:
Microsoft VIPs: Stuart Kwan, group program manager, Federated Identity and Security; Nathan Muggli, senior lead program manager, Active Directory; and Mark Wahl, CISA, architect, Identity and Security Division. They delivered the opening keynote presentations.
Konstantin Ryvkin, senior technology architect at Microsoft, presented “Lessons Learned from Running Exchange at Microsoft.” Ryvkin drew from his experience architecting Microsoft’s 200,000-seat Exchange infrastructure to explain core aspects of what it takes to plan, build and run a large-scale distributed Exchange environment.
Pam Dingle, founder, Bonsai Identity, presented “The Survivalists Guide to Identity Management.” She shared tips and tricks on how to achieve “enlightened bottom-up” identity management by selecting the right point solutions that provide strategic agility to the business while pre-emptively reducing complexity for the future.
Gil Kirkpatrick, Quest chief architect, Sean Deuby, Advaiya senior enterprise solutions strategist, and Brian Desmond, Moran Technology senior consultant, hosted a “birds of a feather” session in which they introduced attendees to Microsoft’s new “Thrive” program, which is designed to help IT professionals manage their careers during the downturn. Desmond also shared his stories regarding the pitfalls of outsourcing infrastructure management, including Active Directory and Exchange.
Bahram Rushenas of Microsoft Consulting Services conducted a pre-conference workshop titled “Implementing Provisioning and Group Management with ILM “2” Without Writing Any Code!” He demonstrated how a provisioning scenario, including an approval process, can be easily implemented with ILM “2” without programming code.

TEC 2009 Attendee Survey Results
6
SURVEY DEMOGRAPHICS
The TEC survey attracted 240 respondents out of 475 overall attendees for a strong response rate of slightly more than 50% in 2009. Previous surveys had response rates of 50% (280 respondents/565 attendees in 2008), 47% (314/675 in 2007), 44% (235/530 in 2006) and 38% (101/267 in 2005). Given the rate and breadth of participation, we are confident that the survey results constitute a representative sample of attendee roles and organizations. The survey’s sample size is large enough to support a variety of statistically valid breakdowns into subgroups. These groupings will enable readers to more accurately compare their organizations and experiences with those of their peers.
This section provides an understanding of the survey participants’ demographic makeup for context of the subsequent results.
Most Survey Participants Are Technicians
Breakdown by Job Category
Because TEC is a premier advanced training event, respondents are almost entirely “hands-on” practitioners—that is, respondents who selected a job category of administrator, consultant, systems engineer, or “other” and specified technician.
Table 1. Breakdown by Job Category
• Half of the TEC survey respondents are either systems engineers or architects. Systems engineer returned to first place as the most popular attendee category. The architect category, introduced in the 2008 survey, dropped to 22% in 2009 to take second place.
• After a drop in 2008, the percentage of consultant attendees returned to 19% in 2009, about what was seen in earlier surveys.
• In a change from previous surveys, respondents choosing the other category were mostly non-IT managers, including general managers, product managers, sales directors, and salespeople.
2009 2008 2007 2006 2005Administrator 10% 9% 7% 6% 10%Architect 22% 34% NA NA NAConsultant 19% 11% 19% 21% 18%Systems Engineer 28% 30% 40% 40% 46%Systems or Business Analyst 2% 5% 6% 6% 6%IT Manager, Director, VP 14% 8% 16% 11% 14%Other 5% 4% 11% 11% 7%Industry Analyst/Trade Press <1% <1% 1% NA NABlank 0% 0% 0% 4% 0%
Business Brief
7
A Majority Work in Large Corporate or Government IT Organizations
Breakdown by Organization Type
• TEC attracts a healthy mix of attendees from IT organizations and companies providing software and services. The tight economy in 2009, combined with IT travel and spending restrictions, shifted the ratio of IT vs. vendor participants as compared to previous years.
o 132 (or 55%) of respondents are members of either a corporate (42%) or government (13%) IT organization. In 2008, slightly more than 75% of respondents were from IT organizations.
o Non-IT respondents include consulting firms (20%, up from 13% in 2008), service providers and software providers (16%, up from 4% in 2008).
• To provide a more accurate picture of best practices and technology usage patterns, this analysis will break out government and commercial IT organizations separately, where appropriate. Each analysis will note whether it refers to overall survey responses or specifically to IT responses.
Breakdown by IT Organization Size
Corporate and government IT respondents are mostly from large organizations. Of IT respondents indicating the size of their IT organizations (128 out of 132), the following facts emerged:
• 91% are from IT organizations with more than 100 employees.
• A remarkable 71% work for very large IT organizations with more than 1,000 employees.
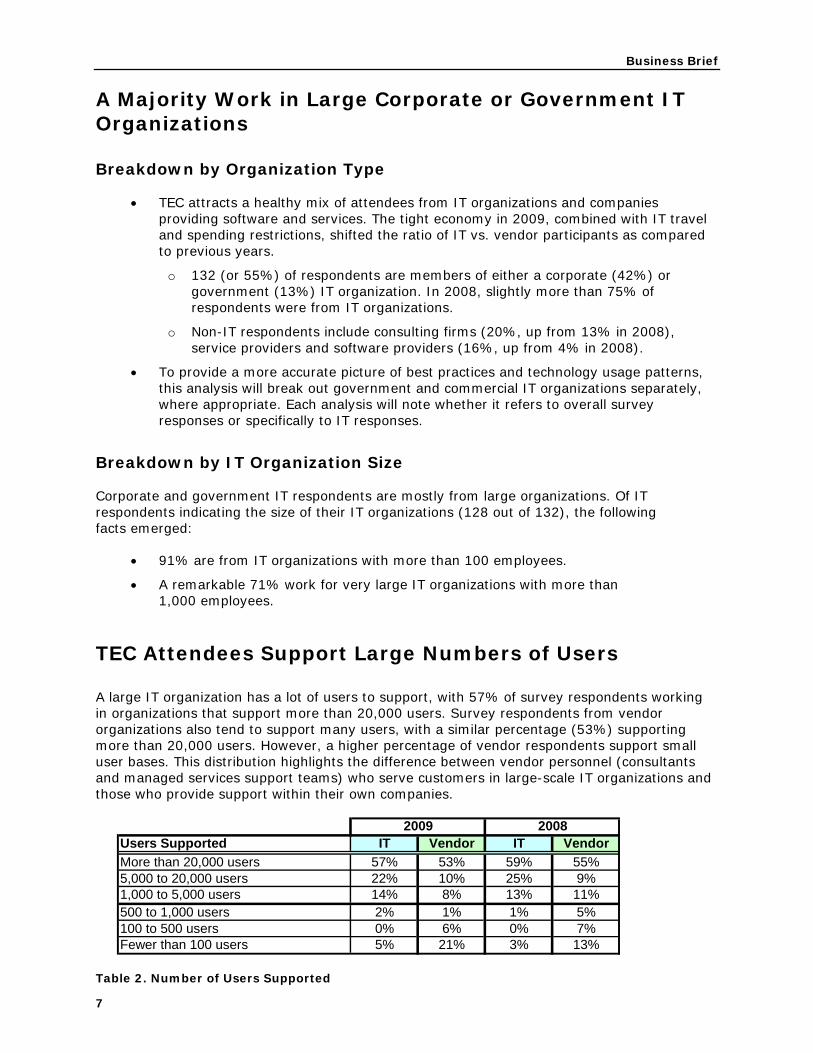
TEC Attendees Support Large Numbers of Users
A large IT organization has a lot of users to support, with 57% of survey respondents working in organizations that support more than 20,000 users. Survey respondents from vendor organizations also tend to support many users, with a similar percentage (53%) supporting more than 20,000 users. However, a higher percentage of vendor respondents support small user bases. This distribution highlights the difference between vendor personnel (consultants and managed services support teams) who serve customers in large-scale IT organizations and those who provide support within their own companies.
Table 2. Number of Users Supported
Users Supported IT Vendor IT VendorMore than 20,000 users 57% 53% 59% 55%5,000 to 20,000 users 22% 10% 25% 9%1,000 to 5,000 users 14% 8% 13% 11%500 to 1,000 users 2% 1% 1% 5%100 to 500 users 0% 6% 0% 7%Fewer than 100 users 5% 21% 3% 13%
2009 2008

TEC 2009 Attendee Survey Results
8
Most Respondents Have Multiple Responsibilities
Technology Responsibilities
The table below provides a breakdown of IT organization attendees by areas of technology responsibility. As expected, given the history and focus of the conference, the majority of attendees have responsibility for AD. However, the mix of responsibilities has evolved as the conference has broadened its mission to include an Exchange track and to incorporate all Microsoft IDA technologies.
Survey respondents could specify multiple areas of responsibility. Of those listing their responsibilities, only 17% support a single technology. About 47% support at least three of the listed technologies, and 1% support all eight listed technologies.
Table 3. Technology Responsibilities
Organizational Responsibilities
In 2008, the survey was refined to split the technology and organizational responsibilities used in earlier surveys. Administration (64%) and operations (61%) are the two most prevalent responsibilities for respondents from IT organizations, while the division of roles is more balanced among vendor respondents. Again, respondents were able to specify multiple choices. Of those IT respondents listing their responsibilities, 48% support at least three of the listed roles, and 26% support only one role. It is interesting to note how these roles overlap. Of those IT respondents specifying responsibility for user support, 88% also have responsibility for administration and 84% include operations. Those listing audit/compliance responsibilities typically have additional operations (70%), administration (84%) and security (78%) responsibilities.
Table 4. Organizational Responsibilities
Technology 2009 2008 2007 2006 2005Active Directory 82% 81% 72% 90% 96%DNS 48% 48% 43% 54% 59%Exchange 37% 27% 15% 19% 29%MIIS/ILM 33% 46% 36% 39% 24%SharePoint 16% 19% 16% NA NANon-Microsoft Platforms 12% 15% 7% NA NAEntire Network 10% 11% 8% 13% 14%OCS 14% - - - -Other 15% 11% 8% 14% 9%
Organizational Role IT Vendor IT VendorOperations 61% 15% 68% 44%Administration 64% 17% 67% 52%User Support 37% 7% 31% 21%Software Development 16% 15% 17% 40%Audit/Compliance 28% 9% 39% 35%Security 46% 16% 57% 56%Other 13% 8% 13% 13%
20082009

Business Brief
9
HIGHLIGHTS AND ANALYSIS
I. Challenges
The TEC survey was modified in 2009 to improve its ability to identify operational problem areas within the IDA community. This year’s survey asked respondents to rate 13 areas by the level of challenge they present to the respondents’ organizations. These areas were:
• Password management • User provisioning/de-provisioning • Delegating administrative rights • Server configuration • Security configuration • GPO administration • Compliance reporting • Diagnostic and repair • Back up/archiving • Data recovery • Disaster recovery • Single sign-on • Two-factor authentication
The rating options were “out of control,” “problematic,” “manageable,” “handling well,” and “non-issue.”
Plenty of Opportunity to Improve Performance in Key Areas
While survey responses show considerable diversity in how respondents rate the areas, clear patterns emerge, making it simple to rank the ones that are the most challenging, as well as to identify those most likely to be handled well. The following two charts contrast the most problematic areas with the least problematic ones for all respondents. The two categories are similar when viewed by the percentages of respondents rating them as “manageable,” but strong differences appear when comparing the low (“out of control” and “problematic”) and high ratings (“handling well” and “non-issue”).
Most Problematic Areas
0%
5%
10%
15%
20%
25%
30%
35%
40%
Out of control Problematic Manageable Handling well Non-issue
% R
espo
nden
ts
Delegating administrative rightsUser provisioning/de-provisioningCompliance reportingSingle sign-on

TEC 2009 Attendee Survey Results
10
Highlights
• Of the 11 challenge areas that appear in both the 2009 and 2008 surveys (single sign-on and two-factor authentication were added in 2009), most showed improvement over last year.
o Among IT organizations, only back up/archiving (-2%) and diagnostic and repair (-5%) show a drop in net positive vs. negative responses. Delegating administrative rights (16%) and user provisioning/ de-provisioning (15%) show the greatest improvement over 2008.
o Among vendor respondents, all challenge areas show improvement over 2008, with the greatest improvements in diagnostic and repair (22%) and compliance reporting (21%).
• Many factors affect the rating of a given area, including its effort requirements, level of risk, tediousness and time pressures, but the quality of available automation is a significant influence. As illustrated in the Automated Tools section of this report (page 26), problematic areas such as single sign-on and compliance reporting are equally weak in terms of quality of automation.
Single Sign-on Is the Top Challenge, Followed by User Provisioning/De-provisioning and Compliance Reporting
The top challenges were ranked by adding the percentage of respondents rating a given area as either “out of control” or “problematic.” As shown in Table 5 (next page), IT and vendor respondents agree on the top issues.
Best Handled Areas
0%
5%
10%
15%
20%
25%
30%
35%
40%
Out of Control Problematic Manageable Handling Well Non-Issue
% R
espo
nden
ts
Server configurationData RecoveryBack up / ArchivingGPO administration

Business Brief
11
Table 5. The Most Challenging Areas
• Single sign-on was newly added to the 2009 survey and captured a solid first place as a challenge for both IT and vendor respondents. Pressures to maintain security while simplifying user access to multiple systems make single sign-on a much desired solution; however, implementation is fraught with practical and technical problems. Only 21% of IT respondents believe their organizations are handling this area well, compared to 35% who consider it an issue. The quality of available automation is part of the problem; 63% of the IT respondents rate their available solutions as only “fair” or “poor.” Although still in first place, the issue is slightly less troublesome among vendor respondents, with 33% reporting that their organizations handle single sign-on well, compared to 27% who consider it a problem.
• User provisioning/de-provisioning took second place among IT respondents, with 30% rating this area negatively. This total includes 23% who rate it “problematic” and 7% who rate it as “out of control” in their organizations. However, not all IT organizations struggle in this area—32% rate it as “handled well” and 7% as a “non-issue,” a significant improvement over last year’s survey.
• Compliance reporting remains one of the top issues facing TEC attendees. Only 33% of overall respondents feel that their organization is handling it well, while 24% (the average for IT and vendor respondents) consider it to be either “problematic” or “out of control.” Among vendor respondents, compliance reporting improved significantly, moving down from first place in 2008 to third place in 2009. The percentage of vendor respondents rating it either “out of control” or “problematic” decreased from 30% in 2008 to 19% in 2009.
• Delegating administrative rights is another tedious task fraught with potential security and compliance risks. Dropping from second place in 2008 to fourth place in this survey, it still presents a challenge to 23% of the responding IT organizations.
Practice Makes Perfect—the Most Routine Tasks Are the Least Challenging
With the exception of single sign-on, about one third of respondents rate the survey challenges as “manageable.” However, as shown in the table on the next page, many respondents report that their organizations have routine operational challenges such as server configuration, back up/archiving, and data recovery well under control. For the second year in a row, most IT respondents (52%) believe they have server configuration solidly under control, followed by back up/archiving (48%) and data recovery (46%).
Top Issues (IT) Negative Top Issues (Vendors) Negative1 Single sign-on 35% 1 Single sign-on 27%2 User provisioning/de-provisioning 30% 2 User provisioning/de-provisioning 19%3 Compliance reporting 28% 3 Compliance reporting 19%4 Delegating administrative rights 23% 4 Delegating administrative rights 18%5 Password management 21% 5 Password management 17%6 Two-factor authentication 17% 6 Two-factor authentication 17%7 Disaster recovery 17% 7 Disaster recovery 10%8 Security configuration 14% 8 Security configuration 9%9 Diagnostic and repair 13% 9 GPO administration 8%
10 Back up/archiving 13% 10 Server configuration 6%11 GPO administration 11% 11 Back up/archiving 6%12 Data recovery 9% 12 Diagnostic and repair 5%13 Server configuration 7% 13 Data recovery 5%

TEC 2009 Attendee Survey Results
12
Table 6. The Least Challenging Areas
II. Job Satisfaction
Job satisfaction was added to the survey in 2007 with the goal of discovering whether TEC attendees are working at jobs they truly love. This year’s survey is especially interesting because it provides the opportunity to compare three years of data to assess the impact of the current economic climate on factors such as work hours and job satisfaction. As in previous years, respondents were not shy about expressing their likes, dislikes and ideas for improving their jobs.
Job Satisfaction Demographics
In this analysis, we examined overall job satisfaction, but we also broke it down by various demographics. These include organization type, organization size, job title (discussed in the previous section of this report), and years of job experience. As the chart demonstrates, the average experience of TEC respondents increased slightly from 2008, with the growth concentrated in attendees with more than 10 years of experience. Survey respondents are truly experts—74% have more than five years of infrastructure support experience.
Solid Performance (IT) Positive Solid Performance (Vendors) Positive1 Server configuration 52% 1 Two-factor authentication 47%2 Back up/archiving 48% 2 Server configuration 44%3 Data recovery 46% 3 Password management 44%4 GPO administration 45% 4 GPO administration 44%5 Password management 44% 5 Back up/archiving 44%6 Two-factor authentication 43% 6 Data recovery 44%7 Security configuration 39% 7 Security configuration 42%8 User provisioning/de-provisioning 39% 8 Diagnostic and repair 41%
9 Disaster recovery 39% 9 User provisioning/de-provisioning 39%10 Delegating administrative rights 37% 10 Disaster recovery 38%11 Diagnostic and repair 34% 11 Compliance reporting 35%12 Compliance reporting 31% 12 Delegating administrative rights 34%13 Single sign-on 21% 13 Single sign-on 33%
Distribution by Job Experience
0%
5%
10%
15%
20%
25%
30%
35%
40%
45%
Less than 1year
1 to 2 years 3 to 4 years 5 to 10 years Over 10 years
200720082009

Business Brief
13
Overall Job Satisfaction Declined Very Slightly from 2008
Despite the poor economy, TEC professionals continue to have high job satisfaction, with 70% saying they are satisfied or very satisfied with their jobs. However, when scores are averaged across all respondents, overall job satisfaction is on a slight downward trend, falling from an average of 4.03 in 2007 to 3.88 in 2008 and 3.82 in 2009. In 2009, growth in the percentage of very satisfied respondents was offset by a significant increase in the percentage of very dissatisfied respondents, whose percentage jumps from 3% in 2008 to 8% in 2009.
Who Are the Happiest TEC Attendees?
When it comes to job satisfaction, the type of company, level of job experience and specific job responsibilities all matter. Consider the following findings:
• Type of organization – In 2009, the happiest respondents work for consulting firms, with 81% reporting that they are satisfied or highly satisfied. Software vendor personnel, who were the happiest employees in 2007 and 2008, saw satisfaction drop from 92% in 2008 to 74% in 2009, while dissatisfied employees increased from 0% to 18%.
• Job experience – Employees with one to two years of experience top the list in satisfaction, a surprising result given their last place finish in 2008. Employees with 5 to 10 years of experience follow closely behind.
• Responsibilities – The challenge of working with clients in a varying mix of situations is rewarding—respondents with a job title of consultant report a 78% level of satisfaction, taking first place and edging out systems or business analysts, who take a close second place.
Who Are the Least Happy TEC Attendees?
In 2009, we saw many shifts in satisfaction among the various categories of TEC attendees. For example, consulting firm personnel moved from last place in satisfaction in 2008 to first place in 2009, while the rate for previously satisfied personnel, such as software vendors and employees with more than 10 years of experience, dropped significantly.
• Type of organization – According to the results, software vendors have the highest percentage of dissatisfied employees at 18%, but 74% of these respondents also say they’re happy. In contrast, only 3% of government IT employees say they’re dissatisfied, but just 55% of them report above-average job satisfaction, a much smaller portion than software vendor personnel who say they’re happy.
• Job experience – Breaking into infrastructure management can be tough given workloads and a stiff learning curve. This year, respondents with less than one year of experience were the least satisfied.
Distribution by Job Satisfaction
0%
5%
10%
15%
20%
25%
30%
35%
40%
45%
VeryDissatisfied
Dissatisfied Average Satisfied Very Satisfied
200720082009
TEC 2009 Attendee Survey Results
14
• Responsibilities – By job title, architects dropped from 69% satisfaction in 2008 to 62% in 2009, with 16% expressing negative levels of satisfaction.
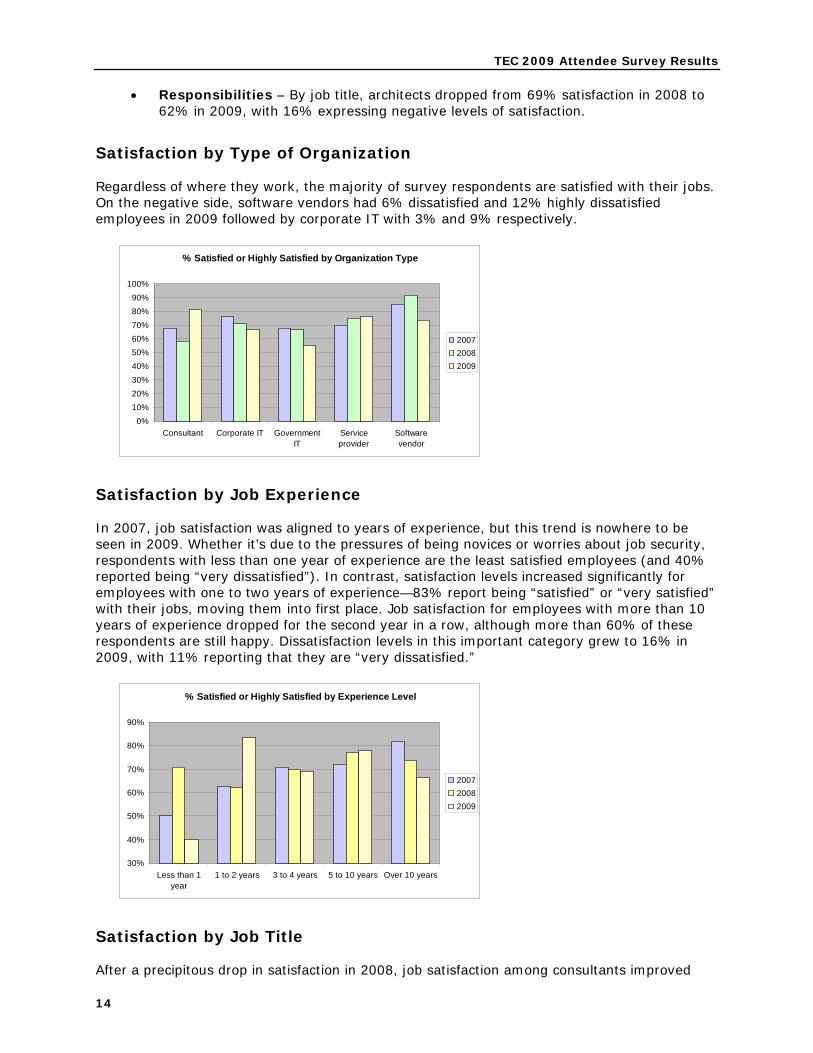
Satisfaction by Type of Organization
Regardless of where they work, the majority of survey respondents are satisfied with their jobs. On the negative side, software vendors had 6% dissatisfied and 12% highly dissatisfied employees in 2009 followed by corporate IT with 3% and 9% respectively.
Satisfaction by Job Experience
In 2007, job satisfaction was aligned to years of experience, but this trend is nowhere to be seen in 2009. Whether it’s due to the pressures of being novices or worries about job security, respondents with less than one year of experience are the least satisfied employees (and 40% reported being “very dissatisfied”). In contrast, satisfaction levels increased significantly for employees with one to two years of experience—83% report being “satisfied” or “very satisfied” with their jobs, moving them into first place. Job satisfaction for employees with more than 10 years of experience dropped for the second year in a row, although more than 60% of these respondents are still happy. Dissatisfaction levels in this important category grew to 16% in 2009, with 11% reporting that they are “very dissatisfied.”
Satisfaction by Job Title
After a precipitous drop in satisfaction in 2008, job satisfaction among consultants improved
% Satisfied or Highly Satisfied by Organization Type
0%10%20%30%40%50%60%70%80%90%
100%
Consultant Corporate IT GovernmentIT
Serviceprovider
Softwarevendor
200720082009
% Satisfied or Highly Satisfied by Experience Level
30%
40%
50%
60%
70%
80%
90%
Less than 1year
1 to 2 years 3 to 4 years 5 to 10 years Over 10 years
200720082009

Business Brief
15
sufficiently to capture first place in 2009. Consultant was the only job category where the percentage of “satisfied” and “very satisfied” respondents increased from 2008; the number of negative responses dropped from 11% in 2008 to 7% in 2009. Although the percentage of satisfied administrators is flat from 2008, this category reported no “dissatisfied” or “highly dissatisfied” responses in 2009, a significant improvement from the 13% negative response in 2008. Systems or business analysts also do not report negative responses.
Most IDA Professionals Work Between 40 and 50 Hours Per Week
When weighted and averaged across all respondents, the typical IDA professional works 48.1 hours per week, up from 46.7 in 2008. As shown in table 7, more than 50% report working between 40 and 50 hours per week. This category dropped from 64% in 2008, as respondents moved into the longer-hour categories. Still, despite complaints about excessive hours, very few respondents consistently work more than 60 hours per week.
Table 7. Distribution by Average Work Hours
Managers Put in the Longest Hours
IT managers, directors and VPs work the highest number of weekly hours, increasing by almost four hours per week over last year’s survey. The other category shows the biggest overall increase in the number of hours, but this difference is likely due to changes in the mix of respondents classifying themselves in this category. Conversely, administrators and analysts report a significant drop in weekly hours, perhaps reflecting cutbacks in new IT projects.
% Satisfied or Highly Satisfied by Job Title
40%
45%
50%
55%
60%
65%
70%
75%
80%
85%
90%
Architect Administrator SystemsEngineer
IT Manager,Director, VP
Systems orBusinessAnalyst
Consultant
200720082009
Hours Worked per Week PercentageLess than 35 2%35 to 40 14%40 to 50 51%50 to 60 26%60 to 80 5%Over 80 hours 2%
TEC 2009 Attendee Survey Results
16
Table 8. Average Hours by Title
Software Vendor Employees Take First Place for Hours Worked
For most organization types, the number of work hours crept upward in 2009. The change is most pronounced in the vendor categories as tight market conditions and hiring constraints force employees to work harder to get business. Software vendor respondents reported the greatest increase in hours, taking first place for total hours away from consultants for the first time in this survey. Corporate IT hours are up only slightly from 2008, but government IT employees report an average decrease of 2.3 hours per week, a drop of almost 5% from the previous year.
Table 9. Average Hours by Organization Type
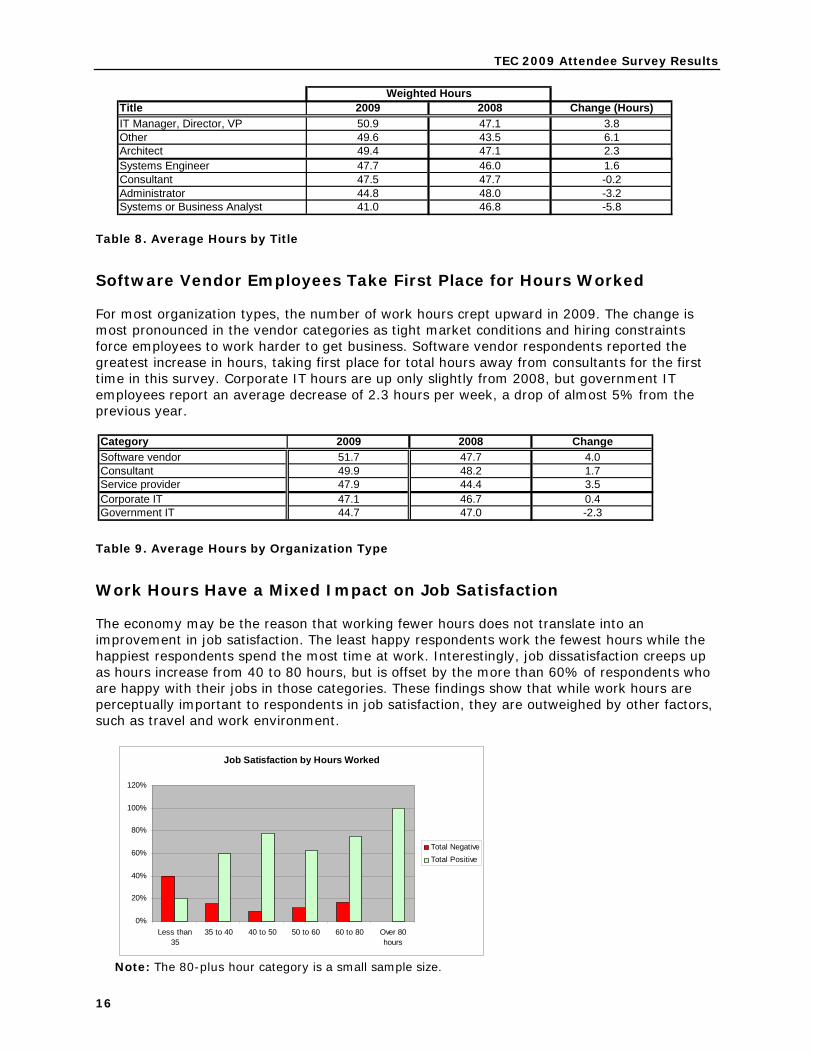
Work Hours Have a Mixed Impact on Job Satisfaction
The economy may be the reason that working fewer hours does not translate into an improvement in job satisfaction. The least happy respondents work the fewest hours while the happiest respondents spend the most time at work. Interestingly, job dissatisfaction creeps up as hours increase from 40 to 80 hours, but is offset by the more than 60% of respondents who are happy with their jobs in those categories. These findings show that while work hours are perceptually important to respondents in job satisfaction, they are outweighed by other factors, such as travel and work environment.
Note: The 80-plus hour category is a small sample size.
Title 2009 2008 Change (Hours)IT Manager, Director, VP 50.9 47.1 3.8Other 49.6 43.5 6.1Architect 49.4 47.1 2.3Systems Engineer 47.7 46.0 1.6Consultant 47.5 47.7 -0.2Administrator 44.8 48.0 -3.2Systems or Business Analyst 41.0 46.8 -5.8
Weighted Hours
Category 2009 2008 ChangeSoftware vendor 51.7 47.7 4.0Consultant 49.9 48.2 1.7Service provider 47.9 44.4 3.5Corporate IT 47.1 46.7 0.4Government IT 44.7 47.0 -2.3
Job Satisfaction by Hours Worked
0%
20%
40%
60%
80%
100%
120%
Less than35
35 to 40 40 to 50 50 to 60 60 to 80 Over 80hours
Total NegativeTotal Positive

Business Brief
17
Learning New Technologies, Working with Others, and Constant Challenges Are the Best Parts of the Job
For the third year in a row, the ability to continuously learn and work with new technologies was by far the most popular answer to an open-ended question about the best aspects of respondents’ jobs. Despite stereotypes of technicians as solitary contributors, working with others—including teammates and customers—was the second most listed positive job aspect. Respondents in this category had high praise for the caliber of their co-workers and enjoyed helping customers solve problems. Many respondents enjoy encountering and handling a constant stream of new challenges. Interestingly, only one respondent mentioned compensation as the best aspect of the job in 2009. The variety of responses was enormous, but other positive job aspects include:
• The opportunity to develop innovative solutions to tough problems
• Investigating, evaluating and implementing new technologies
• Freedom or empowerment to make individual decisions on what is needed
• Ability to work on many varied assignments
• Ability to contribute input to technical and business strategies
• Level of responsibility and impact on company operations
Workload/Work Hours Top the List of the Worst Aspects of the Job
A heavy workload with long work hours and the associated stress continue to be the most negative aspect of respondents’ jobs. The effect of the poor economy can be seen in the rise of complaints about tight budgets, uncertainty, lack of resources, and the pressures and expectations imposed by having to do more with less. Organizational politics is tied with “administrivia” (paperwork, bureaucracy and other non-technical overhead) for second place as the biggest job annoyances. Respondents weren’t shy about their complaints, and their issues ran the gamut from managers who don’t understand technology to undesirable assignments and tools that don’t work. Other frequently mentioned issues include:
• Excessive travel
• Deadline and schedule pressures
• Job stress
• People issues around technical knowledge and work ethic (includes co-workers and users)
• Poorly defined roles and overlapping responsibilities
• Lack of structure and poor planning
• Slow decision-making
Getting Better Tools and Automation Tops Respondents’ Wish Lists for the Third Year in a Row
TEC attendees understand the value of automation—getting better tools to increase automation is consistently the most requested job improvement, accounting for 18% of all suggestions.
However, the impact of the poor economy is clearly felt in this year’s wish list, as higher pay dropped to 10th place (4% of all suggestions), falling well below the 6th-place pleas for a better economy. Second place was dominated by suggestions to replace or improve respondents’

TEC 2009 Attendee Survey Results
18
managers or executives (11% of all suggestions). Hiring or adding more people tied with getting better direction from management for the third most commonly mentioned improvement. Other frequently mentioned improvements include:
• Getting clearer direction and prioritization from managers
• Having more autonomy when making technical decisions
• Ability to telecommute or spend more time working from remote locations
• Improving the delegation of tasks within the organization
• Improving processes to increase efficiency
• Stronger enforcement of technical policies
• Additional or better training
III. Current Practices
Ratings of the Effectiveness of Identity and Access Management Continues to Increase
Although identity and access management practices are still evolving in many organizations, the level of expertise is increasing yearly, especially within the vendor community. Among IT organizations, 23% consider themselves “better than average” and 5% view themselves as “world-class.” In contrast, vendor respondents rate themselves 40% and 28% respectively. Among IT organizations, 39% of respondents rate their organizational performance as “novices” or “less effective than we wish.” Overall, the respondents rate their organizations as follows:
• 45% consider themselves either “world class” (15%) or “better than average” (30%).
• 28% rate their performance as “adequate.”
• 22% consider themselves as “less effective than we wish.”
• 5% consider themselves “novices”—down from 11% in 2008.
Most IT Organizations That Follow Formal Infrastructure Management Processes Consider Them to Be Overly Bureaucratic
Slightly more than 50% of IT respondents report that they follow formal system support processes. Of these, 20% consider those processes formal and effective, while 31% consider them overly bureaucratic.
Many IT organizations (38%) report their processes as falling in between formal and informal. Only 18% report following informal processes and 3% rate those processes as tending towards chaotic. Fewer vendor respondents follow formal processes (45%), but only 14% consider those processes overly bureaucratic.
Schema Extensions Are Usually Controlled Through Formal Processes
The majority of IT organizations (62%, up from 57% in 2008) follow formal processes for handling schema extensions. About 25% use processes that fall between formal and informal and 16% use informal processes. The need to control schema extensions appears to be well

Business Brief
19
understood; only 13% consider their processes overly bureaucratic, a mere 9% are informal (tending to be chaotic), and 10% do not allow any schema extensions.
Use of Role-based Delegation Passes the 50% Adoption Mark
As predicted in last year’s survey analysis, more than 50% of TEC survey respondents are currently using role-based delegation in their organizations. Another 14% of respondents plan to implement role-based delegation in 2009. Among IT respondents, 25% are still considering, but only 10% have no plans to implement it. Fewer vendor respondents (18%) are still considering and 16% have no plans to implement role-based delegation.
Table 10. The Adoption of Role-based Delegation
Adoption of Role-based Access Control Catches Up to Role-based Delegation
Adoption of role-based access control grew rapidly over the past year; overall adoption reached 51%, up from 44% in 2008. Survey respondents now report almost identical usage patterns as for role-based delegation, meeting predictions in last year’s survey analysis. While future growth will slow somewhat, we expect both role-based practices to move forward in synch.
The Pace of Identity Federation Adoption Is Accelerating
Usage of identity federation has grown significantly over the past three years, growing from 4% of overall respondents in 2007 to 12% in 2008 and 29% in 2009. Growth is likely to slow over the next year; the number of respondents planning to implement identity federation over the next 6 to 12 months dropped from 18% in 2008 to 9% in 2009. IT organizations still considering federation also dropped from 37% in 2008 to 32% in 2009. The percentage of organizations with no plans to implement federation increased slightly to 37% in 2009.
Content-based Rights Management Remains in Early Adoption
Adoption of content-based rights management is growing slowly among respondents, with only 24% reporting its use within their organizations, up from 17% in 2008. Pending adoption is light; only 10% of IT organizations and 7% of vendor respondents plan implementations within the next 6 to 12 months. Of the remaining respondents, 31% are still considering it and 35% have no plans to implement it.
Virtual Directories Usage Has Leveled Off
The use of virtual directories remains effectively flat, with current adoption rates at 41% for IT organizations and 51% for the vendor respondents. Future adoption will be light, since fewer than 6% of respondents have plans to implement the technology in the next 6 to 12 months. About 22% of IT organizations are still considering adoption some time in the future, while 31% have no plans for adoption (up from 24% in 2008).
Role-based Delegation 2009 2008 2007Yes 52% 47% 43%Plan to implement within 6 months 5% 5% 6%Plan to implement within 12 months 9% 10% 11%Still considering 22% 26% 32%No plans to implement 12% 13% 9%

TEC 2009 Attendee Survey Results
20
Only 23% of Respondents Have Fully Automated Provisioning
It is not surprising that provisioning and de-provisioning top the list of challenges described earlier in this report, due to the small degree of successful automation. Almost half (48%) of IT organizations are less than fully automated, with 11% relying on manual procedures and 37% relying on a mixture of manual and automated approaches. Another 17% are in the process of automating and 14% use automation, but are not satisfied with the results. Full automation is more prevalent among vendor respondents at 36%; an additional 9% of respondents use automation but are not satisfied with the results.
Most IT Organizations Rely on a Mixture of Manual and Automated Approaches to Fulfill Audit Requests
Despite the prevalence of automation when providing content for internal and external audit requirements, this task still requires manual effort for 62% of IT respondents. Only 6% rely exclusively on manual procedures, while most (56%) use a mix of manual and automated approaches. Approximately 11% of the respondents are fully automated, but almost half (5% of total respondents) are not satisfied with that automation.
IV. Technical Environments
More Than 84% of Responding Organizations Use at Least One Management Framework
A management framework is a necessity rather than “nice to have” for running today’s complex technology environments. More than 84.7% of survey respondents indicated that their organizations used at least one framework. Of those using a management framework, 48% use a single product, while 36% use at least two. A few respondents (1.5%) reported using five different frameworks within their organizations!
Microsoft Operations Manager (MOM) is the Top Framework, Used by 48% of Respondents
Microsoft Operations Manager (MOM) garners a healthy 48% share for the framework used by TEC survey respondents reporting full deployment. This share dropped from 55% in 2008 after growing in 2007 (41%) and 2006 (32%). MOM remains solidly the first-place framework, exceeding second place finisher HP OpenView by a ratio
Management Framework Usage Across All Respondents
0%
10%
20%
30%
40%
50%
60%
CAUnicenter
Other None IBM Tivoli Remedy AR HPOpenview
MicrosoftOperationsManager(MOM)
Number of Frameworks in Use
0.0%
10.0%
20.0%
30.0%
40.0%
50.0%
60.0%
0 1 2 3 4 5

Business Brief
21
of two to one. CA Unicenter took last place among the major frameworks with a surprisingly weak showing of only 5%.
MIIS/ILM Adoption Remains Flat
Although somewhat skewed by the presence of the Identity Lifecycle Manager (ILM) track at TEC, the percentage of organizations relying on ILM has effectively remained the same since 2007. These results suggest that ILM has reached a plateau after three years of steady growth. This conclusion is bolstered by the drop in the percentage of organizations planning to implement ILM in the next 12 months and the increase to 36% of respondents not planning to use ILM.
Table 11. MIIS/ILM Adoption
Most IT Organizations Are on the ILM “2” Sidelines
ILM “2,” now named Microsoft Forefront Identity Manager, sparked interest among current and prospective ILM users when Microsoft unveiled the first public beta at Tech Ed 2008. Interest among TEC attendees increased only slightly over the 2008 survey, with 15% of IT respondents and 30% of vendor respondents planning to participate in the beta program.
• About 5% of respondents plan to implement ILM “2” upon general release, but are not participating in the beta program.
• Another 7% of respondents plan to implement ILM “2” within 12 months of general release.
• 12% (IT) and 11% (vendor) of respondents plan to wait until general availability before evaluating ILM “2.”
• 15% of vendor respondents are still considering their ILM “2” strategy.
• Finally, 61% of IT organizations remain on the sidelines, with 26% of these organizations still considering their strategy and 35% with no plans to consider ILM “2.”
Active Directory Federated Services Adoption Is Growing Slowly Within IT Organizations
The use of Active Directory Federated Services (ADFS) is dependent upon the overall adoption rate for identity federation. While 12% of survey respondents report using ADFS, this number is skewed by the 25% adoption rate among vendor respondents. Among IT respondents, only 3% are using ADFS, and another 7% report that deployment is in progress. Considering the 21% adoption rate of identity federation within IT organizations, ADFS appears to have reached approximately half of the current market. Overall, an additional 5% of TEC respondents plan to deploy ADFS over the next 12 months. This corresponds to about half of the 9% planning to
48% 48% 50% 43% 31%Yes, within 3 months 1% 2% 2% 5% 6%Yes, within 6 months 1% 3% 4% 4% 1%
3% 2% 3% 3% 6%Still considering 10% 18% 17% 19% 27%
36% 28% 24% 26% 28%
Yes, already using
Yes, within 12 months
No, don't plan to use
ILM/MIIS Adoption 2009 2008 2007 2006 2005

TEC 2009 Attendee Survey Results
22
adopt identity management over that same period. About 28% of overall respondents are still considering ADFS, and 50% have no plans to deploy it.
Rights Management Services Has Grown from 1% to 6% Within IT Organizations Over the Past Year
Rights Management Services (RMS) is in a very similar position to ADFS in its own market segment. Currently, 13% of survey respondents report using RMS, and an additional 5% report that deployment is in progress. As for ADFS, these numbers are skewed by heavier adoption among vendors (22%) versus IT (6%). Still, IT adoption is up six-fold from the 1% reported in the 2008 survey. The RMS topic area, content-based rights management, has a 24% adoption rate among overall attendees, with pending adoption at only 10% over the next 12 months. Adoption among IT organizations is 19%, giving RMS about a one-third share of the current IT market, the same percentage it had in the 2008 survey. RMS will get some growth from the 9% of IT respondents who plan to implement it over the next 12 months. About 26% (down from 38% in 2008) of overall respondents are still considering RMS and 50% have no plans to deploy it.
SharePoint Continues to Make Rapid Gains in Adoption
SharePoint continues its march to market dominance, reaching an 86% adoption rate among TEC attendees in 2009. SharePoint should continue to grow for a few more years, albeit at a much slower rate. Looking across TEC data for the past four years, the drop in the number of responding organizations that don’t plan to use SharePoint is impressive, but this leaves a smaller pool of future buyers. Likewise, the number of pending adoptions is at an all-time low of 3%, and only 2% of responding organizations are still considering its use.
Judging from responses in the open-ended usage question, the extent and diversity of SharePoint use within companies is expanding. The most commonly listed use is document management, followed by team collaboration, intranets, portals and project management.
Table 12. SharePoint Adoption
Most TEC Respondents Now Use PowerShell in Their Organizations
Windows PowerShell, Microsoft’s command line shell and scripting language, has reached critical mass; it is currently being used by 54% of IT organizations and 67% of vendor organizations. As shown in the accompanying graph, IT use has grown steadily over the past three years, while vendor use showed a
Sharepoint Adoption 2009 2008 2007 2006Yes, already using 86% 74% 66% 57%Yes, within 3 months 0% 1% 3% 2%Yes, within 6 months 0% 2% 4% 1%Yes, within 12 months 3% 3% 5% 1%Still considering 2% 9% 12% 12%No, don't plan to use 8% 11% 11% 26%
PowerShell Adoption
0%
10%
20%
30%
40%
50%
60%
70%
80%
No Evaluating Yes No Evaluating Yes
IT organizations Vendor organizations
200720082009
PowerShell Adoption
0%
10%
20%
30%
40%
50%
60%
70%
80%
No Evaluating Yes No Evaluating Yes
IT organizations Vendor organizations
200720082009

Business Brief
23
growth spurt in 2009 after being essentially flat over the previous two years. This sudden growth among vendors is likely driven by the rapid increase in adoption among their IT customers. At its current rate of adoption, overall IT use should cross 70% by next year, with vendor use growing more slowly but also reaching a higher rate of overall adoption.
Windows Server 2008 Adoption Shows Steady Growth
Windows Server 2008 deployment is already in progress in more than 34% of IT organizations and 51% of vendor organizations. Very few organizations have no plans to migrate, and a surprisingly low 12% of IT organizations are still considering it. About 42% are planning to deploy it in the next 6 to 12 months, bringing expected IT adoption to 76% by next year.
Table 13. Windows Server 2008 Adoption
Finding a Balance Between Day-to-Day Work and Migration Efforts Remains the Top Windows Server Migration Challenge
Support calls, as well as administration and production problems, compete with increasingly complex technology migrations for resources, budget and attention. As a result, finding the time and resources to perform migrations while still meeting the demands of day-to-day support continues to be the most highly-ranked challenge by IT survey respondents.
Table 14. Migration Challenges
Survey respondents could identify as many challenges as applied in their organizations, allowing us to analyze the overall level of concern on a percentage basis. Over the five years of this survey, we have seen a steady decline in the percentage of respondents expressing challenges with migrations, an indicator of improvements in migration tools and practices.
Windows Server 2008 Adoption IT VendorDeployment is already in progress 34% 51%Plan to deploy within 6 months 18% 7%Plan to deploy within 12 months 24% 11%Plan to deploy within 24 months 8% 5%Still considering 12% 20%No plans to migrate 3% 6%
Windows Server 2008 migration challenges 2009 2008Balancing between day-to-day support and migration effort 43% 54%Controlling/documenting changes 24% 27%Finding/developing skilled technical resources 19% 22%Preventing service level degradation 18% 23%Maintaining security 15% 16%Other 10% 13%

TEC 2009 Attendee Survey Results
24
Most Organizations Deploy Multiple Server Operating Systems
Most organizations officially support more than one server operating system (OS). The median number of supported server operating systems is two, with 37% (up from 29% in 2008) of organizations supporting only one and 6% supporting all seven listed systems. Microsoft Windows Server is by far the dominant OS, supported by 99% of both IT and vendor respondents.
Microsoft Windows Dominates the Desktop
In contrast to server operating systems, 55% of responding organizations support only one client OS—Microsoft Windows. Of the remaining respondents, 21% officially support two client operating systems, 15% support three, and 9% support four. Windows is used by 99% of both IT and vendor respondents. Apple takes second place at 33% (up from 26% in 2008), bumping Linux (all types) into third place with only 25% use (down from 29% in 2008) within responding organizations.
V. Exchange
Exchange Usage Reaches 93%
Among TEC attendees, Exchange owns the e-mail market, growing in usage by 74% of responding organizations in 2006 to 93% in 2009. While some of this year’s growth may be attributable to adding an Exchange track within TEC in 2009, Exchange use grew a noteworthy 13% between 2007 and 2008, making this year’s 6% increase quite reasonable in comparison.
Exchange 2003 Is the Most Prevalent Version in IT Organizations, While Exchange 2007 Is Predominant in the Vendor Community
Most IT organizations have not updated to newer versions of Exchange, highlighting their reluctance to absorb the cost, effort and potential disruption of a migration project. In contrast, the pace of adoption within the vendor community is considerably faster. Almost two-thirds of the vendor community is already using Exchange 2007. These distributions are shown in the table below. Respondents could pick multiple versions; approximately 23% of IT respondents and 22% of vendor respondents report running multiple versions of Exchange.
Exchange Usage
60%
65%
70%
75%
80%
85%
90%
95%
2006 2007 2008 2009
Officially Supported Server Operating Systems
0%
10%
20%
30%
40%
50%
60%
70%
80%
90%
100%
Linux –Debian
Linux –other
Linux -SUSE
HP UX IBM AIX Linux -Redhat
MicrosoftWindows
Officially Supported Client Operating Systems
0%
10%
20%
30%
40%
50%
60%
70%
80%
90%
100%
Other Solaris Linux (any type) Apple MicrosoftWindows

Business Brief
25
Table 15. Exchange Usage by Version
Only 25% of IT Organizations Report Full Deployment of Exchange 2007
Following the trend noted above, only 25% of IT organizations report full deployment of Exchange 2007, with another 19% reporting that deployment was in progress. In addition, 14% of IT organizations plan to begin migrations in the near term (4% within three months, 10% within six months), 23% of IT organizations plan to migrate within 12 months, and 15% of IT organizations have no current plans to migrate to Exchange 2007. In contrast, 56% of vendor respondents report deploying Exchange 2007 and 17% have a deployment in progress. Fewer vendor respondents are planning migrations over the next year with 2%, 3% and 3% deploying in 3, 6 and 12 months respectively.
Exchange 14 Is Very Leading Edge in IT
Only 3% of IT respondents report active testing of Exchange 14 (now officially named Exchange 2010), with an additional 6% planning to deploy itwithin 12 months and 12% within 24 months. Almost half (45%) are still considering it, and 35% have no plans to migrate. In contrast, 27% of vendor respondents report testing of Exchange 2010 is in progress, with 8% planning to deploy it within 12 months and 9% within 24 months. Exchange 2010 is under consideration by 22% of vendor respondents, while 34% have no plans to migrate at this time.
About 90% of TEC Attendees Say No to Gmail
Gmail has very little interest among TEC attendees; only 2% of IT respondents and 1% of vendor respondents report deployment within their organizations, while 90% report no plans to migrate. Deployments are underway in 1% of respondent organizations, but no respondents report plans to deploy it later in 2009 and only 2% of IT respondents and 1% of vendor respondents are planning deployments in 2010. Finally, 6% of IT and vendor respondents report that their organizations are still considering Gmail.
Hosted Exchange Has Low Market Penetration Among TEC Attendees
Almost three-fourths of TEC survey respondents report no interest in hosted Exchange. Current production usage is low—6% within IT organizations and 9% among vendors. An additional 7% of IT respondents and 6% of vendor respondents are currently evaluating hosted Exchange as an option, while among both categories, 1% plan to migrate with 12 months and another 1% within 24 months. Finally, 13% of IT respondents and 11% of vendor respondents report their organizations are still considering whether to move forward with hosted Exchange.
Reducing the Overall Cost of Using Exchange Is the Biggest Driver for Using Hosting
Respondents using, currently evaluating, or planning to migrate to hosted Exchange were asked to rank their main drivers for the decision. Among IT and vendor respondents, 53% indicate the
Exchange Usage by Version IT Vendors5.5 4% 1%2000 5% 0%2003 62% 33%2007 42% 63%None, we don't use Exchange 8% 6%

TEC 2009 Attendee Survey Results
26
driver is reducing the overall cost of using Exchange. IT respondents ranked the remaining drivers as follows: “greater agility/responsiveness to change” (35%), “enhance service levels/quality” (24%) and “focus on core competencies/more strategic functions” (18%). Vendor respondents ranked their remaining drivers as “focus on core competencies/more strategic functions” (40%), “enhance service levels/quality” (20%), and “greater agility/responsiveness to change” (7%).
Microsoft Exchange Online Is the Preferred Option for Organizations Using Hosting
Respondents using, currently evaluating or planning to migrate to hosted Exchange were also asked which solutions are the basis for their organization's hosted Exchange strategy. Microsoft Exchange Online was easily the first place finisher among both IT and vendor respondents.
Table 16. Preferred Exchange Hosting Solution
VI. Automated Tools
Slightly More than 30% of IT Organizations Consider Their Infrastructure Management Efforts to Be Well Automated
The percentage of TEC respondents, both IT and vendor, who consider their infrastructure management efforts to be well-automated remained essentially flat when compared to 2008. Not surprisingly, the vendor community is more highly automated than IT (52% versus 32%), but vendor respondents are slightly more likely to rely on native tools and scripts for their automation. IT respondents show the beginning of a shift from relying on native tools and scripts to using third-party tools for their automation; those considering themselves well-automated using third-party tools rose from 11% in 2008 to 17% in 2009. Most IT respondents (as well as the biggest category of vendor respondents) remain partially automated. On the positive side, the percentage of IT organizations lacking necessary automation or remaining primarily manual continues to decline.
Table 17. Prevalence of Automation
Hosted Exchange Solution IT VendorMicrosoft Exchange Online 76% 87%Microsoft Outlook Live (formerly Exchange Labs) 29% 47%Other 29% 40%Intermedia 6% 0%mindSHIFT 6% 0%Azaleos 6% 0%Live Office 0% 27%Apptix 0% 13%
How would you describe your organization's use of automation for the systems that you are responsible for? 2009 2008 2007 2009 2008 2007Well automated using third-party tools 17% 11% 12% 24% 22% 14%Well automated using native tools and scripts 15% 20% 14% 28% 29% 21%Partially automated 56% 50% 56% 34% 33% 39%Lacks necessary automation 8% 12% 12% 6% 3% 6%Primarily manual 3% 4% 5% 9% 8% 13%Other 2% 2% 2% 1% 5% 7%
IT Vendors

Business Brief
27
Single Sign-on and Compliance Reporting Are the Two Weakest Tool Categories
Respondents were asked to rate the quality of available automation for the 11 areas assessed in the challenges section of this report using a four-part scale (poor, fair, good, excellent). The table below compiles the results by area and compares tool quality for each area by the percentage of negative ratings (poor and fair) and positive ratings (good and excellent). The results are stack ranked by subtracting the percentage of negative ratings from the percentage of positive ratings. The table shows the results across all respondents. IT respondents rate tools more negatively than vendor respondents do.
Table 18. Quality of Available Automation Options
Highlights
• Tool ratings improved significantly from 2008. Positive ratings exceed negative ratings for most categories in 2009, while the ratings were overwhelmingly negative in 2008.
• Single sign-on, a newly added category in the survey, is the most negatively rated, with 56% of respondents unhappy with their available tools.
• Compliance reporting, last year’s poorest performer, is in second-to-last place despite some improvement in ratings, showing both that compliance reporting remains a problematic area for many respondents and many organizations have yet to deploy adequate technology to support their needs.
• Diagnostic and repair improved dramatically, from third-to-last place in 2008 to first place in 2009. This change may reflect enhanced native diagnostic and repair functionality in recent infrastructure software releases.
• Respondent ratings for the quality of available automation by area have a are related to the the ratings of challenges in those areas. In other words, respondents who are happy with the quality of available automation are much less likely to view an area as a challenge than those who are unhappy with the automation (and vice versa).
MOM/SCOM Tops the List of Tools That Improve the Lives of IDA Professionals for the Second Year in a Row
As the final question in the survey, respondents were asked to list the top three system management tools that make their lives easier. As expected, this question generated a huge list of tools that ran the gamut from simple homegrown scripts to major Microsoft products. Most tools listed garnered only one or two mentions, but a handful of clear favorites emerged. For the second year in a row, Microsoft System Center Operations Manager (SCOM) is solidly in first place with more than twice the number of mentions of any other tool.
2009 2008Negative Positive Net Negative Positive Net
Diagnostic and repair 35% 65% 30% 64% 36% -28%Data recovery 40% 60% 20% 51% 49% -2%Server configuration 42% 58% 16% 48% 52% 4%Security configuration 42% 58% 16% 58% 42% -16%Password management 43% 57% 14% 53% 47% -6%User provisioning/de-provisioning 44% 56% 12% 55% 45% -10%Disaster recovery 45% 55% 10% 56% 44% -12%Two-factor authentication 49% 51% 2% - - -GPO administration 49% 51% 2% 54% 46% -8%Delegating administrative rights 53% 47% -6% 64% 36% -28%Back up/archiving 54% 46% -8% 46% 54% 8%Compliance reporting 55% 45% -10% 69% 31% -38%Single sign-on 56% 44% -12% - - -

TEC 2009 Attendee Survey Results
28
The next tiers of tools are clustered closely in popularity. They are:
Second place: Microsoft System Center Configuration Manager (SCCM) (formerly SMS)
Third place: Quest ActiveRoles Server
Fourth place: Quest Change Auditor, Windows PowerShell (tied)
Sixth place: Microsoft Identity Lifecycle Manager (ILM)—formerly MIIS
After these tools, the number of individual tools mentioned repeatedly drops off quickly. None of the many remaining tools listed received more than seven mentions.
From a vendor perspective, Microsoft products garnered the most mentions. This result is not surprising given the breadth and depth of its infrastructure tool portfolio, and accordingly, the mentions Microsoft received were spread across many native tools and individual products. Although behind Microsoft in total mentions, Quest products took a solid second place with more than eight times the number of total mentions of the vendors that tied for third place, HP and Joeware.

Business Brief
29
ABOUT THE SURVEY
The 2009 TEC Attendee survey was commissioned and sponsored by Quest. Since 2005, this survey has been conducted and analyzed annually by Ian Hayes of Clarity Consulting, Inc.
Ian Hayes is the president of Clarity Consulting, Inc., where he provides management consulting services in information technology strategies, emerging trends, markets and challenges. Hayes has advised dozens of Fortune 1000 companies on numerous IT issues including business strategies, wireless technology, outsourcing, process redesign, efficiency enhancement, productivity and service level metrics, service offering development, and IT product and service positioning. As an industry analyst, he regularly counsels software providers, consulting firms and financial analysts on product positioning, service offerings and methodologies. Hayes has written more than 100 articles and white papers for numerous business and IT publications. He has been a columnist for Software Magazine and his articles have appeared in publications such as Business Week, Cutter IT Journal, EAI Journal and Computerworld. Hayes also has written three books.

TEC 2009 Attendee Survey Results
30
ABOUT QUEST SOFTWARE, INC.
Quest Software, Inc., a leading enterprise systems management vendor, delivers innovative products that help organizations get more performance and productivity from their applications, databases, Windows infrastructure and virtual environments. Quest also provides customers with client management through its ScriptLogic subsidiary and server virtualization management through its Vizioncore subsidiary. Through a deep expertise in IT operations and a continued focus on what works best, Quest helps more than 100,000 customers worldwide meet higher expectations for enterprise IT. Quest Software helps organizations deliver, manage and control complex database environments through award-winning products for Oracle, SQL Server, IBM DB2, Sybase and MySQL. Quest Software can be found in offices around the globe and at www.quest.com.
Contacting Quest Software
Phone: 800.306.9329 (United States and Canada)
Email: [email protected]
Mail: Quest Software, Inc. World Headquarters 5 Polaris Way Aliso Viejo, CA 92656 USA
Web site: www.quest.com
Please refer to our Web site for regional and international office information.
Contacting Quest Support
Quest Support is available to customers who have a trial version of a Quest product or who have purchased a commercial version and have a valid maintenance contract. Quest Support provides around the clock coverage with SupportLink, our web self-service. Visit SupportLink at http://support.quest.com
From SupportLink, you can do the following:
• Quickly find thousands of solutions (Knowledgebase articles/documents).
• Download patches and upgrades.
• Seek help from a Support engineer.
• Log and update your case, and check its status.
View the Global Support Guide for a detailed explanation of support programs, online services, contact information, and policy and procedures. The guide is available at: http://support.quest.com/pdfs/Global Support Guide.pdf