teap bdn trask force report final - uneptie.org filemembers, and the teap basic domestic needs task...
TRANSCRIPT

MONTREAL PROTOCOL
ON SUBSTANCES THAT DEPLETE
THE OZONE LAYER
UNEP
REPORT OF THE TEAP BASIC DOMESTIC NEEDS TASK FORCE
OCTOBER 2004


October 2004 TEAP BDN Task Force Report iii
OCTOBER 2004
REPORT OF THE TEAP BASIC DOMESTIC NEEDS TASK FORCE
October 2004 TEAP BDN Task Force Report iv
Montreal Protocol On Substances that Deplete the Ozone Layer Report of the UNEP Technology and Economic Assessment Panel Basic Domestic Needs Task Force October 2004
The text of this report is composed in Times New Roman. Co-ordination: Lambert Kuijpers Composition of the report: Lambert Kuijpers Dawn Lindon Reproduction: UNON Nairobi Date: October 2004 Under certain conditions, printed copies of this report are available from: UNITED NATIONS ENVIRONMENT PROGRAMME Ozone Secretariat, P.O. Box 30552, Nairobi, Kenya Normally from SMI Distribution Service Ltd., Stevenage, Hertfordshire, UK, fax: + 44 1438 748844 No copyright involved. This publication may be freely copied, abstracted and cited, with acknowledgement of the source of the material. ISBN: 92-807-2511-4
October 2004 TEAP BDN Task Force Report v
Disclaimer
The United Nations Environment Programme (UNEP), the Technology and Economic Assessment Panel (TEAP) co-chairs and members, and the TEAP Basic Domestic Needs Task Force co-chairs and members, and the companies and organisations that employ them do not endorse the performance, worker safety, or environmental acceptability of any of the technical options discussed. Every industrial operation requires consideration of worker safety and proper disposal of contaminants and waste products. Moreover, as work continues - including additional toxicity evaluation - more information on health, environmental and safety effects of alternatives and replacements will become available for use in selecting among the options discussed in this document.
UNEP, TEAP co-chairs and members, and the TEAP Basic Domestic Needs Task Force co-chairs and members, in furnishing or distributing this information, do not make any warranty or representation, either express or implied, with respect to the accuracy, completeness, or utility; nor do they assume any liability of any kind whatsoever resulting from the use or reliance upon any information, material, or procedure contained herein, including but not limited to any claims regarding health, safety, environmental effect or fate, efficacy, or performance, made by the source of information.
Mention of any company, association, or product in this document is for information purposes only and does not constitute a recommendation of any such company, association, or product, either express or implied by UNEP, TEAP co-chairs and members, and the TEAP Basic Domestic Needs Task Force co-chairs and members or the companies or organisations that employ them.
The opinions expressed are those of the TEAP and its Task Force and do not necessarily reflect the views of any sponsoring or supporting organisations.

October 2004 TEAP BDN Task Force Report vii
OCTOBER 2004
REPORT OF THE TEAP BASIC DOMESTIC NEEDS TASK FORCE
TABLE OF CONTENTS PAGE
EXECUTIVE SUMMARY 1
1. INTRODUCTION 5 1.1 STRUCTURE OF THE REPORT 7 2. CFC CONSUMPTION AND CFC PRODUCTION 9 2.1 CFC CONSUMPTION 9
2.1.1 Consumption of CFC-11 and CFC-12 10 2.2 CFC PRODUCTION 12
2.2.1 CFC production for essential uses 13 2.2.2 CFCs available for the Basic Domestic Needs of Article 5(1) countries 14 2.2.3 Issues related to the production of CFCs 14
3. PREDICTION OF ARTICLE 5(1) CFC CONSUMPTION DURING 2003-2010 17 3.1 CFC PHASE-OUT PLANS FUNDED FROM THE MULTILATERAL FUND 17 3.2 METHODOLOGY 19
3.2.1 First scenario 19 3.2.2 Second scenario 20
3.3 RESULTS 20 3.3.1 Scenario 1: “stepwise reduction + NPPs” - scenario 20 3.3.2 Scenario 2: “gradual reduction + adjusted NPPs” – scenario 22
3.3 COMPARISON OF THE RESULTS BETWEEN THE TWO SCENARIOS 23 4. CONCLUSIONS ON CFC CONSUMPTION AND PRODUCTION 25
ANNEX TO CHAPTER 4: COMPARISON WITH AN EARLIER EUROPEAN COMMISSION STUDY 29
5. OTHER CONTRIBUTING FACTORS ON BDN PRODUCTION FOR ARTICLE 5(1) COUNTRIES 31
5.1 PHASE-OUT STRATEGIES IN THE REFRIGERATION SERVICING SECTOR IN ARTICLE 5(1) COUNTRIES /EXC03/ 31
5.2 AMOUNTS OF CFCS RECOVERED AND REUSED REPORTED UNDER ARTICLE 7 OF THE MONTREAL PROTOCOL 33
5.3 AMOUNTS OF RECYCLED CFCS IN ARTICLE 5(1) COUNTRIES 34 5.4 PRICES OF CFCS AND ALTERNATIVE REFRIGERANTS AND THEIR AVAILABILITY 34 5.5 ACTUAL PRODUCTION OF CFC-12 IN MANUFACTURING PLANTS 36 5.6 CHINA’S ACCELERATED PHASE-OUT PLAN 36 5.7 CFC STOCKPILING 37 5.8 ILLEGAL TRADE 38 6. CTC PRODUCTION AND CONSUMPTION 39 6.1 CTC FEEDSTOCK PRODUCTION, IMPORTS AND EXPORTS; PROJECTIONS 39

October 2004 BDN Task Force Report viii
7. CONCLUDING REMARKS 43
8. REFERENCES 47
ANNEX I – UNEP REPORTED DATA (1986-2003) 49
ANNEX II - MONTREAL PROTOCOL STEPWISE REDUCTIONS PLUS NPPS 53
ANNEX III: MONTREAL PROTOCOL GRADUAL PHASE-DOWN PLUS ADJUSTED NPPS 58
ANNEX IV - DATA ON CFC PRODUCTION (ODP TONNES) 63
ANNEX V - COMPARISON OF PRODUCTION AND CONSUMPTION (TWO SCENARIOS) 64

October 2004 TEAP BDN Task Force Report 1
Executive Summary
1. This study gives all data submitted by the A5 Parties to the Ozone Secretariat until the year 2002-2003 (in Annexes). It has subdivided the Article 5(1) countries into four Groups based on consumption levels, the first Group consisting of the 20 Article 5(1) countries consuming about 85% of the Article 5(1) CFC consumption. These Groups were considered in further analysis.
2. This study has also investigated (via separate spreadsheets, available on a confidential basis to the Task Force from the Ozone Secretariat) the CFC-11 and CFC-12 consumption per country in the different groups. It is likely that the demand for CFC-11 in future, will, as a percentage of total CFCs, decrease rapidly after 2003, which implies that the percentage of other CFCs, particularly CFC-12, will go up.
3. The existing CFC producing plants will produce a minimum of about 10% of CFC-11 in their total production, through process controls; these have cost and energy penalties. By re-engineering solutions for the flow back of CFC-11 (normally produced at a minimum of 35% in the total) into the reaction process, this 10% should be achievable in all non-Article 5(1) production plants and presumably also in Article 5(1) producing plants.
4. Since the control measures and all agreements of the Article 5(1) Parties with the Multilateral Fund (MF), for production and consumption, as well as in National Phase-out Plans (NPP), are in ODP tonnes of CFCs, production of CFC-12 will be lower than the demand while there will be an excess of CFC-11. The CFC-11 could be stockpiled if needed, however it could also be destroyed, if necessary, by an approved method and thereby subtracted from the declared "production" reported or prescribed in Article 5(1) country agreements. This needs further investigations or monitoring.
5. The consumption of Article 5(1) countries has been predicted for the years 2003-2010 using two different scenarios, one scenario that assumes no reductions between the control steps (stepwise, non-realistic reductions), and considers all NPP values without adjustments even if values reported in earlier years were already significantly lower. This can be considered the worst-case scenario, defined as “MP stepwise reduction + NPPs”. A second scenario assumes gradual decreases between control steps and does not take into account the NPP values if they are substantially higher than values already reported in earlier years, defined as “MP gradual reduction + adjusted NPPs”.
6. Production has been predicted based on the existing Article 5(1) production agreements with the Multilateral Fund, and adding to this production level the estimated production for BDN in the non-Article 5(1) countries.
7. A comparison between production and the consumption levels predicted in the two scenarios yields deficits in virtually all cases, i.e. the consumption being larger than production in each year. This would imply shortages and price increases. For the years

October 2004 BDN Task Force Report 2
2000-2002 the data submitted to UNEP’s Ozone secretariat show deficit values. However, there has been no evidence of any shortage in supply in recent years and bulk price information of CFCs and alternatives does support this evidence. This is further elaborated upon in the relevant chapters.
8. In order to check these values, the Task Force has determined the total consumption and the total production for all countries (Article 5(1) and non-Article 5(1) countries), data as submitted to the Ozone Secretariat. For all the years 1994-2000, reported production has been significantly less than the reported consumption. But there has never been a shortage on the market. The reasons for the reported deficits could be over-reporting of consumption, the data for which has to be collected from many users. Each Article 5(1) Party also reports data to the MF as well as the Ozone Secretariat and maintains consistency between the data reported. The consumption data reported to the Multilateral Fund is based on the projects submitted for financing and could have an element of over estimation. The production data is likely to be more accurate since it is collected from a small number of production plants. The difference in production and consumption cannot be due to stockpiling since the build up of stocks has to be from production. If production was deliberately underreported, illegal trade may have played a role in this discrepancy since the users of illegally imported CFCs would have reported their use, while the exporters would have suppressed their production.
9. The projected production for BDN plus Article 5(1) production is less than the projected Article 5(1) consumption for the future years but this does not imply any shortages. Indeed, the reported production has, since 1994, been less than the reported consumption, without any shortages being felt. The reasons for this anomaly could be under-reporting of production or over-reporting of consumption to a certain degree. Parties may request the TEAP, the Ozone Secretariat and the MLF Secretariat to monitor this issue and report back, if necessary.
10. In this study, a brief comparison is made with results from a study on BDN done for the European Commission. Where this study calculates deficits for the future years, the EC study calculates surplus CFC for virtually all years. Differences are mainly caused by the fact that the data for the EC study are for 2000 and 2001, and not all agreements on production and consumption were known. Extrapolations made are therefore less certain and this is believed to be the main cause for the differences observed.
11. No calculations could be made for CTC since the data for CTC is very confusing, i.e. there are many anomalies in the reporting, and several countries, particularly major ones, do not report every year. Further data discrepancies are detailed in the report.
12. The APP, an accelerated phase-out plan for China has been analysed regarding its impact on the global balance between production and consumption. The global deficits predicted in case of scenarios 1 and 2 undergo only small changes if China accelerates its phase-out. It is difficult to analyse what the local and regional impacts of the APP plan could be.

October 2004 TEAP BDN Task Force Report 3
13. Data submitted to UNEP’s Ozone Secretariat on imports and exports of recycled substances have been analysed. It is impossible to draw any conclusions regarding the stream of recycled substances since only a very small number of countries reports small quantities. Exported amounts are not reported, it only concerns imports. This issue also would deserve further monitoring and Parties may request the appropriate bodies to do so.
14. The study also describes the influence of recovery and recycling on the consumption of CFCs in Article 5(1) countries, without making a thorough quantitative analysis. This is due to the fact that much information on the recovery and recycling practices assumed is still lacking. The overall conclusions from funded recovery and recycling programs so far is that they do not provide indications that recovery and recycle will have a significant impact on demand. Nevertheless, recovery and recycle is assumed to have a positive impact on ways to phase out in many Article 5(1) National Phase-out Plans.
15. An analysis of the bulk prices of CFCs shows that there has been an increase in recent years. This increase cannot be due to any shortages and is assumed to be due to normal market dynamics. The bulk price of the main alternative, HFC-134a, has dropped slightly between 2000-2003, however, has increased again, due to global demand. Difference in price between CFC-12 and HFC-134a has therefore decreased, but is still significant.
16. The report has given estimates for the CFC amounts planned to be produced for basic domestic needs for Article 5(1) countries. Based upon the analysis performed, the Task Force cannot make definite recommendations, and, at this stage, has to conclude that there seems no reason to make changes to the non-Article 5(1) “basic domestic needs” amounts, which are likely to be produced.
17. In summary, this study has described a number of phenomena based upon data analysis. The Task Force concludes that further monitoring and reporting back to Parties will be needed and that data submission processes need to be improved. This applies to the CFC production and consumption data, to CTC data for emissive uses and for feedstock, and to data on imports and exports of recycled substances.


October 2004 TEAP BDN Task Force Report 5
1. Introduction
The term Basic Domestic Needs (BDN) is included in Articles 2 and 5 of the Montreal Protocol. This term basically refers to an additional amount of production of the controlled substances under the Protocol by non-Article 5(1) countries to satisfy the BDN of Article 5(1) countries.
A number of specific decisions on BDN have been taken by the Parties to the Montreal Protocol (Parties). As early as its first meeting in May 1989, through its decision I/12C the Parties further clarify the term BDN; this term should be understood as not to allow production of products containing controlled substances to expand for the purpose of supplying other countries.
Further decisions have been taken by the Parties in relation to BDN. Decision IV/29 (1992) highlighted a report by the Executive Committee and requested Parties to take the necessary steps to promote an adequate supply of controlled substances in order to meet the needs of Article 5(1) Parties. Decision V/25 (1993) requested Parties supplying controlled substances to annually provide the secretariat with a summary of the requests received and to indicate in the report whether the receiving Parties have affirmed that the supply is to meet their basic domestic needs. Decision VI/14A (1994) again highlighted the provision of information on the supply of controlled substances to Article 5(1) Parties and mentioned that a Party may opt to use either Decision V/25 or VI/14A. Decision VI/14B (1994) requested recommendations by Parties concerning the need for clarification, amendment etc. regarding basic domestic needs and concerning which procedures should be taken for the implementation of the provisions related requested to Basic Domestic Needs in Articles 2 and 5 in the Protocol.
Decision VII/9 (1995) mentioned a number of issues: (1) Article 5(1) Parties may supply substances to meet the Basic Domestic Needs until the first control measure (1999), and thereafter they may still do so, with the production limits required by the Protocol, (2) All Parties importing and exporting should monitor this by licenses, (3) Exporting Parties should report on quantities, types and destination of their exports to the Ozone Secretariat, (4) Eligible incremental costs for the phase-out in the production sector, (5) No Parties should install any new capacity for the production of ODSs listed in Annex A or B of the Protocol as of 7 December 1995, (6) The incorporation into the Protocol by 1997, the establishment of baselines for production and consumption of Annex A and B substances.
At their 15th Meeting, in 2003, the Parties recognising inter alia the need to ensure that the supply of Annex A, group I (CFCs) and Annex B, group II (carbon tetrachloride or CTC) ozone-depleting substances (ODSs) is sufficient to meet the BDN of Article 5(1) Parties, decided to request the Technology and Economic Assessment Panel:

October 2004 BDN Task Force Report 6
(a) To assess the quantities of controlled substances in Annex A, group I and Annex B, group II to the Montreal Protocol that are likely to be required by Parties operating under Article 5 of the Protocol for the period 2004-2010;
(b) To assess the permitted levels of production from companies in Parties operating under Article 5 to the Protocol, taking into account schedules agreed for reduction in production under the Multilateral Fund;
(c) To assess the quantities of controlled substances in Annex A, group I and Annex B, group II to the Protocol which can be produced and exported by Parties not operating under Article 5 in order to meet the basic domestic needs of Parties operating under Article 5 during the period 2004-2010, taking into account regional production phase-out regulations and agreements;
(d) To also take into account, when preparing the assessments, the actual and potential impact of training programmes for refrigeration technicians, retrofitting, recovery and recycling operations and other measures in reducing the demand for Annex A, group I and Annex B, group II substances;
(e) To report on bulk price ranges of Annex A, group I and Annex B, group II substances in a representative sample of Article 5 Parties, including relative changes in bulk prices from 1 January 2001 to 31 December 2003, in comparison to bulk prices of alternatives;
(f) To present its report to the Open-ended Working Group at its twenty-fourth session or at the Sixteenth Meeting of the Parties (decision XV/2).
Pursuant to decision XV/2, the Technology and Economic Assessment Panel (TEAP) constituted a Basic Domestic Needs Task Force (BDN Task Force), with the following members.
Lambert Kuijpers, chair, co-chair TEAP and co-chair RTOC Nick Campbell, member ATOC, Atofina Tamas Lotz, member TEAP Erik Pedersen, member HTOC, World Bank K. Madhava Sarma, member TEAP Shiqiu Zhang, member TEAP
The BDN Task Force received additional assistance from UNEP Nairobi, i.e., Mr. Gerald Mutisya and Mrs. Martha Mulumba, who provided all possible data information in the most suitable form. In particular, useful discussions were had with Mr. Tony Hetherington and Mr. Eduardo Ganem from the Montreal Protocol Multilateral Fund Secretariat.
This report is the result of efforts carried out by the Task Force.

October 2004 TEAP BDN Task Force Report 7
1.1 Structure of the report
The structure of the report is as follows:
Chapter 1: Introduction, provides an overview of relevant decisions taken by the Parties on BDN;
Chapter 2: CFC consumption and CFC production, presents a brief analysis on the CFC consumption in Article 5(1) countries, CFC production in all CFC producing countries (past and present), and specific issues related with CFC-11 and CFC-12 for certain country groups;
Chapter 3: Presents the prediction of Article 5(1) CFC consumption during 2003-2010, gives the methodologies applied for the projection of the CFC consumption per country for the years 2003-2010 and analyses the consumption per country and per country group;
Chapter 4: Presents concluding observations on CFC consumption and production, presents the balance between consumption and production, looks at total global production and consumption data reported under Article 7 of the Montreal Protocol;
Chapter 5: Other contributing factors on BDN for Article 5(1) countries, presents a brief analysis on phase-out strategies in the refrigeration servicing sector in Article 5(1) countries; amounts of CFCs recovered and reused reported under Article 7 of the Montreal Protocol; prices of CFCs and alternative refrigerants and their availability; actual production of CFC-12 in manufacturing plants; accelerated phase-out in China; CFC stockpiling and illegal trade;
Chapter 6: CTC analysis, presents data for production and consumption, as well as data for feedstock, imports and exports by non-Article 5(1) and Article 5(1) countries
Chapter 7: Concluding remarks.
§ Annex I presents CFC consumption data as reported to UNEP’s Ozone Secretariat.
§ Annex II presents a prediction of consumption until 2010, according to scenario 1, “stepwise reductions plus NPPs”.
§ Annex III presents a prediction of consumption until 2010, according to scenario 2, “gradual phase-down plus adjusted NPPs”.
§ Annex IV presents an overview of production data. § Annex V gives a presentation of the balance between production and
consumption.


October 2004 TEAP BDN Task Force Report 9
2. CFC Consumption and CFC Production
The report is based on CFC consumption and production data as reported to the Ozone Secretariat by all Article 5(1) countries under Article 7 of the Montreal Protocol.
2.1 CFC consumption
Data from Article 5(1) countries were subdivided in four Groups, based on their baseline consumption, which is defined as the average consumption over the years 1995, 1996 and 1997. Table 2-1 summarises the main characteristics of these Groups.
Group Baseline limits Number of A5 countries
Baseline consumption
%age current consumption
I >1,000 20 141,297 86.0% II >360 and <1,000 22 13,356 7.5% III >100 and <360 26 5,677 4.5% IV <100 75 2,098 2.0% Total 143 162,428 100.0%
Table 2-1 Classification of Article 5(1) countries according to their CFC baseline consumption (ODP tonnes)
Consumption data for the separate countries, for the four Groups as well as the totals for the period 1986-2003 (where available) are given in Annex I. Table 2-2 presents the CFC consumption data for the four Groups for the years 1998-2002. Year 1998 1999 2000 2001 2002 Group I 123,188 107,542 101,111 88,682 77,524 Group II 10,837 9,958 8,590 8,502 6,670 Group III 4,313 4,647 4,787 4,507 4,077 Group IV 2,077 2,097 1,898 1,688 1,545 Total 140,414 124,243 116,386 103,379 89,817
Table 2-2 Consumption data for the four Country Groups for 1998-2002 (ODP tonnes) /UNE04/
From the information presented in the above two tables, the following observations can be made:
(a) 86% of the total CFC baseline consumption is concentrated in 20 Article 5(1) countries while 2% of the total baseline consumption is in 75 countries;
(b) The 85-86% per cent consumption in Group I can also be observed in the years 1998-1992, with the percentages for the Groups III and IV becoming slightly higher;

October 2004 BDN Task Force Report 10
(c) Since the establishment of the baseline, CFC consumption has been reduced annually. For all the 143 Article 5(1) countries, the 2002 consumption is about 55% per cent of the total CFC baseline;
(d) The 2002 CFC consumption of Groups I and II is about 55% of their CFC baselines while for Groups III and IV is over 70%. The phase-out achieved in Groups I and II is mostly related with large consumption of CFCs in the manufacturing sectors, namely aerosols, foams and refrigeration manufacturing;
(e) In 2002, 7 Group I countries had already a consumption below 50% of the baseline. However, in all Groups, in 2002, 38 countries had a consumption in 2002 being more than 80% of the baseline consumption;
(f) In 1999, the first control measure for Article 5(1) countries entered into force (i.e., the freeze in the level of CFC consumption). An increase in CFC consumption in 1999-2000 for stockpiling would have been expected; however, the overall CFC consumption in Article 5(1) countries decreased in those years. It is to be noted that a slight increase in CFC consumption was reported between 1999 and 2000 in Group III countries (i.e., 140 ODP tonnes).
2.1.1 Consumption of CFC-11 and CFC-12
Group CFCs 1998 1999 2000 2001 2002 I CFC-11 57,660 52,851 44,408 37,767 34,518 CFC-12 61,103 50,224 52,395 47,356 39,865 Subtotal 118,763 103,075 96,803 85,123 74,383 II CFC-11 3,957 3,331 3,025 3,200 1,729 CFC-12 6,242 6,422 5,379 5,123 4,832 Subtotal 10,199 9,754 8,404 8,323 6,561 III CFC-11 826 1,032 680 569 432 CFC-12 3,335 3,470 3,909 3,783 3,535 Subtotal 4,161 4,502 4,589 4,352 3,967 IV CFC-11 281 352 268 269 219 CFC-12 1,724 1,593 1,574 1,368 1,290 Subtotal 2,005 1,945 1,842 1,636 1,508 Total CFC-11 62,724 57,565 48,381 41,804 36,897 CFC-12 72,404 61,710 63,257 57,630 49,522 Total 135,128 119,275 111,638 99,434 86,419
Table 2-3 Consumption of CFC-11 and CFC-12 (ODP tonnes)
The total consumption of CFCs consists of consumption of CFC-11, -12, -13, -113, -114 and -115. The majority of CFCs consumed are CFC-11 and –12 (96% or more of the total CFCs). Quantities of CFC-13, CFC-113, -114 and -115 are estimated at some percent

October 2004 TEAP BDN Task Force Report 11
(4% or less), where at present, most of it is presumably CFC-115 contained in the blend R-502 for refrigeration purposes (commercial refrigeration).
The annual amount of CFC-11 and -12 consumed by each Article 5(1) country in the different Groups has been analysed and total amounts of CFC-11 and CFC-12 consumed in the different Groups were calculated, as well as the percentage of CFC-11 and -12 in the total. A summary of the analysis is given in Tables 2-3 (in ODP tonnes) and Table 2-4 (percentage).
Group CFCs 1998 1999 2000 2001 2002 I CFC-11 48.6% 51.3% 45.9% 44.4% 46.4% CFC-12 51.4% 48.7% 54.1% 55.6% 53.6% II CFC-11 38.8% 34.2% 36.0% 38.4% 26.4% CFC-12 61.2% 65.8% 64.0% 61.6% 73.6% III CFC-11 19.9% 22.9% 14.8% 13.1% 10.9% CFC-12 80.1% 77.1% 85.2% 86.9% 89.1% IV CFC-11 14.0% 18.1% 14.6% 16.4% 14.5% CFC-12 86.0% 81.9% 85.4% 83.6% 85.5% Total CFC-11 46.4% 48.3% 43.3% 42.0% 42.7% CFC-12 53.6% 51.7% 56.7% 58.0% 57.3%
Table 2-4 Consumption of CFC-11 and CFC-12 in percentages
The following observations are important:
(a) Between 1998 and 2002, the contribution of CFC-11 in respect to the overall CFC consumption has decreased (from 46.4% to 42.7%) while the contribution of CFC-12 has increased (from 53.6% to 57.3%);
(b) The distribution of CFC-11 to CFC-12 varies between the different Groups of countries. For 2002, the contribution of CFC-11 for countries in Groups I and II was 46.4% and 26.4%, respectively, while for countries in Groups III and IV was 10.9% and 14.5%, respectively. The larger contribution of CFC-11 in countries in Groups I and II is due to large consumption in foams, aerosols, as refrigerant in low-pressure chillers and for cleaning refrigeration systems. While CFC-based manufacturing facilities have also been converted in countries in Groups III and IV, the number and capacities are much smaller than in the other two Groups; and
(c) The percentage of CFC-11 is expected to decrease rapidly after 2002 due to a phase-out of most foam manufacturing, less use in cleaning of refrigeration systems and better practices in chiller maintenance. It implies that the percentage of CFC-11 may go down to lower than 20% in Groups I and II in the very near future (years 2004 and after), while it will go below 10% in Groups III and IV.

October 2004 BDN Task Force Report 12
2.2 CFC production
In order to calculate the supplies to Article 5(1) countries, the amounts of CFC produced were calculated from:
(a) The existing agreements for the production in Article 5(1) countries;
(b) The assumed production levels in non-Article 5(1) countries, as obtained from manufacturer information. These production levels assume reductions in the years 2005 and 2007, and zero production in all countries in the year 2010;
(c) The assumed production levels in non-Article 5(1) countries for essential uses. These production levels were derived taking into account the requested/approved amounts for essential uses by Parties and the production numbers for these essential uses which have generally been lower in the past (information from accounting frameworks (TEAP reports) and from manufacturer information.
Projects for the closure of the production facilities in 5 countries (Argentina, China, India, Korea DPR and Mexico) are under current implementation. There is only one major CFC production facility in Venezuela without a phase-out agreement. The technical audit for the production plant has been completed and funding has been approved for the preparation of a project proposal for the closure of the facility (according to the audit report, the total CFC production capacity in Venezuela is 12,000 tonnes; the 1999-2001 average CFC production was 2,616 tonnes; and in 2002, the Government of Venezuela reported under Article 7 a CFC production level of 1,552.8 ODP tonnes). The production in the Republic of Korea is assumed to follow the Montreal Protocol control schedule with a 50% reduction step (compared to the baseline) in 2005 and 85% reduction in the year 2007. The production quantities in China are about 45-50% of the total annual production amounts in all Article 5(1) countries.
Levels for the production in non-Article 5(1) countries have been estimated (mainly using the Montreal Protocol reduction schedule). There are some preliminary indications that production in 2004 will be more than sufficient and production in 2005 might be somewhat lower than indicated, but this is still preliminary.
CFC production facilities in both Article 5(1) and non-Article 5(1) countries have been closed down. In 2002, CFCs were not produced in the following countries that used to produce CFCs: Australia, Brazil, Czech Republic, France, Germany, Japan, DPR Korea (stopped production in 2003), the Russian Federation and South Africa. Up to the year 2002, a few CEIT countries consumed about 1,500 tonnes of CFCs annually (which would actually lead to less availability of the total reported production), according to the latest UNEP data /UNE04/. Some production is assumed for essential uses and BDN in the United States where a new plant will be in operation as of the year 2005-2006.

October 2004 TEAP BDN Task Force Report 13
Country 2002 2003 2004 2005 2006 2007 2008 2009 Non-Article 5(1) countries Greece 1,440 1,168 1,000 906 900 272 272 272 Italy 9,131 6,000 5,000 3,613 3,600 1,084 1,084 1,084 Netherlands 9214 2,888 2,500 2,000 - - - - Spain 6,491 4,948 4,500 2,878 2,850 863 863 863 USA - - - - 1,200 1,200 800 800 Subtotal 26,276 15,004 13,000 9,397 8,550 3,419 3,019 3,019 Article 5(1) countries Argentina 3,015 3,018 3,020 1,647 1,647 686 686 686 China 32,269 30,000 25,300 18,750 13,500 9,600 7,400 3,200 India 16,855 15,058 13,176 11,294 7,342 3,389 2,259 1,130 Korea Dem 299 - - - - - - - Korea Rep 7,507 7,500 7,500 5,061 5,000 1,518 1,518 1,518 Mexico 5,653 7,335 7,335 7,335 - - - - Venezuela 1,637 2,400 2,400 2,000 2,000 1,000 1,000 1,000 Subtotal 67,235 65,311 58,731 46,087 29,489 16,193 12,863 7,534 Grand total 93,511 80,315 71,731 55,484 38,039 19,612 15,882 10,553
Table 2-5 Production of CFCs in countries that were still producing in year 2002
CFC production facilities in several Article 5(1) and non-Article 5(1) countries have been closed down. In 2002, CFCs were not produced in the following countries that used to produce CFCs: Australia, Brazil, Czech Republic, France, Germany, Japan, DPR Korea (stopped production in 2003), the Russian Federation and South Africa. Up to the year 2002, a few CEIT countries consumed about 1,500 tonnes of CFCs annually (which would actually lead to less availability of the total reported production), according to the latest UNEP data /UNE04/. Some production is assumed for essential uses and BDN in the United States where a new plant will be in operation as of the year 2005-2006.
Based on the information available from the sources above-mentioned, the BDN Task Force predicted CFC production levels as shown in Table 2-5 (see also Annex IV).
Total production in Article 5(1) countries has decreased from almost 100,000 ODP tonnes in 1999 to about 67,000 ODP tonnes in 2002. For 2005, a total CFC production is estimated of 46,000 ODP tonnes, which is about 57% of the total CFC consumption limit in 2005 by all Article 5(1) countries (e.g., 81,214 ODP tonnes).
2.2.1 CFC production for essential uses
Calculating the assumed production for requested/approved essential uses yields production numbers that are reasonably certain up to the year 2006 (requests for essential uses for 2006 were made in the year 2004). The production figures are based upon past experience, which shows that the production level is substantially lower than the amount requested. Best estimates for the production were made for the years 2007-2009. The

October 2004 BDN Task Force Report 14
amounts of CFC produced based on requested and approved essential uses are presented in Table 2-6.
Year Essential uses
requested / approved
CFC produced for essential uses
1999 9,115 7,292 2000 8,313 6,651 2001 6,792 5,434 2002 6,944 4,166 2003 6,577 3,946 2004 5,598 3,359 2005 3,268 1,961 2006 2,789 1,673 2007 - 1,200 2008 - 800 2009 - 800
Table 2-6 CFC requested/approved and produced for essential uses (ODP tonnes)
2.2.2 CFCs available for the Basic Domestic Needs of Article 5(1) countries
It can be calculated that the production from non-Article 5(1) countries for the BDN of Article 5(1) countries has been 20-25% of the total consumption of Article 5(1) countries in the period 1999-2002 (figures reported); this percentage is predicted to decrease to about 14% for the period 2003-2008, with one exception for the year 2009 when it could be higher. The CFC production that would be available for the BDN of Article 5(1) countries (i.e., total CFC production in Article 5(1) and non-Article 5(1) countries less the amounts of CFCs produced for essential uses) is presented in Table 2-7.
Production 2002 2003 2004 2005 2006 2007 2008 2009 Total 93,511 80,315 71,731 55,484 38,039 19,612 15,882 10,553 For essential uses 4,166 3,946 3,359 1,961 1,673 1,200 800 800 Balance 89,345 76,369 68,372 53,523 36,366 18,412 15,082 9,753
Table 2-7 Forecast amounts of CFCs produced that are available to meet the BDN demand of Article 5(1) countries (ODP tonnes)
2.2.3 Issues related to the production of CFCs
The current CFC production processes result in the production of both CFC-11 and CFC-12. Normally, the minimum production rate achieved for CFC-11 is about 30-35% of the total plant production; this percentage is mainly dependent how the catalyst reaction can be controlled. By re-introducing CFC-11 into the chemical reactor an additional amount of CFC-12 can be produced by
Cl3 F C + HF = HCl + Cl2 F2 C

October 2004 TEAP BDN Task Force Report 15
This will cost extra on-time engineering for the transport back to the reactor; it will also increase the energy demand and the need for catalyst, but in this --reflux-- way the minimum percentage of CFC-11 can be brought down to 10%, or maybe even lower /Ber04, Pre04, Vin04/. This is the case for all non-Article 5(1) manufacturing plants and presumably also for Article 5(1) manufacturing plants.
Since in the near future the majority of the current CFC-11 consumption will be phased-out, the excess CFC-11 that would be produced as a by-product of the required quantities of CFC-12 would have to be destroyed since it would have no intrinsic value.
This effect might complicate the balance of future supply and demand of CFCs. The control measures for production are for CFCs as a whole. And the agreements of the producing countries with the Multilateral Fund specify the quotas for CFCs as a whole. It is likely that the demand for CFC-12 will be a large percentage of the total demand in future, which is not reflected in the established quota. This may cause an extra shortage in CFC-12 supply and an oversupply of CFC-11, which will need to be destroyed by an approved method.
Destruction costs for low pressure material CFC-11 would be in the order of US$ 2,500 per tonne in Europe, slightly higher in the USA, i.e. US$ 2,500-3,500 (destruction cost for high pressure CFC-12 would be US$ 3,000-3,500 per tonne in Europe, slightly higher in the USA, up to US$ 4,500). Costs will depend on purity, type of contamination, transportation needs, the amounts of CFC offered for destruction etc. Destruction costs for virgin CFC-material would be slightly lower and are estimated between US$ 1,800 and 2,400 per tonne.
In calculating the balance between supply and demand for future years, the BDN Task Force has not been able to assess the specific consequences of the above issue. If the CFC-11 is destroyed, the amount could be subtracted from the declared "production" reported or from the production amounts as established in Article 5(1) country agreements. If the engineering solutions can be implemented, it could make it possible to again reach the desired CFC-12 production level.
The Task Force does not believe that this issue will be very important, except for the cases that production plants cannot be re-engineered, which would result in the observations mentioned above. In this regard, Parties may wish to consider to further these issues and their impacts on how to cover future CFC-12 demand which implies further study and monitoring regarding the existing control measures and quota as agreed by the Executive Committee of the Multilateral Fund.


October 2004 TEAP BDN Task Force Report 17
3. Prediction of Article 5(1) CFC consumption during 2003-2010
Since the establishment of the Multilateral Fund, among the Montreal Protocol controlled substances, CFCs have been the Fund’s main priority. The reasons are the following:
(a) As opposed to any other controlled substance, CFCs are used by all Article 5(1) countries;
(b) In many countries, CFCs are the only controlled substance in use;
(c) CFCs are used in several industrial sectors and are the only controlled substance (excluding some HCFCs) used in the refrigeration servicing sub-sector;
(d) Of all the controlled substances, CFCs have the most strict phase-out schedule, starting with the freeze in 1999, followed by 50% and 85% reductions in 2005 and 2007, respectively, and a complete phase-out by 2010.
3.1 CFC phase-out plans funded from the Multilateral Fund
Since 1991, of the US $1.43 billion so far allocated for investment and demonstration projects by the Multilateral Fund allocations are as follows: (1) almost 70% for the elimination of CFCs in the consumption sector, (2) about 15% for the closure of CFC and halon production enterprises, and (3) the remaining 15% for the phase-out of all other ODSs (halons, MB, TCA and CTC). Because of the Fund’s priority in phasing out CFCs, the remaining consumption levels in all Article 5(1) countries were much lower than their corresponding baseline, as has been discussed in the previous chapter of the report.
Prior to the 23rd Meeting of the Executive Committee in November 1997, the phase-out of ODS was achieved through the conversion of individual enterprises (i.e., on an enterprise-by-enterprise basis). However, at its 23rd Meeting, the Executive Committee approved the first performance-based multi-year agreement addressing the conversion to non-ODS technologies for an entire sector, sub-sector and/or application; here the total funding level is approved in principle, with the funds to be released over subsequent years in accordance with the achievement of predetermined ODS reductions.
During the compliance period, the Executive Committee has emphasised that future funding must be predicated on a commitment by the country to achieve sustainable permanent aggregate reductions in ODS consumption and production. In this regard, the Executive Committee adopted, at its 35th Meeting in December 2001, two options for calculating the starting point from which the reductions achieved by each Article 5(1) country would be measured. The two options are:
Option 1, calculated on the basis of the Montreal Protocol CFC baseline deducting the amount of CFC to be phased out from projects approved but not yet implemented when the baseline was established in 1997, and projects approved since; and

October 2004 BDN Task Force Report 18
Option 2, calculated on the basis of the latest reported data (1999 or 2000) by each Article 5(1) country to the Ozone Secretariat deducting the amount of CFC to be phased out from projects approved but not yet implemented.
These options yield a consumption level of a country that is still eligible for funding. The consumption level of a country to be phased out may, of course, be different, i.e. larger than the level eligible for funding. It implies that a country has to do extra efforts to comply with the reduction schedules and the phase-out. It is this level of consumption that is determining whether a country will need certain supplies of CFCs and it is this level to which the BDN production applies to.
To date, the Executive Committee has approved 35 multi-year national and sectoral plans to phase-out CFCs in the consumption sector in 32 Article 5(1) countries. The implementation of these agreements will result in the complete phase-out of 47,220 ODP tonnes of CFCs. The majority of the multi-year agreements so far approved are for Article 5(1) countries in Groups I and II (i.e., CFC baseline higher than 360 ODP tonnes). These multi-year agreements are taken into account in the predictions for future Article 5(1) consumption, as presented below.
Most of the ODSs consumed by Article 5(1) countries in Groups III and IV are CFCs, which are mainly used for servicing refrigeration equipment and air conditioning systems. Historically, reductions in the consumption of ODSs in the servicing sector have been addressed through training programmes aimed at enhancing the technical skills of service technicians in properly handling CFC-refrigerants, and technical assistance projects for containing and re-using CFCs banked in refrigeration equipment.
Until November 1997, these activities were approved as stand-alone projects, with limited CFC phase out targets. At that time, the Executive Committee started to consider that, in addition to training of refrigeration technicians and the set-up of refrigerant recovery and recycling networks, Article 5(1) countries also needed support for strengthening their legislative, regulatory and monitoring frameworks; they also needed to improve law enforcement and control techniques of their customs officers and inspectors and to enhance the awareness on ODS-related issues among key stakeholders. In this regard, the Executive Committee approved the first refrigerant management plan (RMP) projects for five Article 5(1) countries, through which the entire consumption of ODSs in their refrigeration servicing sector was addressed using a holistic approach. However, it was not until 2000, when the Executive Committee decided that RMP projects could be approved only when Governments concerned would commit to the phase-out of at least 85% of their CFC baseline consumption by the end of 2007.
Since then, the Executive Committee has approved RMP projects in 41 Article 5(1) countries. The Executive Committee has also approved terminal phase-out plans addressing the entire consumption of ODSs in 18 countries in Groups III and IV.

October 2004 TEAP BDN Task Force Report 19
3.2 Methodology
The BDN Task Force has chosen two scenarios in order to predict possible Article 5(1) countries’ consumption levels during the period 2003-2010.
For the development of the scenarios, the BDN Task Force took into consideration the phase-out commitments in multi-year agreements and RMPs, and existing trends and or phase-out plans (see below).
The Montreal Protocol has a control schedule for CFCs that has discrete steps, i.e. consumption can remain constant until it has to be decreased to a certain percentage in a certain year as dictated by the Protocol. It implies that countries can maintain their freeze consumption level until the year 2005, when their consumption has to be 50% of the baseline. They can then maintain the 50% level during 2006, and can maintain a 15% baseline level during 2007 (when the 85% reduction step enters into force), 2008 and 2009. Consumption under the Montreal Protocol is defined as production plus imports minus exports. This implies that CFCs can be used for processes, such as refrigeration, but can also be stockpiled. In fact, an Article 5(1) country may have reduced its consumption to a fraction of the baseline during 1999-2002; it can still increase its level back to 100% of the baseline during 2003-2004 and stockpile the extra amount, while being in compliance with the Montreal Protocol.
The type of information as mentioned above is not available (and will only be known in 2005 or 2006); it was therefore not considered by the Task Force. However, since it could have major implications in relation to the overall assessment of Basic Domestic Needs in Article 5(1) countries, the Parties may wish to monitor this issue on an annual basis.
3.2.1 First scenario
For the first scenario, the “stepwise reduction + NPPs” - scenario, the following assumptions were made:
(a) Data submitted up to the year 2002 or 2003 were taken as a starting point;
(b) If national phase-out plans (NPPs) were approved, or national phase-out plans have been or will be submitted to Executive Committee Meetings (and documents were known) the data from these plans were used without any modification for the years for which data had so far not been submitted (i.e., as of 2003 or 2004);
(c) For all countries where no plans were known, the consumption level of 2002 or 2003 was assumed to remain constant (2004), with a 50% reduction step in 2005 (compared to the baseline). Thereafter, equal consumption was assumed in 2006 as in 2005, an 85% reduction step was applied in 2007, and equal consumption was assumed in 2008 and 2009 as in 2007.

October 2004 BDN Task Force Report 20
This “stepwise” scenario may lead to an increase in CFC consumption in the year 2003 or 2004 compared to 2002 or 2003, if NPP plans were approved several years ago, and departed from consumption levels known for the years 2000 or 2001. If a country consumption level has decreased to lower levels than agreed in the NPP, this implies a steep increase in consumption from one year to another (still in compliance with the freeze level prescribed until the year 2005). This may not seem logical, but, as mentioned above, countries will have the possibility in 2003 and 2004 to increase their consumption levels for e.g. stockpiling. This “worst case” scenario needs therefore to be considered.
3.2.2 Second scenario
For the second scenario, “gradual reduction + adjusted NPPs” - scenario, the following assumptions were made:
(a) Data submitted up to the year 2002 or 2003 were taken as a starting point;
(b) If national phase-out plans were approved, or if national phase-out plans have been or will be submitted to Executive Committee Meetings (and the documents were known), the data from these plans were used. However, in this second scenario they were not used for certain years if the reported consumption was already lower than the consumption mentioned in the NPPs. In that case the reported consumption was assumed to remain constant in future years until the consumption level in the NPPs had decreased to a level lower than the latest reported consumption. As of that year, the NPP values were taken;
(c) For all countries where no plans were known, the consumption level of 2002 or 2003 was assumed to gradually decrease (in a linear way) to the year 2005, where the 50% reduction step occurs (compared to the baseline). Thereafter there would be a gradual decrease to 2007 (in a linear way), where the 85% reduction step occurs, and a gradual decrease between 2007 and 2010, when consumption should be zero. This is defined as the “gradual reduction plus adjusted NPPs” - scenario (adjustment in this case means some adjustment in the first year or the first two years of the consumption levels as agreed in the NPP).
This “gradual” scenario does not lead to a sudden increase in consumption in the year 2003 or 2004 compared to 2002 or 2003. It also implies that there will only be limited possibilities for stockpiling up to the year 2005 (only due to the assumption of consumption remaining constant).
3.3 Results
3.3.1 Scenario 1: “stepwise reduction + NPPs” - scenario
Overall results for this scenario by Group of Article 5(1) countries are presented in Table 3-1 below. Results for each Article 5(1) country are given in Annex II.

October 2004 TEAP BDN Task Force Report 21
Group 2001 2002 2003 2004 2005 2006 2007 2008 2009 I 88,682 77,524 71,181 70,010 48,920 35,903 17,790 13,582 7,706 II 8,502 7,656 7,096 7,777 6,461 6,011 1,884 1,739 1,600 III 4,507 4,077 4,084 4,299 2,767 2,633 815 777 777 IV 1,688 1,545 1,344 1,476 1,077 952 279 268 265 Total 103,379 90,802 83,705 83,561 59,225 45,498 20,768 16,365 10,347
Table 3-1 Results “stepwise reduction + NPPs” – scenario (ODP tonnes)
In Group I, almost all countries have national phase-out agreements, except Syria, Algeria, and Egypt /MLF04/. The Republic of Korea and Saudi Arabia, which do not receive the Multilateral Fund assistance, should not be taken into account where it concerns phase-out agreements. For Indonesia and Pakistan, draft phase-out agreements have been taken from World Bank documents /Ped04/, which have so far not been submitted to the Multilateral Fund. The values for China were obtained from China /Shq04/. Seven countries in Group I submitted data for the year 2003. From the above table and Annex II, the following observations can be made for the Group I countries:
(a) Consumption decreased by about 13,000 tonnes from 2000 to 2001, and by about 11,000 tonnes from 2001 to 2002, after which the decrease comes to a stop. There is a relatively small decrease between 2002 and 2003 of 6,000 tonnes (of which a large part comes from consumption data submitted by countries for the year 2003), and virtually no decrease between 2003 and 2004. This is due to the fact that values for national phase-out plans were used which, in several cases, where higher than the values reported for the year 2003. In other cases (countries with no agreements) the 2003 and 2004 values were kept constant, i.e. identical to the 2002 value;
(b) The year 2005 shows a substantial decrease of 21,000 tonnes, followed by further increases down to the year 2010. This is mainly due to the fact that the national phase-out plans have a strict reduction schedule for consumption after the year 2005.
In Group II, there is actually only one agreement approved, i.e. for Bangladesh. Agreements have been submitted to the November 2004 Executive Committee meeting for Lebanon, the Dominican Republic, Vietnam and Panama. For the Group II countries, two overall observations can be made:
(a) Consumption did not decrease between 2000 and 2001, and then decreased by about 900 tonnes (2002) and 600 tonnes (2003). For the year 2004 an increase of about 700 tonnes has been calculated, followed by a decrease of about 1,300 tonnes to the 2005 50% (baseline) value. The 2006 value is not much different from the 2005 one, due to the assumptions made in this scenario (equal consumption levels);
October 2004 BDN Task Force Report 22
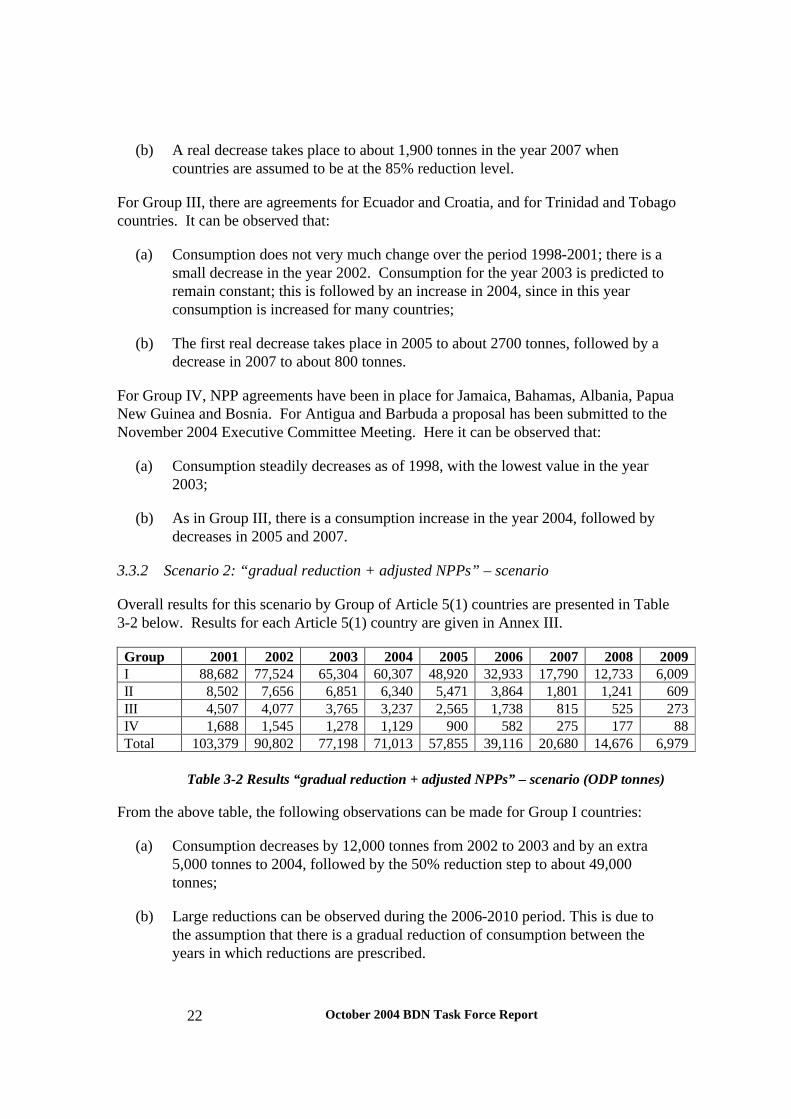
(b) A real decrease takes place to about 1,900 tonnes in the year 2007 when countries are assumed to be at the 85% reduction level.
For Group III, there are agreements for Ecuador and Croatia, and for Trinidad and Tobago countries. It can be observed that:
(a) Consumption does not very much change over the period 1998-2001; there is a small decrease in the year 2002. Consumption for the year 2003 is predicted to remain constant; this is followed by an increase in 2004, since in this year consumption is increased for many countries;
(b) The first real decrease takes place in 2005 to about 2700 tonnes, followed by a decrease in 2007 to about 800 tonnes.
For Group IV, NPP agreements have been in place for Jamaica, Bahamas, Albania, Papua New Guinea and Bosnia. For Antigua and Barbuda a proposal has been submitted to the November 2004 Executive Committee Meeting. Here it can be observed that:
(a) Consumption steadily decreases as of 1998, with the lowest value in the year 2003;
(b) As in Group III, there is a consumption increase in the year 2004, followed by decreases in 2005 and 2007.
3.3.2 Scenario 2: “gradual reduction + adjusted NPPs” – scenario
Overall results for this scenario by Group of Article 5(1) countries are presented in Table 3-2 below. Results for each Article 5(1) country are given in Annex III.
Group 2001 2002 2003 2004 2005 2006 2007 2008 2009 I 88,682 77,524 65,304 60,307 48,920 32,933 17,790 12,733 6,009 II 8,502 7,656 6,851 6,340 5,471 3,864 1,801 1,241 609 III 4,507 4,077 3,765 3,237 2,565 1,738 815 525 273 IV 1,688 1,545 1,278 1,129 900 582 275 177 88 Total 103,379 90,802 77,198 71,013 57,855 39,116 20,680 14,676 6,979
Table 3-2 Results “gradual reduction + adjusted NPPs” – scenario (ODP tonnes)
From the above table, the following observations can be made for Group I countries:
(a) Consumption decreases by 12,000 tonnes from 2002 to 2003 and by an extra 5,000 tonnes to 2004, followed by the 50% reduction step to about 49,000 tonnes;
(b) Large reductions can be observed during the 2006-2010 period. This is due to the assumption that there is a gradual reduction of consumption between the years in which reductions are prescribed.

October 2004 TEAP BDN Task Force Report 23
For Group II, it can be observed that:
(a) Consumption did not decrease between 2000 and 2001, and then decreased by about 900 tonnes (2002) and 800 tonnes (2003);
(b) For the year 2004 a further decrease of about 500 tonnes has been calculated, followed by a decrease of about 900 tonnes to the 2005 50% (baseline) value;
(c) The 2006 value is about 1,600 tonnes lower than the 2005 value. This is followed by a reduction of 2,000 tonnes to the year 2007; thereafter further reductions take place.
For the Group III countries, it can be observed that:
(a) Consumption does not very much change over the period 1998-2001, there is a small decrease in the year 2002;
(b) Consumption for the year 2003 is predicted to decrease slightly (300 tonnes); this is followed by a further decrease of about 500 tonnes in 2004 and 700 tonnes to the 50% reduction year 2005. Further reductions are then calculated per year.
Finally for the Group IV countries, it can be observed that:
(a) Consumption steadily decreases as of 1998, with a value of 1278 tonnes in the year 2003, 1129 tonnes in the year 2004 and 900 tonnes in the year 2005;
(b) Thereafter gradual reductions take place to zero in the year 2010.
3.3 Comparison of the results between the two scenarios
Total consumption levels for the four Groups for the period 2002-2009 for the two different scenarios are shown in Table 3-3.
Scenarios 2002 2003 2004 2005 2006 2007 2008 2009 Stepwise 90,802 83,705 83,562 59,225 45,498 20,768 16,365 10,347 Gradual 90,802 77,198 71,013 57,855 39,116 20,680 14,676 6,979
Table 3-3 Comparison of the results between the two scenarios (values in ODP tonnes)
The total consumption levels predicted by the two scenarios are very similar for the years 2005 and 2007 when mandatory reductions in CFC consumption are enforced. However, major differences in CFC consumption are forecast for 2003-2004 (over 12,500 ODP tonnes) and in 2006 (6,300 ODP tonnes). The main explanation for the differences in consumption is related to the differences in consumption in Group I, where often high consumption is maintained after a “control year”, where CFCs could be stockpiled. For the period 2007-2009, one can observe that the difference between the two scenarios

October 2004 BDN Task Force Report 24
increases, due to the fact that in the stepwise scenario the consumption for a certain number of countries is kept constant (2007 level); here CFCs could again be stockpiled.

October 2004 TEAP BDN Task Force Report 25
4. Conclusions on CFC Consumption and Production
The BDN Task Force analysed the CFC consumption and production in Article 5(1) and non-Article 5(1) countries in the period 2003-2010 using the following official sources of information:
(a) CFC consumption and production data reported by Parties to the Ozone Secretariat under Article 7 of the Montreal Protocol;
(b) Reductions in CFC consumption and production (where applicable) that relevant Article 5(1) countries have committed through national and sectoral phase-out plans (including RMPs) as approved by the Executive Committee. As described in the previous chapter, two scenarios were considered: a stepwise and a gradual one;
(c) Requested / approved amounts of CFCs for essential uses by non-Article 5(1) countries.
2002 2003 2004 2005 2006 2007 2008 2009 Total production By non-Article 5(1) countries 26,276 15,004 13,000 9,397 8,550 3,419 3,019 3,019
Of which for essential uses 4,166 3,946 3,359 1,961 1,673 1,200 800 800
Remaining BDN 22,110 11,058 9,641 7,436 6,877 2,219 2,219 2,219 By Article 5(1) countries 67,236 65,311 58,731 46,087 29,489 16,193 12,863 7,534
Article 5(1) countries + BDN 89,346 76,369 68,372 53,523 36,366 18,412 15,082 9,753
Total consumption Stepwise scenario Group I 77,524 71,181 70,010 48,920 35,903 17,790 13,582 7,706 Group II 7,656 7,096 7,777 6,461 6,011 1,884 1,739 1,600 Group III 4,077 4,084 4,299 2,767 2,633 815 777 777 Group IV 1,545 1,344 1,476 1,077 952 279 268 265 Total 90,802 83,705 83,562 59,225 45,498 20,768 16,365 10,347 Gradual scenario Group I 77,524 65,304 60,307 48,920 32,933 17,790 12,733 6,009 Group II 7,656 6,851 6,340 5,471 3,864 1,801 1,241 609 Group III 4,077 3,765 3,237 2,565 1,738 815 525 273 Group IV 1,545 1,278 1,129 900 582 275 177 88 Total 90,802 77,198 71,013 57,855 39,116 20,680 14,676 6,979 Balance (production minus consumption) Stepwise scenario (1,457) (7,336) (15,190) (5,702) (9,132) (2,356) (1,283) (594) Gradual scenario (1,457) (829) (2,641) (4,332) (2,750) (2,268) 406 2,774
Table 4-1 Analysis of CFC consumption and production for the period 2003-2010 (ODP tonnes) (values in parentheses are negative values)

October 2004 BDN Task Force Report 26
The “calculated” results of the analysis are summarised in Table 4-1; they can be found in Annex V in a somewhat more elaborate form, and for more years in the past.
From the results of the above table, the following observations can be made:
(a) The analysis yields a relatively small deficit of 1,457 tonnes of CFCs in 2002, notwithstanding that the amounts of CFC consumption and production used were those reported by Parties to the Ozone Secretariat. However, in 2002 no deficit of CFCs were reported in any Article 5(1) country;
(b) The stepwise scenario yields deficits for the entire period 2003-2009. Deficits between 5,000 and 15,000 ODP tonnes are predicted for the years 2003-2006. One of the reasons for the high deficit in the 2003-2006 period is due to the CFC consumption levels in approved phase-out plans mainly in Article 5(1) countries in Group I and II which are higher than the current CFC consumption (i.e., the consumption in 2002 or 2003, when reported);
(c) The gradual scenario yields smaller deficits than the stepwise scenario, with still a major deficit in 2005 (over 4,300 tonnes). However, there is a positive balance for the years 2008 and 2009;
(d) While the analysis yields deficits for the years 2002 to 2004, there has been no sign of any shortage in any Article 5(1) country (even during 2004).
In order to explain the deficit in CFC in the period 2002 to 2004, the BDN Task Force analysed the CFC production and consumption data reported by all Article 5(1) and non-Article 5(1) countries under the Protocol for the years 1990 to 2000, as shown in Table 4.2.
Year CFC production CFC consumption CFC balance 1990 764,284 726,582 37,702 1991 664,310 610,864 53,447 1992 590,804 562,720 28,084 1993 506,021 486.374 19,647 1994 338,462 356,447 -17,985 1995 253,756 280,447 -26,691 1996 151,582 173,767 -22,185 1997 158,754 170,922 -12,168 1998 146,832 161,067 -14,235 1999 146,780 149,044 -2,264 2000 133,041 146,720 -13,679 2001 100,961 109,921 -8,960 2002 93,918 91,305* 2,615
* anomaly in one report of consumption data which should be substantially larger; this would again result in a small deficit
Table 4-2 CFC production and consumption in the 1990-2002 period (ODP tonnes)

October 2004 TEAP BDN Task Force Report 27
The following observations can be made from the above table:
(a) There is a huge surplus reported for the years 1990-1993 and a deficit for all the years 1994-2002 (with a relatively low deficit value for the year 1999 and a similarly low one for the year 2002, if all reported data would be as expected. In one case there is a sudden underreporting in 2002 of several thousands of tonnes);
(b) The positive balance in the early years can be explained by the fact that most producing countries reported to the Ozone Secretariat, a certain number of, in particular, Article 5(1) countries had not ratified the Montreal Protocol, however, consumed a certain amount of CFCs produced by Parties to the Protocol;
(c) This positive balance can also be explained by the fact that for the majority of the countries, and here in particular Article 5(1) countries, accurate reports on the consumption and production of CFCs (and most or all of other ODSs) were not available. Hence, data reported to the Ozone Secretariat was based on the “best estimate” approach;
(d) In general, CFC production levels are more accurate than consumption levels since there are much less countries producing CFCs (13 non-Article 5(1) and 19 Article 5(1) countries in 1990, only 6 Article 5(1) countries in 2004) and there is a relatively small number of CFC production plants;
(e) As the capacity of Article 5(1) governments was strengthened and enhanced and Ozone Units became operational in many Article 5(1) countries, the quality and soundness of the reported data increased. However, there are still some concerns on the soundness of the data reported to the Ozone Secretariat due to, among others, issues related to direct imports of ODSs by end-users or related to illegal trade;
(f) As of 1993, when production and consumption in the non-Article 5(1) countries went down steeply, the reported consumption in several Article 5(1) countries increased substantially, and more Article 5(1) countries reported consumption than before 1994;
(g) As of 1994 the CFC deficit was in the order of 12,000 to 26,000 tonnes globally, a very large number. However, not in any given year, a deficit of CFCs occurred;
(h) In 1999, the year when the first compliance requirement for Article 5(1) countries entered into effect, the CFC deficit was very small compared to any other year (about 2,000 tonnes). This could be explained on the basis of higher production levels in the freeze year with possibly some stockpiling. A second

October 2004 BDN Task Force Report 28
explanation could be that the consumption reported was low in order to meet the freeze and no stockpiling occurred in 1999 (possibly in contrast to earlier years).
It is to be noted that the deficit of CFCs over the period 2003 to 2009 resulting from the analysis of the two scenarios is much lower than the calculated deficit of CFCs using the historical reported data over the period 1994-2002.

October 2004 TEAP BDN Task Force Report 29
Annex to Chapter 4: Comparison with an earlier European Commission Study
In 2003, the European Commission completed a study in which the production and consumption streams in non-Article 5(1) and Article 5(1) countries were analysed /CFC03/. It did not consider all countries, but it considered the 20 major countries separately (Group I in this study), plus a number of representative Article 5(1) smaller countries. It also took into account existing production agreements at the time of the drafting of the report. Data that were used were either from the year 2000 or 2001, and in so far as the study is at least two years older than the present one, it implies that not all production agreements could be taken into account, and that many NPPs, now decided, could not be considered either.
The study is based upon a gradual scenario (comparable to the scenario 2 “gradual phase-down” in this study). It concludes no deficits for the difference between production and consumption, except a small deficit for the year 2007 (the study has not investigated values for production and consumption for the period 1990-2000).
The EC study calculates a consumption level for Group I, which is about 15,000 ODP tonnes smaller than calculated in this study for Group I for the period 2003-2005. The EC study predicts values that are 500-6000 ODP tonnes smaller for the period 2006-2009 for Group I than predicted in this study. The major difference is in Group I, whereas values calculated for Groups II, III and IV in the EC study are comparable to the ones calculated in this study.
Task Force European Commission Study Year Production Consumption Balance Production Consumption Balance 2003 76,369 77,198 (829) 73,358 64,817 8,540 2004 68,372 71,013 (2641) 61,850 55,282 6,566 2005 53,523 57,855 (4332) 46,276 44,074 2,202 2006 36,366 39,116 (2750) 34,306 32,577 1,730 2007 18,412 20,680 (2268) 18,424 19,558 (1,134) 2008 15,082 14,676 406 14,082 12,856 1,226 2009 9,753 6,979 2,774
7,740 6,608 1,132 Table A4-1 CFC production, consumption and balance predicted for the period 2003-2009, comparison of the results of the present study with the results of a study requested by the European Commission /CFC03/
The EU study predicts significantly lower production levels than this study does for Article 5(1) countries for the period 2003-2005 (about 8,000 ODP tonnes lower) whereas the figures for the period 2007-2009 are comparable. The most likely explanation is that not all production agreements could be taken into account, particularly the one for Mexico, which allows much larger production during 2003-2005 than assumed in the EC study.

October 2004 BDN Task Force Report 30
A comparison of the production and consumption predicted by this study and by the EC study is presented in Table A4-1. It can clearly be observed that both production and consumption levels in the EC study are lower than in this study, however, consumption is much lower. This results in a prediction of an oversupply in the EC study for all the years 2003-2009 except for 2009, whereas this study only predicts an oversupply for the years 2008 and 2009.
Year Task Force Eur. Comm. Study 2003 11,058 16,066 2004 9,641 11,266 2005 7,436 7,729 2006 6,877 6,598 2007 2,219 1,212 2008 2,219 1,212 2009 2,219 1,212
Table A4-2 CFC BDN production by non-Article 5(1) manufacturers, predicted for the period 2003-2009 (ODP tonnes); comparison of the results of the present study with the results of a study requested by the European Commission /CFC03/
Values calculated for BDN production in the EU study are substantially larger for the period 2003-2005 whereas for the period 2007-2009 they are somewhat lower than the ones predicted in this study (difference of about 1,000 tonnes annually). Values are given in Table A4-2. An explanation for this difference is difficult to give, except that the fact that this study had information for the years 2001, 2002 and 2003 for the BDN production, which was not the case for the EC study.
The Task Force would like to note that, with the number of agreements that has significantly increased between 2001 and 2004, the predictions in the EU study may no longer be accurate; this is valid for both production and consumption (total amount produced (Article 5(1) plus BDN) over the period 2003-2009: EC study: about 247,000 ODP tonnes, this study: about 276,000 ODP tonnes).
It is clear that the EU study needs further analysis if all basic assumptions need to be investigated and differences explained.

October 2004 TEAP BDN Task Force Report 31
5. Other Contributing Factors on BDN Production for Article 5(1) countries
It cannot be concluded whether or not a CFC deficit will occur in any given year over the 2003-2010 period, based on CFC consumption and production data reported by the Parties and on the phase-out schedule proposed in the approved national and sectoral phase-out plans in several Article 5(1) countries.
The following contributing factors will be discussed below:
§ Phase-out strategies in the refrigeration servicing sector in Article 5(1)countries;
§ Amounts of CFCs recovered and reused reported under Article 7 of the Montreal Protocol;
§ Amounts of recycled CFCs in Article 5(1) countries;
§ Prices of CFCs and alternative refrigerants and their availability;
§ Actual production of CFC-12 in manufacturing plants;
§ Accelerated phase-out in China;
§ CFC stockpiling
§ Illegal trade
5.1 Phase-out strategies in the refrigeration servicing sector in Article 5(1) countries /ExC03/
It could be verified that RMPs have played a decisive role in co-ordinating activities for the reduction of CFC consumption in the servicing sector and in accelerating the phase-out process. The most important factors contributing to this progress were enforced legislation, strict import controls reducing the availability of CFCs, and adequate training of customs officers and refrigeration technicians.
Furthermore, the well-orchestrated and active involvement of the private sector in the process of CFC phase-out has shown to be one of the key elements of compliance and successful RMP implementation.
Training courses in good practices have been carried out covering 30 to 70% of technicians working in registered workshops, in some cases including also technicians working in the informal servicing sector. In general, training of technicians is now a self-sustaining process, as local trainers were trained and the training modules incorporated into the curricula of the refrigeration courses in Technical Colleges. In companies whose owners or technicians were trained under an RMP project, the knowledge was generally passed on to other technicians. Governments hesitate to make certification obligatory for fear of creating a social problem in the often large and uncontrollable informal servicing sector which is interested in training and equipment but prefers to avoid registration,

October 2004 BDN Task Force Report 32
oversight and reporting. The practice of venting remaining CFC before repair (if some is left in the system) and of flushing with CFC was reported to have generally stopped after the training. Flushing is now done with nitrogen or compressed air, which is also cheaper, and this might be the single most important effect in emission reduction in the domestic sector. Secondly, leak fixing and preventive control is receiving much more attention now, which is particularly significant for commercial and industrial installations where leakage rates of 30 and up to 50% per year were reported as fairly common. The introduction of good practices in refrigeration servicing might therefore be the most decisive factor in reducing CFC consumption and emissions, with recovery and recycling being the less important part of it.
Recovery of CFC is regularly practiced by the workshops, which have received equipment. However, there are few reliable quantitative data available, as mentioned above. Moreover, the figures in project documents and progress as well as completion reports generally do not show separate amounts for CFC to be recovered and recycled. The following practices were commonly observed and reported:
(a) Little recovery and re-use of refrigerants takes place in the workshops for small appliances but much more at the client’s site if commercial or industrial installations units are serviced and large quantities of CFC or more often R-22 can be recovered. They are usually filled right back into the same equipment, if the technician trusts that no serious contamination, e.g. through a compressor burn-out, has taken place.
(b) Recovery and re-use is also applied in some MAC workshops where combined R&R machines are employed which are equipped with filters and dryers to eliminate particles and moisture. However, quantities recovered are limited because MAC are usually brought in for servicing only when the cooling is completely down, that means there is often no more refrigerant left in the system. When a car is re-charged from a recycling machine it is getting refrigerant from several previous clients at the same time. This is not an issue with MAC systems because the refrigerant is unlikely to be contaminated with acids, and contamination is not so critical. There is always a risk of mixing different refrigerant types in a recovery or recycling machine in a workshop, which services systems with different refrigerants. However, good operator practice / training should prevent this. Privately bought R&R equipment, which is common in large workshops operating as licensed contractors of principal car manufacturers is usually fitted for HFC-134a only and CFC is vented.
(c) Servicing of domestic refrigerators generates very little recovered CFC even when they are brought into the workshops, because the main reason for repairs are either leakages or compressor burn-outs. In the first case, the small charge is further diminished and in the second the CFC is contaminated with acid which only reclamation and technically sophisticated recycling machines would be able to take out.
(d) Recovered CFC is very rarely brought to recycling centres. The main reason is that the need and utility is seen only for the few cases, where recycling would make a

October 2004 TEAP BDN Task Force Report 33
difference, that means when simple or repeated recovery would not sufficiently eliminate contaminants and moisture and when the CFC recovered is not contaminated to an extent that it would warrant reclamation or destruction. Another limiting factor is that the transport of recovered CFC in cylinders is time consuming and costly. Moreover there is often some mistrust with regard to the reliability of recycling centres in terms of quality, fees charged, timeliness of service and, in situation of CFC-scarcity, return of the recycled CFC. Efforts to increase the use of recycling centres would need to address all these issues, which does not seem likely with experiences so far.
In summary, the result of the recovery and recycle activities funded so far show that there is no indication that recovery and recycle activities will have a significant impact on reducing the demand. This might change in future.
5.2 Amounts of CFCs recovered and reused reported under Article 7 of the Montreal Protocol
Under Article 7, Parties should report the imports and exports of recycled material. Although reports are available as of 1992, the reports in the early years did not contain much information. The Task Force has analysed the data for the years 2000-2002, which are presented in Table 5-1.
Article 5(1) Non-Article 5(1) Year Substance Imports Exports Imports Exports 2000 CFC-11 20.0 0.0 5.9 0.0 CFC-12 26.1 10.0 276.7 15.3 CFC-113 0.0 0.0 12.0 0.0 CFC-114 0.0 0.0 0.0 0.0 CFC-115 0.0 0.0 5.9 3.6 2001 CFC-11 0.0 0.0 7.9 0.4 CFC-12 31.1 0.0 240.5 26.9 CFC-113 0.0 0.0 4.5 0.0 CFC-114 0.0 0.0 0.0 0.0 CFC-115 0.1 0.0 1.5 0.0 2002 CFC-11 0.0 0.0 12.7 0.0 CFC-12 26.8 0.0 307.2 2.9 CFC-113 0.0 0.0 4.0 0.0 CFC-114 0.0 0.0 19.0 18.9 CFC-115 0.0 0.0 1.8 0.0
Table 5-1 Reported imports and exports of recycled CFC material in Article 5(1) and non-Article 5(1) countries during 2000-2001 (metric tonnes) /UNE04/
As can be observed, relatively small amounts of exported and imported recycled material are reported by a relative small number of countries. There is an imbalance in non-Article 5(1) imports and exports, e.g. imports of CFC-11/-12 are in the order of 300 tonnes, whilst exports reported are 10% or less. For the Article 5(1) countries, imported

October 2004 BDN Task Force Report 34
amounts reported are in the order of 30-40 tonnes annually with virtually no exports reported (only 3-7 Article 5(1) countries report, mostly from the LVC and VLVC Groups). Of course, imports add to the consumption to be reported, but the amounts reported do not contribute to any phase-out or a reduction in supply needs. Parties may consider to adjust the system to get a better feeling of the market in recycled material over the period 2005-2010, e.g. the importing Party could also report on the origin of the material, e.g. the exporting Party, which could then be verified, suppose registration procedures at the user level and customs procedures are in place.
5.3 Amounts of recycled CFCs in Article 5(1) countries
The amounts of CFCs recycled and reused in a country can contribute significantly to the reduction of the demand and also to the consumption as reported under the Montreal Protocol.
As mentioned above, and also based upon the experience in developed countries, the amount of material that is recycled is normally low, in particular when prices are low and logistics and administrative procedures are cumbersome. Values between 0% and 6% /CFC03/ are mentioned in different sources. This would imply that 1000’s of tonnes of CFCs will be recycled in the period 2005-2010 and will contribute to a reduction of consumption. However, these values will never be reported to the Montreal Protocol Parties.
In predicting the phase-out by 2010 in the two scenarios presented above, a large amount of the predicted consumption is based on National Phase-out Plans, Terminal Phase-out Plans, sector-plans, RMPs etc. All these plans consider the training of technicians and customs officers, the providing of the adequate tools for servicing, retrofits and recovery and recycling and estimate that all these strategies together could well yield reductions of 30-80% (and even 100% in VLVCs); this implies that recovery and recycle may well be in the range of 4-15% in the reduction of the total CFC consumption. However, it may be anticipated that all efforts besides recovery and recycling may yield the largest savings in the near future. Too give a quantitative value at this stage is too speculative, and Parties may wish to address this further in the future via evaluation reports of the Multilateral Fund Secretariat (see also paragraph 5.1 where it concerns the impact of recovery and recycling).
5.4 Prices of CFCs and alternative refrigerants and their availability
CFC prices in the Article 5(1) countries are low and vary by country (region), by chemical and by product packing. The EC report and others /Ber04, Pre04, Vin04/ mention price ranges for CFC-11 and CFC-12 for the years 2000-2001:
CFC-11: US$ 1.50-4.00 CFC-12: US$ 1.70-6.60

October 2004 TEAP BDN Task Force Report 35
The bulk price is normally in the low end of the ranges given. Values can be even higher than the upper values presented in certain geographical regions, or when certain import taxes or levies are applied. If one takes the average value of CFC bulk prices (the value in the lower part of the range) and sets it at 100% in the year 2000, following average global bulk price would apply:
2000: 100 2001: 100 2002: 115 2003: 160 2004: 160
It is not clear why prices have increased by 2003, after which they seem to stabilise again; it may be due to certain Article 5(1) production limitations or strategies by BDN non-Article 5(1) manufacturers. A reasonably good explanation cannot be given here and would need further detailed study per region.
From the above it is clear that the price fluctuation does not indicate at any shortage up to the year 2000 and even not thereafter. Real supply shortages would have shown a steeper continuing increase in price level
The global price level for HFC-134a as the main alternative was about US$ 5.0-12.0 per kg, dependent on the product packing and the season; it may have been even more costly in certain regions. For the global bulk price in 2000 one can assume a value of US$ 5.0-6.0; if this value is set at 100%, the following average bulk price would apply:
2000: 100 2001: 80 2002: 75 2003: 70 2004: 80
Due to a certain increase in consumption in the last one to two years, with no real expansion of production, it can be assumed that the price has increased slightly. The bulk price difference between CFC-12 and HFC-134a is therefore still present, with a minimum US$ 1.50 higher price for HFC-134a but the difference can be significantly larger, dependent on the region.
The following has been taken from the ExCom Document 41/7: “While in many countries, CFC is still significantly cheaper than HFC-134a, the difference has narrowed in others, and in a few places, CFC is now more expensive than HFC-134a, at least during the hot season when demand peaks and CFC has become scarce due to import restrictions, as in Jamaica, or as a result of import duties, in Mauritius, or Swaziland and other countries bordering South Africa which has introduced a levy on CFC. In view of the small refrigerant charge, the domestic sector is not very sensitive to price differences of refrigerants while MAC and commercial/industrial sectors tend to pay more attention to it. Generally, it seems availability, convenience of handling and operational reliability of refrigerants are more important than prices. For the commercial and industrial sector,

October 2004 BDN Task Force Report 36
it is mainly the price of HCFC-22 in relation to CFC-12, which has some influence, but also here technical reasons and (future) availability seem to be more important determinants for the conversion than price differences”. /ExC03/.
5.5 Actual production of CFC-12 in manufacturing plants
In the usual CFC-11/-12 production plant both CFC-11 and -12 are being manufactured. The ratio between these two chemicals depends on process conditions, catalyst use etc. Without major changes the plant can be maximised for CFC-12 production, which would be in the order of 65% of the total. By engineering modifications, and with reflux of the CFC-11 produced back to the reactor, the percentage of CFC-12 can be brought to 90% and even higher /Pre04, Vin04/. Theoretically, the CFC-11 production could be brought to zero.
This was discussed in an extensive way in section 2.2.3. Parties may wish to consider to verify whether the plants which will produce through 2009 in the Article 5(1) countries can be engineered in such a manner that the CFC-11 output can be minimised. If CFC-11 could be destroyed and thereby subtracted from the declared "production" reported or prescribed in Article 5(1) country agreements, it may be possible to reach the allowed level of CFC production via the production of CFC-12 only.
5.6 China’s Accelerated Phase-out Plan
The development objective of this project is that China implements a CFC accelerated phase-out plan (APP) to ensure achievement of the zero CFC production target by 1 July 2007 (two and a half years ahead of the Protocol) and control of illegal trade and consumption. With the accelerated phase-out of CFC production, the phase-out of CTC production as CFC feedstock, as well as the CFC consumption will be accelerated accordingly.
The key points of the plan are /APP04/: § All CFC production will be stopped before 1 July 2007; § The phase-out schedule for the foam sector will be accelerated. § The accelerated consumption phase-out will also be reflected in the
pharmaceutical aerosol sector plan and the refrigeration sector plan; § CTC production as feedstock will be advanced. The advanced amount will
be about 18,743 ODP tonnes. This section does not study the consequences for the Chinese export, the possibilities for stockpiling or any other domestic effect. It only studies the effect of the accelerated production and consumption on the global balance. In the figures analysed, the recovery and recycling option for the refrigeration-servicing sector has not been taken into account (however, implicitly this was done in both the original scenarios 1 and 2 because most NPPs assume recovery and recycle). In China, the recovery and recycle option would reduce the consumption further and would lead to lower deficit figures (or higher positive figures).

October 2004 TEAP BDN Task Force Report 37
Year 2005 2006 2007 2008 2009 Production 18750 13500 9600 7700 3200 APP 18750 13500 9600 550 550 Difference - - - -7150 -2650 Difference Consumption Agreed – APP
- (foams and aerosols)
- -3421 -3849 -176
Article 5(1) + BDN prod 53523 36366 18412 15082 9753 Ibidem +APP 53523 36366 18412 7932 7103 Scenario 1 (stepwise) 59225 45389 20768 16334 10287 Scenario 1 +APP 59225 45389 17347 12485 10111 Scenario 2 (gradual) 57855 39116 20680 14676 6979 Scenario 2 + APP 57855 39116 17259 10827 6873 Production-consumption
Scenario 1 -5701 -9023 1065 -4553 -3008 Scenario 2 -4332 -2750 1153 -2895 300
Table 5-2 Values for the two scenarios with and without China’s APP /Wba04/ (ODP tonnes), compare Annex V
The impact of the Chinese APP can be quantified as follows. The original Scenario 1 predicts a total deficit of 4141 ODP tonnes for the years 2007-2009; in the case of the APP this deficit would be 6496 ODP tonnes. In the case of Scenario 2 there is no deficit predicted but a slight positive balance of 912 ODP tonnes. In the case of the Chinese APP there is a deficit predicted for the period 2007-2009 of 1442 ODP tonnes.
The Task Force is not able to present an analysis of the impact of the Chinese APP on the global supply situation, except that the deficits seem to increase slightly. However, the predictions for the years 2004-2006 already have shown larger deficits, and there was even no shortage of CFC supply for the years 2000-2002 when deficits calculated from data submitted were substantial.
5.7 CFC stockpiling
Distributor end end-user stockpiles may serve as a source to meet future demand. Large importers and manufacturers in Article 5(1) are assumed to keep an inventory of 45 days of sales /CFC03/. End-users, fearing shortfalls of acceptable grades of CFCs may stockpile inventories equal to 18-24 months of use. An example can be given for chillers in the developed countries where chillers are still in operation almost ten years after the CFC phase-out by using stockpiles and some recycled material to keep the equipment running.
In the calculation procedure for the Montreal Protocol, the build up of stockpiles is calculated as consumption in a given year (consumption = production + imports - exports

October 2004 BDN Task Force Report 38
- destruction). If large stockpiles would be acquired in certain years, in particular during 2000-2003, it would lead to higher predictions than necessary in the scenarios presented. It should be noticed that the build up of stockpiles is not related to a deficit or imbalance between production and consumption figures. Calculating deficits is not related to build up of inventories. However, the build up of stockpiles may lead to illegal trade if prices of CFCs become attractive enough or prices of alternatives tend to decrease much. This is a purely qualitative observation, which is very difficult to check.
5.8 Illegal trade
It is not known how the material that is traded illegally gets into the illegal circuit; it may well be virgin CFC material that has been manufactured in Article 5(1) or non-Article 5(1) countries and was stockpiled. The impact of illegal trade on Article 5(1) or non-Article 5(1) BDN production is unknown. Reported data suggest that illegal trade world-wide could be 6-15% of the global production. It cannot be assumed that illegal trade can explain the negative balance calculated between production and consumption in the period 1994-2002; however, it may be mentioned that the deficits observed for the years 2000-2002 are smaller than 10% of the total production. If a significant amount of CFCs is smuggled from the Article 5(1) into the non-Article 5(1) countries, the consumption in the Article 5(1) countries would be artificially high and the needs to be produced via the BDN production would be exaggerated. It is not likely that this effect can qualitatively explain the imbalance between production and consumption observed and predicted.
Illegal --non reported-- production would also affect the results predicted in this study. Large scale illegal production would increase the supply levels, would decrease price levels, and delay the transition out of CFCs. Illegal production may increase over time, as CFC prices are expected to rise in response to supply cutbacks.
CFC illegal consumption and production creates uncertainties where it concerns the analysis in this report, based upon official reported data. In many cases the question is how to define "illegal". CFCs are often exported in a legal manner by producing countries (which then report lower consumption) to importing countries that do not report the imports, or to a significantly lower level /EIA04/. This would imply an even higher level of consumption than reported by all countries (and would then add to the deficits observed for all the years). The Task Force cannot quantify this uncertainty, and it would also be difficult to assess quantities involved in future; it would need further monitoring by Parties.
Furthermore, it can be reasonably assumed that certain quantities are imported as recycled material (and are reported to UNEP’s Ozone Secretariat), where the exports are not registered anywhere, and this could be part of the illegal trade. The same applies to not reported overproduction or trade from stockpiles, which is not reported where the original build up of inventories has been officially reported as consumption under the Montreal Protocol.

October 2004 TEAP BDN Task Force Report 39
6. CTC Production and Consumption
The CTC production and consumption levels (non-feedstock uses) in Article 5(1) and non-Article 5(1) follow a strange behaviour. It varies from large positive to zero to large negative numbers in some countries, which raises the suspicion that these data are related to feedstock import or export. It is also so that numbers for several years for several countries have not been reported.
Some data are given in Table 6-1, from which an irregular, “unreliable” behaviour of the production and consumption figures can be concluded. These data do not give any support for the determination of the feasibility of a 85% reduction in CTC consumption by the year 2005.
Year 1997
1998 1999 2000 2001 2002
Production non-A5(1) -1296 3982 1272 1400 10838 -1591 Production A5(1) 5568 61839 28957 75884 80620 18243 Subtotal 4272 65820 30228 77285 91485 16652 Consumption non-A5(1) -31747 -28915 -13074 -22973 -10040 -14322 Consumption A5(1) 5264 99958 23048 99655 76051 19244 Subtotal -26483 71043 9974 76682 66011 4922 Prod-Cons A5(1) 303 -38120 5909 -23771 4568 -1001 Prod-Cons Subtotals 30755 -5223 20255 602 25447 11730
Table 6-1 CTC production and consumption data (ODP tonnes) for non-Article 5(1) and Article 5(1) countries based upon data submitted to UNEP /UNE04/
As can be observed in the Table 6-1, it is impossible to derive any relationship between production and consumption of non-Article 5(1) countries, and the consumption of Article 5(1) countries, taking into account their own production. In principle one could delete the producing countries from the data submitted under the assumption that in this case feedstock reporting would be avoided. However, this would also delete the consumption of CTC for other uses (process agents, cleaning etc.), which is not logical.
The CTC production and consumption, and in particular CTC exports, deserve more thorough analysis, in particular related to which data are submitted in which year by which countries, before that any conclusions can be drawn (see also below).
6.1 CTC feedstock production, imports and exports; projections
All non-Article 5(1) and Article 5(1) countries report CTC feedstock production, imports and exports to UNEP. It might be that from these submissions a tendency of exports from non-Article 5(1) countries into Article 5(1) countries could be derived. It should be taken into account here that CTC is used as feedstock for the production of CFCs, but it

October 2004 BDN Task Force Report 40
may also be used as feedstock for other fluorochemicals such as HFC-134a. Question is whether one can define the CFC feedstock production, import and export issues as falling under the “Basic Domestic Needs” issue. According to the Task Force this import and export issue is of a different nature and should be considered in a different framework. Some figures are given in the table below.
Year 1997
1998 1999 2000 2001 2002
Non-Article 5(1) Parties Production feedstock 172,571 160,666 193,073 158,224 114,149 115,711 Import feedstock. 12,854 7,852 11,665 13,391 1,017 2,192 Export feedstock 71,181 59,322 69,714 46,783 49,312 33,896 Article 5(1) Parties Production feedstock 66,248 26,130 59,835 10,874 14,847 91,545 Import feedstock 92,350 35,374 104,003 45,694 50,454 32,875 Export feedstock 19,369 15,258 16,987 5,396 1,872 1,150 (China reports data) Yes No Yes No No Yes
Table 6-2 Production, import and export data for CTC feedstock (ODP tonnes) for non-Article 5(1) and Article 5(1) countries based upon data submitted to UNEP /UNE04/
When studying the data, one could assume that the exports for Article 5(1) countries are not overly important. In many years, such as 2000, 2001 and 2002 (even where China did not report in 2000 and 2001) the import data for Article 5(1) countries are of the same order as the export data for non-Article 5(1) countries. However, this is not at all the case in the year 1999, which effect cannot be explained.
It seems that the use of CTC feedstock in the Article 5(1) countries is increasing if one looks at the years 1997, 1999 and 2002 when China reported data, although this trend is difficult to establish with the varying numbers for countries without China in the years 1998, 2000 and 2001. Total feedstock use in the Article 5(1) countries may well be higher than 100,000 ODP tonnes in the year 2003. The CTC issue is a complex one because it does not only relate to production and consumption of uses, but more importantly to feedstock use. In a presentation it was summarised as follows: “…….(1) Import and export data must be globally de-mystified, (2) there should be one cohesive data set, Article 7 anomalies should be addressed, (3) Specific sales licenses for sellers and their supply chains should be considered: the end-user must be known and have a clearly approved application, (4) The supply chain (distributors) should be used to account for each sale (condition of being in this business), (5) There is a specific link of CFC-11/-12 manufacture to the CTC supply chain: identify seller and user.

October 2004 TEAP BDN Task Force Report 41
A discussion on definitions used in CTC reporting is considered necessary, where 30% of the problem is assumed to be found in Montreal Protocol definitions, 70% can be avoided by training companies..” /She04/.
By the way, it needs to be taken into account that total CFC production in Article 5(1) countries decreased by 40% between 1997 and 2002. This makes the strong increase in CTC feedstock even more difficult to explain.
The Task Force would also like to draw attention of Parties to the Decision proposed at the 24th OEWG, i.e., for the TEAP to assess global emissions of CTC from feedstock and process agent sources situated in both non-Article 5(1) and Article 5(1) Parties, from sources that co-produce CTC and from waste not destroyed in an appropriate manner.
This study is particularly important, because CTC is the only common ODS the production of which (as a co-product or by-product) will continue indefinitely after 2010, and global and regional supply and demand for CTC is a most important issue in future.

October 2004 TEAP BDN Task Force Report 43
7. Concluding Remarks
§ This study is based on the data submitted by the Parties to Ozone Secretariat for the years up to 2002-2003. The analysis has subdivided the Article 5(1) Parties into four Groups, the first Group consisting of the 20 major consuming Article 5(1) countries. These Groups were considered in further analysis. Consumption in Group I countries amounts to about 85% of the total global consumption in Article 5(1) countries and does not change much over the last four years. In fact, most of the specific consumption patterns are related to the consumption levels in this Group. It is, in fact, also in this Group that most of the countries have an agreed National Phase-out Plan for CFC consumption. It also implies that, for the larger part, one can predict the future Article 5(1) consumption on the basis of these plans
§ This study analyses the consumption pattern in the future via two possible ways, (a) a stepwise behaviour, which is allowed under the Protocol, and (b) a gradual reduction, which seems to be more realistic. However, a stepwise character of the consumption may not be related to consumption in processes only, but also to a certain degree of stockpiling. It needs to be emphasised that stockpiling is counted as consumption. Both methods yield a consumption pattern, which yields similar values in the control years 2005 and 2007, with major differences in the other years. For many years, for both scenarios, values for consumption are predicted to be higher than the ones for production. This can amount to a maximum deficit of 15% of the consumption in the stepwise scenario, and to a maximum deficit of 7% of the consumption in the gradual scenario.
§ The fact that for the period 2004-2009 deficits are calculated, i.e. consumption levels are higher than production levels, is striking, particularly since the future production in Article 5(1) countries has been agreed (except for one producing country) at certain concrete levels. In a first instance, one would be inclined to say that this would mean that there would be undersupply, i.e. there would be shortages on the market, which would lead to steep price increases and an accelerated phase-out of CFCs.
§ However, if one analyses the consumption and production for all countries (i.e., both Article 5(1) and non-Article 5(1)) for the years in the period 1989-2002, deficits can be concluded as of 1994, which may be as large 27,000 ODP tonnes (in the year1995), or about 10% of the global consumption. However, no shortage or CFC price increase has been observed in the market. It has been so that CFC prices have reached lowest levels in this period. This then raises questions regarding the quality of data reporting, whether there is systematic over-reporting of consumption or systematic underreporting of production. The Task force concludes that this issue needs further study.
§ The deficit (in tonnes, not in percentage) decreases in the period after 2000. Also in this period, 2000-2004, no shortages have been observed in the market, although the CFC price has increased slightly during 2003-2004, but this is believed to be due to

October 2004 BDN Task Force Report 44
normal market dynamics. However, it would not be right to conclude that, even with a predicted deficit, there will not be future shortages on the market, because much larger deficits in tonnes have not led to any shortage in the past. On the other hand, the results from the past cast doubts regarding the predicted shortages for the future.
§ The objective of this study is to look at the production for basic domestic needs under the Montreal Protocol, and whether this production would need to be increased or decreased. The estimates for the basic domestic needs production have been obtained from non-Article 5(1) manufacturers, where production follows the Montreal Protocol schedule, or is even decreased more rapidly. Based upon the predictions derived, one cannot draw any conclusion regarding the level of basic domestic needs production. However, it should be mentioned that manufacturers do not encounter shortages of CFC-11/-12 on the market and they are inclined to say that basic domestic needs production might even be decreased compared to the planned levels.
§ With the phase-down proceeding, the needs for CFC-11 will be reduced, and will be very small, once CFC-11 is only used for some older centrifugal chillers. In production plants the percentage of CFC-11 can be brought back to 35% of the total with normal process engineering. However, this would create enormous surplus of CFC-11, which needs to be destroyed, and a much smaller volume of CFC-12 than assumed in production agreements, based upon CFCs as a whole. However, if engineering solutions are feasible for all production plants, this percentage could be brought to 10% or lower, which would not create major market disruptions in the near future.
§ An accelerated phase-out plan for China is being discussed, which aims at a phase-out of production as of 2007. Against the background of the deficits calculated, as well as the surplus values for the gradual scenario for the years 2008 and 2009, it is difficult to judge whether an accelerated phase-out would have the impacts on the global consumption pattern as expected. Also this needs further analysis against the background of the deficits determined, as mentioned above. It is difficult for the Task Force to analyse what the local and regional impacts of the accelerated phase-out plan could be, on a global scale there seem to be no major differences.
§ Recovery and recycling may have impacts on the need for production. Under the Protocol imports and exports of recycled material have to be reported. However, the reports available do not contain much information and show an imbalance where it concerns imports versus exports, in summary, the reported values are of no use to further study the impacts on consumption and production. Also here further analysis and improvement of data reporting may be considered.
§ So far, no data from funded activities on recovery and recycling show that it will have a major impact on future demand. This may need further monitoring, in particular by the Multilateral Fund Secretariat. Recovery and recycling of CFCs is considered as an important option in many National Phase-out Plans, and in future, it might have a very significant impact on consumption, enabling the CFC phase-out by 2010.

October 2004 TEAP BDN Task Force Report 45
§ The data submitted by Parties on CTC show many inconsistencies, several Parties do only report in certain years. It is known that certain countries do export CTC in significant quantities, the uses, whether emissive or for feedstock, are not known. On the basis of the data for consumption and production available, and consistent with recommendations by experts, further analysis and improvement of data reporting seems to be needed. Parties may wish to further consider this.
§ Overall, the report has made clear which uncertainties and inconsistencies are attached to the data reporting under Article 7 of the Montreal Protocol. Further detailed analysis of several issues in the near future might make it possible to draw more definite conclusions regarding the production of CFCs for basic domestic needs.
§ In summary, regarding the question for basic domestic needs production, the report has given estimates for the CFC amounts planned to be produced for Article 5(1) countries. Based upon the analysis performed, the Task Force cannot make definite recommendations for the CFC BDN production volumes. At this stage, the Task Force has to conclude that there seems no reason to make changes to the non-Article 5(1) “basic domestic needs” amounts, which are forecast to be produced. Next to precise monitoring, this will need further analysis in the near future.


October 2004 TEAP BDN Task Force Report 47
8. References
/Ber04/ Bernhardt, S., Honeywell, USA, Personal Communications
/CFC03/ “Chlorofluorocarbons in Developing Countries: An Analysis of Supply and Demand”, Final Report, prepared for the European commission, May 2003 (internal report, limited distribution)
/ExC03/ “Final report on the evaluation of the implementation of RMPs” (UNEP/ OzL.Pro.ExCom /39/14)
/EIA04/ Clark, E., Environmental Investigation Agency, Personal Communications
/MLF04/ Multilateral Fund for Implementation of the Montreal Protocol, “Policies, procedures, guidelines and criteria” (as at April 2004), Montreal, 2004
/Ped04/ Pedersen, E., Draft Documents on NPP Plans to be submitted, Personal Communications, The World Bank, August 2004
/Pre04/ Preisegger, E., Solvay GmbH, Germany, Personal Communications
/She04/ Sherry, D., CTC Production and Consumption: A Study for the World Bank, Presentation at the 21st OORG meeting, 16 April 2004
/Shq04/ Zhang, S., Personal Communications regarding the Chinese consumption phase-out, August 2004
/UNE04/ UNEP Nairobi, Ozone Secretariat. Personal communications, i.e. submission of various files with country data (G. Mutisya, M. Mulumba)
/Vin04/ Vink, T., Honeywell, The Netherlands, Personal Communications
/Wba04/ The Accelerated Phase-out Plan of CFC Production and Consumption in China, Draft Document, The World Bank, August 2004


October 2004 TEAP BDN Task Force Report 49
Annex I – UNEP Reported Data (1986-2003)
ANNEX I UNEP REPORTED DATA (1986-2003)
Consumption of Annex A/I - CFCs (ODP tonnes) Article 5 Parties
Base 1986 1989 1990 1991 1992 1993 1994 1995 1996 1997 1998 1999 2000 2001 2002 2003 GROUP I China 57,818.7 29,237.2 34,783.0 41,829.0 50,263.2 57,044.6 66,282.6 70,778.6 75,290.8 47,089.0 51,076.4 55,414.2 42,983.4 39,123.6 33,922.6 30,621.2 - Brazil 10,525.8 10,973.5 9,109.7 8,538.8 8,503.6 8,933.6 9,817.8 10,778.2 10,895.7 10,872.0 9,809.7 9,542.9 11,612.0 9,275.1 6,230.9 3,000.6 - Korea, Republic of 9,159.8 8,528.6 24,125.6 - - 19,605.0 8,727.6 10,069.6 10,039.0 8,220.2 9,220.2 5,298.8 7,402.6 7,395.4 6,802.2 6,646.6 - Indonesia 8,332.7 350.2 1,457.1 - - 5,249.0 4,363.4 6,910.0 8,351.2 9,012.0 7,634.8 6,182.8 5,865.8 5,411.1 5,003.3 5,506.3 4,829.3 India 6,681.0 2,202.0 4,357.5 0.0 0.0 4,501.0 5,276.8 6,387.0 6,402.4 6,937.4 6,703.3 5,264.7 4,142.9 5,614.3 4,514.3 3,917.7 - Thailand 6,082.1 2,300.0 4,595.0 6,660.2 7,904.0 9,057.2 8,053.2 6,865.2 8,248.0 5,550.2 4,448.0 3,783.0 3,610.6 3,568.3 3,375.1 2,177.3 - Argentina 4,697.2 5,210.6 3,463.4 2,138.2 2,796.8 4,306.0 1,805.9 4,569.4 6,365.9 4,202.1 3,523.7 3,546.3 4,316.3 2,396.7 3,293.1 2,139.2 - Mexico 4,624.9 8,818.2 9,223.3 12,037.2 10,290.7 8,512.8 9,198.2 9,652.0 4,858.7 4,858.8 4,157.2 3,482.9 2,837.9 3,059.5 2,223.9 1,946.7 1,983.2 Iran, Islamic Republic of
4,571.7 1,275.9 2,235.0 1,365.8 4,750.0 4,750.0 4,495.0 4,327.6 4,140.0 3,692.0 5,883.0 5,571.0 4,399.0 4,156.5 4,204.8 4,437.8 -
Turkey 3,805.7 4,122.0 3,131.3 3,518.6 3,223.2 4,118.4 4,450.9 2,660.8 3,788.8 3,758.8 3,869.6 3,985.0 1,791.1 820.2 731.2 698.9 438.9 Nigeria 3,650.0 1,717.5 568.3 934.0 1,019.8 1,070.8 1,995.5 1,794.7 1,535.6 4,548.1 4,866.2 4,761.5 4,286.2 4,094.8 3,665.5 3,286.7 2,662.4 Venezuela 3,322.4 4,269.4 3,450.6 3,343.1 3,786.5 4,070.8 3,624.1 3,092.9 3,220.0 3,040.9 3,703.9 3,213.9 1,922.1 2,705.9 2,546.2 1,552.8 0.0 Malaysia 3,271.1 2,190.2 3,442.1 3,384.2 3,829.3 3,420.5 3,624.2 4,729.8 3,426.6 3,038.2 3,348.4 2,333.7 2,010.1 1,979.8 1,946.9 1,605.5 - Philippines 3,055.9 1,875.7 3,273.0 2,981.2 2,022.9 3,520.2 3,778.7 3,959.4 3,381.7 3,039.0 2,746.8 2,130.2 2,087.6 2,905.2 2,049.4 1,644.5 - Syrian Arab Republic
2,224.6 1,554.0 1,194.9 1,272.2 1,325.7 1,365.4 1,406.4 2,380.0 2,370.2 2,260.0 2,043.7 1,245.6 1,280.7 1,174.7 1,392.2 1,201.6 1,124.6
Colombia 2,208.2 1,193.8 1,519.6 2,025.8 1,686.0 - - 2,114.6 2,156.4 2,301.8 2,166.4 1,224.0 985.5 1,149.3 1,164.8 907.0 1,058.1 Algeria 2,119.5 6,626.8 3,570.2 U - - 2,146.4 2,226.0 2,292.2 2,292.2 1,774.2 1,549.2 1,502.2 1,474.6 1,021.8 1,761.8 - Saudi Arabia 1,798.5 5,259.9 3,687.8 - - 833.0 645.5 2,081.5 1,828.4 1,668.2 1,899.0 1,921.8 1,710.4 1,593.6 1,593.0 1,531.0 - Pakistan 1,679.4 678.1 927.4 751.0 674.0 945.0 1,781.0 1,823.0 2,103.7 1,670.8 1,263.8 1,196.0 1,421.8 1,945.3 1,666.3 1,647.0 1,124.0 Egypt 1,668.0 2,362.4 2,372.6 2,144.0 1,960.0 2,015.0 1,746.0 1,870.0 1,640.0 1,732.0 1,632.0 1,540.0 1,373.6 1,267.0 1,334.8 1,294.0 1,103.8 Subtotal 141,297.2 100,746.0 120,487.4 92,923.3 104,035.7 143,318.3 143,219.2 159,070.3 162,335.3 129,783.7 131,770.3 123,187.5 107,541.8 101,110.9 88,682.3 77,524.2 14,324.3 GROUP II Tunisia 870.1 584.0 725.0 730.0 1,055.0 567.6 581.2 508.1 758.0 882.0 970.2 790.6 566.0 555.0 570.0 465.8 362.5 Serbia and Montenegro
849.2 2,745.0 1,748.8 1,448.8 1,198.8 1,079.0 999.0 868.0 819.6 895.6 832.5 519.4 548.6 309.7 263.3 371.7 412.0
Chile 828.7 28.1 906.5 662.3 674.6 572.7 892.2 852.6 933.5 878.2 674.5 737.9 657.5 576.0 470.2 370.2 - Morocco 802.3 346.0 558.8 604.2 690.9 1,069.6 629.6 756.8 706.8 814.0 886.0 923.6 870.6 564.0 435.2 668.6 474.8 Lebanon 725.5 287.4 431.6 - - - 908.0 725.7 819.8 735.3 621.3 475.3 463.4 527.9 533.4 491.7 - Libyan Arab Jamahiriya
716.7 N.R. - 66.6 N.R. N.R. N.R. N.R. 772.8 729.8 647.5 659.8 894.0 985.4 985.4 N.R. -
Romania 675.8 829.7 - - - - 1,649.5 960.2 544.0 762.8 720.5 582.0 338.2 360.6 185.7 359.4 - Jordan 673.3 536.6 594.0 540.0 545.0 531.0 580.0 520.0 535.0 627.4 857.4 647.2 398.0 354.0 321.0 90.0 74.4 Congo, Democratic Republic of
665.7 9.2 8.2 - - - - - 793.0 735.0 469.0 688.5 368.1 386.6 639.4 569.4 566.9
Cuba 625.1 884.4 974.0 778.4 327.8 122.0 125.0 150.0 546.2 663.8 665.4 531.4 571.4 533.7 504.0 488.8 481.0 South Africa 592.6 12,449.0 10,656.0 6,804.5 4,795.3 3,951.4 4,127.4 2,416.6 1,679.6 0.0 98.3 155.1 117.3 80.5 16.0 86.6 60.8

October 2004 BDN Task Force Report 50
Bangladesh 581.6 176.7 204.9 195.1 92.9 213.1 226.6 180.6 280.7 628.3 832.2 830.4 800.6 805.0 807.9 328.0 333.0 Dominican Republic
539.8 228.7 256.1 - - 274.2 329.8 433.3 634.0 558.7 426.8 311.4 752.1 401.9 485.8 329.8 -
United Arab Emirates
529.3 379.4 414.0 447.6 521.9 498.0 477.9 425.0 513.8 511.2 562.8 737.4 529.2 476.2 423.4 370.4 -
The Former Yugoslav Republic of
519.7 1,620.0 1,174.0 - - - - 206.0 558.0 514.0 487.1 62.8 191.9 49.5 46.7 34.1 49.3
Viet Nam 500.0 24.0 303.4 - 303.4 - - 380.0 480.0 520.0 500.0 392.0 293.9 220.0 243.0 235.5 243.7 Kuwait 480.4 2,527.6 1,756.6 - - - 546.0 600.2 484.6 471.9 484.8 399.2 450.0 419.9 354.2 349.0 - Sudan 456.8 339.0 501.4 - 601.0 - 320.0 338.0 635.0 429.5 306.0 294.5 294.5 291.5 266.0 253.0 216.0 Zimbabwe 451.4 281.0 475.6 - - - 217.8 475.6 462.1 456.6 435.4 390.2 229.1 145.0 259.4 129.1 - Sri Lanka 445.6 215.0 - 209.5 184.8 216.5 294.0 346.6 520.5 497.8 318.5 250.4 216.4 220.3 190.4 185.0 179.9 Korea, Democratic People's Republic
441.7 950.0 950.0 - - - - - 825.0 267.0 233.0 112.0 106.0 77.0 320.8 299.0 -
Panama 384.2 129.9 225.5 252.1 376.7 168.0 358.8 254.2 439.7 354.8 357.9 346.0 301.1 249.9 180.4 195.3 - Subtotal 13,355.5 25,570.7 22,864.4 12,739.1 11,368.1 9,263.1 13,262.8 11,397.5 14,741.7 12,933.7 12,387.1 10,837.1 9,957.9 8,589.6 8,501.6 6,670.4 3,454.3 GROUP III Yemen 349.1 180.0 - - - - - - 306.4 328.6 412.2 453.3 1,040.7 1,045.0 1,023.4 959.9 - Honduras 331.6 87.7 0.0 - - - - 114.8 117.5 523.3 354.1 157.4 334.8 172.3 121.6 131.2 219.1 El Salvador 306.6 331.8 384.0 - 423.4 644.7 398.2 255.7 329.7 312.1 277.8 194.6 109.5 99.1 116.9 101.6 97.5 Ecuador 301.4 703.6 458.3 603.6 690.9 403.5 261.5 78.4 314.7 269.2 320.4 271.7 153.0 230.5 207.0 229.6 - Côte d'Ivoire 294.2 141.6 187.7 - 257.5 - 204.1 342.0 354.3 383.9 144.4 267.8 166.2 206.4 148.0 106.5 93.4 Peru 289.5 1,058.3 539.9 800.7 541.3 242.9 279.2 248.6 366.8 243.0 258.8 326.7 295.6 347.0 189.0 196.5 - Cameroon 256.9 118.5 79.1 77.7 66.5 63.7 156.6 156.6 230.7 280.4 259.5 311.8 361.5 368.7 364.1 226.0 220.5 Tanzania, United Republic of
253.9 40.2 88.2 - - - 185.3 262.9 280.4 293.6 187.7 131.5 88.9 215.5 131.2 71.5 148.2
Costa Rica 250.2 242.5 342.0 - 267.0 216.0 221.5 184.0 158.5 497.2 94.8 -204.2 152.3 105.9 144.6 137.4 - Oman 248.4 305.3 305.3 - - 305.3 244.0 308.6 229.9 264.9 250.5 261.1 259.6 282.1 207.3 179.5 134.5 Somalia 241.4 266.3 215.1 205.8 46.7 20.7 24.7 28.3 241.1 241.3 241.7 246.9 48.6 65.6 86.9 98.5 108.2 Kenya 239.5 230.0 230.0 230.0 105.0 47.0 47.0 273.0 301.0 166.8 250.6 245.3 241.1 203.3 168.6 152.3 - Guatemala 224.6 482.2 420.6 357.3 357.3 357.3 357.3 269.3 231.0 235.6 207.3 188.7 191.1 187.9 265.0 239.6 147.1 Croatia 219.3 515.0 515.0 464.0 337.0 433.8 252.8 314.0 193.5 184.1 280.4 85.7 141.5 171.2 113.8 140.1 88.7 Paraguay 210.6 151.2 170.9 - - 240.0 190.5 221.0 211.2 180.4 240.1 113.4 345.3 153.5 116.0 96.9 91.8 Singapore 210.5 4,052.0 679.4 3,166.6 639.2 1,371.8 1,481.6 791.6 773.6 36.8 -178.9 16.7 24.1 21.7 21.6 0.9 145.8 Uruguay 199.1 322.8 531.4 - 416.2 304.6 223.0 311.8 232.0 172.1 193.1 194.0 111.4 106.8 102.3 75.2 111.4 Armenia 196.5 2,384.5 0.0 - 0.0 - - - 201.8 196.5 191.2 185.9 9.0 25.0 162.7 172.7 172.7 Haiti 169.0 0.0 0.0 - - - - - 169.0 169.0 169.0 - - 169.0 169.0 181.2 115.9 Senegal 155.8 86.2 93.6 96.8 99.8 102.3 156.4 117.7 151.0 178.4 138.1 128.5 121.1 116.5 98.0 71.9 51.0 Cyprus 149.5 909.0 308.5 240.1 249.0 264.7 429.3 196.4 164.6 141.0 143.0 81.0 114.9 165.0 137.6 131.8 62.5 Bahrain 135.4 76.4 91.5 107.0 85.3 118.6 111.1 118.1 121.9 137.2 147.2 149.5 129.0 113.1 106.0 94.6 - Trinidad and Tobago
120.0 101.6 143.3 137.9 115.6 104.0 96.8 108.6 111.3 114.1 134.6 155.6 81.7 101.3 79.2 63.6 62.5
Angola 114.8 115.9 115.9 - - - - - 114.8 114.8 114.8 115.9 - N.R. 114.8 105.0 - Mali 108.1 26.2 - 0.0 0.0 0.0 0.0 0.0 103.9 109.3 111.1 113.1 37.1 29.2 27.0 26.0 26.0 Qatar 101.4 85.2 85.2 - - - - - 90.9 102.4 111.0 120.8 89.0 85.8 85.4 86.7 95.1 Subtotal 5,677.3 13,014.0 5,984.9 6,487.5 4,697.7 5,240.9 5,320.9 4,701.4 6,101.5 5,876.0 5,054.5 4,312.7 4,647.0 4,787.4 4,507.0 4,076.7 2,191.9 GROUP IV Cambodia 94.2 94.2 - - - - - - 94.2 94.2 94.2 94.2 94.2 94.2 94.2 94.2 86.7

October 2004 TEAP BDN Task Force Report 51
Jamaica 93.2 196.1 399.9 423.9 350.1 464.0 66.2 49.2 82.0 91.1 106.6 199.0 210.4 59.8 48.6 31.7 16.2 Nicaragua 82.8 86.5 86.5 86.5 90.0 94.5 100.0 105.5 110.0 82.7 55.7 37.3 52.6 44.4 35.2 54.9 - Sierra Leone 78.6 81.7 79.4 79.1 78.4 75.1 69.9 68.5 67.1 86.7 81.9 81.0 75.9 75.9 92.9 80.8 66.3 Brunei Darussalam
78.2 68.8 64.0 - - 58.6 81.2 63.3 64.6 80.1 90.0 63.5 36.7 46.6 31.4 43.4 -
Bolivia 75.7 34.8 22.6 - 14.4 - - 76.0 81.6 87.1 58.4 74.1 72.2 78.8 76.7 65.5 - Moldova 73.3 279.5 0.0 - - - - - 85.4 51.5 83.1 40.5 11.1 31.7 23.5 29.6 18.9 Kyrgyzstan 72.8 122.1 - - 117.6 106.2 92.5 84.7 81.5 67.4 69.6 56.8 52.4 53.5 53.0 38.0 33.0 Bahamas 64.9 51.1 56.9 - - 0.7 65.8 68.1 69.9 72.0 52.7 54.6 53.8 65.9 63.0 55.0 24.6 Malta 64.3 286.7 366.3 179.4 85.2 64.8 61.9 61.2 62.8 70.2 60.1 106.6 97.2 67.6 63.1 10.3 - Benin 59.9 14.7 79.3 57.7 37.3 44.3 37.0 37.0 61.8 58.4 59.6 54.2 56.6 54.6 54.0 35.5 17.3 Burundi 59.0 32.4 40.3 43.0 45.6 48.2 - - 56.2 58.8 61.9 64.5 59.6 53.8 46.5 19.1 9.2 Malawi 57.7 14.3 - - 23.1 45.6 88.0 30.0 61.5 55.9 55.6 56.9 50.4 21.5 19.0 19.0 18.7 Liberia 56.1 54.3 50.1 26.1 64.1 65.2 42.1 33.1 45.2 67.4 55.7 31.1 18.2 41.4 25.1 32.8 - Myanmar 54.3 1.4 - - - 16.4 - 2.1 49.5 58.6 54.8 52.3 30.7 26.3 39.4 43.5 - Guyana 53.2 18.3 30.4 18.9 17.3 22.6 59.5 42.3 90.8 41.0 27.8 29.2 39.9 24.4 19.8 14.3 10.4 Madagascar 47.9 49.0 49.0 - - - - - 19.5 20.5 103.6 23.9 26.3 12.4 9.9 7.8 7.2 Lao People's Democratic Republic
43.3 2.3 - - - 3.6 - - 43.3 43.3 43.3 43.3 44.1 44.6 41.2 42.3 35.3
Guinea 42.4 24.5 27.2 28.0 28.8 29.8 30.3 32.4 37.4 44.0 45.9 41.8 39.9 37.5 35.4 31.3 25.9 Suriname 41.3 39.5 39.5 - 39.8 - - - 41.0 41.0 42.0 42.0 43.0 44.0 46.0 46.0 12.3 Albania 40.8 40.3 - - - - - - 40.3 40.1 41.9 46.5 53.1 61.9 68.8 49.9 35.0 Togo 39.8 35.3 39.4 41.0 42.8 44.5 46.4 48.3 50.4 33.7 35.2 36.7 41.7 37.5 34.7 35.3 33.7 Burkina Faso 36.3 22.8 26.5 27.8 29.2 29.2 30.6 33.6 33.6 37.6 37.6 37.0 30.6 25.4 19.6 16.3 13.2 Papua New Guinea
36.3 48.5 - - 28.3 38.7 39.4 52.8 9.7 62.7 36.4 45.2 35.5 47.9 15.0 34.6 22.7
Ghana 35.8 89.6 97.6 106.6 96.6 72.0 24.2 39.3 44.0 14.2 48.7 50.3 46.8 47.0 35.6 21.2 32.0 Chad 34.6 15.5 24.1 26.1 28.5 29.9 31.2 31.6 32.8 34.6 36.3 38.1 37.5 36.5 31.6 27.1 22.8 Ethiopia 33.8 36.5 33.0 - - - - - 32.5 33.8 35.1 38.2 39.2 39.2 34.6 30.0 28.0 Fiji 33.4 16.8 40.1 37.8 42.1 8.5 7.4 0.1 59.8 26.7 13.7 13.1 9.4 0.0 0.0 0.0 - Niger 32.0 15.0 15.3 16.0 16.6 17.8 17.5 17.5 18.6 18.1 59.4 60.7 58.3 39.9 29.1 26.6 24.5 Rwanda 30.4 34.7 32.2 30.2 29.2 28.5 27.5 19.8 26.5 30.2 34.4 37.7 30.1 30.1 30.1 30.1 30.1 Mauritius 29.1 57.2 75.8 - - 66.6 64.1 42.3 23.9 36.2 27.3 39.0 18.6 19.1 14.5 7.3 4.0 Zambia 27.4 34.6 22.3 34.6 22.1 24.1 25.4 37.8 23.0 30.4 28.7 26.7 24.3 23.3 11.8 10.6 - Nepal 27.0 25.0 25.0 - 20.0 20.0 20.0 20.0 25.0 27.0 29.0 32.9 25.0 94.0 0.0 0.0 - Guinea Bissau 26.3 20.0 22.0 22.2 23.0 23.4 23.9 24.4 25.7 26.3 26.8 27.1 26.0 26.0 26.9 27.4 29.4 Swaziland 24.6 10.0 10.0 - - - 82.7 82.7 35.4 22.1 16.3 2.2 2.1 0.1 1.3 1.2 - Belize 24.4 15.0 20.0 - - - - - 22.3 24.7 26.1 25.0 25.1 15.5 28.0 21.7 15.1 Bosnia and Herzegovina
24.2 329.0 218.9 0.0 145.1 19.5 15.0 7.5 3.0 20.6 49.0 45.1 151.0 175.9 199.7 243.6 -
Gambia 23.8 6.5 6.7 15.0 11.4 12.2 21.0 22.8 22.7 20.6 28.0 10.9 6.9 6.1 5.8 4.7 - Georgia 22.5 532.8 766.0 - - - - 53.2 13.1 23.5 30.9 26.0 21.5 21.5 18.8 15.5 12.6 Namibia 21.9 17.6 20.5 - - - 33.8 34.6 27.1 19.3 19.3 16.4 16.8 22.1 24.0 20.0 17.2 Barbados 21.5 15.8 27.4 20.9 25.4 20.6 29.5 35.3 25.0 22.4 17.2 22.5 16.5 8.1 12.5 9.5 8.6 Djibouti 21.0 21.9 22.3 - 22.1 - - - 22.7 21.5 18.9 20.6 20.6 20.7 18.0 15.8 12.1 Mozambique 18.2 55.5 18.1 - - - - 18.1 20.3 21.7 12.7 3.2 13.8 9.9 8.4 9.9 - Mauritania 15.7 14.8 17.3 - - - - 17.3 23.2 7.8 16.0 14.7 13.4 14.2 15.0 14.7 14.3 Uganda 12.8 7.1 13.8 14.3 14.6 15.3 16.1 9.2 11.8 12.8 13.9 11.4 12.2 12.7 13.4 12.7 4.1 Congo 11.9 16.9 7.5 - 53.4 - - 27.1 13.6 12.8 9.2 6.6 9.3 11.4 2.5 5.5 7.0 Central African 11.3 24.0 25.8 - 42.8 44.5 31.2 31.2 27.3 6.4 0.0 7.0 1.4 4.3 4.0 4.4 4.1

October 2004 BDN Task Force Report 52
Republic Antigua and Barbuda
10.7 430.4 428.0 421.3 427.8 429.0 426.1 12.4 11.5 10.3 10.3 26.5 -2.0 5.0 3.1 3.7 1.5
Mongolia 10.6 7.2 7.2 - - - - - 7.2 12.2 12.5 13.2 12.4 11.2 9.3 6.9 5.7 Gabon 10.3 12.4 12.5 - 9.9 - 12.6 12.0 7.3 11.5 12.0 12.0 7.8 13.7 6.4 5.0 5.0 Saint Lucia 8.3 6.0 7.8 - - - 10.6 7.7 8.1 8.3 8.5 6.3 3.2 4.2 4.1 7.6 2.5 Botswana 6.8 2.6 6.0 - - 12.0 14.6 8.4 8.4 5.4 6.8 2.6 2.6 2.5 4.0 3.6 - Grenada 6.0 3.8 3.8 - - - 3.8 3.8 6.5 4.9 6.5 3.8 N.R. 2.9 1.3 2.1 2.1 Lesotho 5.1 4.8 6.0 - - - - 5.1 6.0 5.9 3.5 3.4 2.8 2.4 1.8 1.6 - Maldives 4.6 0.1 2.2 3.5 5.9 5.8 6.3 7.2 5.9 0.0 7.8 0.9 1.5 4.6 14.0 2.8 0.0 Samoa 4.5 4.4 4.4 - 4.0 4.0 4.0 4.0 4.4 4.5 4.5 2.6 6.1 0.6 2.0 2.2 0.0 Saint Kitts and Nevis
3.7 6.1 6.1 - - 6.4 5.4 4.7 4.1 3.4 3.6 1.6 2.6 7.0 6.6 5.3 2.8
Seychelles 2.8 2.5 1.2 2.7 3.6 4.7 10.3 3.7 3.9 2.2 2.5 2.0 1.1 0.8 0.7 1.5 0.6 Comoros 2.5 2.9 0.7 - 1.3 - - - 2.3 2.3 2.9 3.6 2.5 2.7 1.9 1.8 1.2 Solomon Islands 2.0 0.0 0.0 1.6 1.9 3.4 5.1 0.2 2.1 2.0 2.3 0.8 6.2 0.3 0.6 0.5 - Saint Vincent and the Grenadines
1.8 2.5 2.5 - - - - - 2.3 0.8 2.2 2.3 10.0 6.0 6.9 6.0 3.1
Palau 1.6 0.0 0.0 - - - - - 1.7 1.1 2.1 2.1 0.4 0.6 0.6 0.1 1.8 Dominica 1.5 0.0 - - - - 1.5 1.5 1.0 1.7 1.7 2.1 1.1 2.1 1.6 3.0 1.4 Tonga 1.3 1.8 1.8 - - - - - 1.8 0.9 1.2 0.0 83.4 0.5 0.7 0.8 0.3 Federated States of Micronesia
1.2 1.3 0.0 - 0.0 - - - 1.3 1.1 1.2 1.2 1.2 1.0 N.R. N.R. -
Marshall Islands 1.2 1.2 1.2 1.2 1.2 1.2 1.2 1.2 1.2 1.1 1.1 0.6 1.1 0.5 0.2 0.2 0.2 Kiribati 0.7 0.8 - - - - 0.8 0.8 0.8 0.7 0.6 0.5 0.0 0.0 0.0 0.0 - Nauru 0.5 0.6 - - - - - - 0.6 0.5 0.5 0.5 0.4 0.4 0.4 0.0 - Tuvalu 0.3 0.3 0.3 - - - 0.3 0.3 0.3 0.4 0.3 0.3 0.2 0.0 0.0 0.0 - Vanuatu 0.0 0.0 0.0 - - - - - 0.0 0.0 0.0 0.0 0.0 0.0 0.0 0.0 0.0 Afghanistan - - - - - - - - - - - - - - - - Cape Verde N.R. N.R. - - - - - - - - - - - - N.R. N.R. - Cook Islands N.R. N.R. - - - - - - - - - - - - - - - Niue N.R. N.R. - - - - - - - - - - - - - - - Sao Tome and Principe
N.R. N.R. - - - - - - - - - - - - - N.R. -
Subtotal 2,097.9 3,602.6 3,510.7 1,765.4 2,140.5 2,121.4 1,883.9 1,532.9 2,107.3 2,040.9 2,145.1 2,076.5 2,096.5 1,898.2 1,687.8 1,545.3 780.7 Total 162,428 142,933 152,847 113,915 122,242 159,944 163,687 176,702 185,286 150,634 151,357 140,414 124,243 116,386 103,379 89,817 20,751

October 2004 TEAP BDN Task Force Report 53
Annex II - Montreal Protocol stepwise reductions plus NPPS
Numbers:
Not underlined: data submitted to UNEP
Underlined normal: determined by the Task Force
Underlined italic: figures as part of NPP
Shaded row: NPP data available, but NPP not yet approved
ANNEX II MONTREAL PROTOCOL STEPWISE REDUCTIONS + NPPs STEPWISE
Consumption of Annex A/I - CFCs (ODP tonnes)
Article 5 Parties
Base 1998 1999 2000 2001 2002 2003 2004 2005 2006 2007 2008 2009 2010
GROUP I
China 57,818.7 55,414.2 42,983.4 39,123.6 33,922.6 30,621.2 22,812.0 21262.0 17593.0 12498.0 8176.0 6828.0 2546.0 0
Brazil 10,525.8 9,542.9 11,612.0 9,275.1 6,230.9 3,000.6 6,967.0 5,020.0 3,070.0 2,050.0 1000.0 424.0 74.0 0
Korea, Republic of 9,159.8 5,298.8 7,402.6 7,395.4 6,802.2 6,646.6 5,957.7 5957.7 4579.9 4579.9 1374.0 1374.0 1374.0 0
Indonesia 8,332.7 6,182.8 5,865.8 5,411.1 5,003.3 5,506.3 4,829.3 3266.0 2036.0 1136.0 450.0 150.0 50.0 0
India 6,681.0 5,264.7 4,142.9 5,614.3 4,514.3 3,917.7 3,917.7 3489.0 2266.0 1560.0 964.0 417.0 273.0 0
Thailand 6,082.1 3,783.0 3,610.6 3,568.3 3,375.1 2,177.3 2,777.0 2,291.0 1,364.0 1121.0 912.0 704.0 496.0 0
Argentina 4,697.2 3,546.3 4,316.3 2,396.7 3,293.1 2,139.2 2,139.2 3,220.0 2,047.0 1997.0 686.0 636.0 586.0 0
Mexico 4,624.9 3,482.9 2,837.9 3,059.5 2,223.9 1,946.7 1,983.2 4403.0 2205.0 150.0 50.0 50.0 50.0 0
Iran, Islamic Republic of
4,571.7 5,571.0 4,399.0 4,156.5 4,204.8 4,437.8 3,889.4 3889.4 2269.2 965.6 578.7 328.4 132.7 0
Turkey 3,805.7 3,985.0 1,791.1 820.2 731.2 698.9 438.9 316.0 150.0 0.0 0.0 0.0 0.0 0
Nigeria 3,650.0 4,761.5 4,286.2 4,094.8 3,665.5 3,286.7 2,662.4 3137.0 1725.4 1015.9 507.6 286.1 86.1 0
Venezuela 3,322.4 3,213.9 1,922.1 2,705.9 2,546.2 1,552.8 1,552.8 3,262.0 1,661.0 1661.0 400.0 0.0 0.0 0
Malaysia 3,271.1 2,333.7 2,010.1 1,979.8 1,946.9 1,605.5 1,566.0 1,136.0 699.0 579.0 490.0 401.0 332.0 0
Philippines 3,055.9 2,130.2 2,087.6 2,905.2 2,049.4 1,644.5 1,960.0 1810.0 1509.0 1360.0 453.0 400.0 300.0 0
Syrian Arab Republic 2,224.6 1,245.6 1,280.7 1,174.7 1,392.2 1,201.6 1,124.6 1124.6 1112.3 1112.3 333.7 333.7 333.7 0
Colombia 2,208.2 1,224.0 985.5 1,149.3 1,164.8 907.0 1,083.4 1,057.5 1,020.5 750.0 330.8 247.8 152.5 0
Algeria 2,119.5 1,549.2 1,502.2 1,474.6 1,021.8 1,761.8 1,761.8 1,761.8 1059.8 1059.8 317.9 317.9 317.9 0
Saudi Arabia 1,798.5 1,921.8 1,710.4 1,593.6 1,593.0 1,531.0 1,531.0 1531.0 899.3 899.3 269.8 269.8 269.8 0
Pakistan 1,679.4 1,196.0 1,421.8 1,945.3 1,666.3 1,647.0 1,124.0 971.8 819.5 573.7 245.9 163.9 82.0 0
Egypt 1,668.0 1,540.0 1,373.6 1,267.0 1,334.8 1,294.0 1,103.8 1103.8 834.0 834.0 250.2 250.2 250.2 0
Subtotal 141,297.2 123,187.5 107,541.8 101,110.9 88,682.3 77,524.2 71,181.2 70,009.5 48,919.8 35,902.5 17,789.6 13,581.8 7,705.9 0

October 2004 BDN Task Force Report 54
GROUP II
Tunisia 870.1 790.6 566.0 555.0 570.0 465.8 362.5 435.1 435.1 435.1 130.5 130.5 130.5 0
Serbia and Montenegro
849.2 519.4 548.6 309.7 263.3 371.7 412.0 424.6 424.6 424.6 127.4 127.4 127.4 0
Chile 828.7 737.9 657.5 576.0 470.2 370.2 414.4 414.4 414.4 414.4 124.3 124.3 124.3 0
Morocco 802.3 923.6 870.6 564.0 435.2 668.6 474.8 474.8 401.2 401.2 120.3 120.3 120.3 0
Lebanon 725.5 475.3 463.4 527.9 533.4 491.7 491.7 491.7 362.0 235.0 75.0 35.0 0.0 0
Libyan Arab Jamahiriya
716.7 659.8 894.0 985.4 985.4 985.4 700.0 461.0 300.0 176.0 52.0 11.6 0.0 0
Romania 675.8 582.0 338.2 360.6 185.7 359.4 359.4 359.4 337.9 337.9 101.4 101.4 101.4 0
Jordan 673.3 647.2 398.0 354.0 321.0 90.0 74.4 336.7 336.7 336.7 101.0 101.0 101.0 0
Congo, Democratic Republic of
665.7 688.5 368.1 386.6 639.4 569.4 566.9 566.9 332.9 332.9 99.9 99.9 99.9 0
Cuba 625.1 531.4 571.4 533.7 504.0 488.8 481.0 481.0 312.6 312.6 93.8 93.8 93.8 0
South Africa 592.6 155.1 117.3 80.5 16.0 86.6 60.8 296.3 296.3 296.3 88.9 88.9 88.9 0
Bangladesh 581.6 830.4 800.6 805.0 807.9 328.0 333.0 328.7 289.7 207.2 87.1 71.0 53.0 0
Dominican Republic 539.8 311.4 752.1 401.9 485.8 329.8 268.2 359.2 266.5 252.0 81.0 81.0 53.3 0
United Arab Emirates 529.3 737.4 529.2 476.2 423.4 370.4 370.4 370.4 264.7 264.7 79.4 79.4 79.4 0
The Former Yugoslav Republic of
519.7 62.8 191.9 49.5 46.7 34.1 49.3 259.9 259.9 259.9 78.0 78.0 78.0 0
Viet Nam 500.0 392.0 293.9 220.0 243.0 235.5 243.7 210.9 186.9 136.0 69.1 37.2 7.4 0
Kuwait 480.4 399.2 450.0 419.9 354.2 349.0 349.0 349.0 240.2 240.2 72.1 72.1 72.1 0
Sudan 456.8 294.5 294.5 291.5 266.0 253.0 216.0 228.4 228.4 228.4 68.5 68.5 68.5 0
Zimbabwe 451.4 390.2 229.1 145.0 259.4 129.1 225.7 225.7 225.7 225.7 67.7 67.7 67.7 0
Sri Lanka 445.6 250.4 216.4 220.3 190.4 185.0 179.9 222.8 222.8 222.8 66.8 66.8 66.8 0
Korea, Democratic People's Republic
441.7 112.0 106.0 77.0 320.8 299.0 299.0 299.0 220.9 220.9 66.3 66.3 66.3 0
Panama 384.2 346.0 301.1 249.9 180.4 195.3 164.0 180.9 101.5 50.8 33.8 16.9 0.0 0
Subtotal 13,355.5 10,837.1 9,957.9 8,589.6 8,501.6 7,655.8 7,096.1 7,776.8 6,460.5 6,011.3 1,884.2 1,739.0 1,600.0 0.0
GROUP III
Yemen 349.1 453.3 1,040.7 1,045.0 1,023.4 959.9 959.9 959.9 174.6 174.6 52.4 52.4 52.4 0
Honduras 331.6 157.4 334.8 172.3 121.6 131.2 219.1 219.1 165.8 165.8 49.7 49.7 49.7 0
El Salvador 306.6 194.6 109.5 99.1 116.9 101.6 97.5 153.3 153.3 153.3 46.0 46.0 46.0 0
Ecuador 301.4 271.7 153.0 230.5 207.0 229.6 246.0 235.0 150.0 80.0 42.0 21.0 21.0 0
Côte d'Ivoire 294.2 267.8 166.2 206.4 148.0 106.5 93.4 147.1 147.1 147.1 44.1 44.1 44.1 0
Peru 289.5 326.7 295.6 347.0 189.0 196.5 196.5 196.5 144.8 144.8 43.4 43.4 43.4 0
Cameroon 256.9 311.8 361.5 368.7 364.1 226.0 220.5 220.5 128.5 128.5 38.5 38.5 38.5 0
Tanzania, United Republic of
253.9 131.5 88.9 215.5 131.2 71.5 148.2 148.2 127.0 127.0 38.1 38.1 38.1 0
Costa Rica 250.2 -204.2 152.3 105.9 144.6 137.4 137.4 137.4 125.1 125.1 37.5 37.5 37.5 0
Oman 248.4 261.1 259.6 282.1 207.3 179.5 134.5 134.5 124.2 124.2 37.3 37.3 37.3 0
Somalia 241.4 246.9 48.6 65.6 86.9 98.5 108.2 120.7 120.7 120.7 36.2 36.2 36.2 0

October 2004 TEAP BDN Task Force Report 55
Kenya 239.5 245.3 241.1 203.3 168.6 152.3 152.3 152.3 119.8 119.8 35.9 35.9 35.9 0
Guatemala 224.6 188.7 191.1 187.9 265.0 239.6 147.1 147.1 112.3 112.3 33.7 33.7 33.7 0
Croatia 219.3 85.7 141.5 171.2 113.8 140.1 88.7 98.0 65.0 0.0 0.0 0.0 0.0 0
Paraguay 210.6 113.4 345.3 153.5 116.0 96.9 91.8 105.3 105.3 105.3 31.6 31.6 31.6 0
Singapore 210.5 16.7 24.1 21.7 21.6 0.9 145.8 145.8 105.3 105.3 31.6 31.6 31.6 0
Uruguay 199.1 194.0 111.4 106.8 102.3 75.2 111.4 111.4 99.6 99.6 29.9 29.9 29.9 0
Armenia 196.5 185.9 9.0 25.0 162.7 172.7 172.7 172.7 98.3 98.3 29.5 29.5 29.5 0
Haiti 169.0 - - 169.0 169.0 181.2 115.9 115.9 84.5 84.5 25.4 25.4 25.4 0
Senegal 155.8 128.5 121.1 116.5 98.0 71.9 51.0 77.9 77.9 77.9 23.4 23.4 23.4 0
Cyprus 149.5 81.0 114.9 165.0 137.6 131.8 62.5 74.8 74.8 74.8 22.4 22.4 22.4 0
Bahrain 135.4 149.5 129.0 113.1 106.0 94.6 94.6 94.6 67.7 67.7 20.3 20.3 20.3 0
Trinidad and Tobago 120.0 155.6 81.7 101.3 79.2 63.6 62.5 77.0 34.1 34.1 17.0 0.0 0.0 0
Angola 114.8 115.9 - N.R. 114.8 105.0 105.0 105.0 57.4 57.4 17.2 17.2 17.2 0
Mali 108.1 113.1 37.1 29.2 27.0 26.0 26.0 54.1 54.1 54.1 16.2 16.2 16.2 0
Qatar 101.4 120.8 89.0 85.8 85.4 86.7 95.1 95.1 50.7 50.7 15.2 15.2 15.2 0
Subtotal 5,677.3 4,312.7 4,647.0 4,787.4 4,507.0 4,076.7 4,083.6 4299.2 2767.4 2632.9 814.5 776.5 776.5 0
GROUP IV
Cambodia 94.2 94.2 94.2 94.2 94.2 94.2 86.7 86.7 47.1 47.1 14.1 14.1 14.1 0
Jamaica 93.2 199.0 210.4 59.8 48.6 31.7 16.2 40.0 12.2 0.0 0.0 0.0 0.0 0
Nicaragua 82.8 37.3 52.6 44.4 35.2 54.9 54.9 54.9 41.4 41.4 12.4 12.4 12.4 0
Sierra Leone 78.6 81.0 75.9 75.9 92.9 80.8 66.3 66.3 39.3 39.3 11.8 11.8 11.8 0
Brunei Darussalam 78.2 63.5 36.7 46.6 31.4 43.4 43.4 43.4 39.1 39.1 11.7 11.7 11.7 0
Bolivia 75.7 74.1 72.2 78.8 76.7 65.5 65.5 65.6 37.9 37.9 11.4 11.4 11.4 0
Moldova 73.3 40.5 11.1 31.7 23.5 29.6 18.9 36.7 36.7 36.7 11.0 11.0 11.0 0
Kyrgyzstan 72.8 56.8 52.4 53.5 53.0 38.0 33.0 36.4 36.4 36.4 10.9 10.9 10.9 0
Bahamas 64.9 54.6 53.8 65.9 63.0 55.0 24.6 36.0 25.0 14.0 0.0 0.0 0.0 0
Malta 64.3 106.6 97.2 67.6 63.1 10.3 32.2 32.2 32.2 32.2 9.6 9.6 9.6 0
Benin 59.9 54.2 56.6 54.6 54.0 35.5 17.3 30.0 30.0 30.0 9.0 9.0 9.0 0
Burundi 59.0 64.5 59.6 53.8 46.5 19.1 9.2 29.5 29.5 29.5 8.9 8.9 8.9 0
Malawi 57.7 56.9 50.4 21.5 19.0 19.0 18.7 28.9 28.9 28.9 8.7 8.7 8.7 0
Liberia 56.1 31.1 18.2 41.4 25.1 32.8 32.8 32.8 28.1 28.1 8.4 8.4 8.4 0
Myanmar 54.3 52.3 30.7 26.3 39.4 43.5 43.5 43.5 27.2 27.2 8.1 8.1 8.1 0
Guyana 53.2 29.2 39.9 24.4 19.8 14.3 10.4 26.6 26.6 26.6 8.0 8.0 8.0 0
Madagascar 47.9 23.9 26.3 12.4 9.9 7.8 7.2 24.0 24.0 24.0 7.2 7.2 7.2 0
Lao People's Democratic Republic
43.3 43.3 44.1 44.6 41.2 42.3 35.3 35.3 21.7 21.7 6.5 6.5 6.5 0
Guinea 42.4 41.8 39.9 37.5 35.4 31.3 25.9 25.9 21.2 21.2 6.4 6.4 6.4 0
Suriname 41.3 42.0 43.0 44.0 46.0 46.0 12.3 20.7 20.7 20.7 6.2 6.2 6.2 0
Albania 40.8 46.5 53.1 61.9 68.8 49.9 35.0 61.2 36.2 15.2 6.2 2.2 0.0 0
Togo 39.8 36.7 41.7 37.5 34.7 35.3 33.7 33.7 19.9 19.9 6.0 6.0 6.0 0
Burkina Faso 36.3 37.0 30.6 25.4 19.6 16.3 13.2 18.2 18.2 18.2 5.4 5.4 5.4 0
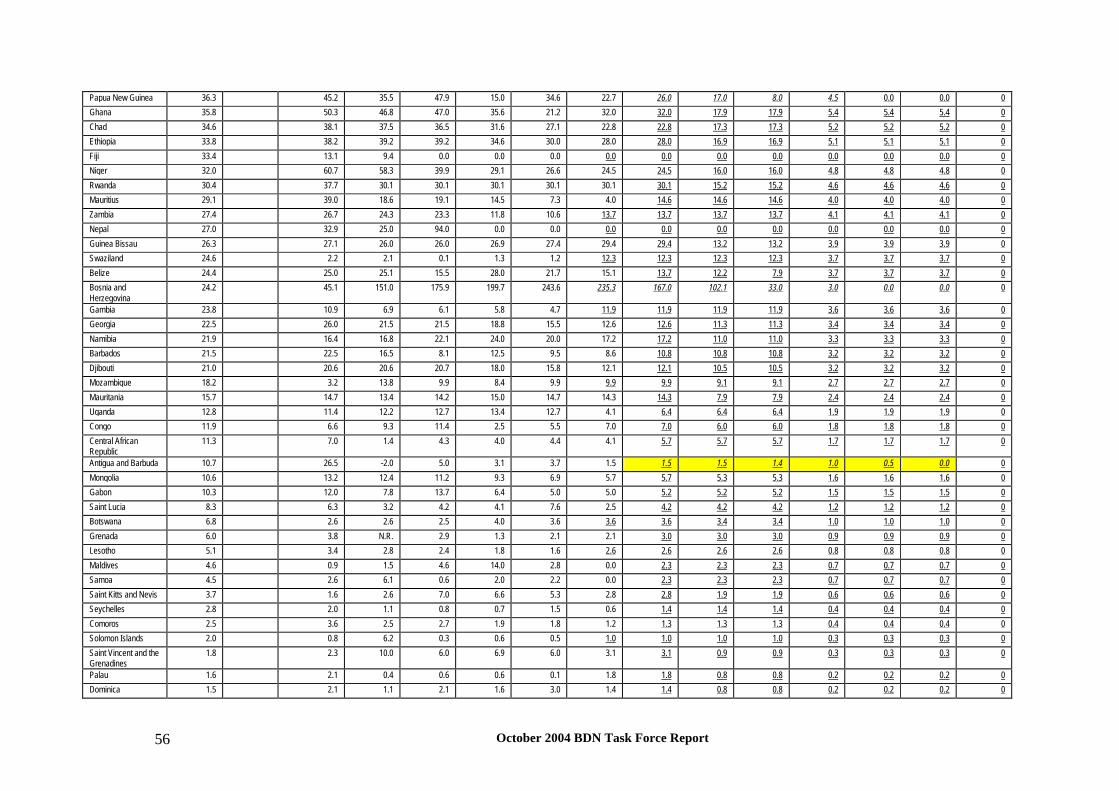
October 2004 BDN Task Force Report 56
Papua New Guinea 36.3 45.2 35.5 47.9 15.0 34.6 22.7 26.0 17.0 8.0 4.5 0.0 0.0 0
Ghana 35.8 50.3 46.8 47.0 35.6 21.2 32.0 32.0 17.9 17.9 5.4 5.4 5.4 0
Chad 34.6 38.1 37.5 36.5 31.6 27.1 22.8 22.8 17.3 17.3 5.2 5.2 5.2 0
Ethiopia 33.8 38.2 39.2 39.2 34.6 30.0 28.0 28.0 16.9 16.9 5.1 5.1 5.1 0
Fiji 33.4 13.1 9.4 0.0 0.0 0.0 0.0 0.0 0.0 0.0 0.0 0.0 0.0 0
Niger 32.0 60.7 58.3 39.9 29.1 26.6 24.5 24.5 16.0 16.0 4.8 4.8 4.8 0
Rwanda 30.4 37.7 30.1 30.1 30.1 30.1 30.1 30.1 15.2 15.2 4.6 4.6 4.6 0
Mauritius 29.1 39.0 18.6 19.1 14.5 7.3 4.0 14.6 14.6 14.6 4.0 4.0 4.0 0
Zambia 27.4 26.7 24.3 23.3 11.8 10.6 13.7 13.7 13.7 13.7 4.1 4.1 4.1 0
Nepal 27.0 32.9 25.0 94.0 0.0 0.0 0.0 0.0 0.0 0.0 0.0 0.0 0.0 0
Guinea Bissau 26.3 27.1 26.0 26.0 26.9 27.4 29.4 29.4 13.2 13.2 3.9 3.9 3.9 0
Swaziland 24.6 2.2 2.1 0.1 1.3 1.2 12.3 12.3 12.3 12.3 3.7 3.7 3.7 0
Belize 24.4 25.0 25.1 15.5 28.0 21.7 15.1 13.7 12.2 7.9 3.7 3.7 3.7 0
Bosnia and Herzegovina
24.2 45.1 151.0 175.9 199.7 243.6 235.3 167.0 102.1 33.0 3.0 0.0 0.0 0
Gambia 23.8 10.9 6.9 6.1 5.8 4.7 11.9 11.9 11.9 11.9 3.6 3.6 3.6 0
Georgia 22.5 26.0 21.5 21.5 18.8 15.5 12.6 12.6 11.3 11.3 3.4 3.4 3.4 0
Namibia 21.9 16.4 16.8 22.1 24.0 20.0 17.2 17.2 11.0 11.0 3.3 3.3 3.3 0
Barbados 21.5 22.5 16.5 8.1 12.5 9.5 8.6 10.8 10.8 10.8 3.2 3.2 3.2 0
Djibouti 21.0 20.6 20.6 20.7 18.0 15.8 12.1 12.1 10.5 10.5 3.2 3.2 3.2 0
Mozambique 18.2 3.2 13.8 9.9 8.4 9.9 9.9 9.9 9.1 9.1 2.7 2.7 2.7 0
Mauritania 15.7 14.7 13.4 14.2 15.0 14.7 14.3 14.3 7.9 7.9 2.4 2.4 2.4 0
Uganda 12.8 11.4 12.2 12.7 13.4 12.7 4.1 6.4 6.4 6.4 1.9 1.9 1.9 0
Congo 11.9 6.6 9.3 11.4 2.5 5.5 7.0 7.0 6.0 6.0 1.8 1.8 1.8 0
Central African Republic
11.3 7.0 1.4 4.3 4.0 4.4 4.1 5.7 5.7 5.7 1.7 1.7 1.7 0
Antigua and Barbuda 10.7 26.5 -2.0 5.0 3.1 3.7 1.5 1.5 1.5 1.4 1.0 0.5 0.0 0
Mongolia 10.6 13.2 12.4 11.2 9.3 6.9 5.7 5.7 5.3 5.3 1.6 1.6 1.6 0
Gabon 10.3 12.0 7.8 13.7 6.4 5.0 5.0 5.2 5.2 5.2 1.5 1.5 1.5 0
Saint Lucia 8.3 6.3 3.2 4.2 4.1 7.6 2.5 4.2 4.2 4.2 1.2 1.2 1.2 0
Botswana 6.8 2.6 2.6 2.5 4.0 3.6 3.6 3.6 3.4 3.4 1.0 1.0 1.0 0
Grenada 6.0 3.8 N.R. 2.9 1.3 2.1 2.1 3.0 3.0 3.0 0.9 0.9 0.9 0
Lesotho 5.1 3.4 2.8 2.4 1.8 1.6 2.6 2.6 2.6 2.6 0.8 0.8 0.8 0
Maldives 4.6 0.9 1.5 4.6 14.0 2.8 0.0 2.3 2.3 2.3 0.7 0.7 0.7 0
Samoa 4.5 2.6 6.1 0.6 2.0 2.2 0.0 2.3 2.3 2.3 0.7 0.7 0.7 0
Saint Kitts and Nevis 3.7 1.6 2.6 7.0 6.6 5.3 2.8 2.8 1.9 1.9 0.6 0.6 0.6 0
Seychelles 2.8 2.0 1.1 0.8 0.7 1.5 0.6 1.4 1.4 1.4 0.4 0.4 0.4 0
Comoros 2.5 3.6 2.5 2.7 1.9 1.8 1.2 1.3 1.3 1.3 0.4 0.4 0.4 0
Solomon Islands 2.0 0.8 6.2 0.3 0.6 0.5 1.0 1.0 1.0 1.0 0.3 0.3 0.3 0
Saint Vincent and the Grenadines
1.8 2.3 10.0 6.0 6.9 6.0 3.1 3.1 0.9 0.9 0.3 0.3 0.3 0
Palau 1.6 2.1 0.4 0.6 0.6 0.1 1.8 1.8 0.8 0.8 0.2 0.2 0.2 0
Dominica 1.5 2.1 1.1 2.1 1.6 3.0 1.4 1.4 0.8 0.8 0.2 0.2 0.2 0

October 2004 TEAP BDN Task Force Report 57
Tonga 1.3 0.0 83.4 0.5 0.7 0.8 0.3 0.7 0.7 0.7 0.2 0.2 0.2 0
Federated States of Micronesia
1.2 1.2 1.2 1.0 N.R. N.R. 1.0 1.0 0.6 0.6 0.2 0.2 0.2 0
Marshall Islands 1.2 0.6 1.1 0.5 0.2 0.2 0.2 0.6 0.6 0.6 0.2 0.2 0.2 0
Kiribati 0.7 0.5 0.0 0.0 0.0 0.0 0.0 0.0 0.0 0.0 0.0 0.0 0.0 0
Nauru 0.5 0.5 0.4 0.4 0.4 0.0 0.0 0.0 0.0 0.0 0.0 0.0 0.0 0
Tuvalu 0.3 0.3 0.2 0.0 0.0 0.0 0.0 0.0 0.0 0.0 0.0 0.0 0.0 0
Vanuatu 0.0 0.0 0.0 0.0 0.0 0.0 0.0 0.0 0.0 0.0 0.0 0.0 0.0 0
Afghanistan - - - - - 0.0 0.0 0.0 0.0 0.0 0.0 0
Cape Verde N.R. - - - N.R. N.R. - 0
Cook Islands N.R. - - - - - - 0
Niue N.R. - - - - - - 0
Sao Tome and Principe
N.R. - - - - N.R. - 0
Subtotal 2097.9 2076.5 2096.5 1898.2 1687.8 1545.3 1344.3 1476.0 1077.0 951.6 279.3 267.5 264.8 0
Total 162428 140414 124243 116386 103379 90802 83705 83562 59225 45498 20768 16365 10347 0

October 2004 BDN Task Force Report 58
Annex III: Montreal Protocol gradual phase-down plus adjusted NPPs
Numbers:
Not underlined: data submitted to UNEP
Underlined normal: determined by the Task Force
Underlined italic: figures as part of NPP
Shaded row: NPP data available, but NPP not yet approved ANNEX III MONTREAL PROTOCOL GRADUAL PHASEDOWN + ADJUSTED NPPs GRADUAL
Consumption of Annex A/I - CFCs (ODP tonnes)
Article 5 Parties
Base 1998 1999 2000 2001 2002 2003 2004 2005 2006 2007 2008 2009 2010
GROUP I
China 57,818.7 55,414.2 42,983.4 39,123.6 33,922.6 30,621.2 22,812.0 21262.0 17593.0 12498.0 8176.0 6828.0 2546.0 0
Brazil 10,525.8 9,542.9 11,612.0 9,275.1 6,230.9 3,000.6 3,000.6 3,000.6 3,070.0 2,050.0 1000.0 424.0 74.0 0
Korea, Republic of 9,159.8 5,298.8 7,402.6 7,395.4 6,802.2 6,646.6 5,957.7 5268.8 4579.9 2976.9 1374.0 916.0 458.0 0
Indonesia 8,332.7 6,182.8 5,865.8 5,411.1 5,003.3 5,506.3 4,829.3 3266.0 2036.0 1136.0 450.0 150.0 50.0 0
India 6,681.0 5,264.7 4,142.9 5,614.3 4,514.3 3,917.7 3,367.1 3489.0 2266.0 1560.0 964.0 417.0 273.0 0
Thailand 6,082.1 3,783.0 3,610.6 3,568.3 3,375.1 2,177.3 2,177.3 2,177.3 1,364.0 1121.0 912.0 704.0 496.0 0
Argentina 4,697.2 3,546.3 4,316.3 2,396.7 3,293.1 2,139.2 2,139.2 2,139.2 2,047.0 1997.0 686.0 636.0 586.0 0
Mexico 4,624.9 3,482.9 2,837.9 3,059.5 2,223.9 1,946.7 1,983.2 1983.2 2205.0 150.0 50.0 50.0 50.0 0
Iran, Islamic Rep of 4,571.7 5,571.0 4,399.0 4,156.5 4,204.8 4,437.8 3,889.4 3889.4 2269.2 965.6 578.7 328.4 132.7 0
Turkey 3,805.7 3,985.0 1,791.1 820.2 731.2 698.9 438.9 316.0 150.0 0.0 0.0 0.0 0.0 0
Nigeria 3,650.0 4,761.5 4,286.2 4,094.8 3,665.5 3,286.7 2,662.4 2662.4 1725.4 1015.9 507.6 286.1 86.1 0
Venezuela 3,322.4 3,213.9 1,922.1 2,705.9 2,546.2 1,552.8 1,552.8 1,552.8 1,661.0 1661.0 400.0 0.0 0.0 0
Malaysia 3,271.1 2,333.7 2,010.1 1,979.8 1,946.9 1,605.5 1,566.0 1,136.0 699.0 579.0 490.0 401.0 332.0 0
Philippines 3,055.9 2,130.2 2,087.6 2,905.2 2,049.4 1,644.5 1,644.5 1644.5 1509.0 1360.0 453.0 400.0 300.0 0
Syrian Arab Republic 2,224.6 1,245.6 1,280.7 1,174.7 1,392.2 1,201.6 1,124.6 1118.5 1112.3 723.0 333.7 222.5 111.2 0
Colombia 2,208.2 1,224.0 985.5 1,149.3 1,164.8 907.0 1,083.4 1,057.5 1,020.5 750.0 330.8 247.8 152.5 0
Algeria 2,119.5 1,549.2 1,502.2 1,474.6 1,021.8 1,761.8 1,527.8 1293.8 1059.8 688.8 317.9 212.0 106.0 0
Saudi Arabia 1,798.5 1,921.8 1,710.4 1,593.6 1,593.0 1,531.0 1,320.4 1109.8 899.3 584.5 269.8 179.9 89.9 0
Pakistan 1,679.4 1,196.0 1,421.8 1,945.3 1,666.3 1,647.0 1,124.0 971.8 819.5 573.7 245.9 163.9 82.0 0
Egypt 1,668.0 1,540.0 1,373.6 1,267.0 1,334.8 1,294.0 1,103.8 968.9 834.0 542.1 250.2 166.8 83.4 0
Subtotal 141,297.2 123,187.5 107,541.8 101,110.9 88,682.3 77,524.2 65,304.4 60307.4 48919.8 32932.6 17789.6 12733.2 6008.8 0

October 2004 TEAP BDN Task Force Report 59
GROUP II
Tunisia 870.1 790.6 566.0 555.0 570.0 465.8 362.5 362.5 362.5 282.8 130.5 87.0 43.5 0
Serbia & Montenegro 849.2 519.4 548.6 309.7 263.3 371.7 412.0 412.0 412.0 276.0 127.4 84.9 42.5 0
Chile 828.7 737.9 657.5 576.0 470.2 370.2 370.2 370.2 370.2 269.3 124.3 82.9 41.4 0
Morocco 802.3 923.6 870.6 564.0 435.2 668.6 474.8 438.0 401.2 260.7 120.3 80.2 40.1 0
Lebanon 725.5 475.3 463.4 527.9 533.4 491.7 491.7 491.7 362.0 235.0 75.0 35.0 0.0 0
Libyan Arab Jam. 716.7 659.8 894.0 985.4 985.4 985.4 700.0 461.0 300.0 176.0 52.0 11.6 0.0 0
Romania 675.8 582.0 338.2 360.6 185.7 359.4 352.2 345.1 337.9 219.6 101.4 67.6 33.8 0
Jordan 673.3 647.2 398.0 354.0 321.0 90.0 74.4 74.4 74.4 74.4 74.4 67.3 33.7 0
Congo, Dem Rep of 665.7 688.5 368.1 386.6 639.4 569.4 566.9 449.9 332.9 216.4 99.9 66.6 33.3 0
Cuba 625.1 531.4 571.4 533.7 504.0 488.8 481.0 396.8 312.6 203.2 93.8 62.5 31.3 0
South Africa 592.6 155.1 117.3 80.5 16.0 86.6 60.8 60.8 60.8 60.8 60.8 59.3 29.6 0
Bangladesh 581.6 830.4 800.6 805.0 807.9 328.0 333.0 328.7 289.7 207.2 87.1 71.0 53.0 0
Dominican Republic 539.8 311.4 752.1 401.9 485.8 329.8 268.2 359.2 266.5 252.0 81.0 81.0 53.3 0
United Arab Emirates 529.3 737.4 529.2 476.2 423.4 370.4 335.2 299.9 264.7 172.0 79.4 52.9 26.5 0
Former Yugoslav Rep of Macedonia
519.7 62.8 191.9 49.5 46.7 34.1 49.3 49.3 49.3 49.3 49.3 49.3 26.0 0
Vietnam 500.0 392.0 293.9 220.0 243.0 235.5 243.7 210.9 186.9 136.0 69.1 37.2 7.4 0
Kuwait 480.4 399.2 450.0 419.9 354.2 349.0 312.7 276.5 240.2 156.1 72.1 48.0 24.0 0
Sudan 456.8 294.5 294.5 291.5 266.0 253.0 216.0 216.0 216.0 148.5 68.5 45.7 22.8 0
Zimbabwe 451.4 390.2 229.1 145.0 259.4 129.1 129.1 129.1 129.1 129.1 67.7 45.1 22.6 0
Sri Lanka 445.6 250.4 216.4 220.3 190.4 185.0 179.9 179.9 179.9 144.8 66.8 44.6 22.3 0
Korea, DPR 441.7 112.0 106.0 77.0 320.8 299.0 273.0 246.9 220.9 143.6 66.3 44.2 22.1 0
Panama 384.2 346.0 301.1 249.9 180.4 195.3 164.0 180.9 101.5 50.8 33.8 16.9 0.0 0
Subtotal 13,355.5 10,837.1 9,957.9 8,589.6 8,501.6 7,655.8 6,850.6 6,339.5 5,471.0 3,863.5 1,800.9 1,240.8 609.1 0.0
GROUP III
Yemen 349.1 453.3 1,040.7 1,045.0 1,023.4 959.9 698.1 436.3 174.6 113.5 52.4 34.9 17.5 0
Honduras 331.6 157.4 334.8 172.3 121.6 131.2 219.1 192.5 165.8 107.8 49.7 33.2 16.6 0
El Salvador 306.6 194.6 109.5 99.1 116.9 101.6 97.5 97.5 97.5 97.5 46.0 30.7 15.3 0
Ecuador 301.4 271.7 153.0 230.5 207.0 229.6 246.0 235.0 150.0 80.0 42.0 21.0 21.0 0
Côte d'Ivoire 294.2 267.8 166.2 206.4 148.0 106.5 93.4 93.4 93.4 93.4 44.1 29.4 14.7 0
Peru 289.5 326.7 295.6 347.0 189.0 196.5 179.3 162.0 144.8 94.1 43.4 29.0 14.5 0
Cameroon 256.9 311.8 361.5 368.7 364.1 226.0 220.5 174.5 128.5 83.5 38.5 25.7 12.8 0
Tanzania, Utd Rep 253.9 131.5 88.9 215.5 131.2 71.5 148.2 137.6 127.0 82.5 38.1 25.4 12.7 0
Costa Rica 250.2 -204.2 152.3 105.9 144.6 137.4 133.3 129.2 125.1 81.3 37.5 25.0 12.5 0
Oman 248.4 261.1 259.6 282.1 207.3 179.5 134.5 129.4 124.2 80.7 37.3 24.8 12.4 0
Somalia 241.4 246.9 48.6 65.6 86.9 98.5 108.2 108.2 108.2 78.5 36.2 24.1 12.1 0
Kenya 239.5 245.3 241.1 203.3 168.6 152.3 141.5 130.6 119.8 77.8 35.9 24.0 12.0 0
Guatemala 224.6 188.7 191.1 187.9 265.0 239.6 147.1 129.7 112.3 73.0 33.7 22.5 11.2 0
Croatia 219.3 85.7 141.5 171.2 113.8 140.1 88.7 98.0 65.0 0.0 0.0 0.0 0.0 0
Paraguay 210.6 113.4 345.3 153.5 116.0 96.9 91.8 91.8 91.8 68.4 31.6 21.1 10.5 0

October 2004 BDN Task Force Report 60
Singapore 210.5 16.7 24.1 21.7 21.6 0.9 145.8 125.5 105.3 68.4 31.6 21.1 10.5 0
Uruguay 199.1 194.0 111.4 106.8 102.3 75.2 111.4 105.5 99.6 64.7 29.9 19.9 10.0 0
Armenia 196.5 185.9 9.0 25.0 162.7 172.7 172.7 135.5 98.3 63.9 29.5 19.7 9.8 0
Haiti 169.0 - - 169.0 169.0 181.2 115.9 100.2 84.5 54.9 25.4 16.9 8.5 0
Senegal 155.8 128.5 121.1 116.5 98.0 71.9 51.0 51.0 51.0 50.6 23.4 15.6 7.8 0
Cyprus 149.5 81.0 114.9 165.0 137.6 131.8 62.5 62.5 62.5 48.6 22.4 15.0 7.5 0
Bahrain 135.4 149.5 129.0 113.1 106.0 94.6 85.6 76.7 67.7 44.0 20.3 13.5 6.8 0
Trinidad and Tobago 120.0 155.6 81.7 101.3 79.2 63.6 62.5 62.5 34.1 34.1 17.0 0.0 0.0 0
Angola 114.8 115.9 - N.R. 114.8 105.0 89.1 73.3 57.4 37.3 17.2 11.5 5.7 0
Mali 108.1 113.1 37.1 29.2 27.0 26.0 26.0 26.0 26.0 26.0 16.2 10.8 5.4 0
Qatar 101.4 120.8 89.0 85.8 85.4 86.7 95.1 72.9 50.7 33.0 15.2 10.1 5.1 0
Subtotal 5,677.3 4,312.7 4,647.0 4,787.4 4,507.0 4,076.7 3,764.8 3237.1 2564.7 1737.5 814.5 524.7 272.8 0
GROUP IV
Cambodia 94.2 94.2 94.2 94.2 94.2 94.2 86.7 66.9 47.1 30.6 14.1 9.4 4.7 0
Jamaica 93.2 199.0 210.4 59.8 48.6 31.7 16.2 16.2 12.2 0.0 0.0 0.0 0.0 0
Nicaragua 82.8 37.3 52.6 44.4 35.2 54.9 50.4 45.9 41.4 26.9 12.4 8.3 4.1 0
Sierra Leone 78.6 81.0 75.9 75.9 92.9 80.8 66.3 52.8 39.3 25.5 11.8 7.9 3.9 0
Brunei Darussalam 78.2 63.5 36.7 46.6 31.4 43.4 42.0 40.5 39.1 25.4 11.7 7.8 3.9 0
Bolivia 75.7 74.1 72.2 78.8 76.7 65.5 56.3 47.1 37.9 24.6 11.4 7.6 3.8 0
Moldova 73.3 40.5 11.1 31.7 23.5 29.6 18.9 18.9 18.9 18.9 11.0 7.3 3.7 0
Kyrgyzstan 72.8 56.8 52.4 53.5 53.0 38.0 33.0 33.0 33.0 23.7 10.9 7.3 3.6 0
Bahamas 64.9 54.6 53.8 65.9 63.0 55.0 24.6 36.0 25.0 14.0 0.0 0.0 0.0 0
Malta 64.3 106.6 97.2 67.6 63.1 10.3 10.3 10.3 10.3 10.3 9.6 6.4 3.2 0
Benin 59.9 54.2 56.6 54.6 54.0 35.5 17.3 17.3 17.3 17.3 9.0 6.0 3.0 0
Burundi 59.0 64.5 59.6 53.8 46.5 19.1 9.2 9.2 9.2 9.2 8.9 5.9 3.0 0
Malawi 57.7 56.9 50.4 21.5 19.0 19.0 18.7 18.7 18.7 18.7 8.7 5.8 2.9 0
Liberia 56.1 31.1 18.2 41.4 25.1 32.8 31.2 29.6 28.1 18.2 8.4 5.6 2.8 0
Myanmar 54.3 52.3 30.7 26.3 39.4 43.5 38.1 32.6 27.2 17.6 8.1 5.4 2.7 0
Guyana 53.2 29.2 39.9 24.4 19.8 14.3 10.4 10.4 10.4 10.4 8.0 5.3 2.7 0
Madagascar 47.9 23.9 26.3 12.4 9.9 7.8 7.2 7.2 7.2 7.2 7.2 4.8 2.4 0
Lao PDR 43.3 43.3 44.1 44.6 41.2 42.3 35.3 28.5 21.7 14.1 6.5 4.3 2.2 0
Guinea 42.4 41.8 39.9 37.5 35.4 31.3 25.9 23.6 21.2 13.8 6.4 4.2 2.1 0
Suriname 41.3 42.0 43.0 44.0 46.0 46.0 12.3 12.3 12.3 12.3 6.2 4.1 2.1 0
Albania 40.8 46.5 53.1 61.9 68.8 49.9 35.0 61.2 36.2 15.2 6.2 2.2 0.0 0
Togo 39.8 36.7 41.7 37.5 34.7 35.3 33.7 26.8 19.9 12.9 6.0 4.0 2.0 0
Burkina Faso 36.3 37.0 30.6 25.4 19.6 16.3 13.2 13.2 13.2 11.8 5.4 3.6 1.8 0
Papua New Guinea 36.3 45.2 35.5 47.9 15.0 34.6 22.7 22.7 17.0 8.0 4.5 0.0 0.0 0
Ghana 35.8 50.3 46.8 47.0 35.6 21.2 32.0 25.0 17.9 11.6 5.4 3.6 1.8 0
Chad 34.6 38.1 37.5 36.5 31.6 27.1 22.8 20.1 17.3 11.2 5.2 3.5 1.7 0
Ethiopia 33.8 38.2 39.2 39.2 34.6 30.0 28.0 22.5 16.9 11.0 5.1 3.4 1.7 0

October 2004 TEAP BDN Task Force Report 61
Fiji 33.4 13.1 9.4 0.0 0.0 0.0 0.0 0.0 0.0 0.0 0.0 0.0 0.0 0
Niger 32.0 60.7 58.3 39.9 29.1 26.6 24.5 20.3 16.0 10.4 4.8 3.2 1.6 0
Rwanda 30.4 37.7 30.1 30.1 30.1 30.1 30.1 22.7 15.2 9.9 4.6 3.0 1.5 0
Mauritius 29.1 39.0 18.6 19.1 14.5 7.3 4.0 4.0 4.0 4.0 4.0 2.9 1.5 0
Zambia 27.4 26.7 24.3 23.3 11.8 10.6 11.6 12.7 13.7 8.9 4.1 2.7 1.4 0
Nepal 27.0 32.9 25.0 94.0 0.0 0.0 0.0 0.0 0.0 0.0 0.0 0.0 0.0 0
Guinea Bissau 26.3 27.1 26.0 26.0 26.9 27.4 29.4 21.3 13.2 8.5 3.9 2.6 1.3 0
Swaziland 24.6 2.2 2.1 0.1 1.3 1.2 1.2 1.2 1.2 1.2 1.2 1.2 1.2 0
Belize 24.4 25.0 25.1 15.5 28.0 21.7 15.1 13.7 12.2 7.9 3.7 2.4 1.2 0
Bosnia and Herzegovina
24.2 45.1 151.0 175.9 199.7 243.6 235.3 167.0 102.1 33.0 3.0 0.0 0.0 0
Gambia 23.8 10.9 6.9 6.1 5.8 4.7 4.7 4.7 4.7 4.7 3.6 2.4 1.2 0
Georgia 22.5 26.0 21.5 21.5 18.8 15.5 12.6 11.9 11.3 7.3 3.4 2.3 1.1 0
Namibia 21.9 16.4 16.8 22.1 24.0 20.0 17.2 14.1 11.0 7.1 3.3 2.2 1.1 0
Barbados 21.5 22.5 16.5 8.1 12.5 9.5 8.6 8.6 8.6 7.0 3.2 2.2 1.1 0
Djibouti 21.0 20.6 20.6 20.7 18.0 15.8 12.1 11.3 10.5 6.8 3.2 2.1 1.1 0
Mozambique 18.2 3.2 13.8 9.9 8.4 9.9 9.6 9.4 9.1 5.9 2.7 1.8 0.9 0
Mauritania 15.7 14.7 13.4 14.2 15.0 14.7 14.3 11.1 7.9 5.1 2.4 1.6 0.8 0
Uganda 12.8 11.4 12.2 12.7 13.4 12.7 4.1 4.1 4.1 4.1 1.9 1.3 0.6 0
Congo 11.9 6.6 9.3 11.4 2.5 5.5 7.0 6.5 6.0 3.9 1.8 1.2 0.6 0
Central African Republic
11.3 7.0 1.4 4.3 4.0 4.4 4.1 4.1 4.1 3.7 1.7 1.1 0.6 0
Antigua and Barbuda 10.7 26.5 -2.0 5.0 3.1 3.7 1.5 1.5 1.5 1.4 1.0 0.5 0.0 0
Mongolia 10.6 13.2 12.4 11.2 9.3 6.9 5.7 5.5 5.3 3.4 1.6 1.1 0.5 0
Gabon 10.3 12.0 7.8 13.7 6.4 5.0 5.0 5.0 5.0 3.3 1.5 1.0 0.5 0
Saint Lucia 8.3 6.3 3.2 4.2 4.1 7.6 2.5 2.5 2.5 2.5 1.2 0.8 0.4 0
Botswana 6.8 2.6 2.6 2.5 4.0 3.6 3.5 3.5 3.4 2.2 1.0 0.7 0.3 0
Grenada 6.0 3.8 N.R. 2.9 1.3 2.1 2.1 2.1 2.1 2.0 0.9 0.6 0.3 0
Lesotho 5.1 3.4 2.8 2.4 1.8 1.6 1.6 1.6 1.6 1.6 0.8 0.5 0.3 0
Maldives 4.6 0.9 1.5 4.6 14.0 2.8 0.0 0.0 0.0 0.0 0.0 0.0 0.0 0
Samoa 4.5 2.6 6.1 0.6 2.0 2.2 0.0 0.0 0.0 0.0 0.0 0.0 0.0 0
Saint Kitts and Nevis 3.7 1.6 2.6 7.0 6.6 5.3 2.8 2.3 1.9 1.2 0.6 0.4 0.2 0
Seychelles 2.8 2.0 1.1 0.8 0.7 1.5 0.6 0.6 0.6 0.6 0.4 0.3 0.1 0
Comoros 2.5 3.6 2.5 2.7 1.9 1.8 1.2 1.2 1.2 0.8 0.4 0.3 0.1 0
Solomon Islands 2.0 0.8 6.2 0.3 0.6 0.5 0.5 0.5 0.5 0.5 0.3 0.2 0.1 0
Saint Vincent and the Grenadines
1.8 2.3 10.0 6.0 6.9 6.0 3.1 2.0 0.9 0.6 0.3 0.2 0.1 0
Palau 1.6 2.1 0.4 0.6 0.6 0.1 1.8 1.3 0.8 0.5 0.2 0.2 0.1 0
Dominica 1.5 2.1 1.1 2.1 1.6 3.0 1.4 1.1 0.8 0.5 0.2 0.2 0.1 0
Tonga 1.3 0.0 83.4 0.5 0.7 0.8 0.3 0.3 0.3 0.3 0.2 0.1 0.1 0
Federated States of Micronesia
1.2 1.2 1.2 1.0 N.R. N.R. 1.0 1.0 0.6 0.4 0.2 0.1 0.1 0
Marshall Islands 1.2 0.6 1.1 0.5 0.2 0.2 0.2 0.2 0.2 0.2 0.2 0.1 0.1 0

October 2004 BDN Task Force Report 62
Kiribati 0.7 0.5 0.0 0.0 0.0 0.0 0.0 0.0 0.0 0.0 0.0 0.0 0.0 0
Nauru 0.5 0.5 0.4 0.4 0.4 0.0 0.0 0.0 0.0 0.0 0.0 0.0 0.0 0
Tuvalu 0.3 0.3 0.2 0.0 0.0 0.0 0.0 0.0 0.0 0.0 0.0 0.0 0.0 0
Vanuatu 0.0 0.0 0.0 0.0 0.0 0.0 0.0 0.0 0.0 0.0 0.0 0.0 0.0 0
Afghanistan - - - - - 0.0 0.0 0.0 0.0 0.0 0.0 0
Cape Verde N.R. - - - N.R. N.R. - 0
Cook Islands N.R. - - - - - - 0
Niue N.R. - - - - - - 0
Sao Tome and Princ. N.R. - - - - N.R. - 0
Subtotal 2097.9 2076.5 2096.5 1898.2 1687.8 1545.3 1278.02 1128.9 899.5 582.1 275.4 177.1 87.8 0
TOTAL 162428 140414 124243 116386 103379 90802 77198 71013 57855 39116 20680 14676 6979 0

October 2004 TEAP BDN Task Force Report 63
Annex IV - Data on CFC production (ODP tonnes)
(excludes production for feedstock use)
ANNEX IV Data on CFC Production - excludes production for feedstock use
1995-7
Baseline 1998 1999 2000 2001 2002 2003 2004 2005 2006 2007 2008 2009 2010
Australia 1283 0 0 0 0 0 0 0 0 0 0 0 0
Czech Rep 113 0 0 0 0 0 0 0 0 0 0 0 0
France 81.3 0 0 0 0 0 0 0 0 0 0 0 0
Germany 0 101 0 0 0 0 0 0 0 0 0 0
Greece 1811 1210 1828 1460 1440 1168 1000 906 900 272 272 272 0
Italy 7226 6423 7081 8422 9131 6000 5000 3613 3600 1084 1084 1084 0
Japan 10209 0 0 0 0 0 0 0 0 0 0 0 0
Netherlands 13461 15721 12303 9635 9214 2888 2500 2000 0 0 0 0 0
Russian Fed 23608 18417 25536 0 0 0 0 0 0 0 0 0 0
Spain 5755 5839 8277 6936 6491 4948 4500 2878 2850 863 863 863 0
UK 2715 1417 0 0 0 0 0 0 0 0 0 0 0
USA 12048 0 0 495 0 0 0 0 1200 1200 800 800 0
Sub-total 78310 30711 29489 26948 26276 15004 13000 9397 8550 3418.8 3019 3019 0
Argentina 2745 2954 3101 3027 2899 3015 3018 3020 1647 1647 686 686 686 0
Brazil 10182 7986 11286 0 0 0 0 0 0 0 0 0 0 0
China 47004 55402 44739 39962.8 36167.2 32269 30000 25300 18750 13500 9600 7400 3200 0
India 22633 20013 22499 20403.8 18689.2 16,855 15058 13176 11294 7342 3389 2259 1130 0
Korea Dem 403 112 106 77 290.8 299 0 0 0 0 0 0 0 0
Korea Rep 9202 5528 7238 7000 7526 7507 7500 7500 5061 5000 1518 1518 1518 0
Mexico 11042 5252 5530 7546 6636 5653 7335 7335 7335 0 0 0 0 0
South Africa 542 0 0 0 0 0 0 0 0 0 0 0 0 0
Venezuela 4787 3652 2859 2281 2722 1637.4 2400 2400 2000 2000 1000 1000 1000 0
Sub-total 108540 100899 97358 80298 74930 67236 65311 58731 46087 29489 16193 12863 7534 0
GLOBAL TOTAL 186850 128069 109787 101878 93511 80315 71731 55484 38039 19612 15882 10553 0
Essential Uses requested/approved 9115 8313 6792 6944 6577 5598 3268 2789
Essential Uses Produced 7292 6651 5434 4166 3946 3359 1961 1673 1200 800 800
A5+BDN 120777 103136 96445 89345 76369 68372 53523 36366 18412 15082 9753 0

October 2004 BDN Task Force Report 64
Annex V - Comparison of production and consumption (two scenarios)
ANNEX V COMPARISON OF PRODUCTION AND CONSUMPTION DATA (TWO SCENARIOS)
PRODUCTION 1999 2000 2001 2002 2003 2004 2005 2006 2007 2008 2009 2010 Total production non A5 30711 29489 26948 26275.5 15004 13000 9397 8550 3419 3019 3019 0 Total production A5 119394 97358 80298 74930 67236 65311 58731 46087 29489 16193 12863 7534 0 Essential use production 7292 6651 5434 4166 3946 3359 1961 1673 1200 800 800 A5+BDN 120777 103136 96445 89345 76369 68372 53523 36366 18412 15082 9753 0 Percentage production non-Article 5(1) 19.3 22.2 22.3 24.7 14.5 14.1 13.9 19 12.1 14.7 22.8 CONSUMPTION 1999 2000 2001 2002 2003 2004 2005 2006 2007 2008 2009 2010 A. MP schedule + NPPS Group I 123,187.5 107,541.8 101,110.9 88,682.3 77,524.2 71,181.2 70,009.5 48,919.8 35,902.5 17,789.6 13,581.8 7,705.9 0 Group II 10,837.1 9,957.9 8,589.6 8,501.6 7,655.8 7,096.1 7,776.8 6,460.5 6,011.3 1,884.2 1,739.0 1,600.0 0.0 Group III 4,312.7 4,647.0 4,787.4 4,507.0 4,076.7 4,083.6 4299.2 2767.4 2632.9 814.5 776.5 776.5 0 Group IV 2076.5 2096.5 1898.2 1687.8 1545.3 1344.3 1476.0 1077.0 951.6 279.3 267.5 264.8 0 TOTAL 140414 124243 116386 103379 90802 83705 83561 59225 45498 20768 16365 10347 0 1999 2000 2001 2002 2003 2004 2005 2006 2007 2008 2009 2010 B. MP gradual schedule + NPPS Group I 123,187.5 107,541.8 101,110.9 88,682.3 77,524.2 65,304.4 60307.4 48919.8 32932.6 17789.6 12733.2 6008.8 0 Group II 10,837.1 9,957.9 8,589.6 8,501.6 7,655.8 6,850.6 6,339.5 5,471.0 3,863.5 1,800.9 1,240.8 609.1 0 Group III 4,312.7 4,647.0 4,787.4 4,507.0 4,076.7 3,764.8 3237.1 2564.7 1737.5 814.5 524.7 272.8 0 Group IV 2076.5 2096.5 1898.2 1687.8 1545.3 1278.017 1128.9 899.5 582.1 275.4 177.1 87.8 0 TOTAL 140414 124243 116386 103379 90802 77198 71013 57855 39116 20680 14676 6979 0 PRODUCTION MINUS CONSUMPTION 2001 2002 2003 2004 2005 2006 2007 2008 2009 2010 A. MP stepwise schedule + NPPs -3466 -13250 -6934 -1457 -7336 -15189 -5701 -9133 -2355 -1283 -594 0 B. MP gradual schedule + adjusted NPPs -3466 -13250 -6934 -1457 -829 -2641 -4332 -2750 -2268 406 2774 0