team xxxxx: names of team members omitted on purpose electric power industry
TRANSCRIPT

Team XXXXX:Names of team members omitted on purpose
Electric Power Industry

Objectives• Electricity quick Facts• Brief History of Electricity in US• Industry Analysis• Firm Analysis: Georgia Power
– A Coal Perspective• Macroeconomic Issues• Look to the Future• Conclusion• Q & A

Electricity• A $200+ Billion Industry• Most prevalent form of energy on Earth• Lifeblood of the US Economy• Controllable and Convenient • Unparalleled Versatility, But:
Cannot be Stored: Must be Produced exactly when needed to meet demand.
• World’s most unique Commodity
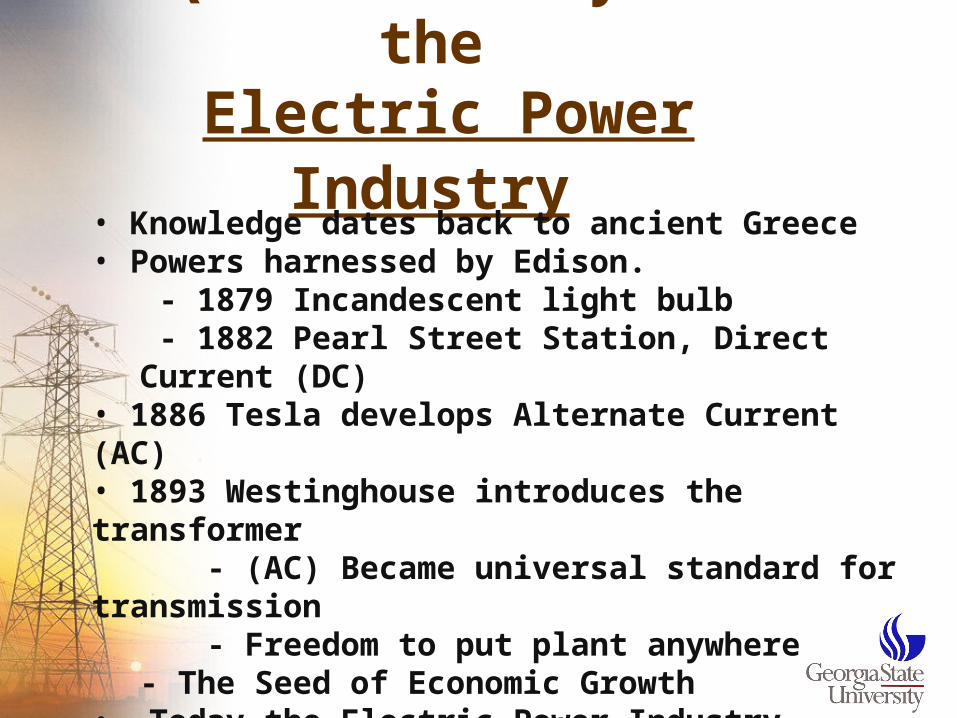
Quick History of the Electric Power Industry
• Knowledge dates back to ancient Greece• Powers harnessed by Edison.
- 1879 Incandescent light bulb - 1882 Pearl Street Station, Direct Current (DC)
• 1886 Tesla develops Alternate Current (AC)• 1893 Westinghouse introduces the transformer - (AC) Became universal standard for transmission - Freedom to put plant anywhere
- The Seed of Economic Growth• Today the Electric Power Industry represents nearly 2% of US total GDP

Industry Analysis
A. Market Structure
B. Size of Industry Relative to Economy.
C. Demand factors. – Developing Nations– Scope of Change– World Demand

A. Market Structure
• First viewed as “Natural Monopoly”• Crash of 29 reveled vulnerability of over leveraged producers• Cry for regulation• Today over 2,200 power generating plants with combined retail revenues of $80 billion. • Highly concentrated (50 firms generate 85% of revenues)• Major players (Southern Company, Duke Power, Excelon, American Electric Power, and Consolidated Edison of New York).• Over 2,000 government-owned electric power companies
Last Major Regulated Energy Industry

•In 1977, one dollar spent on energy supported $9.50 of Gross Domestic Product (GDP). •Today one dollar spent on energy yields $14 of GDP (adjusted for inflation).
*Fueling our Future/World Climate Report“Energy Reality Will Constrain Kyoto Policies”
By Mark P. Mills
B. Size of industry relative to economy
Period 2006 IV 05 I 06 II 06 III 06 IV 06
GDP 13253 12730.5 13008.4 13197.3 13322.6 13487.2
Electricity 212 219.9 206.2 206.9 216.6 218.3
Percent 1.60 1.73 1.59 1.57 1.63 1.62

Developing Nations Appetite for EnergyReturns to Scale
CRS DRS
China, IndiaIRS

One Country’s Scale of Change

World New Generation Capacity
78% of Plants in China, India, & US
Firm Analysis –Georgia Power
A Coal Perspective

Coal Produced Electricity is a Dirty Business

• Largest Consumer Coal in Nation• Largest single Producer of Electricity in Nation
• Coal : 80% of Georgia Powers kW Capacity
• Yet Georgia Power has a stellar reputation in the Business Community with Southern Style Values, Unquestionable Trust, Superior Performance, Diversity, Stewardship, & Total Commitment to Community, Employees & Customers

If Fact: Coals Reputation has Improved Significantly in US.

How Did Coal Get So Sexy?
• Ecological Forces
• Political Forces
• Global Forces
• Patriotic forces
ANSWER:
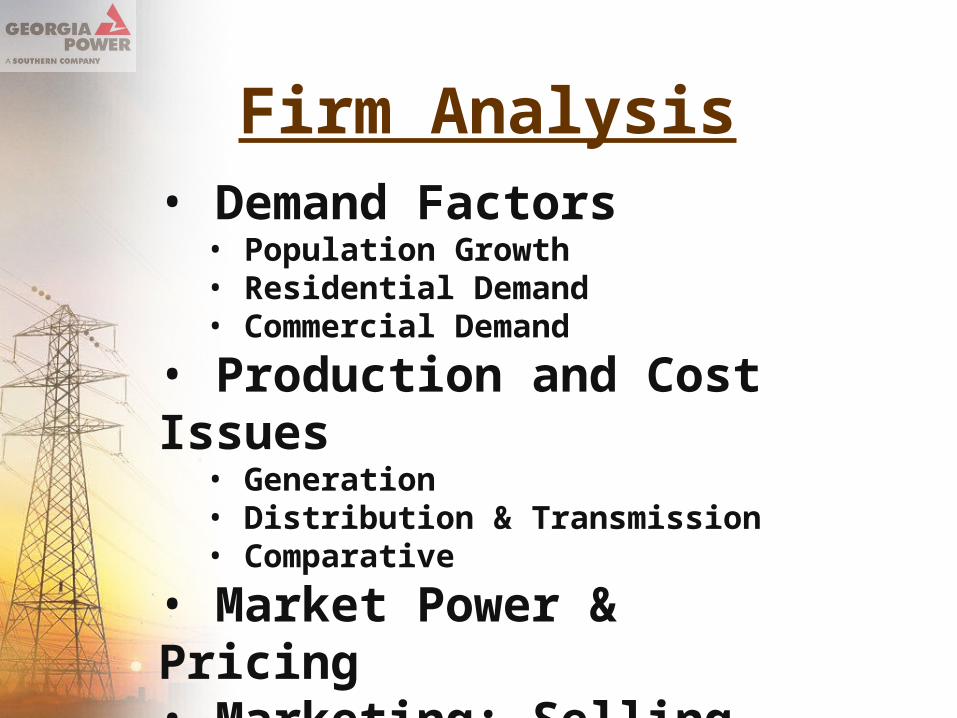
Firm Analysis• Demand Factors
• Population Growth• Residential Demand• Commercial Demand
• Production and Cost Issues• Generation• Distribution & Transmission• Comparative
• Market Power & Pricing• Marketing: Selling Value

Georgia’s PopulationA Growing Need for Energy Production

Residential Demand

Commercial Demand

Georgia Powers Generating Plants
•Fossil 14•Hydro 20•Nuclear 2

Distribution Costs

Transmission Cost

Comparative Production CostIt’s all relative

Market Power & Pricing
• Market power is a big issue in the utility industry.
•The ability of a power generation company, using one or more of its plants, to significantly increase market price without fear of lost market share, is in constant focus.
• Utility companies are constantly under scrutiny for pricing tactics.

Market Power
Be careful what you wish for?• Constant government scrutiny • Constant public scrutiny for pricing policies
•”
Argument made for “ Perfect Market”• market influences to dynamic for market power.

Demand Response
Electricity cannot be stored therefore it can only respond to demand surges. This characteristic makes the product extremely price sensitive to slight shifts in demand curve.

Pricing Consideration
Effect on pricing: During peak, demand is most inelastic. With a very small shift in the demand curve, pricing responds substantially. This pricing opportunity cannot be overlooked.
Demand response (managing price through demand)

Selling ValueConsumer Goods comparison

Value Now!

And into the Future!Average projected kWh per cent price through 2020

Georgia average cent per kWh PriceThe Best Value in the South

Macroeconomic Environment
• Electricity & the GDP • Job Creation• Unemployment• Interest Rates• World GDP• Declining World Oil production• Global Demand for Electricity
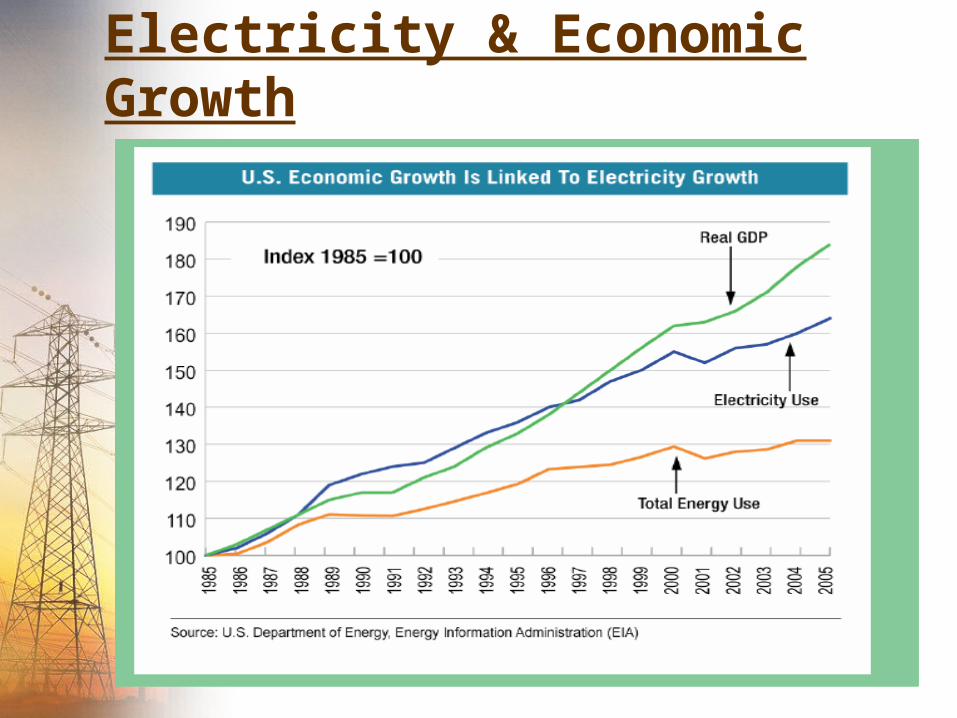
Electricity & Economic Growth
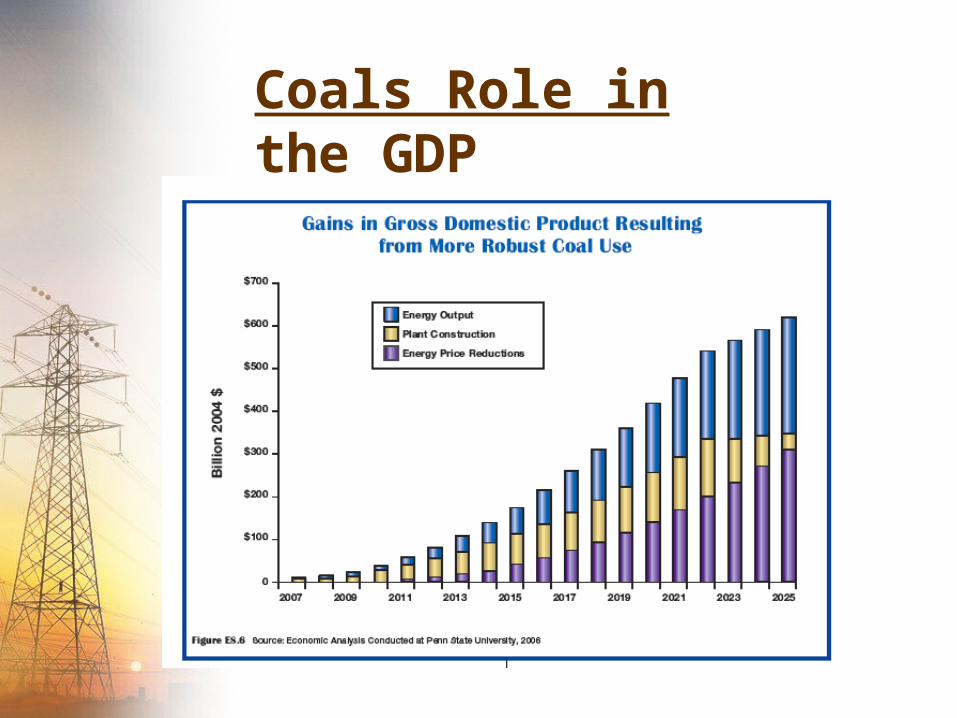
Coals Role in the GDP

Job Creation

Long term Unemployment Under Control

World Productivity Equals Demand

Who will fill the void?

World Demand strong for Electricity

Reducing Production Costs
• Regulation: Rates set by state agencies– Limit ability to recoup investments
• Demand Response– Single most effective control of cost going forward– Strategic Deployment of Capital– Idle Capacity: Cash Drain
• Alternative Energy Sources– Alleviate peak demand
Looking to the Future

Reducing Production Costs
Monthly Electricity ConsumptionUS Total 2006
050
100150200250300350400450
Ter
ewat
t ho
urs
New Plant?

• Geothermal• Tidal Power• Wave Power• Landfill Gas• Biomass
Alternative Energy Resources
Conclusion
With the following Assumptions:• US GDP Growth Continues• Abundant Coal availability• Technology Advances Keep Pace with Demand• Spending Continues on R&D & Clean Coal Technologies• Developing Nations Continue to Consume Disproportionately
Future Bright for Georgia Power & Electricity

Conclusion
2003 Estimate used for World GDP and 2003 revenue for Alabama Power
Q & A
TEAM BLUE THUNDER
• William Mitchell
• Manuel Escribano
• Keith Foxx
• Eric Sundby