team #2559 waste not, want not: putting recyclables in their place
TRANSCRIPT

Team #2559, Page 1 of 20
Team #2559
Waste Not, Want Not: Putting Recyclables in Their Place

Team #2559, Page 2 of 20
Summary
The increased usage of plastic, paper, and other recyclable materials, due to convenience and
efficiency, has not been matched by available recycling methods. These readily disposable goods
have replaced reusable products such as glassware, resulting in landfills inundated by wastes—
such as plastic and Styrofoam—that are hardly biodegradable (Rogers). While the immense
consumption of plastics is harsh on the environment, these synthetic polymers are too integrated
into modern-day society to be suspended or discontinued. How might we reconcile the use of
these goods with cost-efficient recycling methods for every state and township in the United
States?
Our team has been asked to predict the production rate of plastic waste over time, and to
forecast the amount of plastic waste present in landfills in ten years. To begin, we assumed that
while an increase in population over the next ten years will increase plastic waste output, there is
a limit to the total amount of plastic generated that is discarded. Thus our model for the
production rate of plastic is logistic, with a carrying capacity (maximum amount of plastic
discarded) of 30000 tons/year. By integrating our logistic model, we predicted the amount of
plastic waste present in landfills in 2023 to be 1,026,000 tons.
We were also consulted to design a mathematical model that could determine which
recycling method is most appropriate for a city, and apply it to Fargo, ND; Price, UT; and
Wichita, KS. Our approach began with the assumptions that geographic location has a negligible
impact on recycling rate for each method of recycling; each city will have at least one recycling
facility; the use by citizens of drop-off and curbside pickup recycling is mutually exclusive;
people will recycle in the correct manner; every household has recyclable wastes; and cities may
be modeled as circles. Thus our first model considered the probability that a person would
recycle at a drop-off center based on distance to the center. Our second model then determined
the costs of collecting and operating curbside pickup, taking into account area, population
density, and total household units of each city. Analysis led to the conclusion that Price, UT,
should employ drop-off recycling only, while Fargo, ND, and Wichita, KS, should employ
curbside pickup as the most cost-efficient methods.
On a national scale, we must report to the Environmental Protection Agency (EPA) how
our model can lead to a municipal recycling guideline policy to govern all states and townships
in the United States in an effort to mitigate the problem of trashed recyclables. Our model is best
applied to cities and townships, as the factors considered—population, area, and household
density—are specified on a city and township level. Furthermore, our model should not be used
on a state level, as states include cities and townships of varying sizes and development,
including rural and urban regions. We conducted a cost-benefit analysis of each recycling
method based on city population and area. Based on our analysis, we determined that it is more
cost efficient for cities with relatively small populations to adopt drop-off recycling only, while
curbside pickup recycling is more cost efficient for cities with larger populations.
Therefore we recommend that the EPA allows each municipality to determine their own
recycling method based on our mathematical model because the variables involved in costs of
recycling are unique to each municipality. However, as a general standard, the EPA should
require all cities and townships beginning in 2016 to recycle by the method best suited for them,
in order to put recyclables in their place so that future generations are not left to deal with a
world wasted away.
Team #2559, Page 3 of 20
Table of Contents
Summary..........................................................................................................................................2
Introduction......................................................................................................................................5
Background..........................................................................................................................5
Restatement of the Problem.................................................................................................5
Global Assumptions.............................................................................................................6
Part I: Forecasting Production of Plastic Waste..............................................................................6
Designing the Model............................................................................................................6
Validation of the Model.......................................................................................................8
Results of the Model............................................................................................................9
Sensitivity Analysis.................................................................................................9
Part II: Assigning Recycling Methods on a Local Scale...............................................................10
Assumptions.......................................................................................................................10
Drop-Off Only....................................................................................................................11
Sensitivity Test……...............................................................................................12
Single-Stream Curbside Pickup and Additional Garbage Fee..........................................13
Single-Stream Curbside Pickup.........................................................................................13
Calculation of Required Infrastructure..................................................................13
Calculations of Expenses for Both Models.......................................................................15
Drop-Off Only Cost...............................................................................................15
Drop Off Only Revenue.........................................................................................14
Curbside Pickup Cost.............................................................................................16
Curbside Pickup Revenue......................................................................................16
Analysis of the Model.......................................................................................................17
Part III: National Recycling Policy Recommendation...................................................................17
Part IV: Strengths and Weaknesses...............................................................................................18
Part V: Conclusion.........................................................................................................................18
References......................................................................................................................................19

Team #2559, Page 4 of 20
List of Figures and Tables
Figure 1............................................................................................................................................6
Figure 2............................................................................................................................................8
Table 1.............................................................................................................................................7
Table 2.............................................................................................................................................8
Table 3.............................................................................................................................................9
Table 4...........................................................................................................................................10
Table 5...........................................................................................................................................13
Table 6...........................................................................................................................................15
Table 7...........................................................................................................................................15
Table 8...........................................................................................................................................16
Table 9...........................................................................................................................................16
Table 10.........................................................................................................................................17
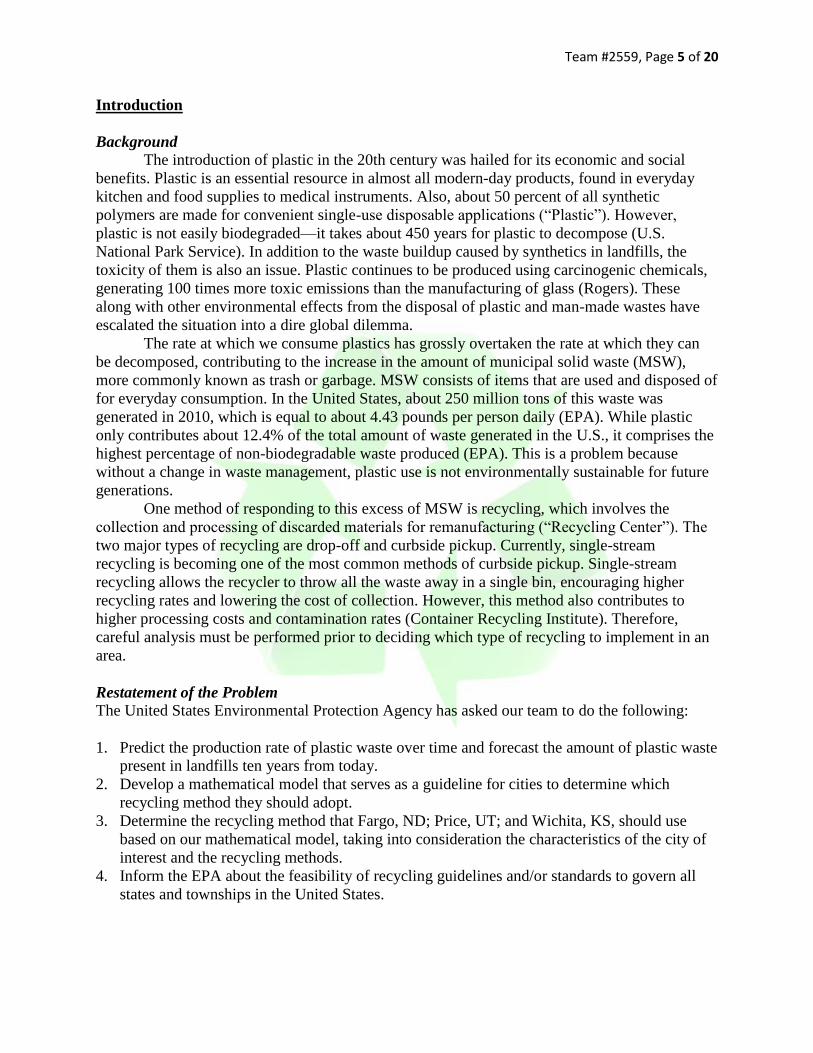
Team #2559, Page 5 of 20
Introduction
Background The introduction of plastic in the 20th century was hailed for its economic and social
benefits. Plastic is an essential resource in almost all modern-day products, found in everyday
kitchen and food supplies to medical instruments. Also, about 50 percent of all synthetic
polymers are made for convenient single-use disposable applications (“Plastic”). However,
plastic is not easily biodegraded—it takes about 450 years for plastic to decompose (U.S.
National Park Service). In addition to the waste buildup caused by synthetics in landfills, the
toxicity of them is also an issue. Plastic continues to be produced using carcinogenic chemicals,
generating 100 times more toxic emissions than the manufacturing of glass (Rogers). These
along with other environmental effects from the disposal of plastic and man-made wastes have
escalated the situation into a dire global dilemma.
The rate at which we consume plastics has grossly overtaken the rate at which they can
be decomposed, contributing to the increase in the amount of municipal solid waste (MSW),
more commonly known as trash or garbage. MSW consists of items that are used and disposed of
for everyday consumption. In the United States, about 250 million tons of this waste was
generated in 2010, which is equal to about 4.43 pounds per person daily (EPA). While plastic
only contributes about 12.4% of the total amount of waste generated in the U.S., it comprises the
highest percentage of non-biodegradable waste produced (EPA). This is a problem because
without a change in waste management, plastic use is not environmentally sustainable for future
generations.
One method of responding to this excess of MSW is recycling, which involves the
collection and processing of discarded materials for remanufacturing (“Recycling Center”). The
two major types of recycling are drop-off and curbside pickup. Currently, single-stream
recycling is becoming one of the most common methods of curbside pickup. Single-stream
recycling allows the recycler to throw all the waste away in a single bin, encouraging higher
recycling rates and lowering the cost of collection. However, this method also contributes to
higher processing costs and contamination rates (Container Recycling Institute). Therefore,
careful analysis must be performed prior to deciding which type of recycling to implement in an
area.
Restatement of the Problem The United States Environmental Protection Agency has asked our team to do the following:
1. Predict the production rate of plastic waste over time and forecast the amount of plastic waste
present in landfills ten years from today.
2. Develop a mathematical model that serves as a guideline for cities to determine which
recycling method they should adopt.
3. Determine the recycling method that Fargo, ND; Price, UT; and Wichita, KS, should use
based on our mathematical model, taking into consideration the characteristics of the city of
interest and the recycling methods.
4. Inform the EPA about the feasibility of recycling guidelines and/or standards to govern all
states and townships in the United States.

Team #2559, Page 6 of 20
Global Assumptions
1. We will assume that no major political, global, or economic crises occur in the ten year time
period. Potential changes in production and waste disposal due to such crises will be ignored.
2. Efficiency and type of technology used for processing recycled waste will remain constant in
all cities in which a recycling program is implemented.
3. Recycling programs implemented in each township will be governmentally funded; therefore
it is the responsibility of the local government to determine which recycling method is best
suited for its township based on the costs of each method.
Part I: Forecasting Production of Plastic Waste
The amount of plastic waste produced has been increasing annually since plastic was first
invented. To develop a model for the amount of waste per year, we made the following
assumptions:
Assumptions
More plastic production leads to more waste generated. This makes sense because plastic is
often used for temporary purposes, and therefore most of the plastic created would eventually
be discarded.
There is a limit to the amount of total plastic waste that is generated. This assumption is
plausible because although a higher population will demand more plastic production and thus
waste generated, there are also factors that limit the amount of the total plastic generated that
is discarded. Such factors include: recycling, limited resources to create plastic, and higher-
awareness of the importance of recycling.
Rate of recycling is proportional to rate of waste discarded, because recycling is a method of
disposing of waste. Therefore, the difference in the rates is a constant.
1. Designing the Model
Figure 1. Graph showing the pattern of plastic discarded into landfills over the period 1960–2010.
0
5000
10000
15000
20000
25000
30000
35000
1940 1960 1980 2000 2020
Pla
stic
Dis
card
ed
pe
r Y
ear
(T
ho
usa
nd
To
n)
Year
Plastic Waste Discarded, 1960–2010
Plastic Discarded (thousand tons per year)

Team #2559, Page 7 of 20
Year
Plastic discarded (thousand tons per
year), P(t)
1960 390
1970 2900
1980 6810
1990 16760
2000 24050
2005 27470
2007 28630
2008 27930
2009 27690
2010 28490
Table 1. Table showing the pattern of plastic discarded into landfills over the period 1960–2010.
By analyzing the pattern of plastic discarded into landfills, we assume that the trend is
logistic. This assumption is plausible because even though a higher population will demand more
plastic production and thus generate more waste, many factors also limit the total amount of
plastic that is discarded. Such factors include recycling, limited resources to create plastic, and
higher awareness of the importance of recycling. We assume that the rate of recycling will be
proportional to the rate of waste generated. Thus the difference between waste generated and
recycled, the total amount discarded, will remain constant. This is consistent with our logistic
model.
Logistic equations are of the form
We let and assume that the is negligible. We shall later prove that this
assumption can be made. Thus, we have the logistic equation
where is equal to the rate of plastic discarded per year and where is time in years. By
analyzing the graph, we assume that the carrying capacity (maximum value of plastic discarded)
is approximately thousand tons per year. We shall later show in our sensitivity test that
this assumption produces the highest R2 value and a better regression.
Through algebraic manipulation, we arrive at the conclusion that
And so we can perform a linear regression on the left side using the data obtained from
the EPA. We obtain a linear regression of and an R2 value of 0.989. Plugging
this back into the initial equation, we get
Team #2559, Page 8 of 20
Therefore, so , justifying our assumption at the
beginning that the can be ignored.
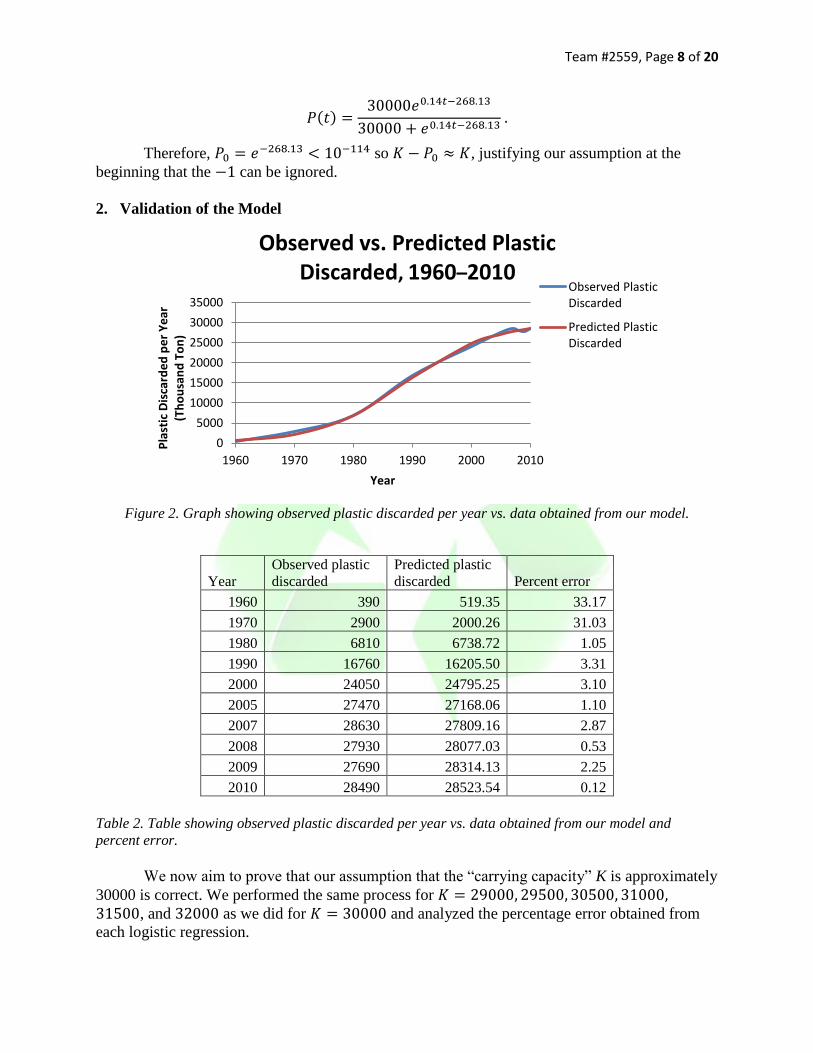
2. Validation of the Model
Figure 2. Graph showing observed plastic discarded per year vs. data obtained from our model.
Year
Observed plastic
discarded
Predicted plastic
discarded Percent error
1960 390 519.35 33.17
1970 2900 2000.26 31.03
1980 6810 6738.72 1.05
1990 16760 16205.50 3.31
2000 24050 24795.25 3.10
2005 27470 27168.06 1.10
2007 28630 27809.16 2.87
2008 27930 28077.03 0.53
2009 27690 28314.13 2.25
2010 28490 28523.54 0.12
Table 2. Table showing observed plastic discarded per year vs. data obtained from our model and
percent error.
We now aim to prove that our assumption that the “carrying capacity” K is approximately
30000 is correct. We performed the same process for , and as we did for and analyzed the percentage error obtained from
each logistic regression.
0
5000
10000
15000
20000
25000
30000
35000
1960 1970 1980 1990 2000 2010
Pla
stic
Dis
card
ed
pe
r Y
ear
(T
ho
usa
nd
To
n)
Year
Observed vs. Predicted Plastic Discarded, 1960–2010
Observed Plastic Discarded
Predicted Plastic Discarded

Team #2559, Page 9 of 20
29000 29500 30000 30500 31000 31500 32000
Year % Error % Error % Error % Error % Error % Error % Error
1960 11.05 22.82 33.17 53.13 62.14 54.43 66.43
1970 30.73 31.68 31.03 24.98 23.77 29.50 26.26
1980 13.94 3.54 1.05 2.13 0.46 8.33 6.71
1990 11.08 1.75 3.31 3.21 5.52 12.02 11.89
2000 8.28 5.08 3.10 3.20 2.33 0.71 0.51
2005 0.42 0.57 1.10 0.57 0.59 1.92 1.40
2007 2.35 2.76 2.87 2.19 1.94 2.73 2.09
2008 0.63 0.45 0.53 1.31 1.69 1.10 1.84
2009 1.96 2.00 2.25 3.13 3.64 3.25 4.07
2010 0.51 0.28 0.12 1.04 1.65 1.47 2.34
Table 3. Table of percentage errors using different K values in the model.
Looking at the table, we see that our initial assumption of having a K value of 30000
proves to produce the least percentage errors.
3. Results of the Model
In order to determine the total amount of plastic in landfills, we take the integral of our
function . Plastic was invented in the late 1800s, although it did not get popularized until the
invention of cellophane and polyvinyl chloride (PVC) in the early 1900s (Masterson). Thus, we
assume that in 1920, there was no plastic in landfills. The lower limit of integration becomes
1920. To find the amount of plastic in a landfill in 2023, we set that to be our upper limit of
integration, and integrating gives
According to our model, in the year 2023, there will be a total of 1,026,000 thousand tons
or 1.026 billion tons of plastic in landfills.
Sensitivity Analysis
We examined the sensitivity of our logistic model of the rate of plastic discarded into
landfills. Our main assumption was the K constant and so we analyzed how changing our K
values would affect our final result. We use the same K values to test as we did to determine if
our assumed 30000 was correct: in intervals of 500. We obtain the data
shown in Table 4.

Team #2559, Page 10 of 20
K 2023 plastic mass
29000 1061235
29500 1034413
30000 1026293
30500 1033231
31000 1031435
31500 1007263
32000 1015850
Table 4. Table showing how predicted 2023 plastic mass in landfill varies with the K value.
The highest predicted landfill mass was approximately 1,061,000 and the lowest
approximately 1,007,000 and are a respective
and
difference from our obtained 1,026,000 thousand tons of
plastics. This very small difference (<5%) indicates that our model is not very sensitive to
changes in our initial parameter (K value). A small error would not significantly change the
output of our model.
Part II: Assigning Recycling Methods on a Local Scale
The recycling method that a city employs is dependent on population, number of households,
area of the city, and consumption of recyclable materials. Locations for dropping off pre-sorted
recyclables are free of charge and available in all cities (“Recycling Center”). We chose to focus
on and analyze only two methods of recycling—drop-off and single-stream curbside pickup—
because they are the two main methods of recycling (Jenkins).
Assumptions:
1. Geographic location has a negligible impact on recycling rate for each method of recycling
(drop-off and single-stream curbside pickup). This is reasonable because society is
interconnected, and thus products consumed and wastes emitted in each United States city
are relatively similar.
2. Every city will have at least one recycling facility that can serve as a drop-off center. This
can be assumed because a recycling center is necessary for the implementation of a recycling
program. Thus we are only considering operating costs associated with each recycling
method in determining which method is best for each city.
3. The use by city residents of drop-off and curbside pickup is mutually exclusive. This is
because with curbside pickup available, the participation in drop-off is negligible.
4. We will assume that all people who recycle will recycle all recyclables in the correct manner.
This assumption is necessary to make the model as simple as needed.
5. We will assume that every household has recyclable wastes so that our model can be
dependent upon the number of households in a city.
6. The average recycling truck can hold between 15 and 28 household recycling bin sizes worth
of trash before returning to the recycling facility (“Recycling 101 Series”). For the sake of

Team #2559, Page 11 of 20
simplicity, we will assume that any given run of a recycling truck will take the average of
these two values, or 22 recycling bins worth of recyclable material.
7. We will assume that all recycling trucks will work every weekday, each day taking care of a
different portion of the city. Recycling is typically taken out on a weekly basis, and this is
how recycling companies currently work.
8. According to the U.S. National Solid Wastes Management Association, recycled material is
on average sold at $30/ton (Murphy). We will assume that every ton of recycled material can
be sold at this price, which is reasonable because it is the national average. Although there
may be factors that prevent recycled material being sold at $30/ton, such as regional price
discrepancies, they are out of the scope of this model.
9. We will assume that the average recycling truck driver drives for five hours per day (Bureau).
10. We will assume that 2/3 of people participate in curbside pickup (Jenkins).
11. We will assume that the price of diesel fuel remains constant throughout this model. Because
fuel prices are very volatile and do not demonstrate any predictable pattern, they are out of
the scope of this model. We will use the national average value of diesel fuel on February 25,
2013, which was $4.16 / gallon (“Petroleum”).
12. Upon observing videos of truck drivers en route, we determined an average value of 15
seconds from the time a truck stops, picks up the recycling bin, empties it, and arrives at the
next house (tylertrashtruck). This value is justifiably low because most houses tend to exist
close to each other, in neighborhoods. Other isolated houses would optimally be grouped so
that they are along existing recycling routes.
13. We will assume recycling trucks average 30 miles per hour on their route to and from the
recycling center. This is a reasonable value, as it is the standard speed limit for
neighborhoods. Additionally, although the truck will be going faster on major roads, stop
lights and other periods of idling will detract from the truck’s average speed.
14. Finally, we will assume that population is spread uniformly about the city. Although this is
generally not true, it is too complicated to consider other distributions of population.
Additionally, although houses will not be uniformly distributed, it is likely that
neighborhoods will be approximately uniformly distributed.
Drop-Off Only Drop-off recycling involves providing locations for citizens to self-haul pre-sorted
recyclables to disposal sites (“Waste”).
To model drop-off, we calculate the probability that a person a distance d away from a
recycling facility will go to the facility and recycle. If then we will have the probability
, and when , . These are very plausible assumptions because if you are
at a recycling facility, you will recycle. And if you are an infinite distance away, you will not
recycle. We assume the probability function is of the form
With , this satisfies our conditions at and . We choose because
it will ease the calculations in the double integral that we will later do. We must now find what

Team #2559, Page 12 of 20
this value is, which can be thought of as a constant dictating the willingness of a person to
recycle. By looking at our function, a larger k value means a higher probability to recycle.
In order to calculate this k value, we look at the effectiveness of a drop-off program. One
which provides ample data is the Central Virginia Waste Management Authority. Their drop-off
program from July 1, 2011, to June 30, 2012, collected 6049 tons of recycled materials
(CVWMA). By looking at counties covered and adding their populations and areas, we arrive at
the conclusion that the Central Virginia area encompasses 1,258,251 people and an area of 2532
. Also, we have that a normal person produces 1.46 pounds of recyclables a day and so 533
pounds a year (EPA). We assume that this Central Virginia area can be approximated by a circle
for simplicity, and by knowing its area, we know its radius is . Then we use the fact
that total amount of materials recycled in a year is: Total Population Probability to
recycle Pounds recycled per year, and so our double integral is
Solving for , we get So our probability function is
If we want to find the total amount of tonnage recycled from a drop-off program for a
circular region with radius and population density , we take the double integral
Sensitivity Test:
We test to see how changing will affect how accurate our model will be. We do this by
varying and keeping constant for the case and see how the predicted tonnage varies.
We use the constant from and compare predicted tonnage as opposed to seeing how the
values change, because it becomes impossible to calculate the value for values of other
than integers. Our results are shown in Table 5.

Team #2559, Page 13 of 20
n Tonnage % Error
3.5 6636.4 8.11
3.6 6525.0 6.30
3.7 6419.8 4.59
3.8 6320.5 2.97
3.9 6226.8 1.44
4.0 6138.3 0.00
4.1 6054.7 1.36
4.2 5975.8 2.65
4.3 5901.0 3.87
4.4 5830.5 5.01
4.5 5763.8 6.10
Table 5. Table showing how expected tonnage varies as n varies. It includes the percent error from our
assumed n = 4 in our model.
We see that varying n by at most 0.5, which is 12.5%, causes the percentage error to be
8.11% at maximum. The fact that such a large percentage change in n causes a smaller
percentage change in the expected tonnage means that our model is stable to changes in initial
parameters.
Single-Stream Curbside Pickup and Additional Garbage Fee Single-stream curbside pickup in addition to a garbage container fee promotes a reduction
in the number of garbage containers households put out. This recycling method of unit pricing
provides an incentive to reduce waste quantities, but does not necessarily increase proper
recycling practice. In fact, an additional garbage fee per container creates artificial value in
recycling and may result in people attempting to recycle non-recyclable waste (Jenkins). This is
problematic as it leads to greater probabilities for contamination in recycle facilities, which
decreases efficiency and increases costs to remedy the situation. Therefore we do not recommend
cities implement this method and have decided to not include a model for single-stream curbside
pickup with additional garbage fee in our report.
Single-Stream Curbside Pickup
Free single-stream curbside pickup provides incentive for households to recycle by
making recycling more convenient and less time consuming (Jenkins).
Calculation of Required Infrastructure
First, we will attempt to calculate the number of trucks and facilities necessary to institute
a curbside pickup program in a given city. Our strategy for this will be as follows: assume that a
given facility will provide service to all households within miles. Thus, the service area is a
circle with radius , and the facility lies at the center.
We can then find the total number of households that a facility must service by finding
the area the facility must service, and combining that area with the population density and

Team #2559, Page 14 of 20
average people per household. There must also be a factor to account for percent participation of
households in curbside pickup.
where is the number of households that a recycling facility must service, is the percent of
total households that would participate in curbside recycling (
by assumption), is the
population density, is the maximal distance that a facility will service, and is the average
number of people per household. This can be derived with dimensional analysis and the equation
for the area of a circle.
Next, let us analyze how many households an individual recycling truck is able to serve.
By our assumptions, we know a given truck will take care of 22 households every “run”
it makes from the recycling center and back. Because the houses are uniformly distributed, it is
possible to calculate an equivalent, simpler situation. Consider the following double integral:
This tells us that the average distance from the center of a circle to any point in the circle
is
. Thus, the average “round-trip” from the center of the circle to a house on the circle and
back is
. Because of our assumption that it only takes 15 seconds to go from house to house on
the recycling route, we can then say that this distance is negligible.
Next, we will calculate the time it takes for a single “run” of a recycling truck, from
leaving the recycling center to returning. This is doable with purely dimensional analysis and
simple Newtonian mechanics.
Next, we find the maximum number of households a truck can service per week.
where is the number of households a truck can service per week, given . Now we can
finally find the two quantities we have been aiming for: the required number of facilities and the
required number of trucks for each of these facilities. These quantities are fairly self-explanatory.
This is because every facility must service households, and every truck can service
a maximum of households.

Team #2559, Page 15 of 20
where is the total number of households in the city. This equation again comes from unit
analysis: if we take the total number of participating households, it must be less than the product
of the number of facilities times the number of trucks per facility times the number of households
per truck.
Calculation of Expenses for Both Models Fargo is the largest city in North Dakota, consisting of 48.8 square miles with a
population of about 107,349 (“Best”) and a population density of 2162 persons/ (“Fargo”).
There are 46791 residential households within the city, averaging 2.15 persons per household
(“Fargo”).
The city of Price has a population of 8682 living in 3045 households, with an average of
2.6 persons per household. It has an area of 4.20 square miles, and a population density of 1980
persons/ (“Price”).
Wichita, KS, is 163.6 square miles and has a population of 384,445. Its population
density is 2305 persons/ . The number of households is 139,027, with an average of 2.44
persons per household (“Wichita”).
Drop-off Only Cost
By analyzing a table of operating and maintenance costs for various recycling facilities in
1990, calculating the average, and adjusting for inflation, we found that the typical facility
spends $258,750 (“Waste”). This yields the simple equation
This yields the results shown in Table 6.
City Cost per year
Wichita, KS $5,950,000
Fargo, ND $2,070,000
Price, UT $259,000
Table 6. Table displays the cost (in dollars) per year of running a drop-off only recycling system.
Drop-off Only Revenue
From our assumption of the selling of recyclable material at $30/ton and the results in
tonnage of our model for drop-off, the revenue can be calculated as
This yields the results shown in Table 7.
City Revenue per year
Wichita, KS $1,330,000
Fargo, ND $434,000
Price, UT $49,700
Table 7. Table displays the revenue (in dollars) generated per year by running a drop-off only recycling
system.
Team #2559, Page 16 of 20
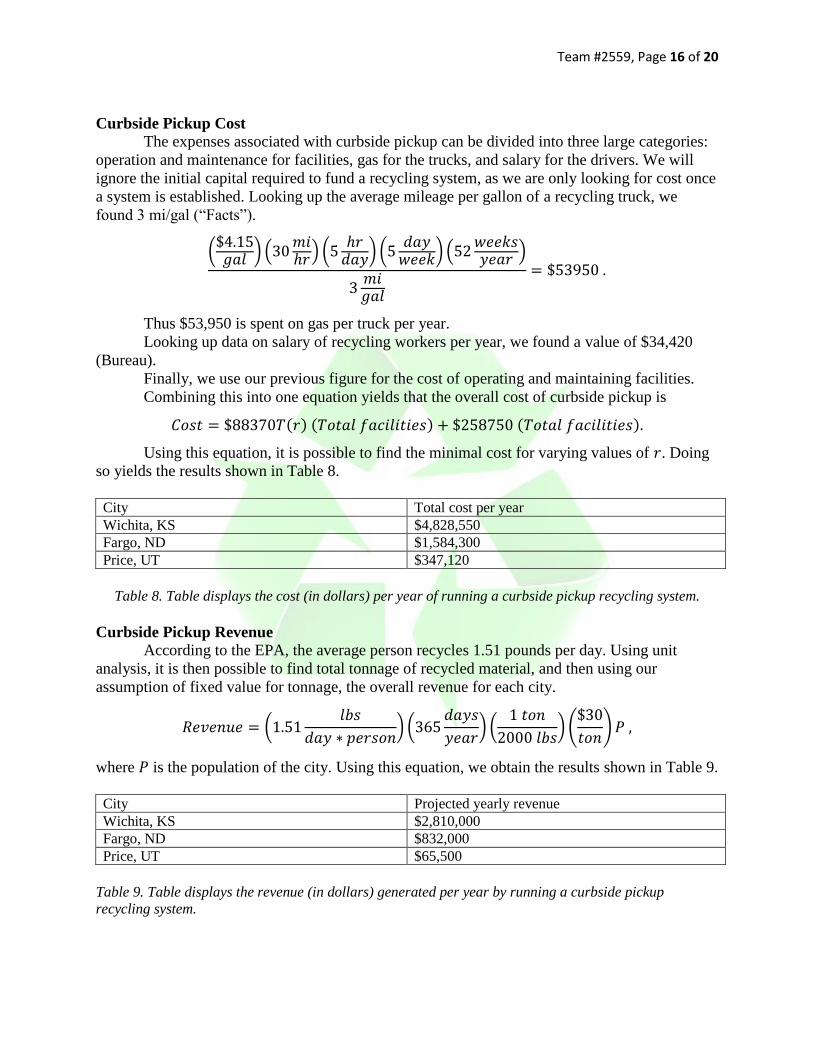
Curbside Pickup Cost
The expenses associated with curbside pickup can be divided into three large categories:
operation and maintenance for facilities, gas for the trucks, and salary for the drivers. We will
ignore the initial capital required to fund a recycling system, as we are only looking for cost once
a system is established. Looking up the average mileage per gallon of a recycling truck, we
found 3 mi/gal (“Facts”).
Thus $53,950 is spent on gas per truck per year.
Looking up data on salary of recycling workers per year, we found a value of $34,420
(Bureau).
Finally, we use our previous figure for the cost of operating and maintaining facilities.
Combining this into one equation yields that the overall cost of curbside pickup is
Using this equation, it is possible to find the minimal cost for varying values of . Doing
so yields the results shown in Table 8.
City Total cost per year
Wichita, KS $4,828,550
Fargo, ND $1,584,300
Price, UT $347,120
Table 8. Table displays the cost (in dollars) per year of running a curbside pickup recycling system.
Curbside Pickup Revenue
According to the EPA, the average person recycles 1.51 pounds per day. Using unit
analysis, it is then possible to find total tonnage of recycled material, and then using our
assumption of fixed value for tonnage, the overall revenue for each city.
where is the population of the city. Using this equation, we obtain the results shown in Table 9.
City Projected yearly revenue
Wichita, KS $2,810,000
Fargo, ND $832,000
Price, UT $65,500
Table 9. Table displays the revenue (in dollars) generated per year by running a curbside pickup
recycling system.

Team #2559, Page 17 of 20
Analysis of the Model
Lastly, we will analyze the two options to determine which is a better fit for each city. By
calculating net cost per tonnage,
we obtain the results shown in Table 10.
City Curbside pickup cost per tonnage
($/ton)
Drop-off only cost per tonnage
($/ton)
Wichita, KS $55.37 $104.11
Fargo, ND $70.17 $112.98
Price, UT $129.10 $126.13
Table 10. Table displays the cost (in dollars) per tonnage of recycling for both curbside pickup and drop-
off only recycling systems.
Because we want to minimize the cost required per ton of material recycled, we are
looking for the minimum cost per tonnage. We can then conclude that it is best for Wichita and
Fargo to use a curbside pickup method, whereas Price should use a drop-off only recycling
method. This makes sense! A smaller town would be expected to have a more successful drop-
off only recycling program, because it would only require one large facility and the distance
from any citizen to that facility is relatively small. Therefore, for a small town, costs are lower
than they would be with curbside, while the incentive to recycle is still relatively high.
Part III: National Recycling Policy Recommendation
Recycling is vital to sustaining our environment, and thus it is pertinent that all states and
townships in the United States take part in some method of recycling. However, cities and
townships should be allowed to self-determine their form of recycling based on our model. This
is due to the fact that the variables in our model involved in determining whether drop-off only
or curbside pickup recycling is most appropriate for a certain municipality—population, area,
and household density—are specific to each municipality. Hence, we recommend that the EPA
permits each municipality to implement the most appropriate method of recycling for its city
after applying its city statistics into our model. From our model, we conclude that cities with
relatively small populations and household densities would economically benefit more from
adopting drop-off recycling only (Table 10). Under these population conditions, the cost of
recycling using the drop-off only method will be less than the costs associated with curbside
recycling pickup, as the number of households participating in recycling is not enough to
compensate for the cost of operating curbside pickup. Therefore the city should choose to have
drop-off recycling only. On the other hand, cities with high populations and household densities
would be better off economically if they implemented the curbside pickup method of recycling.
In this case, the cost of curbside pickup is more cost efficient than the cost of drop-off only, due
to a lower net loss (Table 10). With curbside pickup, participation in recycling by household
increases, but the increase is only impactful in cities with higher populations, as the ratio of
households participating to total household units is greater than the corresponding ratio in small
populations (Jenkins).

Team #2559, Page 18 of 20
Although the EPA should allow each municipality to determine their own recycling
method, it should also legislate that all cities and townships recycle by the method best for them
beginning in 2016. This is because recycling is necessary to sustain our environment. The
deadline of 2016 provides time for governments to decide which recycling method is most
appropriate, and also allows time for construction of recycling facilities and implementation of
the recycling method.
Part IV: Strengths and Weaknesses
Strengths of our model in forecasting the amount of plastic waste present in landfills ten years
from now include insensitivity to minor changes, and that our assumption of a carrying capacity
K of 30000 tons has the least percentage error when a linear regression of data obtained from the
EPA is performed alongside our model. Furthermore, the linear regression resulted in a R2 value
of 0.989, which indicates a strong correlation between our model and past data, demonstrating
that extrapolation to ten years from now is appropriate. A possible weakness is that we assumed
the rate of waste discarded is proportional to the rate of waste recycled, which may not
necessarily apply to all households. Strengths of our model in determining the most cost-efficient method of recycling per
city include its consideration of many characteristics of each city, as well as costs associated with
each recycling method. This ensures that the recycling method determining model produces a
result that is accurately specific to each city. Possible weaknesses include that our model uses
average values for operation and maintenance costs of recycling facilities, household size, and
recycling truck procedures. Part V: Conclusion
In this report, we found a mathematical model to predict the amount of plastic waste in the year
2023. By looking at past amounts of waste and performing regression, we determined that a
logistic equation with a carrying capacity of 30000 tons per year was the best fit for the past data
with an R2 value of 0.989. Using this model, we could predict the waste in ten years to be
1,026,000 tons of plastic. This report also created a model to analyze whether a city in the United States should
adopt a drop-off or curbside pickup recycling method. Although it was found that recycling is
unprofitable for cities, the environmental necessity for sustainability has demanded that some
form of the practice be adopted. In addition, utilizing landfills for recyclables involves monetary
costs and is much more detrimental to the health of our environment. Therefore, based on our
models, we determined that it is more economically beneficial for a large township, such as
Wichita, KS, or Fargo, ND, to implement a curbside pickup recycling method, while a small
township, such as Price, UT, ought to use the drop-off method of recycling. Also, these recycling
methods should be determined individually by each township because the decision of which type
of recycling to implement depends upon factors specific to each municipal area, such as
population. We must take action on both a governmental and an individual level, before this
swamp of waste trashes our environment, our lives, and eventually our future.

Team #2559, Page 19 of 20
References
“2010 Census.” United States Census 2010. U.S. Census Bureau, 2010. Web. 02 Mar. 2013.
“Best Places to Live 2011.” CNNMoney. Cable News Network, n.d. Web. 02 Mar. 2013.
<http://money.cnn.com/magazines/moneymag/bplive/2011/snapshots/PL3825700.html>.
Bureau of Labor Statistics. “Occupational Employment Statistics.” United States Department of
Labor. United States Department of Labor, May 2011. Web. 02 Mar. 2013.
“Central Virginia Waste Management Authority (CVWMA).” Cvwma.com. Central Virginia
Waste Management Authority (CVWMA). 30 June 2012. Web. 02 Mar. 2013.
<http://www.cvwma.com/recycling_programs/program_statistics/curbside_and_dropoff.
wbp>.
Container Recycling Institute. “Understanding Economic and Environmental Impacts of Single-
Stream Collection Systems.” Container Recycling Institute. N.p., 2009. Web. 2 Mar.
2013.
Environmental Protection Agency. Municipal Solid Waste. Dec. 2011 Web. 02 Mar. 2013.
<http://www.epa.gov/epawaste/nonhaz/municipal/index.htm>.
“Facts on Greening Garbage Trucks: New Technologies for Cleaner Air.” INFORM. Inform, Inc.,
2009. Web. 02 Mar. 2013.
“Fargo (city) QuickFacts from the US Census Bureau.” Fargo (city) QuickFacts from the US
Census Bureau. N.p., n.d. Web. 02 Mar. 2013.
<http://quickfacts.census.gov/qfd/states/38/3825700.html>.
Gaines, Linda, Anant Vyas, and John L. Anderson. “Estimation of Fuel Use by Idling
Commercial Trucks.” Argonne Transportation Technology Center. Center For
Transportation Research, 22 Jan. 2006. Web. 2 Mar. 2013.
<http://www.transportation.anl.gov/pdfs/TA/373.pdf>.
Jenkins, Robin R. “The Determinants of Household Recycling: A Material Specific Analysis of
Recycling Program Features and Unit Pricing.” Resources for the Future (2000): 1-26.
Web. 2 Mar. 2013.
Masterson, Kathleen. “The History of Plastic: From Billiards to Bibs.” Npr.org. National Public
Radio, 30 Oct. 2009. Web. 2 Mar. 2013.
<http://www.npr.org/templates/story/story.php?storyId=114331762>.
Murphy, Pamela, Christine Mueller, and Mamatha Gowda. The Garbage Primer. New York:
Lyons & Burford, 1993. Print.
Naco.org. National Association of Counties, n.d. Web. 02 Mar. 2013.
<http://www.naco.org/Pages/default.aspx>.
“Plastic Waste: Redesign and Biodegradability.” Science for Environmental Policy 1 (2011): 1-8.
European Commission, June 2011. Web. 2 Mar. 2013.
<http://ec.europa.eu/environment/integration/research/newsalert/pdf/FB1.pdf>.
“Plastics Task Force.” 7 Misconceptions About Plastic and Plastic Recycling. N.p., n.d. Web. 02
Mar. 2013. <http://www.ecologycenter.org/ptf/misconceptions.html>.
Rogers, Heather. "The Brooklyn Rail." A Brief History of Plastic. N.p., n.d. Web. 02 Mar. 2013.
<http://www.brooklynrail.org/2005/05/express/a-brief-history-of-plastic>.
“Price (city) QuickFacts from the US Census Bureau.” Price (city) QuickFacts from the US
Census Bureau. N.p., n.d. Web. 02 Mar. 2013.
<http://quickfacts.census.gov/qfd/states/49/4962030.html>.

Team #2559, Page 20 of 20
“Recycling 101 Series: Commercial Recycling Collection Methods & Equipment.” Ecorewards
Recycling. Resolute Forest Products, n.d. Web. 2 Mar. 2013.
“Recycling Center.” Association of Collegiate Schools of Architecture. N.p., n.d. Web. 02 Mar.
2013. <http://acsa-arch.org/programs-events/competitions/competition-archives/2007-08-
competitions/concrete/category-i-recycling-center>.
Recycling Symbol. Digital image. Earth911.com. Earth 911, n.d. Web. 2 Mar. 2013.
<http://earth911.com/wp-content/uploads/2012/08/Recycling-Symbol.jpg>.
“Residential Garbage Collection.” City of Chicago. N.p., n.d. Web. 02 Mar. 2013.
<http://www.cityofchicago.org/city/en/depts/streets/provdrs/san/svcs/residential_garbage
collection.html>.
Themelis, N.J., M.J. Castaldi, J. Bhatti, and L. Arsova. “Energy and Economic Value of Non-
Recycled Plastics and Municipal Solid Wastes That Are Currently Land-Filled in the
Fifty States.” Columbia University Earth Engineering Center. Columbia University, Aug.
2011. Web. 02 Mar. 2013.
<http://www.seas.columbia.edu/earth/wtert/sofos/ACC_Final_Report_August23_2011.pd f>.
tylertrashtruck. “Phoenix Feb 24 09.” Online video clip. YouTube. YouTube, 26 Feb. 2009. Web.
02 Mar. 2013. <http://www.youtube.com/watch?v=4kiG_q_JHFU>.
“U.S. Energy Information Administration - EIA - Independent Statistics and Analysis.” Gasoline
and Diesel Fuel Update. N.p., n.d. Web. 02 Mar. 2013.
<http://www.eia.gov/petroleum/gasdiesel/>.
U.S. National Park Service: Mote Marine Lab. Time It Takes for Garbage to Decompose in the
Environment. 02 Mar. 2013.
<http://des.nh.gov/organization/divisions/water/wmb/coastal/trash/documents/marine_de
bris.pdf>.
“Waste Prevention, Recycling, and Composting Options: Lessons from 30 US Communities.”
EPA. Environmental Protection Agency, n.d. Web. 02 Mar. 2013.
<http://www.epa.gov/osw/conserve/downloads/recy-com/index.htm>.
“Wichita (city) QuickFacts from the US Census Bureau.” Wichita (city) QuickFacts from the US
Census Bureau. N.p., n.d. Web. 02 Mar. 2013.
<http://quickfacts.census.gov/qfd/states/20/2079000.html>.
“Your Neighborhood - City of Fargo.” Your Neighborhood - City of Fargo. N.p., n.d. Web. 02
Mar. 2013. <http://www.cityoffargo.com/Residential/YourNeighborhood/>.