teaching with visual symbols( eser jose, jessica)
TRANSCRIPT
DRAWINGS
CARTOONS
STRIPS DRAWINGS
DIAGRAMS
CHARTS
GRAPHS
MAPS
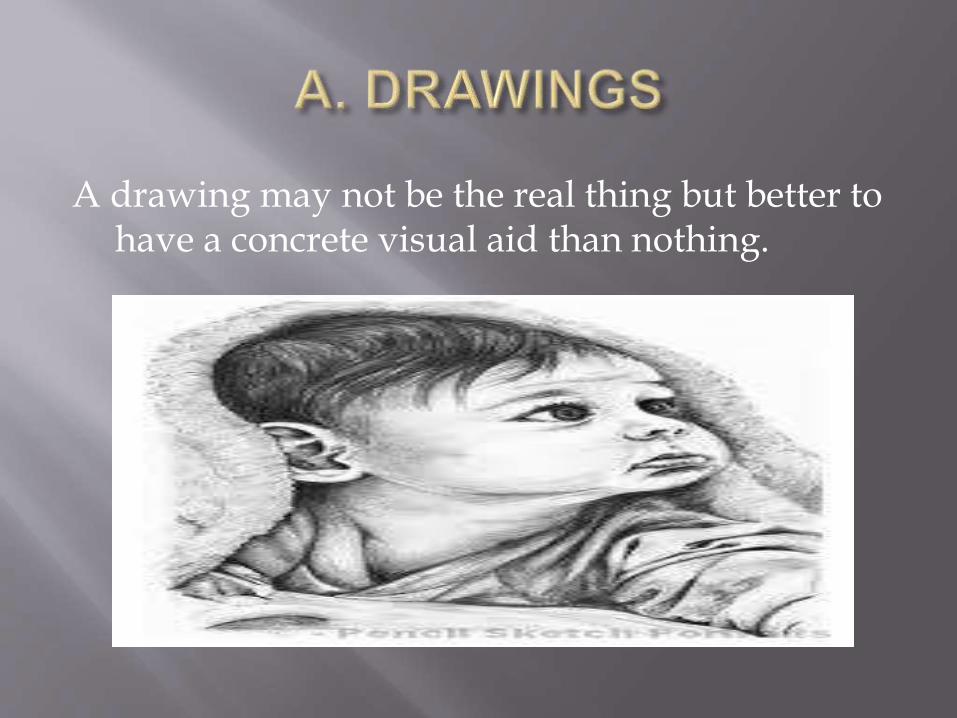
A drawing may not be the real thing but better to have a concrete visual aid than nothing.
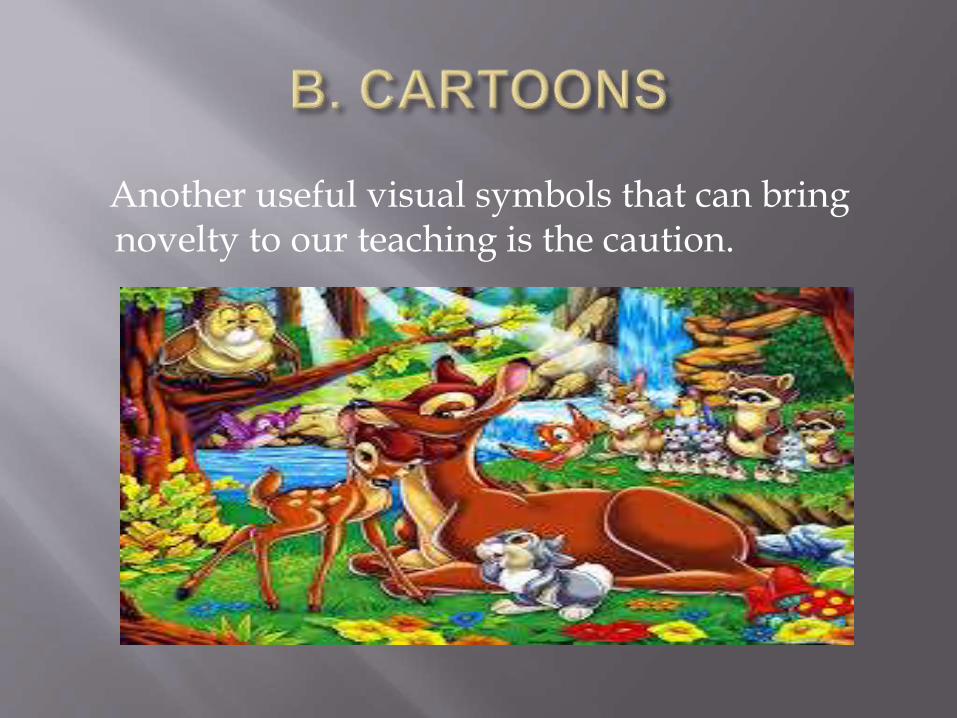
Another useful visual symbols that can bring novelty to our teaching is the caution.
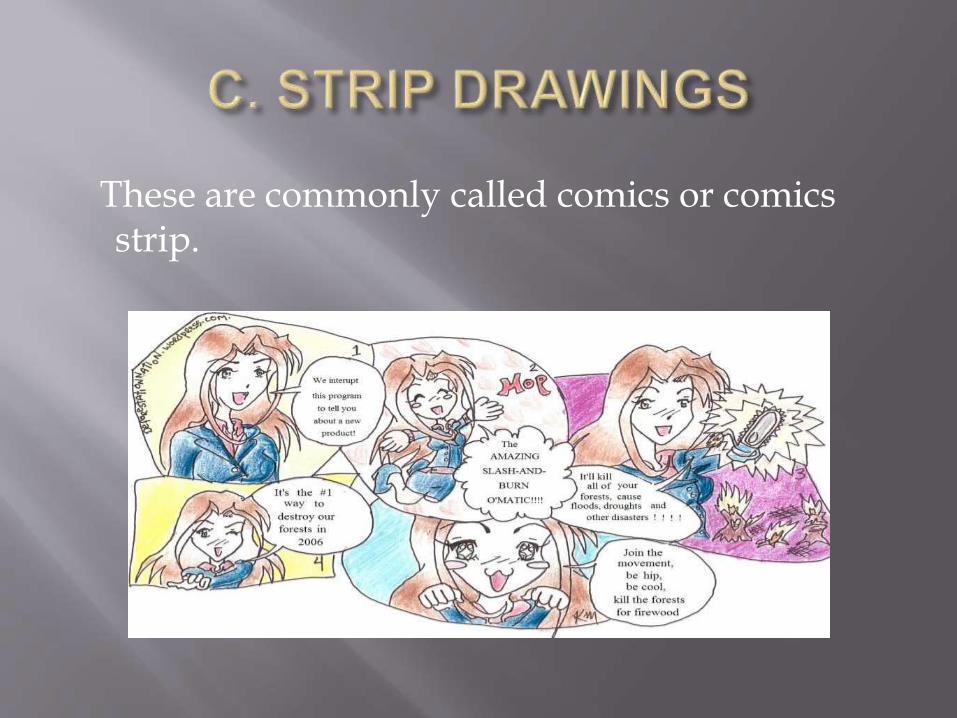
These are commonly called comics or comics strip.
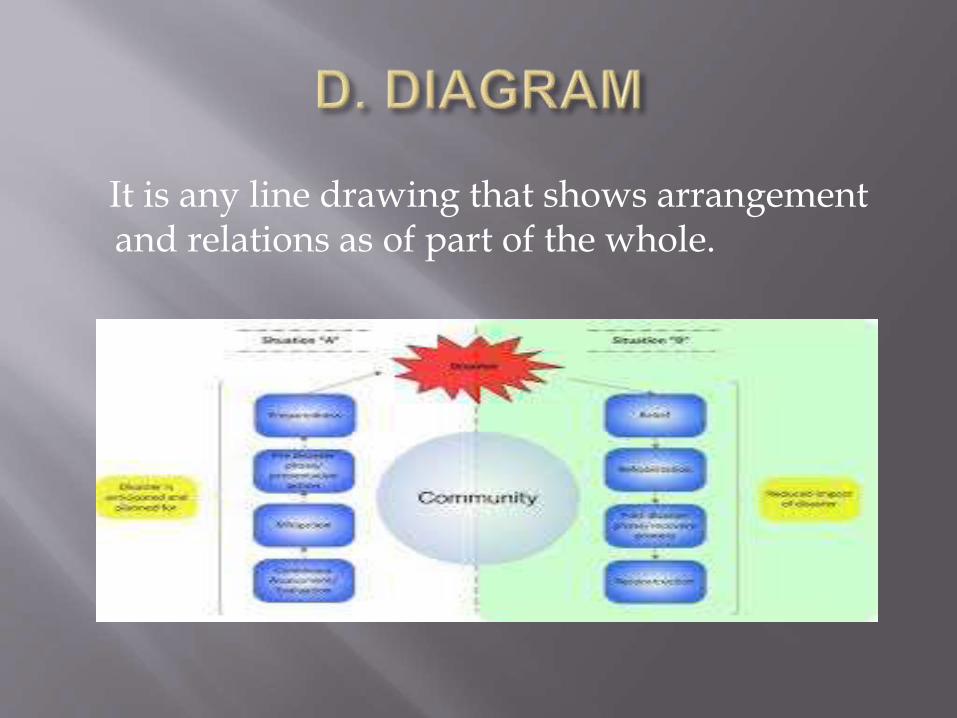
It is any line drawing that shows arrangement and relations as of part of the whole.
Affinity diagram
Tree diagram
Fishbone diagram
Use to cluster complex apparently unrelated data.
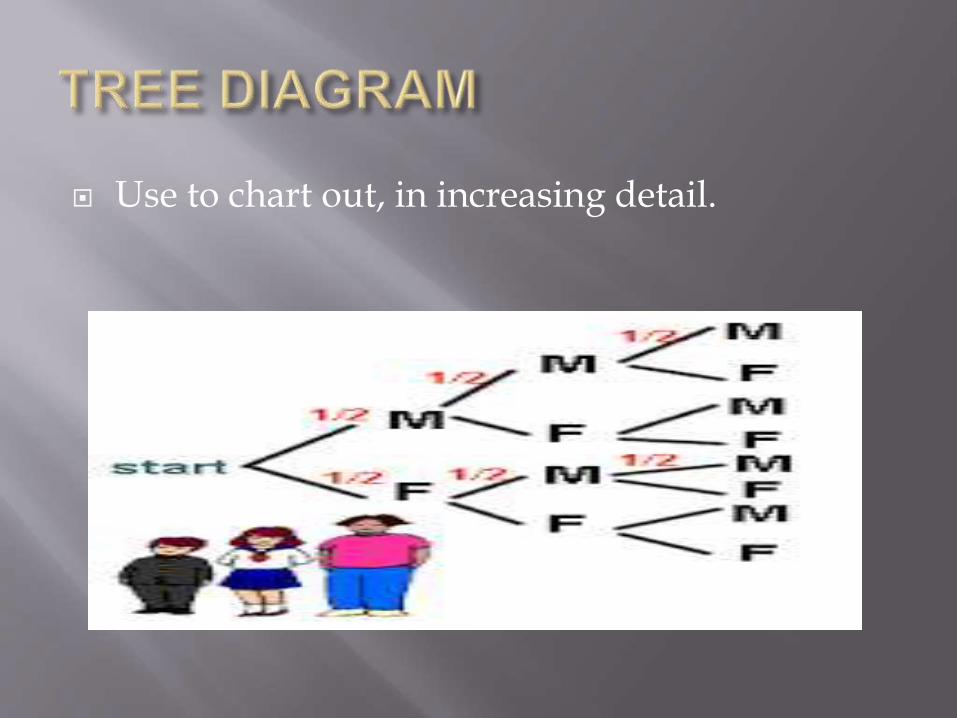
Use to chart out, in increasing detail.
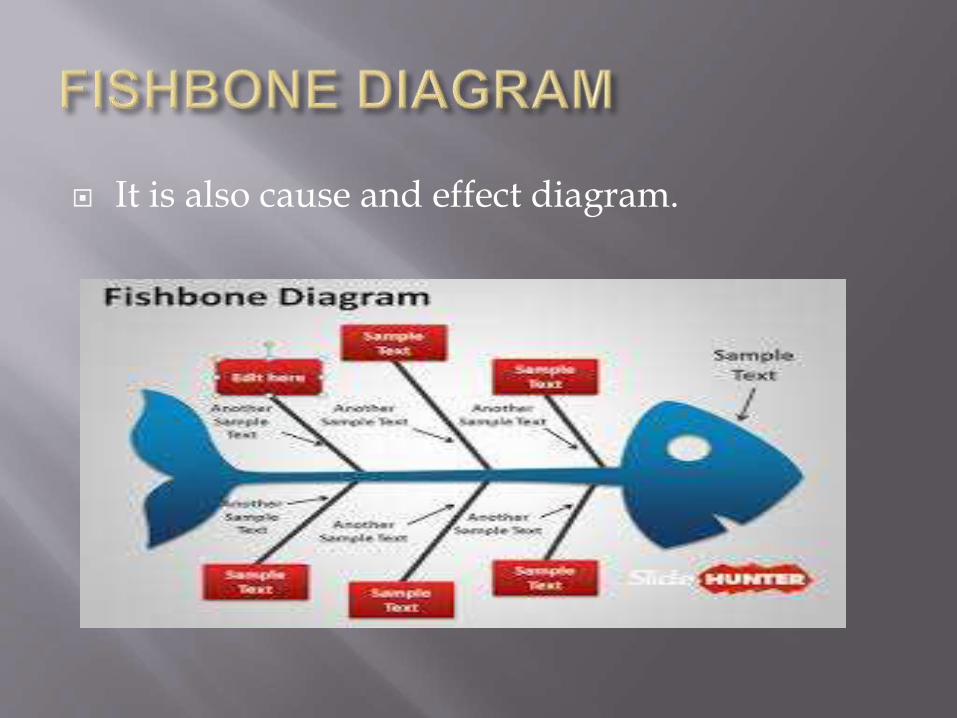
It is also cause and effect diagram.
A chart is a diagrammatic representation of relationship among individual within an organization.
Time chart
Flow chart
Organizational chart
Comparison and contrast chart
Pareto chart
Gannt chart
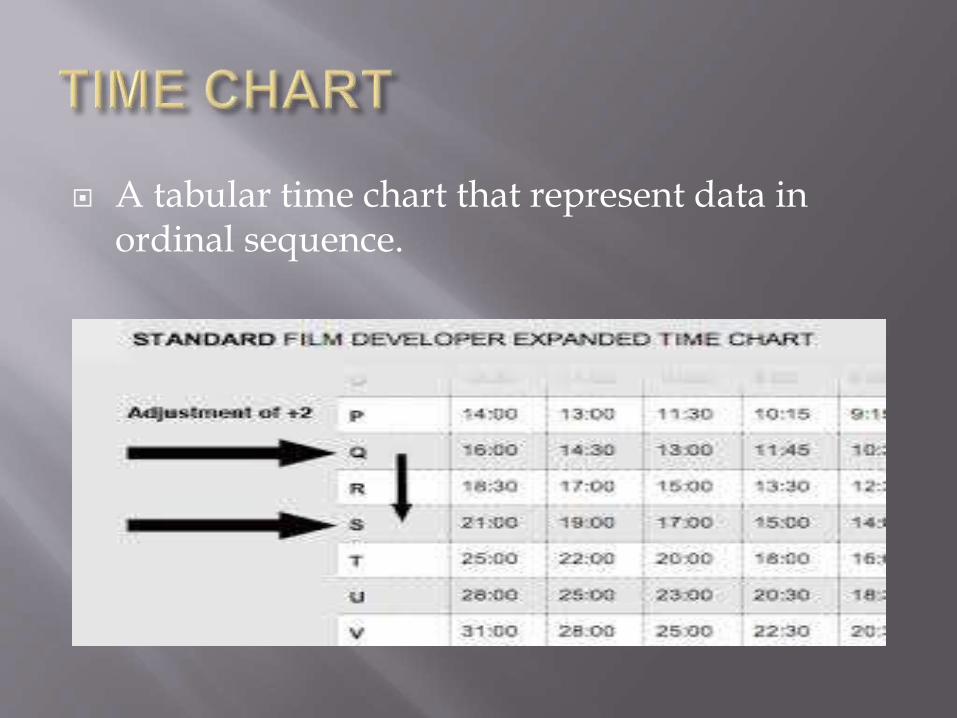
A tabular time chart that represent data in ordinal sequence.
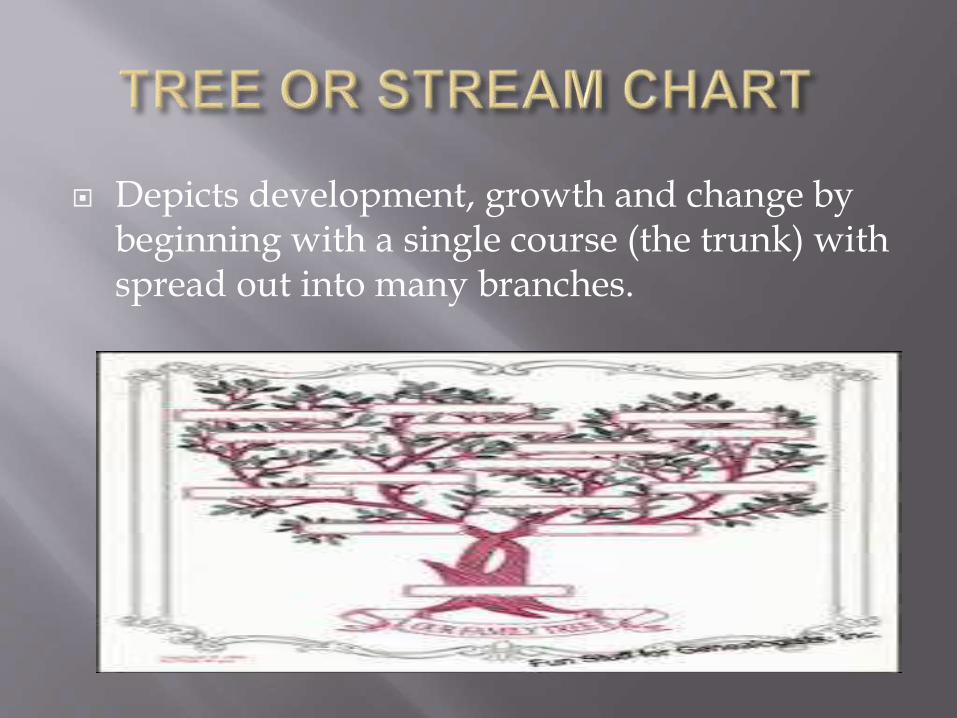
Depicts development, growth and change by beginning with a single course (the trunk) with spread out into many branches.
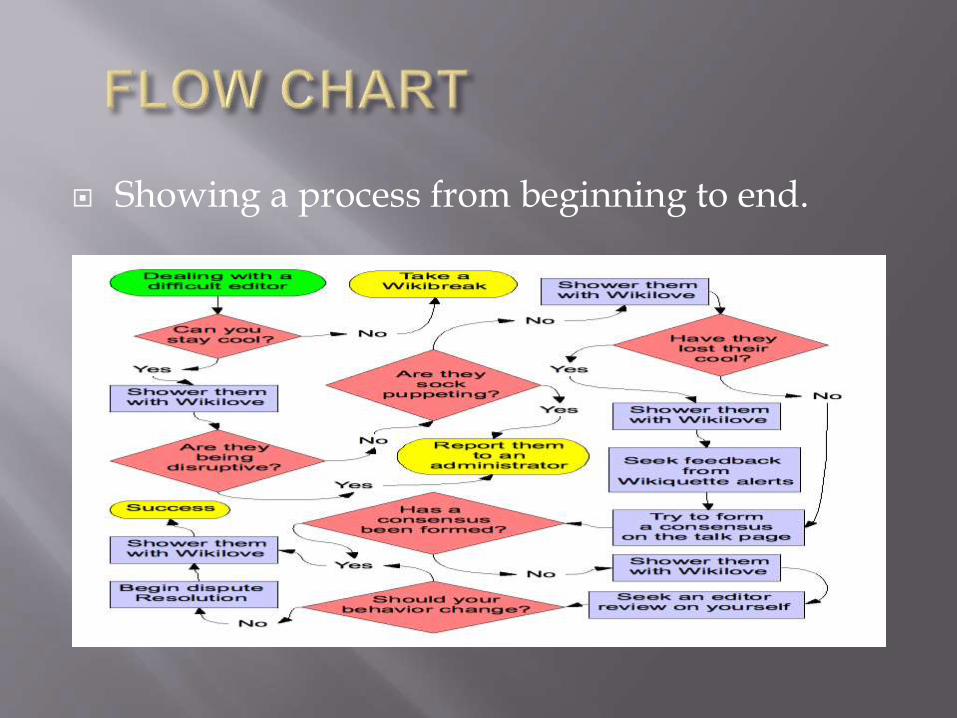
Showing a process from beginning to end.
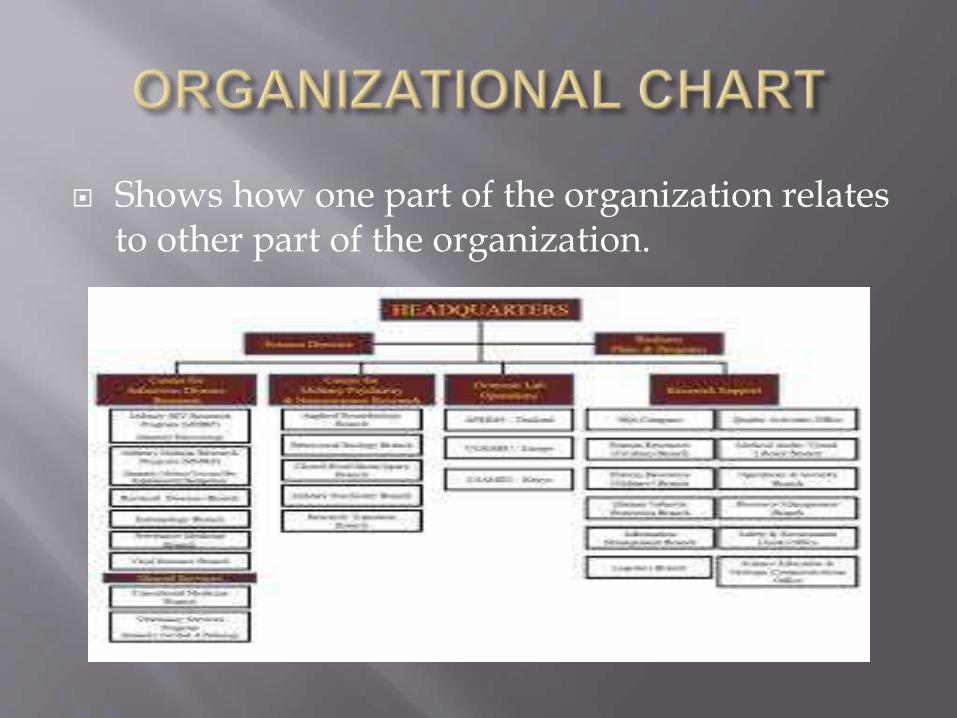
Shows how one part of the organization relates to other part of the organization.
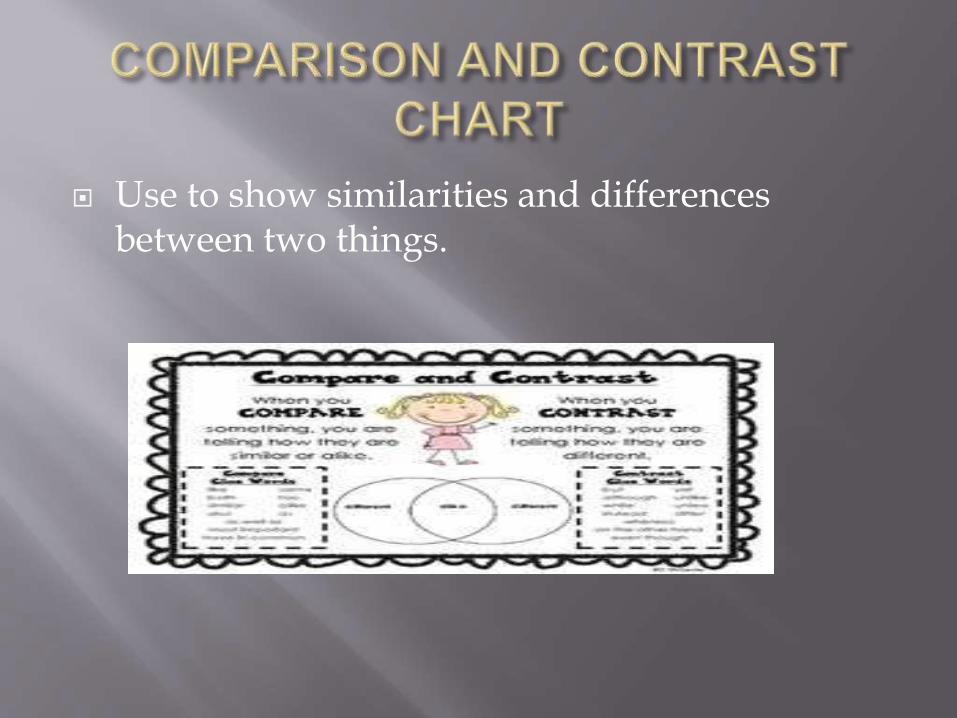
Use to show similarities and differences between two things.
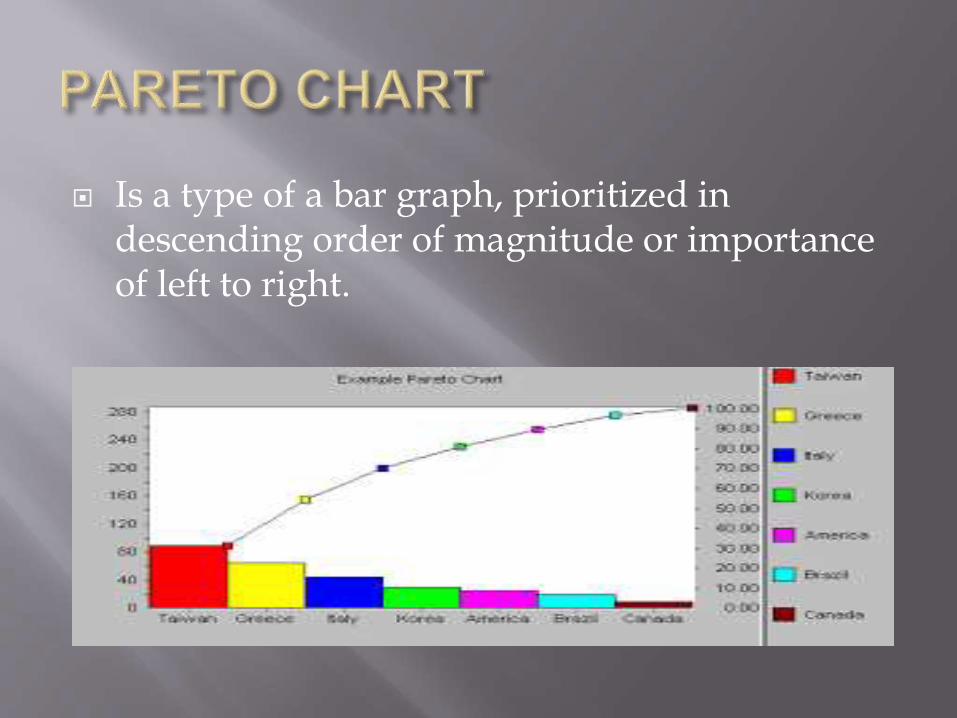
Is a type of a bar graph, prioritized in descending order of magnitude or importance of left to right.
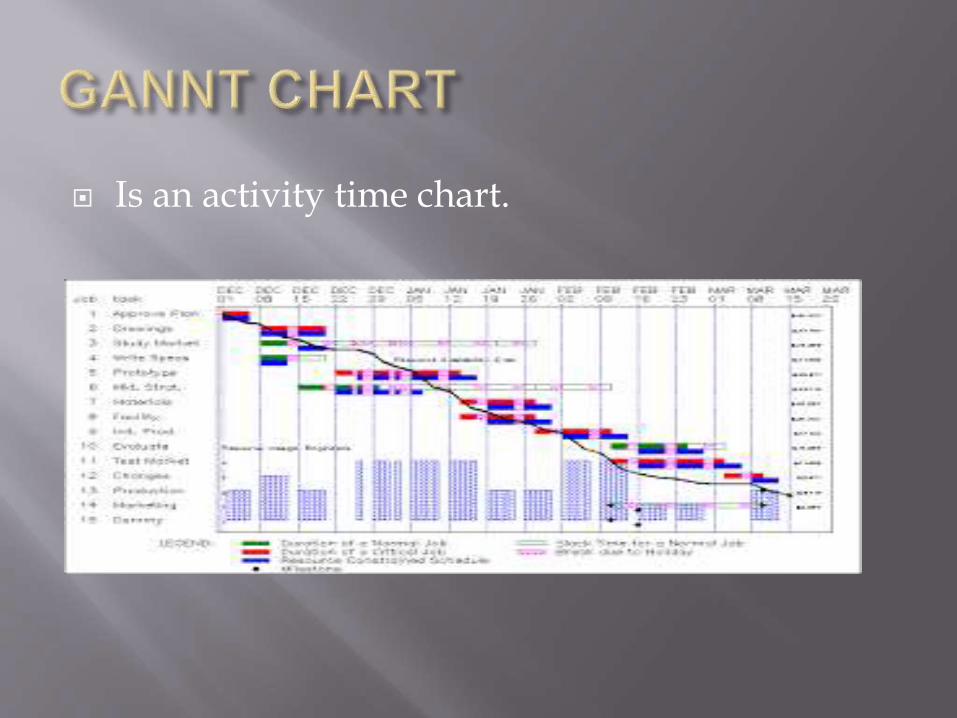
Is an activity time chart.
There are several types of graph,
They are:
Circle pie graph
Bar graph
Pictorial graph
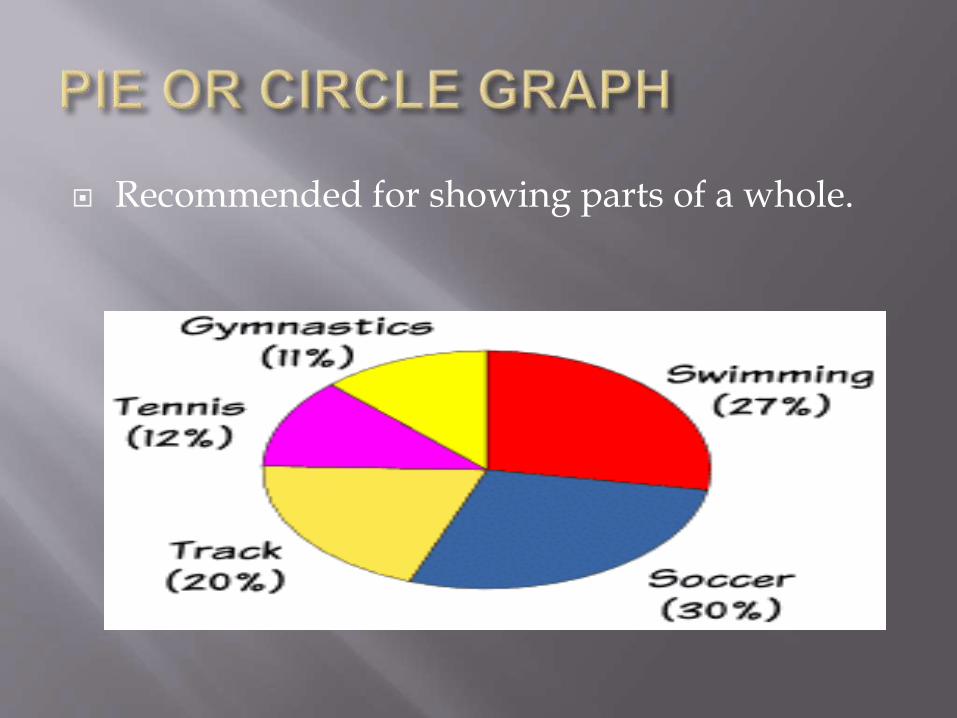
Recommended for showing parts of a whole.
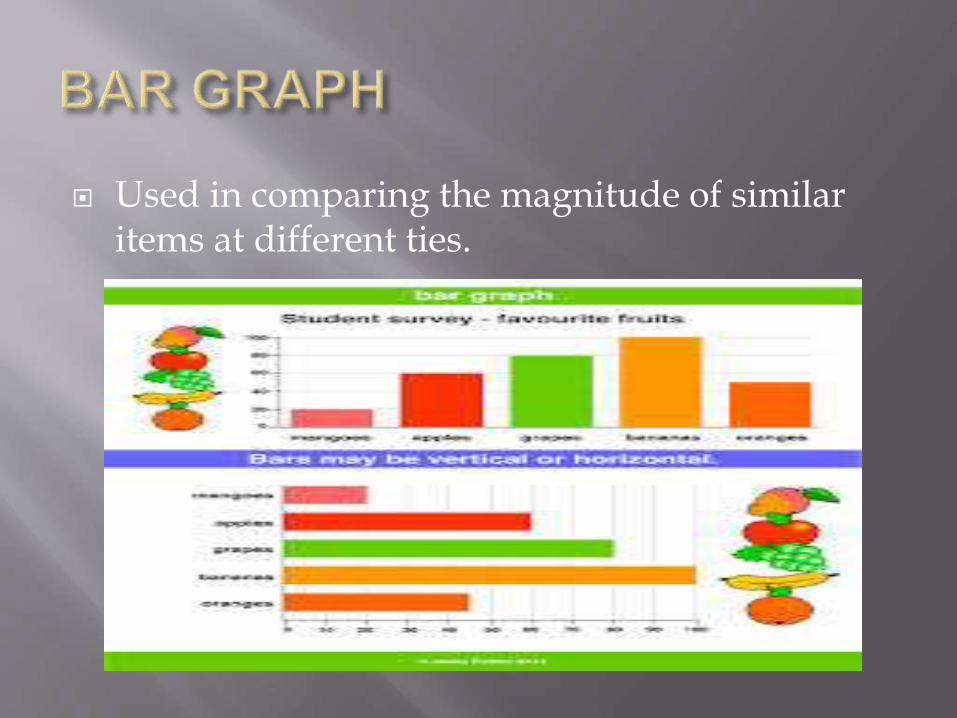
Used in comparing the magnitude of similar items at different ties.
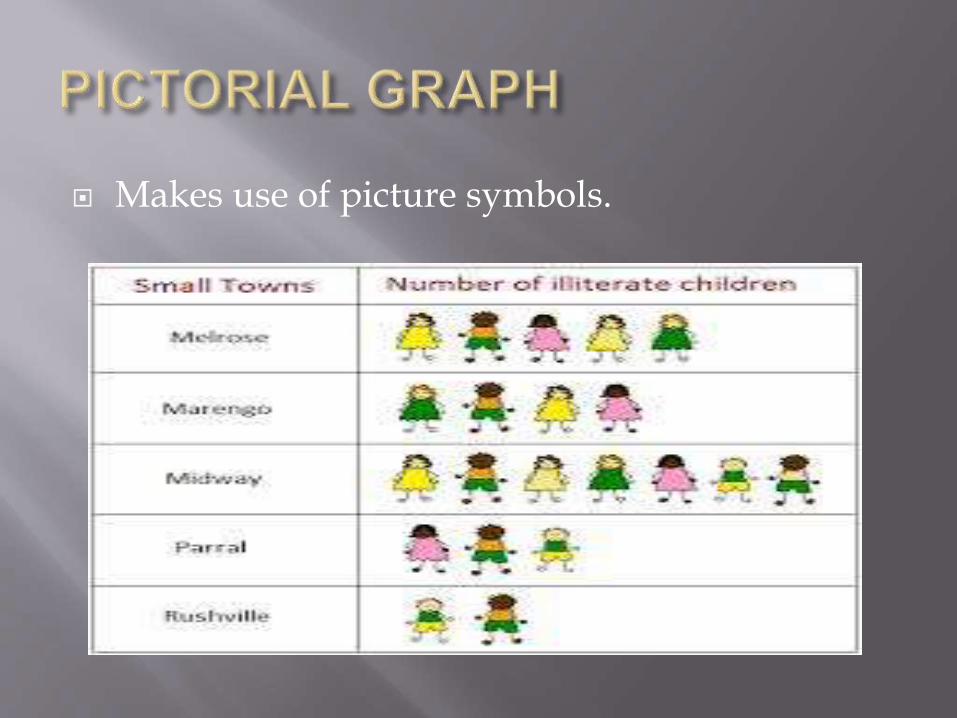
Makes use of picture symbols.
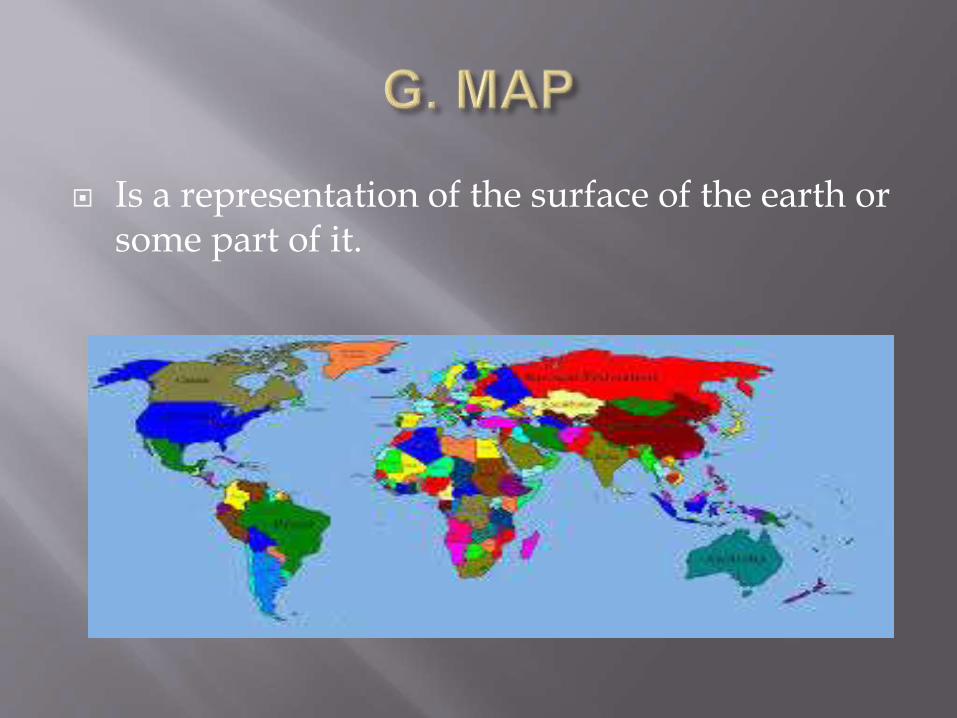
Is a representation of the surface of the earth or some part of it.
Physical map
Relief map
Commercial or economic map
Political map.

Prepared by: ESER JOSE, JESSICA F.
2BEED-2A