teaching notes for chapter 2 -...
TRANSCRIPT
Full file at http://testbankwizard.eu/Solution-Manual-for-Fundamental-Managerial-Accounting-Concepts-7th-Edition-by-Edmonds
Teaching Notes for Chapter 2
To help students understand the complexities of cost behavior we suggest a divide and conquer strategy: isolate the points of confusion and address them one at a time. Students find three particular concepts confusing.
The first point of confusion is that cost behavior patterns for total costs differ from cost behavior patterns for unit costs. Although the terms fixed and variable accurately describe total cost behavior patterns, they are inconsistent with per unit cost behavior patterns. For example, the total rental fee for store space may remain constant (fixed) regardless of how many items are sold during an accounting period. The term fixed cost is logically consistent with the total cost behavior pattern. However, the per unit behavior pattern of the rental cost changes: it decreases as volume increases and increases as volume decreases. The same semantic contradiction exists with respect to variable cost. In other words, variable cost expressed on a per unit basis remains constant when the volume of activity changes.
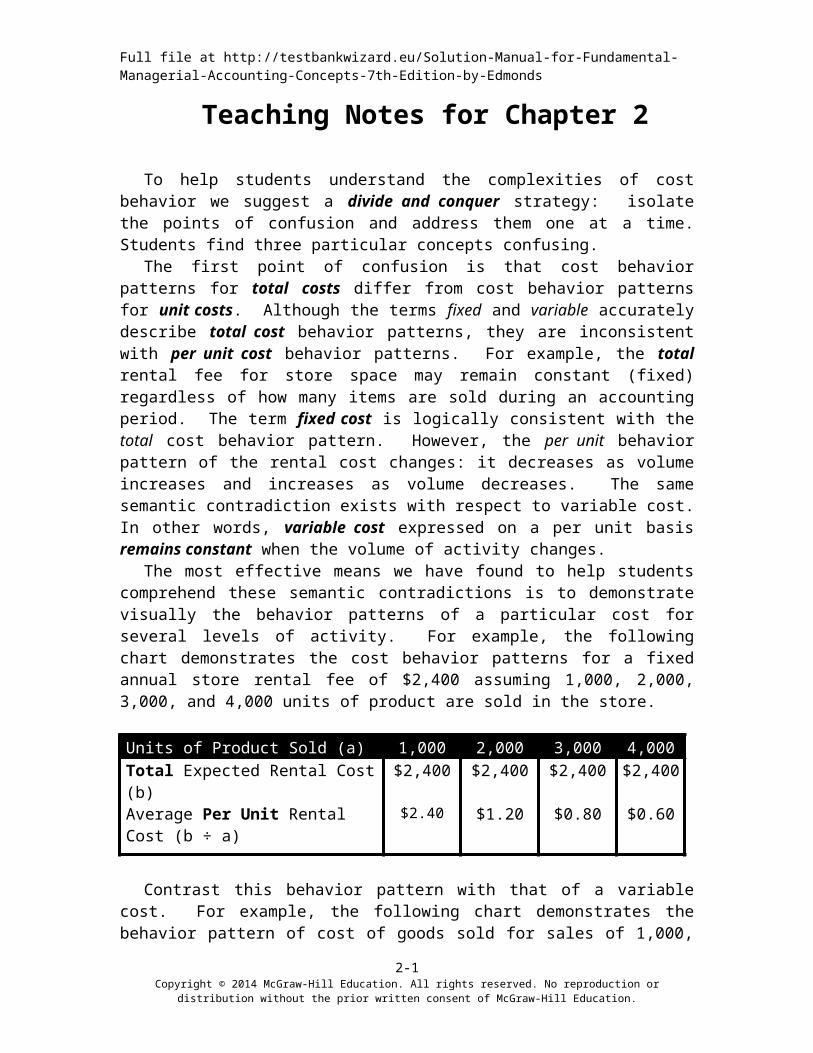
The most effective means we have found to help students comprehend these semantic contradictions is to demonstrate visually the behavior patterns of a particular cost for several levels of activity. For example, the following chart demonstrates the cost behavior patterns for a fixed annual store rental fee of $2,400 assuming 1,000, 2,000, 3,000, and 4,000 units of product are sold in the store.
Units of Product Sold (a) 1,000 2,000 3,000 4,000Total Expected Rental Cost (b) $2,400 $2,400 $2,400 $2,400Average Per Unit Rental Cost (b ÷ a) $2.40 $1.20 $0.80 $0.60
Contrast this behavior pattern with that of a variable cost. For example, the following chart demonstrates the behavior pattern of cost of goods sold for sales of 1,000, 2,000, 3,000, and 4,000 units, assuming a cost of $9 per unit.
Units of Product Sold (a) 1,000 2,000 3,000 4,000Cost Per Unit (b) $9 $9 $9 $9Total Cost of Goods Sold (a x b) $9,000 $18,000 $27,000 $36,000
A second point of confusion involves the context-sensitive nature of the terminology. A particular cost may be fixed in one context and variable in a different context. For example, the managerial salary cost for a store is fixed relative to the number of customers visiting the store, but managerial salary cost is variable relative to the number of stores a company operates. Students must develop the conditional assessment skills to identify the appropriate cost classification based on the circumstances. They must learn to interpret whether a cost is fixed or variable relative to a given activity measure.
To teach this concept, we have devised a number of exercises and problems that ask students to identify whether a cost is fixed or variable in a variety of circumstances. For example, is the cost of rent for a Wendy’s restaurant fixed or variable with respect to the number of hamburgers sold at a particular location? Is the cost of rent fixed or variable
2-1Copyright © 2014 McGraw-Hill Education. All rights reserved. No reproduction or distribution without the prior written consent of
McGraw-Hill Education.

Full file at http://testbankwizard.eu/Solution-Manual-for-Fundamental-Managerial-Accounting-Concepts-7th-Edition-by-Edmonds
with respect to the number of restaurants operated by the company? In the first case, the rent cost is fixed. In the second case, the rent cost is variable.
Finally, student failure to grasp the idea of relevant range frequently leads to confusion. Suppose you explain that rent cost for a department store is fixed relative to sales volume because it remains unchanged regardless of sales levels. Now, suppose a student argues that rent cost is variable because more sales volume requires more store space and, therefore, higher rent cost. The student’s confusion stems from failure to understand the concept of relevant range. Explain that a cost exhibits fixed or variable behavior patterns within a certain range of activity. For example, rent cost may be fixed for sales volumes between $500,000 and $1,000,000. Beyond this range of activity, rent cost will indeed change as more space is needed. However, the cost is fixed so long as the sales volume remains within the relevant range.
Once students master these three concepts, they should be able to identify and describe fixed and variable cost behavior in a variety of different circumstances. You are ready to discuss why effective business management requires understanding cost behavior. Why care whether a cost exhibits fixed or variable behavior? Business managers care because understanding cost behavior improves their abilities to assess risk and improve profitability. If management establishes a predominantly fixed cost structure and achieves high sales volume, costs per unit will be smaller and profitability is likely to be higher. However, if volume is low, costs per unit will skyrocket and profitability will suffer. This relationship between fixed cost and volume is commonly called operating leverage. You must not only teach students how to classify costs as fixed or variable, but also teach them why such classification matters. We have included several exercises and problems specifically designed to develop students’ understanding of operating leverage.
This chapter also offers an opportunity to distinguish between financial and managerial accounting. Begin by acknowledging that classifying actual costs as fixed and variable would be a difficult task in a large company. To avoid the record keeping problems associated with measuring actual cost, managerial accountants frequently use estimated rather than actual costs. This discussion provides a good segue into covering methods used to estimate fixed and variable costs, including the high/low method, scattergraphs, and regression analysis.
2-2Copyright © 2014 McGraw-Hill Education. All rights reserved. No reproduction or distribution without the prior written consent of
McGraw-Hill Education.

Full file at http://testbankwizard.eu/Solution-Manual-for-Fundamental-Managerial-Accounting-Concepts-7th-Edition-by-Edmonds
Detailed Outline of a Lesson Plan for Chapter 2
I. Define the terms fixed cost and variable cost. Point out that the terms fixed and variable are logically consistent with the behavior of total cost. Emphasize that the terms fixed and variable are inconsistent with cost per unit behavior.
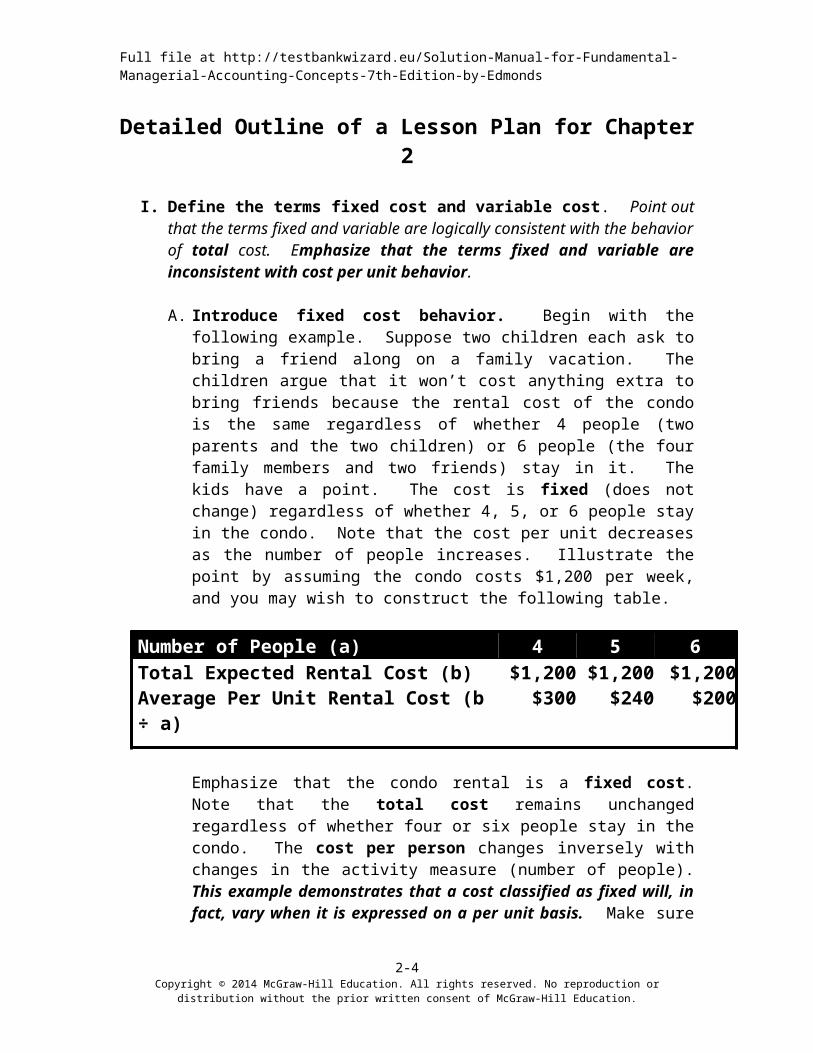
A. Introduce fixed cost behavior. Begin with the following example. Suppose two children each ask to bring a friend along on a family vacation. The children argue that it won’t cost anything extra to bring friends because the rental cost of the condo is the same regardless of whether 4 people (two parents and the two children) or 6 people (the four family members and two friends) stay in it. The kids have a point. The cost is fixed (does not change) regardless of whether 4, 5, or 6 people stay in the condo. Note that the cost per unit decreases as the number of people increases. Illustrate the point by assuming the condo costs $1,200 per week, and you may wish to construct the following table.
Number of People (a) 4 5 6Total Expected Rental Cost (b) $1,200 $1,200 $1,200Average Per Unit Rental Cost (b ÷ a) $300 $240 $200
Emphasize that the condo rental is a fixed cost. Note that the total cost remains unchanged regardless of whether four or six people stay in the condo. The cost per person changes inversely with changes in the activity measure (number of people). This example demonstrates that a cost classified as fixed will, in fact, vary when it is expressed on a per unit basis. Make sure students understand that the word “fixed” relates to the behavior of total cost.
B. Introduce variable cost behavior. While it is true that the cost of the condo is fixed, what about the cost of food? What happens to food cost if you bring along two hungry teenagers? Suppose weekly food costs average $100 per person. Construct a table that shows the per unit food cost and the total food cost for 4, 5, or 6 people.
Number of People (a) 4 5 6Cost Per Person (b) $100 $100 $100Total Food Cost (a x b) $400 $500 $600
Note that the total cost varies in direct proportion to the number of people eating. Conversely, the cost per unit (per person) remains constant regardless of the number of people. It is traditional practice to classify a cost based on how its total behaves.
2-3Copyright © 2014 McGraw-Hill Education. All rights reserved. No reproduction or distribution without the prior written consent of
McGraw-Hill Education.
Full file at http://testbankwizard.eu/Solution-Manual-for-Fundamental-Managerial-Accounting-Concepts-7th-Edition-by-Edmonds
C. Contrast managerial versus financial accounting. Some students may observe that each person will not eat exactly $100 worth of food. Even if the students do not mention it, you should emphasize that the example uses average cost rather than actual cost. This is a good time to make a brief comparison between financial and managerial accounting: note that the example focuses on possible future events, rather than historical events.
D. Have the students work Exercise 2-6A from the textbook as an in-class assignment. Walk around and observe students’ work. If many students are having difficulty, you may want to work the problem on the board. Once you are satisfied that the class has mastered this topic, you are ready to move forward.
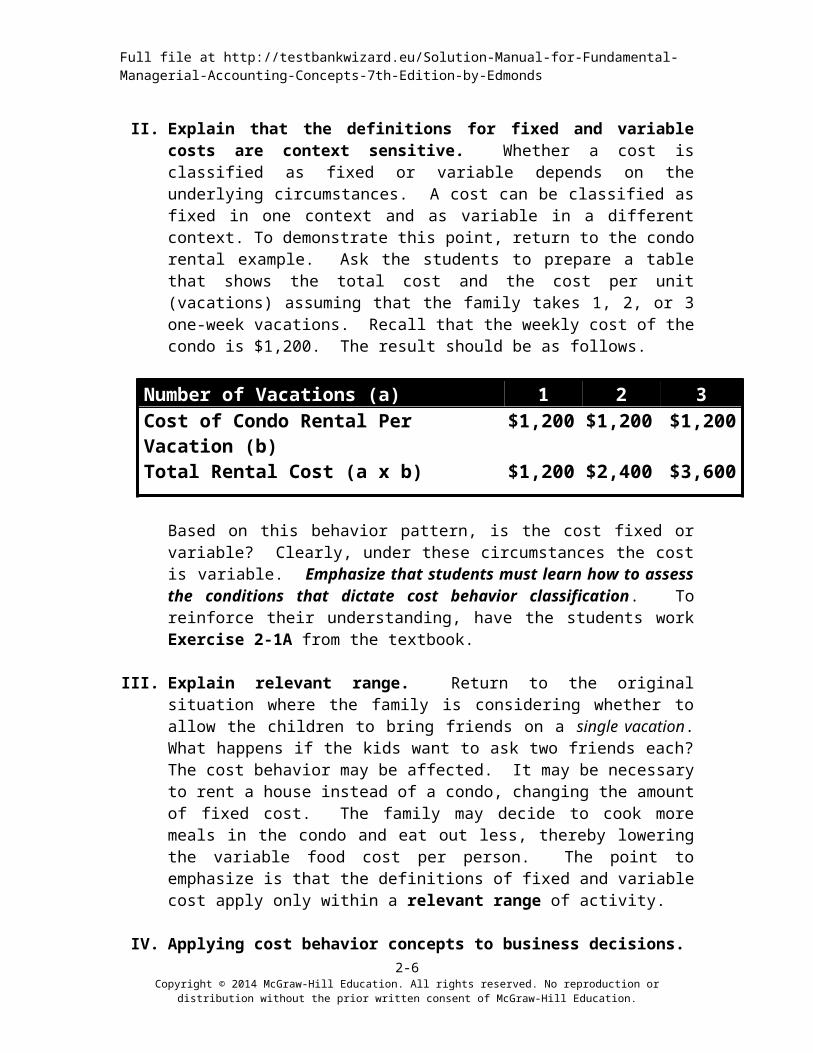
II. Explain that the definitions for fixed and variable costs are context sensitive. Whether a cost is classified as fixed or variable depends on the underlying circumstances. A cost can be classified as fixed in one context and as variable in a different context. To demonstrate this point, return to the condo rental example. Ask the students to prepare a table that shows the total cost and the cost per unit (vacations) assuming that the family takes 1, 2, or 3 one-week vacations. Recall that the weekly cost of the condo is $1,200. The result should be as follows.
Number of Vacations (a) 1 2 3Cost of Condo Rental Per Vacation (b) $1,200 $1,200 $1,200Total Rental Cost (a x b) $1,200 $2,400 $3,600
Based on this behavior pattern, is the cost fixed or variable? Clearly, under these circumstances the cost is variable. Emphasize that students must learn how to assess the conditions that dictate cost behavior classification. To reinforce their understanding, have the students work Exercise 2-1A from the textbook.
III. Explain relevant range. Return to the original situation where the family is considering whether to allow the children to bring friends on a single vacation. What happens if the kids want to ask two friends each? The cost behavior may be affected. It may be necessary to rent a house instead of a condo, changing the amount of fixed cost. The family may decide to cook more meals in the condo and eat out less, thereby lowering the variable food cost per person. The point to emphasize is that the definitions of fixed and variable cost apply only within a relevant range of activity.
IV. Applying cost behavior concepts to business decisions.
A. Copy and distribute Demonstration Problem 2-1.B. Begin by reinforcing the concepts previously introduced. First, have students
calculate for AOTI the total commission cost and the commission cost per person (part a.1.) if 1,000, 2,000, or 4,000 people attend the art exhibition.
2-4Copyright © 2014 McGraw-Hill Education. All rights reserved. No reproduction or distribution without the prior written consent of
McGraw-Hill Education.

Full file at http://testbankwizard.eu/Solution-Manual-for-Fundamental-Managerial-Accounting-Concepts-7th-Edition-by-Edmonds
Then, ask students to classify the commission cost according to its behavior (fixed or variable). Show students how the data can be useful in making decisions by asking them how the cost per unit data could be used in setting the ticket price. Obviously, expected attendance will affect the pricing decision. We usually ask students to discuss how to estimate the number of people who would attend. The specific answers are not important. The point to make is that managerial accounting information is frequently based on estimates. This is a good opportunity to bring up the issue of accuracy versus relevance.
C. Next, have students calculate the total cost of books and the cost per book (part a.2.) if 1,000, 2,000, or 4,000 books are distributed to the people who attend the exhibition. Then, have students classify the book cost according to its behavior (fixed or variable). Suppose the company prints 2,000 books but distributes only 1,500? Suppose it prints 2,000 and 2,500 people attend? Excess production results in waste, while insufficient production results in shortages. Shortages have an opportunity cost—lost additional profits—and can lead to customer ill will. Discuss just-in-time inventory systems as a means of minimizing inventory holding risk. Suppose the company took orders and subsequently mailed books to the patrons. It could then produce the books just in time for mailing, thereby eliminating the possibility of over or under production. Let the discussion continue as long as you deem appropriate. This exercise reinforces the introduction to just-in-time inventory that was provided in Chapter 1. Accustom students to the idea that managerial accounting concepts carry over from one chapter to the next.
V. Introduce the concept of operating leverage.
A. Suppose AOTI expects 4,000 people to attend the exhibition if tickets are priced at $6 each. Have students prepare a budgeted income statement using this assumption.
B. Suppose actual attendance is 10 percent higher than expected. Have students prepare a revised income statement assuming that 4,400 people attend the exhibition. Have them calculate the percentage change in revenue and in net income. Many students have weak math skills when it comes to calculating percentage changes. It may be helpful to take a few minutes to cover this topic. Have them identify the base measure (revenue or net income at the original estimate of 4,000 patrons) and the alternative measure (revenue or net income at the alternative point of 4,400 patrons). Once students can identify the base and alternative measures, teach them to calculate the percentage change using the following formula:
Alternative Measure ─ Base Measure = DifferenceDifference ÷ Base Measure = Percentage Change
Although students should come to accounting knowing how to compute percentage changes, frequently they do not. Spending a few minutes covering these basics can significantly reduce confusion.
2-5Copyright © 2014 McGraw-Hill Education. All rights reserved. No reproduction or distribution without the prior written consent of
McGraw-Hill Education.
Full file at http://testbankwizard.eu/Solution-Manual-for-Fundamental-Managerial-Accounting-Concepts-7th-Edition-by-Edmonds
C. Highlight that a relatively small percentage change in revenue produced a significantly larger percentage change in profit (net income). Then introduce the term operating leverage. Students seem to grasp things better if they see the point before they learn the term. Always try to get students to focus on understanding the concepts as opposed to memorizing the terms.
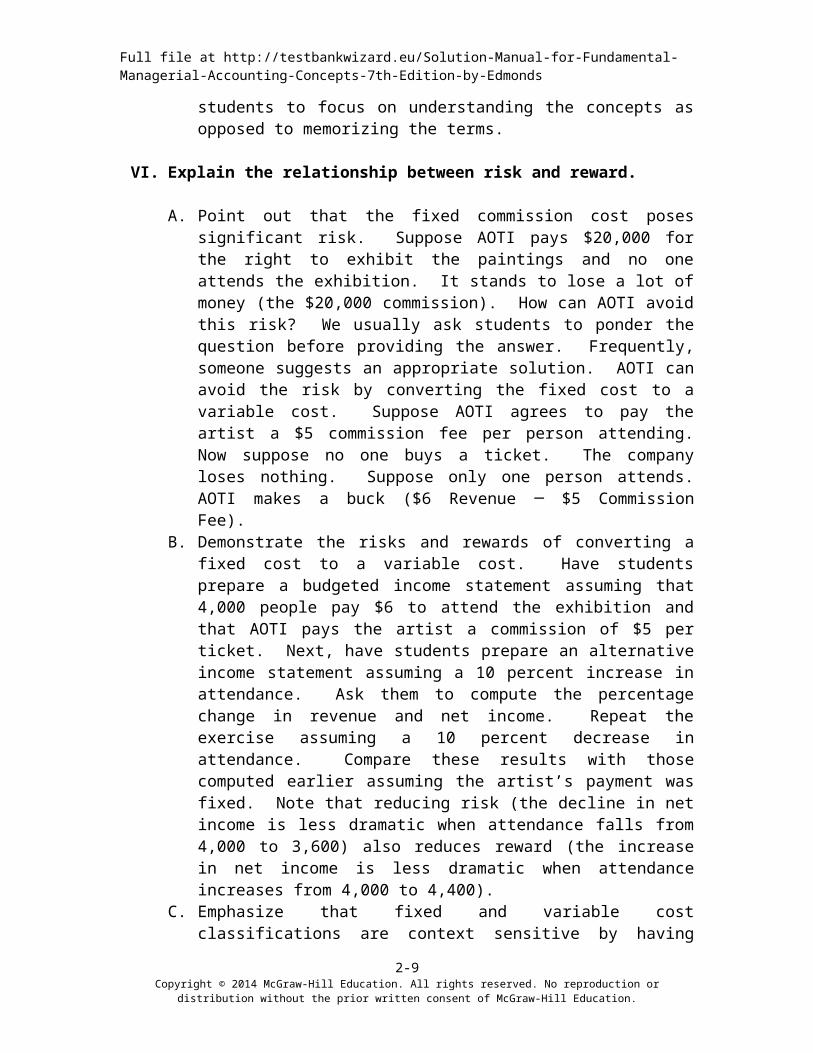
VI. Explain the relationship between risk and reward.
A. Point out that the fixed commission cost poses significant risk. Suppose AOTI pays $20,000 for the right to exhibit the paintings and no one attends the exhibition. It stands to lose a lot of money (the $20,000 commission). How can AOTI avoid this risk? We usually ask students to ponder the question before providing the answer. Frequently, someone suggests an appropriate solution. AOTI can avoid the risk by converting the fixed cost to a variable cost. Suppose AOTI agrees to pay the artist a $5 commission fee per person attending. Now suppose no one buys a ticket. The company loses nothing. Suppose only one person attends. AOTI makes a buck ($6 Revenue ─ $5 Commission Fee).
B. Demonstrate the risks and rewards of converting a fixed cost to a variable cost. Have students prepare a budgeted income statement assuming that 4,000 people pay $6 to attend the exhibition and that AOTI pays the artist a commission of $5 per ticket. Next, have students prepare an alternative income statement assuming a 10 percent increase in attendance. Ask them to compute the percentage change in revenue and net income. Repeat the exercise assuming a 10 percent decrease in attendance. Compare these results with those computed earlier assuming the artist’s payment was fixed. Note that reducing risk (the decline in net income is less dramatic when attendance falls from 4,000 to 3,600) also reduces reward (the increase in net income is less dramatic when attendance increases from 4,000 to 4,400).
C. Emphasize that fixed and variable cost classifications are context sensitive by having students compute the total commission cost using different assumptions. Assume AOTI pays the artist $20,000 per exhibition. First compute the total commission cost and the cost per person assuming 1,000, 2,000, or 4,000 people attend one exhibition. Under these circumstances the artist’s commission is a fixed cost. Next, compute the total commission cost and the cost per exhibition assuming AOTI sponsors 1, 2, or 3 exhibitions. In this context the commission cost is a variable cost. Point out that a cost (the artist’s commission) can behave as a fixed or a variable cost depending upon the context.
VII. Illustrate the impact of fixed and variable costs in a competitive business environment. We use Demonstration Problem 2-2 as an in-class group exercise to introduce the effect of cost behavior on business strategy. “My Company” has a fixed cost structure while “Your Company” has a variable cost structure. In an effort to lure customers away from Your Company, My Company sets the tour price just below the variable operating cost of Your Company. If My Company
2-6Copyright © 2014 McGraw-Hill Education. All rights reserved. No reproduction or distribution without the prior written consent of
McGraw-Hill Education.

Full file at http://testbankwizard.eu/Solution-Manual-for-Fundamental-Managerial-Accounting-Concepts-7th-Edition-by-Edmonds
successfully lures additional customers, its cost per customer will decrease as the number of rafters increases. As volume increases, My Company will become increasingly profitable. If Your Company follows suit with a price reduction, it will lose money with each additional customer. As volume increases Your Company’s profits will decrease. Once students understand the scenario, you are ready to proceed with the problem. Assume that you, the professor, own My Company and that the students own Your Company. Ask students to provide a defensive strategy. Our suggested solution to the demonstration problem includes some of the responses we have received from our classes. Familiarize yourself with these possibilities before using the problem in your class. Even so, our list of feasible strategies is not comprehensive. Your students will likely offer other responses. This is an excellent problem that students enjoy while learning a meaningful lesson about the relationship among the volume of activity, cost behavior, and profitability. We encourage you to give it a try.
VIII. Introduce the contribution margin income statement and computing the magnitude of operating leverage. Use Demonstration Problem 2-3 to introduce these topics.
IX. Explain methods of estimating fixed and variable cost. You may omit these subjects without affecting coverage of future material. Use Exercise 2-16A from the textbook as a demonstration problem if you decide to cover the high/low method.
2-7Copyright © 2014 McGraw-Hill Education. All rights reserved. No reproduction or distribution without the prior written consent of
McGraw-Hill Education.

Full file at http://testbankwizard.eu/Solution-Manual-for-Fundamental-Managerial-Accounting-Concepts-7th-Edition-by-Edmonds
Summary Outline of a Lesson Plan for Chapter 2
I. Define the terms fixed cost and variable cost.
A. Introduce fixed cost behavior. Use the example in which two children each ask to bring a friend along on vacation.
B. Introduce variable cost behavior. Continue the example.C. Contrast managerial versus financial accounting. The example uses
average cost rather than actual cost, future vs. historical cost.D. Have students work Exercise 2-6A as an in-class assignment. This exercise
contrasts fixed and variable cost behavior.
II. Explain that the definitions for fixed and variable costs are context sensitive. In the previous example, condo cost is variable relative to the number of vacations. Have the students work Exercise 2-1A for reinforcement.
III. Explain relevant range. What if the kids invite two friends each?
IV. Applying cost behavior concepts to business decisions.
Use part a of Demonstration Problem 2-1.
V. Introduce the concept of operating leverage.
Use part b of Demonstration Problem 2-1. Explain how to compute percentage changes.
VI. Explain the relationship between risk and reward.
A. Expand on part b of Demonstration Problem 2-1. B. Have the students work part c of Demonstration Problem 2-1 to reinforce
the fact that fixed and variable cost classifications are context sensitive.
VII. Illustrate the impact of fixed and variable costs in a competitive business environment. Use Demonstration Problem 2-2 as an in-class group exercise to introduce the effect of cost behavior on business strategy.
VIII. Introduce the contribution margin income statement and the computation of the magnitude of operating leverage. Use Demonstration Problem 2-3 to introduce these topics.
IX. Explain methods of estimating fixed and variable Cost. Use Exercise 2-16A from the textbook as a demonstration problem if you decide to cover the high/low method.
2-8Copyright © 2014 McGraw-Hill Education. All rights reserved. No reproduction or distribution without the prior written consent of
McGraw-Hill Education.
Full file at http://testbankwizard.eu/Solution-Manual-for-Fundamental-Managerial-Accounting-Concepts-7th-Edition-by-Edmonds
Quiz Questions for Chapter 2
Use the following information to answer the next four questions. At lunchtime, Darlene’s Dawgs sells hot dogs, chips, and soft drinks from five portable hot dog carts stationed on busy street corners. The depreciation cost on the carts is $1,000 per year for each cart. The company buys supplies (hot dogs, chips, cups, napkins) as needed. The 5 cart operators are each paid $8,000 per year plus 5% of sales revenue.
1. Relative to the number of hot dogs sold, the depreciation cost is:a. fixed.b. variable.c. mixed.d. strategic.
2. Relative to the number of hot dog carts, the depreciation cost is: a. fixed.b. variable.c. mixed.d. strategic.
3. Relative to the number of hours worked, the total compensation cost for the cart operators is:a. fixed.b. variable.c. mixed.d. strategic.
4. The cost of supplies relative to the number of customers served at a particular hot dog cart and relative to the number of customers served by all five of the hot dog carts is, respectively:a. variable / fixed.b. fixed / fixed.c. variable / fixed.d. variable / variable.
5. At a production and sales level of 3,000 units, Munro Company incurred $60,000 of fixed cost and $36,000 of variable cost. When 4,000 units of product are produced and sold, the company’s total cost is expected to be:
a. $116,000.b. $108,000.c. $128,000.d. $96,000.
2-9Copyright © 2014 McGraw-Hill Education. All rights reserved. No reproduction or distribution without the prior written consent of
McGraw-Hill Education.

Full file at http://testbankwizard.eu/Solution-Manual-for-Fundamental-Managerial-Accounting-Concepts-7th-Edition-by-Edmonds
Use the following information to answer the next two questions:
Crowder’s QuiltsIncome Statement
For 2014
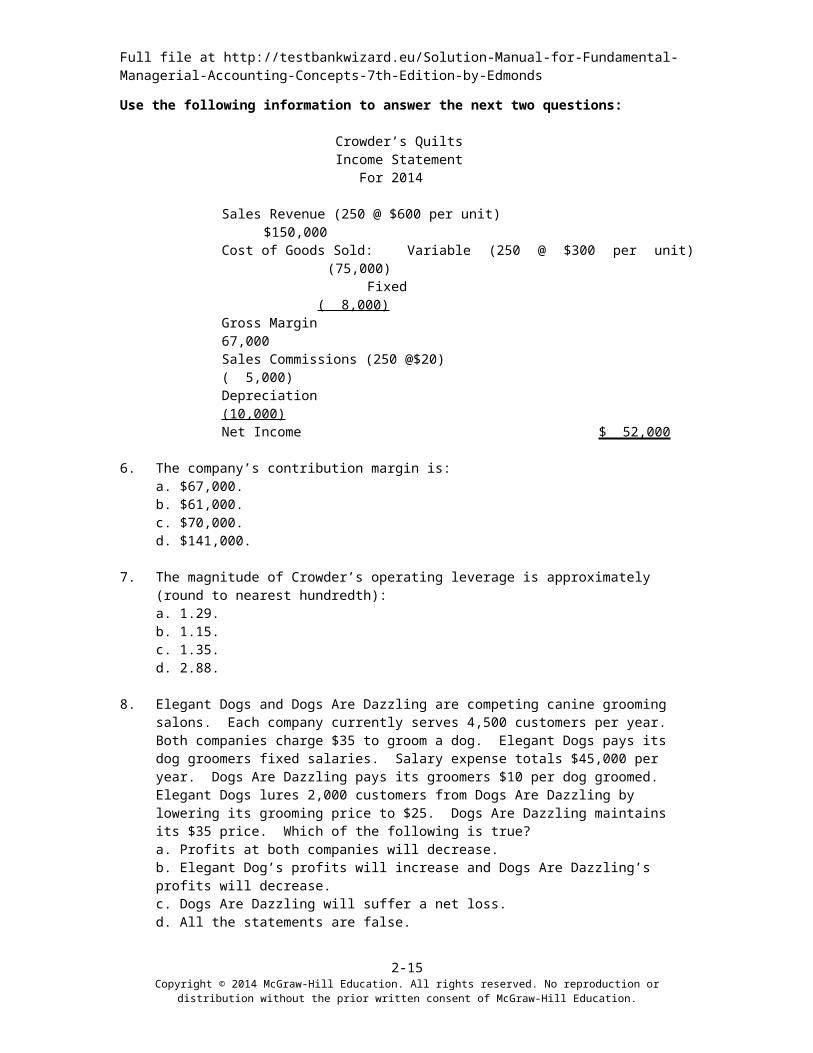
Sales Revenue (250 @ $600 per unit) $150,000Cost of Goods Sold: Variable (250 @ $300 per unit) (75,000)
Fixed ( 8,000)Gross Margin 67,000Sales Commissions (250 @$20) ( 5,000)Depreciation (10,000)Net Income $ 52,000
6. The company’s contribution margin is:a. $67,000.b. $61,000.c. $70,000.d. $141,000.
7. The magnitude of Crowder’s operating leverage is approximately (round to nearest hundredth):a. 1.29.b. 1.15.c. 1.35.d. 2.88.
8. Elegant Dogs and Dogs Are Dazzling are competing canine grooming salons. Each company currently serves 4,500 customers per year. Both companies charge $35 to groom a dog. Elegant Dogs pays its dog groomers fixed salaries. Salary expense totals $45,000 per year. Dogs Are Dazzling pays its groomers $10 per dog groomed. Elegant Dogs lures 2,000 customers from Dogs Are Dazzling by lowering its grooming price to $25. Dogs Are Dazzling maintains its $35 price. Which of the following is true?a. Profits at both companies will decrease.b. Elegant Dog’s profits will increase and Dogs Are Dazzling’s profits will decrease.c. Dogs Are Dazzling will suffer a net loss.d. All the statements are false.
9. At a sales level of $270,000, the magnitude of operating leverage for Donuts Unlimited is 2.8. If sales increase by 15%, profits will increase by:a. 2.8%b. 15%c. 42%d. 18.67%
10. Handy Hiking produces backpacks. In 2014, its highest and lowest production levels occurred in July and January, respectively. In July, it produced 4,000 backpacks at a total cost of $110,000. In January, it produced 2,500 backpacks at a total cost of $87,500. Using the high/low method, the average variable cost of producing a backpack was:a. $15.00b. $31.25c. $30.38d. $27.50
2-10Copyright © 2014 McGraw-Hill Education. All rights reserved. No reproduction or distribution without the prior written consent of
McGraw-Hill Education.

Full file at http://testbankwizard.eu/Solution-Manual-for-Fundamental-Managerial-Accounting-Concepts-7th-Edition-by-Edmonds
Solutions to Quiz Questions
Question Answer1 A2 B3 C4 D5 B6 C7 C8 B9 C10 A
2-11Copyright © 2014 McGraw-Hill Education. All rights reserved. No reproduction or distribution without the prior written consent of
McGraw-Hill Education.

Full file at http://testbankwizard.eu/Solution-Manual-for-Fundamental-Managerial-Accounting-Concepts-7th-Edition-by-Edmonds
Demonstration Problems for Chapter 2
Demonstration Problem 2-1
Applying Cost Behavior Concepts to Business Decisions
Art On Tour, Inc. (AOTI) contracts with artists to exhibit their work to the public. AOTI has agreed to pay a well known artist a $20,000 commission for the right to exhibit his work for one month.
RequiredPart a – Identifying Cost Behavior1. Determine the total commission cost and the commission cost per person if 1,000,
2,000, or 4,000 people attend the exhibition. Is the commission cost fixed or variable?
2. AOTI sells to patrons books illustrating the artist’s work. The books cost AOTI $5 each. Determine the total cost of books and the cost per person if 1,000, 2,000, or 4,000 people attend the exhibition and wish to purchase the books. Is the book cost fixed or variable?
Part b – Operating Leverage and Risk/Reward Relationship1. AOTI pays an artist a $20,000 commission. It sells 4,000 tickets at $6 each. Prepare
an income statement. Then prepare revised income statements assuming 10 percent more than 4,000 and 10 percent fewer than 4,000 patrons attend the exhibition. Calculate the percentage changes in revenue and net income if attendance increases or decreases 10 percent.
2. Alternatively, AOTI pays the artist a commission of $5 per ticket sold. It sells 4,000 tickets at $6 each. Prepare an income statement. Then prepare revised income statements assuming 10 percent more than 4,000 and 10 percent fewer than 4,000 patrons attend the exhibition. Calculate the percentage change in revenue and net income if attendance increases or decreases 10 percent.
Part c --Fixed and Variable Cost Definitions are Context Sensitive1. AOTI pays the artist a commission of $20,000 per exhibition. What is the total
commission cost and the commission cost per person if 1,000, 2,000, or 4,000 people attend the exhibition? (Same as part a.1.)
2. AOTI pays the artist a commission of $20,000 per exhibition. What is the total commission cost and the commission cost per exhibition if AOTI sponsors 1, 2, or 3 exhibitions?
2-12Copyright © 2014 McGraw-Hill Education. All rights reserved. No reproduction or distribution without the prior written consent of
McGraw-Hill Education.

Full file at http://testbankwizard.eu/Solution-Manual-for-Fundamental-Managerial-Accounting-Concepts-7th-Edition-by-Edmonds
Demonstration Problem 2-2 Effect of Cost Structure
My Company / Your Company
My Company and Your Company provide rafting tours on Big Bear River. My Company pays tour guides fixed salaries. It budgets salaries expense at $160,000 per year. Your Company pays tour guides $40 per rafter served. Rafters are charged $50 per tour. Both companies expect to carry approximately 4,000 rafters during the year.
Requireda. Prepare budgeted annual income statements for the two companies.b. In an effort to lure rafters away from Your Company, My Company lowers the price
per rafter to $39. Prepare revised income statements for both companies. Assume that My Company serves 6,000 rafters who each pay $39 per tour, while Your Company serves only 2,000 rafters who pay $50 per tour.
c. Assume you are president of Your Company. Offer defensive strategies.d. Suppose Your Company matches the $39 price set by My Company. Prepare income
statements for both companies assuming that each company serves 4,000 customers.
2-13Copyright © 2014 McGraw-Hill Education. All rights reserved. No reproduction or distribution without the prior written consent of
McGraw-Hill Education.

Full file at http://testbankwizard.eu/Solution-Manual-for-Fundamental-Managerial-Accounting-Concepts-7th-Edition-by-Edmonds
Demonstration Problem 2-3 Effect of Operating Leverage
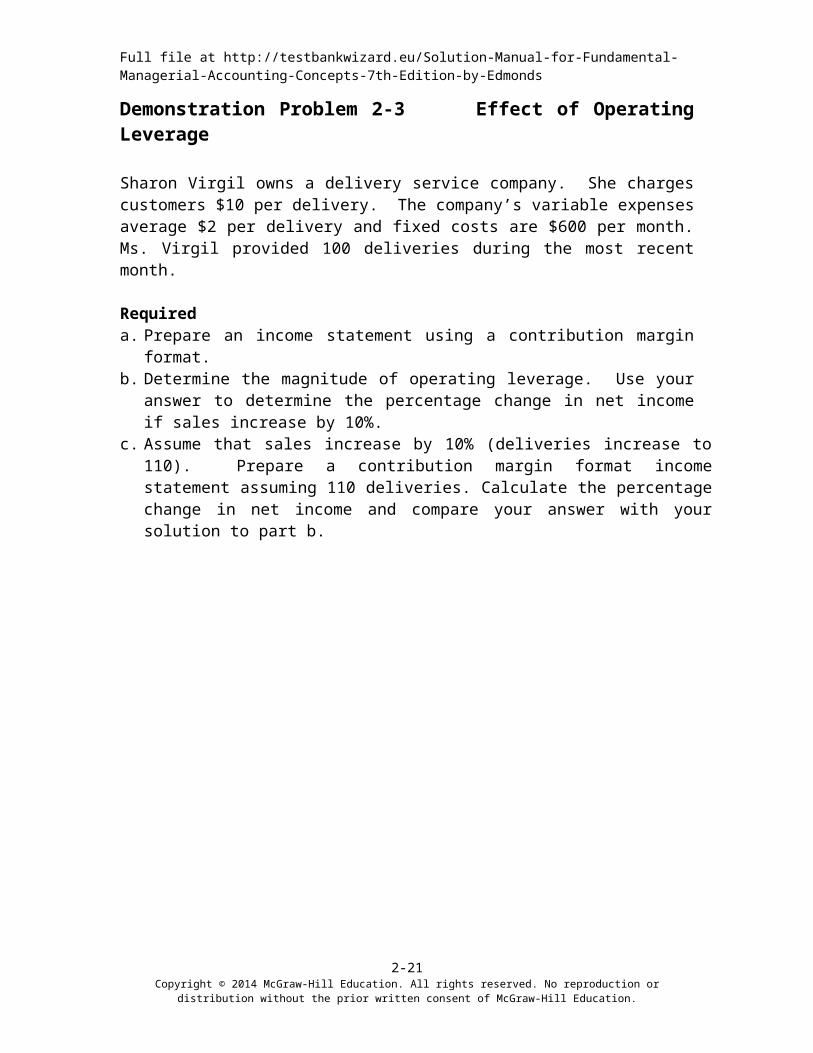
Sharon Virgil owns a delivery service company. She charges customers $10 per delivery. The company’s variable expenses average $2 per delivery and fixed costs are $600 per month. Ms. Virgil provided 100 deliveries during the most recent month.
Requireda. Prepare an income statement using a contribution margin format.b. Determine the magnitude of operating leverage. Use your answer to determine the
percentage change in net income if sales increase by 10%.c. Assume that sales increase by 10% (deliveries increase to 110). Prepare a contribution
margin format income statement assuming 110 deliveries. Calculate the percentage change in net income and compare your answer with your solution to part b.
2-14Copyright © 2014 McGraw-Hill Education. All rights reserved. No reproduction or distribution without the prior written consent of
McGraw-Hill Education.
Full file at http://testbankwizard.eu/Solution-Manual-for-Fundamental-Managerial-Accounting-Concepts-7th-Edition-by-Edmonds
Demonstration Problem 2-1 Solution
a.1. Number of People Attending (a) 1,000 2,000 4,000Total Commission Cost (b) $20,000 $20,000 $20,000Average Commission Cost Per Person (b ÷ a) $20 $10 $5
Type of cost: because the total commission cost remains constant at $20,000 regardless of the number of people attending, it is a fixed cost.
a.2.Number of People Attending (a) 1,000 2,000 4,000Total Cost of Books [b=(a x c)] $5,000 $10,000 $20,000Average Per Unit Book Cost (c) $5 $5 $5
Type of cost: because the total cost changes in direct proportion with the number of people receiving books, it is a variable cost.
b.1.Number of Tickets Sold 3,600 % Change 4,000 % Change 4,400Revenue ($6 Per Ticket) $21,600 (10%) $24,000 +10% $26,400Commission Cost (Fixed) 20,000 20,000 20,000Net Income $ 1,600 (60%) $ 4,000 +60% $ 6,400
Percentage Change in Revenue: + $2,400 ÷ $24,000 = + 10%Percentage Change in Net Income: + $2,400 ÷ $4,000 = + 60%
b.2.Number of Tickets Sold 3,600 % Change 4,000 % Change 4,400Revenue ($6 Per Ticket) $21,600 (10%) $24,000 +10% $26,400Commission Cost (Variable) 18,000 20,000 22,000Net Income $ 3,600 (10%) $ 4,000 +10% $ 4,400
Percentage Change in Revenue: + $2,400 ÷ $24,000 = +10%Percentage Change in Net Income: + $400 ÷ $4,000 = +10%
2-15Copyright © 2014 McGraw-Hill Education. All rights reserved. No reproduction or distribution without the prior written consent of
McGraw-Hill Education.

Full file at http://testbankwizard.eu/Solution-Manual-for-Fundamental-Managerial-Accounting-Concepts-7th-Edition-by-Edmonds
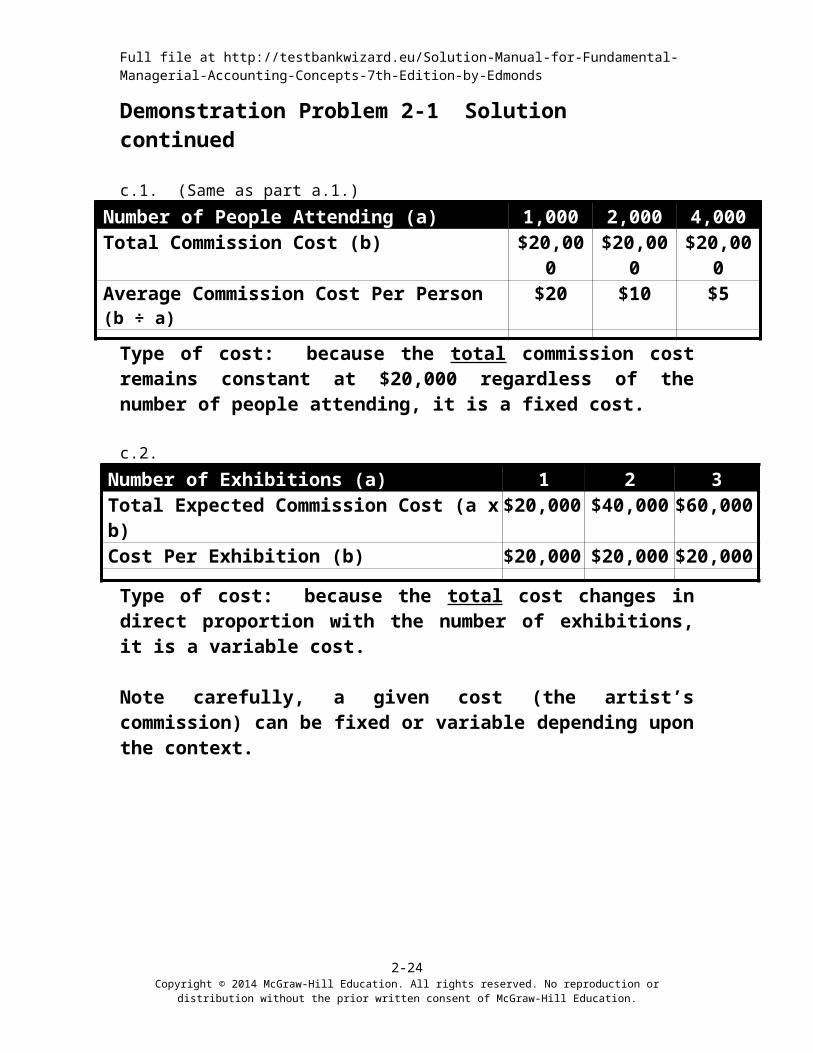
Demonstration Problem 2-1 Solution continued
c.1. (Same as part a.1.)Number of People Attending (a) 1,000 2,000 4,000Total Commission Cost (b) $20,000 $20,000 $20,000Average Commission Cost Per Person (b ÷ a) $20 $10 $5
Type of cost: because the total commission cost remains constant at $20,000 regardless of the number of people attending, it is a fixed cost.
c.2.Number of Exhibitions (a) 1 2 3Total Expected Commission Cost (a x b) $20,000 $40,000 $60,000Cost Per Exhibition (b) $20,000 $20,000 $20,000
Type of cost: because the total cost changes in direct proportion with the number of exhibitions, it is a variable cost.
Note carefully, a given cost (the artist’s commission) can be fixed or variable depending upon the context.
2-16Copyright © 2014 McGraw-Hill Education. All rights reserved. No reproduction or distribution without the prior written consent of
McGraw-Hill Education.

Full file at http://testbankwizard.eu/Solution-Manual-for-Fundamental-Managerial-Accounting-Concepts-7th-Edition-by-Edmonds
Demonstration Problem 2-2 Solution
a.My
CompanyYour
CompanyNumber of Rafters (a) 4,000 4,000
Revenue ($50 x a) $200,000 $200,000Cost of Guides My Company Fixed (160,000)Cost of Guides Your Company ($40 x a) Variable (160,000)Net income $ 40,000 $ 40,000
b.My
CompanyYour
CompanyNumber of Rafters (a) 6,000 2,000Revenue My Company ($39 x a) $234,000Revenue Your Company ($50 x a) $100,000Cost of Guides My Company Fixed (160,000)Cost of Guides Your Company ($40 x a) Variable (80,000)Net Income $ 74,000 $ 20,000
My Company was able to increase total revenue because the decrease in price was offset by an increase in volume. In other words, 6,000 customers paying $39 each produce more revenue ($234,000) than do 4,000 customers paying $50 ($200,000). Since My Company’s costs are fixed, the increase in the number of customers served does not increase costs. Consequently, the $34,000 ($234,000 $200,000) increase in revenue produces a corresponding $34,000 ($74,000 $40,000) increase in net income. Conversely, Your Company’s profitability declines in proportion to its loss of customers. In this case Your Company experienced a $20,000 decline in income ($40,000 $20,000). Using this strategy My Company could eventually run Your Company out of business. My Company stands to gain an additional $78,000 ($39 x 2,000) of revenue when it takes over
2-17Copyright © 2014 McGraw-Hill Education. All rights reserved. No reproduction or distribution without the prior written consent of
McGraw-Hill Education.

Full file at http://testbankwizard.eu/Solution-Manual-for-Fundamental-Managerial-Accounting-Concepts-7th-Edition-by-Edmonds
Your Company’s remaining customers. This additional revenue will be pure profit. Indeed, My Company’s profitability may increase more dramatically because the company could then raise prices in the absence of competition.
c.The most common strategy students offer is to create product differentiation. Many variations of this strategy are possible. Your Company could use a different type of raft, travel different routes, schedule different start and stop times, maintain a superior safety record. Product differentiation is a valid answer. However, watch for errors in logic such as “we will provide a free lunch or a free night’s lodging.” While such items are free to customers, they are not free to the business providing them. Such offerings will increase Your Company’s variable cost and thereby intensify the competitive disadvantage.
Students also commonly suggest cutting costs by paying the tour guides less. Students often offer strategies involving employees without considering employee reaction. You may wish to emphasize the importance of establishing good employee relations.
Occasionally someone suggests a merger. The merged company could retain the salaried tour guides and dismiss those paid on a variable basis. Emphasize the effects of operating leverage. When fixed costs remain unchanged and volume increases, profits soar. This may be a hard-hearted approach, but it is highly profitable and illustrates one reason why companies choose to merge.
The response that applies most directly to the subject of cost behavior is for Your Company to match My Company’s price and hold firm. As shown in part d, My Company cannot benefit from the price-cutting strategy unless volume increases. If both companies retain their market share of 4,000 customers, both will incur losses at a price of $39 per rider. In business it is often necessary to incur short-term losses in order to maintain market share. This situation illustrates one of many reasons that a strong capital structure can be essential for survival.
2-18Copyright © 2014 McGraw-Hill Education. All rights reserved. No reproduction or distribution without the prior written consent of
McGraw-Hill Education.
Full file at http://testbankwizard.eu/Solution-Manual-for-Fundamental-Managerial-Accounting-Concepts-7th-Edition-by-Edmonds
d.My
CompanyYour
CompanyNumber of Rafters (a) 4,000 4,000
Revenue ($39 x a) $156,000 $156,000Cost of Guides My Company Fixed (160,000)Cost of Guides Your Company ($40 x a) Variable (160,000)Net Loss $ (4,000) $ (4,000)
2-19Copyright © 2014 McGraw-Hill Education. All rights reserved. No reproduction or distribution without the prior written consent of
McGraw-Hill Education.
Full file at http://testbankwizard.eu/Solution-Manual-for-Fundamental-Managerial-Accounting-Concepts-7th-Edition-by-Edmonds
Demonstration Problem 2-3 Solution
a. Income Statement Using a Contribution Margin Format, Volume of 100 Deliveries
Revenue ($10 x 100 deliveries) $1,000Variable Expenses ($2 x 100 deliveries) (200)Contribution Margin 800Fixed Expenses (600)Net Income $ 200
b. Magnitude of Operating Leverage = Contribution Margin ÷ Net Income:
$800 ÷ $200 = 4 times.
Therefore, a 10% increase in sales will produce a 40% (10% x 4) increase in net income. Similarly, a 10% decrease in sales will produce a 40% decrease in net income.
c. Income Statement Using a Contribution Margin Format, Volume of 110 Deliveries
Revenue ($10 x 110 deliveries) $1,100Variable Expenses ($2 x 110 deliveries) (220)Contribution Margin 880Fixed Expenses (600)Net Income $ 280
(Alternative Net Income Base Net Income) ÷ Base($280 $200) ÷ $200 = 40%
The answer to part c confirms the answer determined in part b.
2-20Copyright © 2014 McGraw-Hill Education. All rights reserved. No reproduction or distribution without the prior written consent of
McGraw-Hill Education.
Full file at http://testbankwizard.eu/Solution-Manual-for-Fundamental-Managerial-Accounting-Concepts-7th-Edition-by-Edmonds
Demonstration Problem 2-1 Work Papers
a.1. Number of People Attending 1,000 2,000 4,000Total Commission Cost Average Commission Cost Per Person
Type of cost:
a.2.Number of People Attending 1,000 2,000 4,000Total Cost of Books Average Per Unit Book Cost
Type of cost:
b.1.Number of Tickets Sold 3,600 % Change 4,000 % Change 4,400Revenue ($6 Per Ticket) ( %) + %Commission Cost (Fixed)Net Income $ 1,600 ( %) $ 4,000 + % $ 6,400
Percentage Change in Revenue:Percentage Change in Net Income:
b.2.Number of Tickets Sold 3,600 % Change 4,000 % Change 4,400Revenue ($6 Per Ticket) ( %) $24,000 + %Commission Cost (Variable) 20,000Net Income $ 3,600 ( %) $ 4,000 + % $ 4,400
Percentage Change in Revenue: Percentage Change in Net Income:
2-21Copyright © 2014 McGraw-Hill Education. All rights reserved. No reproduction or distribution without the prior written consent of
McGraw-Hill Education.

Full file at http://testbankwizard.eu/Solution-Manual-for-Fundamental-Managerial-Accounting-Concepts-7th-Edition-by-Edmonds
Demonstration Problem 2-1 Work Papers, continued
c.1. (Same as part a.1.)Number of People Attending 1,000 2,000 4,000Total Commission Cost Average Commission Cost Per Person
Type of cost:
c.2.Number of Exhibitions (a) 1 2 3Total Expected Commission Cost Cost Per Exhibition
Type of cost:
2-22Copyright © 2014 McGraw-Hill Education. All rights reserved. No reproduction or distribution without the prior written consent of
McGraw-Hill Education.

Full file at http://testbankwizard.eu/Solution-Manual-for-Fundamental-Managerial-Accounting-Concepts-7th-Edition-by-Edmonds
Demonstration Problem 2-2 Work Papers
a.My
CompanyYour
CompanyNumber of Rafters 4,000 4,000
RevenueCost of Guides My Company FixedCost of Guides Your Company VariableNet income
b.My
CompanyYour
CompanyNumber of Rafters (a) 6,000 2,000
Revenue My Company Revenue Your Company Cost of Guides My Company FixedCost of Guides Your Company VariableNet Income
d.My
CompanyYour
CompanyNumber of Rafters 4,000 4,000
Revenue Cost of Guides My Company FixedCost of Guides Your Company VariableNet Loss
2-23Copyright © 2014 McGraw-Hill Education. All rights reserved. No reproduction or distribution without the prior written consent of
McGraw-Hill Education.
Full file at http://testbankwizard.eu/Solution-Manual-for-Fundamental-Managerial-Accounting-Concepts-7th-Edition-by-Edmonds
Demonstration Problem 2-3 Work Papers
a. Income Statement Using a Contribution Margin Format, Volume of 100 Deliveries
Revenue Variable Expenses Contribution MarginFixed ExpensesNet Income
b. Magnitude of Operating Leverage = Contribution Margin ÷ Net Income:
$________ ÷ $_________ = ___ times.
Therefore, a 10% increase in sales will produce a _________ increase in net income. Similarly, a 10% decrease in sales will produce a __________ decrease in net income.
c. Income Statement Using a Contribution Margin Format, Volume of 110 Deliveries
Revenue Variable Expenses Contribution MarginFixed ExpensesNet Income
(Alternative Net Income Base Net Income) ÷ Base:
($______ $______) ÷ $______ = _____%
2-24Copyright © 2014 McGraw-Hill Education. All rights reserved. No reproduction or distribution without the prior written consent of
McGraw-Hill Education.