teaching note to accompany which way to grow at mbc farms?
TRANSCRIPT

TEACHING NOTE TO ACCOMPANY
WHICH WAY TO GROW AT MBC FARMS?
by
Cole Ehmke, Craig Dobbins and Michael Boehlje
Staff Paper 04-10
September 2004
Department of Agricultural Economics
Purdue University
Purdue University is committed to the policy that all persons shall have equal access to its programs and employment without regard to race, color, creed, religion, national origin, sex, age, marital status, disability, public
assistance status, veteran status or sexual orientation.
i
TEACHING NOTE TO ACCOMPANY WHICH WAY TO GROW AT MBC FARMS?
by Cole Ehmke, Craig Dobbins and Michael Boehlje
Department of Agricultural Economics, Purdue University West Lafayette, IN 47907-1145
[email protected] Staff Paper # 04-10
September 2004
Abstract
This teaching note accompanies the case study “Which Way to Grow at MBC Farms?” The case was published in the Review of Agricultural Economics, Volume 26, Number 4, 2004.
Like many farm operations, MBC Farms is trying to determine what strategic actions to take
to remain competitive. The farm produces corn and soybeans, contracted specialty corn, and milk. The crops and dairy managers are considering growth opportunities, but have not decided on a strategy. There are a number of possibilities, but the management team is seriously considering expanding either the dairy to take advantage of a milk contract or contract crop production. With the MBC Farms case, instructors can teach farm business managers how to use strategic and financial planning tools to select a growth path for the firm. Keywords: Contract, dairy, financial ratios, high value crops, net present value, case study, teaching note Copyright © by Cole Ehmke, Craig Dobbins and Michael Boehlje. All rights reserved. Readers may make verbatim copies of this document for non-commercial purposes by any means, provided that this copyright appears on all such copies.
1
TEACHING NOTE TO ACCOMPANY WHICH WAY TO GROW AT MBC FARMS?
by Cole Ehmke, Craig Dobbins and Michael Boehlje
Summary of the Case
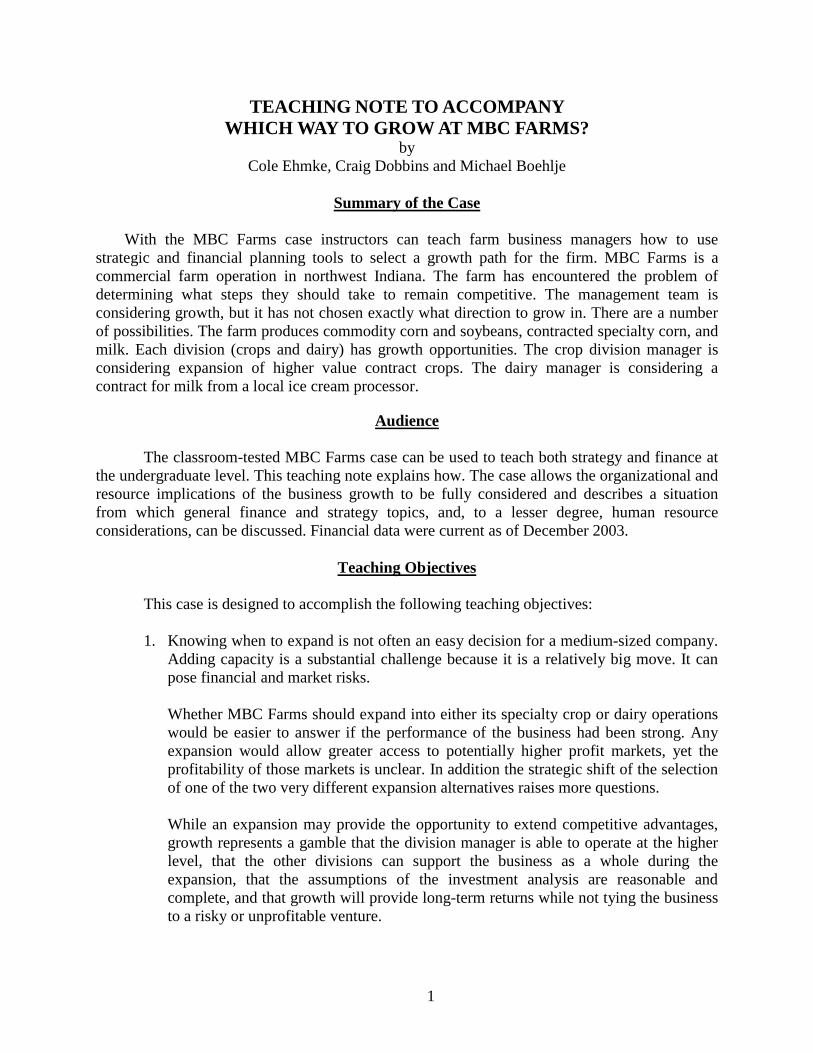
With the MBC Farms case instructors can teach farm business managers how to use
strategic and financial planning tools to select a growth path for the firm. MBC Farms is a commercial farm operation in northwest Indiana. The farm has encountered the problem of determining what steps they should take to remain competitive. The management team is considering growth, but it has not chosen exactly what direction to grow in. There are a number of possibilities. The farm produces commodity corn and soybeans, contracted specialty corn, and milk. Each division (crops and dairy) has growth opportunities. The crop division manager is considering expansion of higher value contract crops. The dairy manager is considering a contract for milk from a local ice cream processor.
Audience The classroom-tested MBC Farms case can be used to teach both strategy and finance at
the undergraduate level. This teaching note explains how. The case allows the organizational and resource implications of the business growth to be fully considered and describes a situation from which general finance and strategy topics, and, to a lesser degree, human resource considerations, can be discussed. Financial data were current as of December 2003.
Teaching Objectives
This case is designed to accomplish the following teaching objectives: 1. Knowing when to expand is not often an easy decision for a medium-sized company.
Adding capacity is a substantial challenge because it is a relatively big move. It can pose financial and market risks.
Whether MBC Farms should expand into either its specialty crop or dairy operations would be easier to answer if the performance of the business had been strong. Any expansion would allow greater access to potentially higher profit markets, yet the profitability of those markets is unclear. In addition the strategic shift of the selection of one of the two very different expansion alternatives raises more questions. While an expansion may provide the opportunity to extend competitive advantages, growth represents a gamble that the division manager is able to operate at the higher level, that the other divisions can support the business as a whole during the expansion, that the assumptions of the investment analysis are reasonable and complete, and that growth will provide long-term returns while not tying the business to a risky or unprofitable venture.

2
2. Accurate financial assessment requires financial documents that use accrual accounting. They can be used for calculating financial ratios which can then be compared to benchmarks and which can suggest where improvement is needed.
3. Finance and strategy are not mutually exclusive. Expansion options and strategic
positioning must be compatible for wise decisions to be made. The finance and strategy interrelationships are illustrated by completing a net present value of an investment option chosen using the growth concepts from the strategy discussion through an estimate of the expenses and revenues associated with the project and an assessment of the repayment capacity of a business. After verifying the financial soundness of the investment other strategic concerns must be addressed, such as the strategic fit of the business and the human resources to carry it out.
Teaching Approach for Strategy
Organizational Issues
MBC Farms is a business without a shared vision. Each manager has a view of what is
best for the farm based on their own perceptions. While the vision statement for the firm is in place, it appears to have been written for a
different time. There is no way of internally resolving disputes – likely a holdover from when Mike, the long-time manager and majority owner, ran the business according to his own purview. Several comments by Betty and Craig indicate that these managers are seeking more control over the direction of the business. Distinct differences between these managers’ risk preferences and their growing desire for responsibility indicate that the business is in the early stages of redefining its vision. This is a critical juncture in the business at which agreement must be achieved or else the business risks being pulled apart by differing views.
To achieve a shared vision the management team must agree on the strategic direction of
the business. They should agree first that any decisions must contribute positively to the financial health of the business, and then satisfy organizational and personal goals, including risk preferences. Craig and Betty are at the point where they have an investment to lose. When they first joined the business their capital commitment was relatively little, but over time the operations they have managed have become large and increasingly complex. With their contribution of time and capital the growth of their respective operations has become something they clearly both want to protect. A formal reassessment of the management team’s goals should be conducted.
Teaching Plan
The following sequence has been used to successfully teach this case. The instructor
should provide a brief introduction to the characteristics of the case, and then the class should break into small groups to discuss the growth options matrices. After discussing the Business Unit Growth matrix the instructor guides the class to the Growth Options matrix and finally to the Outsourcing matrix. Each matrix becomes more specific to the direction that the farm might take.

3
Usually the result is that the class, guided by the instructor, will recommend that the business expand the dairy only and outsource some operations such as raising replacement heifers or raising forage production for the dairy herd.
The following questions are used to guide the discussion.
Should the farm be growing? MBC Farms’ performance is slightly under what would be expected of a progressive
farm business, but not so much as to preclude expanding the operation. However, its level of performance creates market, financial, and organizational risks.
The problem with the current operation is that neither business unit is large enough to
allow access to some markets. The small dairy and lack of storage with the crops limit the farm’s ability to pursue business with the capabilities that have been developed, and thus receive higher prices. Size threatens the business longer term because it would appear that commodity products with no differentiation will provide less value. So, in order to stay in business, the partnership must develop higher value products, or expand dramatically in low margin commodity markets.
In the case Betty talked about an expansion of the dairy to twice its current size. The milk
processor considered required at least this much more milk than MBC Farms is currently capable of producing. If the farm desires at all to capture the value from the quality premiums offered, then the business must grow. This issue relates directly to what many farms are facing. Without sufficient size, there is no way to access markets and gain higher returns or even to survive in some instances. Which unit should be grown?
To answer this question, the Business Unit Growth Matrix can be used (Annex 3, Matrix 1). The matrix helps integrate and evaluate environmental performance. To use it, map a company’s strategic business units or products on a matrix according to how well the company does the task versus its relative importance to the market. Using the SWOT to measure the internal position gives us a sense of that general position.
The dairy operation seems above average in its readiness to respond to external
situations. Its internal position is slightly weaker. This SWOT seems to put it above the in both the external and internal environments, giving it a high potential and a high capability and thus classifying it as a “star” – something with a high likelihood of becoming a valuable and profitable enterprise Cropping operations have average internal competency but have slightly higher expectations for capturing value on the external side. The dairy has seems to be better prepared than the crops, meaning that the crops units could be classified as potential “cash cows.” Rather than develop the capabilities of crops, the money earned from it would be used to fund the star of the business, i.e., the dairy.
Not all of the cropping operations could be intuitively considered cash cows. Many
students may think that the higher value crops, the food-grade corn, for instance, would be an enterprise with a bright outlook. Completing a net present value calculation on the proposed expansion of those operations may lead to a reconsideration of that potential. Cash premiums for production tend to erode over time, and there is added management and work.

4
The small beef operation, if it is to be considered at all, has a low internal capability and has no external value. Thus it would be classified a “dog.”
There is little information on the potential hay enterprise, but given what has been said, it
could be classified as a “question mark” – something for further exploration.
How should the business grow? The next step is to assess how business development will occur. This is done by plotting
the product to be sold versus the type of customer focus using the Growth Options Matrix (Annex 3, Matrix 2). Products are either ones currently produced by the firm (old) or ones that the business has never produced before (new). Customers are either current customers (old) or ones the business has not reached before (new). Old products sold to old customers are known as a market penetration approach to growth. New products to old customers are known as product development strategies and focus on using the customer relationship to develop markets for new products. Old products to new customers are referred to as market development strategies. Finally, selling new products to new customers is a diversification strategy.
In assessing MBC Farms, the most likely place for current products and product options
would be as follows: • The dairy operation expansion (an old product to a new customer). MBC Farms, in choosing the dairy for its growth, would pursue strategies related to market development. • The food-grade corn opportunity (expansion of an old product to an old customer, market penetration). • Commodity crops, silage, and alfalfa hay (expansion of an old product to an old customer, market penetration), given that the latter two are still produced on the farm for the dairy (and not outsourced).
Will anything need to change for MBC Farms to undertake an expansion of the dairy? The information in the case indicates that increased management responsibilities will
negatively affect the family lives of the managers. Craig in particular has voiced concern about the lack of time that he has for family activities. To examine the activities that are candidates for elimination or for having someone else do, the “Outsourcing Matrix” can be used (Annex 3, Matrix 3). The Outsourcing Matrix suggests, in a graphical form, how activities required by the business should be treated depending on value of the activity and ability of the firm to do the activity. The Outsourcing matrix presented here is an adaptation on material developed by Richard Insinga and Michael Werle.1
There are two axes in the outsourcing matrix. On the vertical axis is degree the activity
will be, or is, a source of competitive advantage. There are three degrees: first, the activity provides no competitive advantage and is called a “Basic Activity”; second, it might provide an advantage and so is called an “Emerging Activity”; and third, it is required to be competitive and so is called a “Key Activity”. Basic activities are not sources of competitive advantage (they are standard and common activities that could be hired done); emerging activities might provide an advantage (they may provide some value, and are not commonly available); a key activity is clearly an advantage for the business (rare skills/abilities that provide a distinct competitive advantage).
1 “Linking Outsourcing and Strategy.” 14(4): 58-70. The Academy of Management Executive.

5
On the horizontal axis is the ability of the firm to perform the activity well relative to
competitors, either weak or strong. As an example, it could be argued that driving a tractor is a basic activity that provides no
competitive advantage. Tractor drivers do not possess any particularly unique skills that are not readily available. A farm manager should consider hiring someone else to do it in his place or contract someone to do it so that it does not have to occupy the time spent on higher value activities. This eliminates the requirement that the manager supervise employees or possibly even own tillage machinery.
Activities mapped on the Outsourcing Matrix are drawn from the activities performed in
the business and are specified in such a way that they could be custom hired. Basic Activities could include the raising of replacement heifers, which could be raised on contract off farm. Additionally, application of fertilizers could be done on a custom basis, thereby easing the work that Craig would have to do.
MBC has already identified crop marketing as an activity with some possible competitive
value but has recognized that others can do this better, so they collaborate with a marketing firm for those services.
The key activity at MBC Farms appears to be management of the dairy herd to provide
maximum milk production. Additionally, procuring and managing contracts for high-value crops appears also to be a source of competitive advantage. Both of these should continue to be done by people within the business, i.e., done in-house, if they continue to be done.
Labor
Managing the labor required for the dairy will require Betty to gain a set of management
skills that include more management of people than of animals. Her experience on other dairies will be a resource to draw on, but her development as a manager will include some expensive mistakes. The source of labor will affect how MBC Farms operates the dairy. Should Betty be able to hire Hispanics then it is likely she will be able to operate two 10-hour shifts (each shift would milk twice; the shift would change halfway through the second milking) or milk three times a day with shifts of six hours (milking 24 hours a day). In both cases she will supervise a feed manager and a parlor manager (the parlor manager might also be in charge of herd health) as well as each crew: two milkers (one is a crew leader) and possibly a person to shuttle cattle and clean.
Although Jasper County has a base for Hispanics to assimilate into, as a manager Betty will need to be aware of the issues of language, culture, communication, and training as important challenges. She will need to provide performance feedback, daily communication, employee training, and take personal interest in her employees. The language barrier will be important to overcome, as will be becoming culturally sensitive, and being involved in the day-to-day needs of her employees.
To manage the labor Betty would find it useful to create and follow up-to-date job
descriptions. The job description is a practical, relatively simple tool that supports personnel management and employee communications every day. The process of job analysis to create the

6
job description would help Betty clarify what each job entails and how she might carve her current responsibility into new job positions. Additionally she will need to carefully construct wages, incentives and benefits to motivate employees.
Teaching Approach for Finance
Various financial ratios and the net present values of two investment opportunities can be
calculated. Begin by reviewing the current financial state of MBC Farms.
How does MBC Farms perform? One of the more important management decisions a farm manager should make is the
selection of a useful financial reporting system to prepare financial documents for analysis. MBC Farms has presented accrual records. It should be noted that cash accounting systems are widely used in agriculture because the Internal Revenue Code allows most farmers and ranchers to calculate taxable income on the cash basis. A certain amount of flexibility is gained for income tax management purposes, because farm products can be held and sold later in order to delay income to the next accounting period. Or inputs can be prepaid to increase expenses for the current period. So cash accounting has benefits for use in managing taxes. But as a general management tool, cash accounting cannot accurately measure income or business performance, nor can accrual financial ratios be calculated using cash income and expense information.
Accrual accounting provides a more accurate assessment of profitability in a particular
accounting period. Accrual accounting recognizes revenue in the time period in which it was earned (expenses incurred to produce revenues are matched to the period the corresponding revenues are recognized). Cash accounting simply recognizes revenues and expenses when cash actually changed hands (except for depreciation and products transferred in lieu of cash). Thus accrual accounting practices presents a much more accurate picture of the true performance of the business.
For performance analysis to be most useful in agriculture generally requires that
performance measures be calculated using assets valued at both their historical cost and at their market value. Generally the benchmark data that is available, such as from the Illinois FBFM Associations is calculated using market values. So, in order to do a comparative analysis with other farms of similar size and type market value based performance measures are necessary. See Annex 1 for calculations of some of MBC Farm’s ratios. See Annex 2 for more ratios and benchmarks.
Cost value based performance measures are absolutely essential to accurately evaluate
the performance of debt capital used in a business. In this case, MBC Farms’ return on assets (ROA) and return on equity (ROE) are 9.5 and 10.1 percent, based on the historical cost value of the farm’s assets and owner equity, respectively. ROE should be greater than ROA if debt is being used productively. In this case, ROE is greater than ROA, indicating than the firm is efficiently using its debt capital. On a market value basis, ROE is less than ROA, which would have been misleading if used to evaluate the farm’s use of debt capital.

7
Assessing the Investments
There are two phases to assessing whether a project should be undertaken. The first is to
assess its profitability. This is done through net present value. The purpose of the economic profitability analysis is to determine whether the investment project will contribute to the long-run profits of the firm. Even if an alternative is economically profitable, however, it may not be financially feasible, i.e., the cash flows may be insufficient to make the required principal and interest payments. Thus, an assessment of financial feasibility is the second phase. Financial feasibility analysis must be completed before a final decision is made to accept or reject a particular project.
There are six steps to assessing profitability. The steps used to assess each of these are
presented in the attached tables. See Annexes 4 through 8 for the information used for MBC Farms NPV and feasibility assessments.
Step 1. Choose an appropriate discount rate to reflect the time value of money. The
discount rate is used to adjust future flows of income to their present value. The discount rate chosen indicates the minimum acceptable rate of return for an investment; it represents the “cutoff criterion” in judging whether or not an investment will add value to the business. The discount rate used in the analysis is the after tax cost of capital (debt and equity) that must be committed to acquire assets.
Step 2. Calculate the present value of the cash outlay required by the investment. Step 3. Calculate the benefits or annual net cash flow for each year of the investment over
its useful life. Income taxes are computed as:
Cash Revenue
- Cash Expenses
- Depreciation
= Net Taxable Income
Then, Net Taxable Income x Marginal Tax Rate = Taxes Step 4. Calculate the present value of the annual net cash flows. This is done by
multiplying the discount factor for every year by the after tax cash flow, and summing across years.

8
Step 5. Compute the net present value. Net present value is simply computed as the present value of the after tax net cash flows obtained in Step 4 minus the present value of the cash outlay to purchase the investment of Step 2.
Step 6. Accept or reject the investment. In the both cases, the net present values are
positive and can be accepted. Since the investments are of unequal economic lives it is necessary to find a way to
compare them. Using equivalent annual annuity (EAA) the dairy investment as the best investment. Its EAA is calculated as the net present value multiplied by the capitol recovery or amortization factors associated with the years of investment life2. This would be $62,938*0.1490 for the dairy expansion where n = 10 and i = 8%. This equals $9,378. The EAA of the crop investment is $1,858 * .3019 = $561, where n =5 and i = 8%. This clearly indicates that the dairy is the better investment.
The second phase is to assess the financial feasibility of the options, that is, can loan
payments be met without requiring funds from elsewhere in the business. The first step in financial feasibility analysis is to determine the annual net cash flows for
the project. Fortunately, these annual flows have already been calculated as part of the economic profitability analysis. Next, the annual principal and interest payments must be determined based on the loan repayment schedule. Since the annual net cash flows are after-tax and the payment schedule is before-tax, this payment schedule must be adjusted to an after-tax basis by calculating the tax savings from the deductibility of interest and subtracting this savings from the payment schedule. Then, the annual net cash flow is compared to the after-tax annual principal and interest payments to determine if a cash surplus or deficit will occur. If a cash surplus results, the investment project will generate sufficient cash flow to make the loan payments, and the project is financially feasible as well as economically profitable. If a cash deficit results, the project is not financially feasible – it will not generate sufficient cash income to make the loan payments. Cash deficits do not mean that the investment is unprofitable or should not be made; they simply mean that loan servicing requirements will need to be supported by other sources of cash.
Both projects could be undertaken profitably, and both would need some source of
outside funding at some point. With the dairy, it is in the first year in which a large down payment must be made on the purchases. In the crops project, it is when the premium for the crop declines.
2 The formula for calculating the present value of an annuity of $1 for n periods is ⎥⎦
⎤⎢⎣
⎡+− −ni
i
)1(1
Where i is the discount rate and n in the years of life for the investment

9
Annex 1. Ratio Calculations for MBC Farms
Performance can be analyzed by benchmarking four key financial ratios. The top quartile of similar farms based on information from Illinois Farm Business Farm Management Association data is the benchmark used. Here total assets are valued at market, rather than cost, so that they can be compared to benchmarks. See the Farm Financial Standards for more information on how to calculate farm financial ratios.
Operating Profit Margin Computation: net income plus interest expense less a charge for unpaid operators’ labor
and management (unless already included as an expense) all divided by gross revenues. Owner withdrawals are used here as a proxy for the value of the operators’ labor and management.
MBC data: ($280,519 + $98,716 – $150,000) / $1,796,651
Result: 12.8 percent
Comparison: Better dairies are 15.5 percent; grain farms are 13.6 percent.
Asset Turnover Ratio Computation: gross revenues divided by total dollars of farm assets
MBC data: ($1,796,651 / $4,655,476).
Result: 38.6 percent
Comparison: This farm falls below the benchmark for dairies of 49 percent and grain farms 44 percent.
The Return on Assets Computation: net income plus interest less a charge for the unpaid operators’ labor and
management (unless already included as an expense) all divided by total farm assets.
MBC data: ($280,519 + $98,716 –$150,000)/ $4,655,476
Result: 4.9 percent
Comparison: This is below the 7.6% expected of a dairy in the top quartile, or 6.0% for a grains farm.
The Return on Equity Computation: net income less a charge for the unpaid operators’ labor and management
(unless already included as an expense) divided by owner equity
MBC data: ($280,519 – $150,000) / $3,534,037
Result: 3.7 percent
Comparison: This is below the 7.8% expected of dairies and 6.1% for grain farms.
10
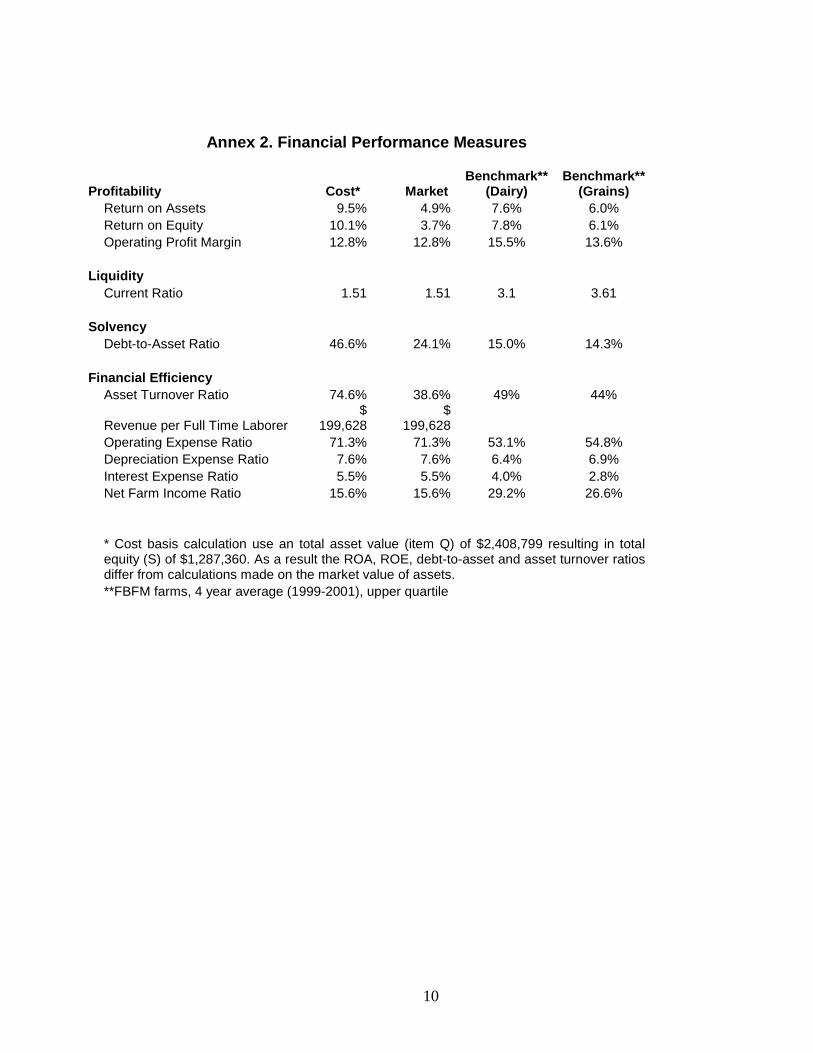
Annex 2. Financial Performance Measures
Profitability Cost* Market Benchmark**
(Dairy) Benchmark**
(Grains) Return on Assets 9.5% 4.9% 7.6% 6.0% Return on Equity 10.1% 3.7% 7.8% 6.1% Operating Profit Margin 12.8% 12.8% 15.5% 13.6% Liquidity Current Ratio 1.51 1.51 3.1 3.61 Solvency Debt-to-Asset Ratio 46.6% 24.1% 15.0% 14.3% Financial Efficiency Asset Turnover Ratio 74.6% 38.6% 49% 44%
Revenue per Full Time Laborer $
199,628 $
199,628 Operating Expense Ratio 71.3% 71.3% 53.1% 54.8% Depreciation Expense Ratio 7.6% 7.6% 6.4% 6.9% Interest Expense Ratio 5.5% 5.5% 4.0% 2.8% Net Farm Income Ratio 15.6% 15.6% 29.2% 26.6%
* Cost basis calculation use an total asset value (item Q) of $2,408,799 resulting in total equity (S) of $1,287,360. As a result the ROA, ROE, debt-to-asset and asset turnover ratios differ from calculations made on the market value of assets.
**FBFM farms, 4 year average (1999-2001), upper quartile

11
Annex 3: Strategy Matrices
Matrix 1. Business Unit Growth Matrix
Matrix 2. Growth Options Matrix

12
Matrix 3. Outsourcing Matrix
13
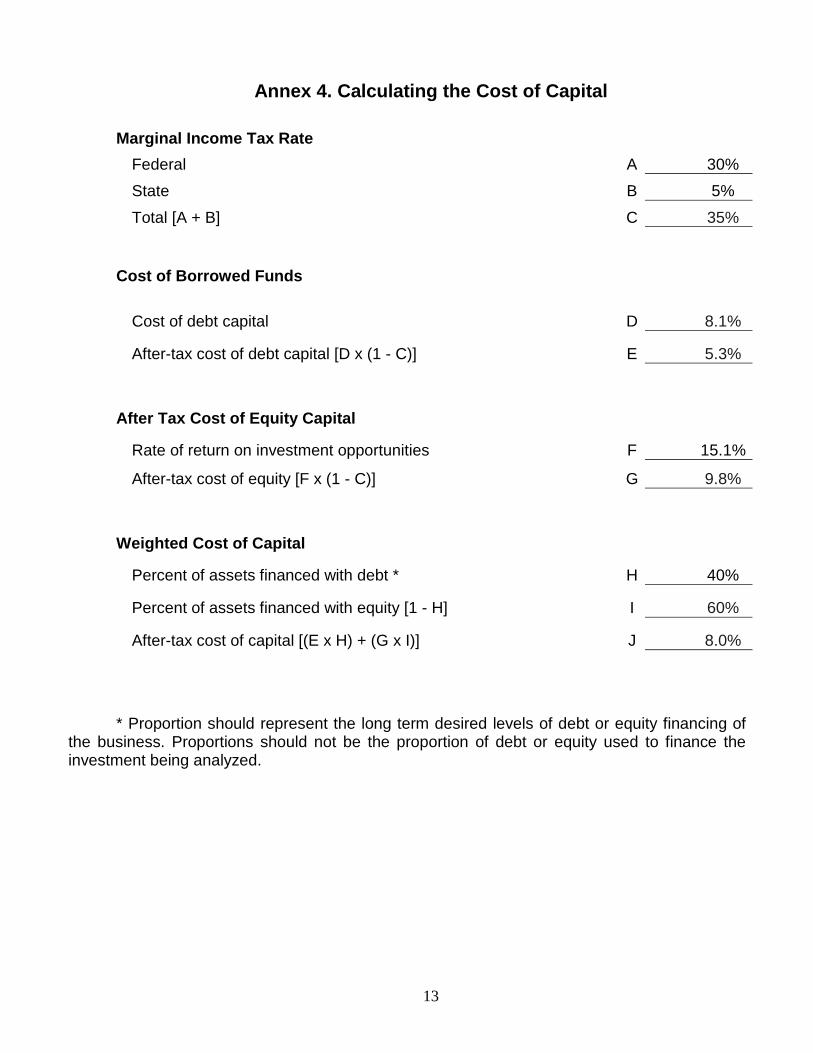
Annex 4. Calculating the Cost of Capital
Marginal Income Tax Rate
Federal A 30%
State B 5%
Total [A + B] C 35%
Cost of Borrowed Funds
Cost of debt capital D 8.1%
After-tax cost of debt capital [D x (1 - C)] E 5.3%
After Tax Cost of Equity Capital
Rate of return on investment opportunities F 15.1%
After-tax cost of equity [F x (1 - C)] G 9.8%
Weighted Cost of Capital
Percent of assets financed with debt * H 40%
Percent of assets financed with equity [1 - H] I 60%
After-tax cost of capital [(E x H) + (G x I)] J 8.0%
* Proportion should represent the long term desired levels of debt or equity financing of the business. Proportions should not be the proportion of debt or equity used to finance the investment being analyzed.

14
Ann
ex 5
. NP
V A
naly
sis
for
Dai
ry E
xpan
sion
Pre
sen
t V
alu
e C
alcu
lati
on
s
A
Cat
tle C
ost (
per
head
) $
1,6
00
B
C
onst
ruct
ion
Cos
t (pe
r he
ad)
$
3
,000
C
Num
ber
milk
ing
cattl
e 35
0
D
Cas
h ou
tlay,
con
stru
ctio
n (B
x C
) $
1,
050,
000
E
Cas
h ou
tlay,
cat
tle (
A x
C)
$
560,
000
F
Tot
al (
D +
E)
$
1,61
0,00
0
G
C
ost o
f Cap
ital
8.0%
H
Tax
Rat
e 35
.0%
Y
ear
1 2
3 4
5 6
7 8
9 10
Cas
h R
even
ue
1,01
5,97
0
1,06
8,22
6
1,16
0,20
9
1,19
7,87
2
1,25
2,61
8
1,26
3,10
4
1,31
5,36
0
1,32
2,09
3
1,38
1,78
4
1,38
9,67
5
C
ash
Exp
ense
s 82
3,16
5
870,
468
85
0,16
7
871,
421
92
8,01
6
951,
216
1,
011,
567
1,
036,
856
1,
101,
200
1,
128,
730
I N
et c
ash
inco
me
192
,805
197,
759
310,
042
326,
451
324,
603
311,
888
303,
793
285,
237
280,
584
2
60,9
45
J T
erm
inal
Val
ue
2
69,0
00
K
Dep
reci
atio
n F
acto
r (1
0yr
for
build
ings
)
0.0
75
0.13
9
0.11
8
0.10
0
0.08
7
0.08
7
0.08
7
0.08
7
0.08
7
0
.087
L D
epre
ciat
ion
Fac
tor
(5yr
for
cattl
e)
0
.150
0.
250
0.
179
0.
167
0.
167
0.
083
-
-
-
-
M
Dep
reci
atio
n T
otal
1
62,7
50
28
5,74
0
22
3,75
5
19
8,50
6
18
5,06
6
13
8,41
8
91
,770
91,7
70
91
,770
91,7
70
N
Net
Inco
me
Bef
ore
Tax
es (
I + J
- M
)
3
0,05
5
(8
7,98
1)
86
,287
127,
945
139,
537
173,
470
212,
023
193,
467
188,
814
4
38,1
75
O
Tax
es (
H x
N)
10
,519
(30,
794)
30,2
00
44
,781
48,8
38
60
,714
74,2
08
67
,713
66,0
85
153
,361
P
Net
cas
h flo
ws
(I -
O)
182
,286
228,
552
279,
841
281,
670
275,
765
251,
173
229,
585
217,
524
214,
499
3
76,5
84
Q
Dis
coun
t Fac
tor
0.
9259
0.85
73
0.
7938
0.73
50
0.
6805
0.63
01
0.
5834
0.54
02
0.
5002
0.46
31
R
Pre
sent
Val
ue o
f Cas
h F
low
(P
* Q
)
1
68,7
78
19
5,93
8
22
2,13
8
20
7,02
7
18
7,65
8
15
8,26
4
13
3,94
0
11
7,50
6
10
7,29
3
174
,396
S
S
um
of
PV
cas
h f
low
s
1,6
72,9
38
T
N
PV
(S
- F
)
62,9
38

15
Annex 6. Profitability Analysis for On-Farm Storage of Specialty Crop Cash Outlay
A Number of Bins 2 B Capacity Per Bin 30,000 C Investment Per Bushel $1.28 D Cash Outlay (A x B x C) $76,800
Annual Net Cash Flows
E Discount Factor 8.0% F Tax Rate 35% Year 1 2 3 4 5 Cash Revenue $42,032 $42,360 $42,122 $41,887 $41,654 Cash Expenses 20,301 20,910 21,242 21,583 21,932
G Net Cash Income 21,731 21,450 20,880 20,305 19,723 H Terminal Value 30,000 I Depreciation 5,760 10,660 9,055 7,695 6,712 J Net Income Before Taxes (G+H-I) 15,971 10,790 11,825 12,609 43,010 K Taxes (F x J) 5,590 3,777 4,139 4,413 15,054 L Net cash flows (G-K) 16,141 17,673 16,741 15,891 34,669 M Discount Factor (rate at E for the year) 0.9259 0.8573 0.7938 0.7350 0.6805 N Present Value of Cash Flow (L x M) 14,945 15,151 13,289 11,680 23,592
O Present Value of Cash Flows (sum of Ns) $78,658
P Net Present Value (O - D) $1,858

16
Ann
ex 7
. Fea
sibi
lity
Ana
lysi
s on
Dai
ry E
xpan
sion
1
Inte
rest
rat
e 8.
30%
2 Le
ngth
of L
oan
(yea
rs)
10
3
Ann
ual P
aym
ent
$194
,555
4 N
et c
ash
flow
s (I
- O
)
18
2,28
6
22
8,55
2
27
9,84
1
28
1,67
0
27
5,76
5
25
1,17
3
22
9,58
5
21
7,52
4
21
4,49
9
37
6,58
4
Y
ear
1 2
3 4
5 6
7 8
9 10
5 Lo
an B
alan
ce (
80%
of c
ap. c
osts
)
1,
288,
000
1,
200,
349
1,
105,
422
1,
002,
617
891,
279
770,
700
640,
112
498,
686
345,
522
179,
645
T
otal
Cap
ital O
utla
y
1,
610,
000
-
-
-
-
-
-
-
-
-
6 In
tere
st o
n Lo
an (
1 x
5)
10
6,90
4
99
,629
91,7
50
83
,217
73,9
76
63
,968
53,1
29
41
,391
28,6
78
14
,911
7 P
rinci
pal P
aym
ent (
3 -
6)
87
,651
94,9
26
10
2,80
5
11
1,33
8
12
0,57
9
13
0,58
7
14
1,42
6
15
3,16
4
16
5,87
7
17
9,64
5
8 In
com
e T
ax S
avin
gs (
6 x
tax
rate
)
37,4
16
34
,870
32,1
13
29
,126
25,8
92
22
,389
18,5
95
14
,487
10,0
37
5,21
9
9 A
fter-
Tax
Pay
men
t Sch
edul
e (3
- 8
)
157,
139
159,
685
162,
443
165,
429
168,
664
172,
167
175,
960
180,
069
184,
518
189,
337
10
Sur
plus
(or
Def
icit)
(4
- 9)
(2
96,8
53)
68
,867
117,
399
116,
241
107,
101
79,0
07
53
,625
37,4
55
29
,981
187,
247

17
Annex 8. Feasibility Analysis for On-Farm Storage of Specialty Crop 1 Interest rate 8.30% 2 Length of Loan (years) 5 3 Annual Payment $19,387 4 Annual after tax cash flows (line L) $16,141 $17,673 $16,741 $15,891 $34,669 Year 1 2 3 4 5
5 Loan Balance 76,800
63,787 49,694 34,431 17,902
6 Interest on Loan (1 x 5) 6,374
5,294 4,125 2,858 1,486
7 Principal Payment (3 - 6) 13,013
14,093 15,263 16,530 17,902
8 Income Tax Savings (6 x tax rate) 2,231
1,853 1,444 1,000 520
9 After-Tax Payment Schedule (3 - 8) 17,156
17,534 17,944 18,387 18,867
10 Surplus or Deficit (4 - 9) ($1,015.13) $139.00 ($1,202.50) ($2,495.82) $15,801.77