teaching electron–positron–photon interactions with...
TRANSCRIPT
232 The Physics Teacher ◆ Vol. 51, April 2013
Feynman diagrams are introduced in many physics textbooks, such as those by Alonso and Finn1 and Serway,2 and their use in physics education has been
discussed by various authors.3-5 They have an appealing simplicity and can give insight into events in the micro-world. Yet students often do not understand their signifi-cance and often cannot combine the basic units of interac-tion—points where the world lines of two fermions and one boson meet—to construct diagrams for observed processes.
We have worked with advanced physics students at the University of Athens, students who expect to become physics teachers, to pinpoint difficulties that they have with Feynman diagrams and to test a hands-on procedure to enhance their understanding and facilitate their ability to construct dia-grams for various processes. In order to keep our initial study as simple as possible, we limited it to interactions among elec-trons, positrons, and photons.
MethodologyWe first enlisted the aid of a group of graduate students to
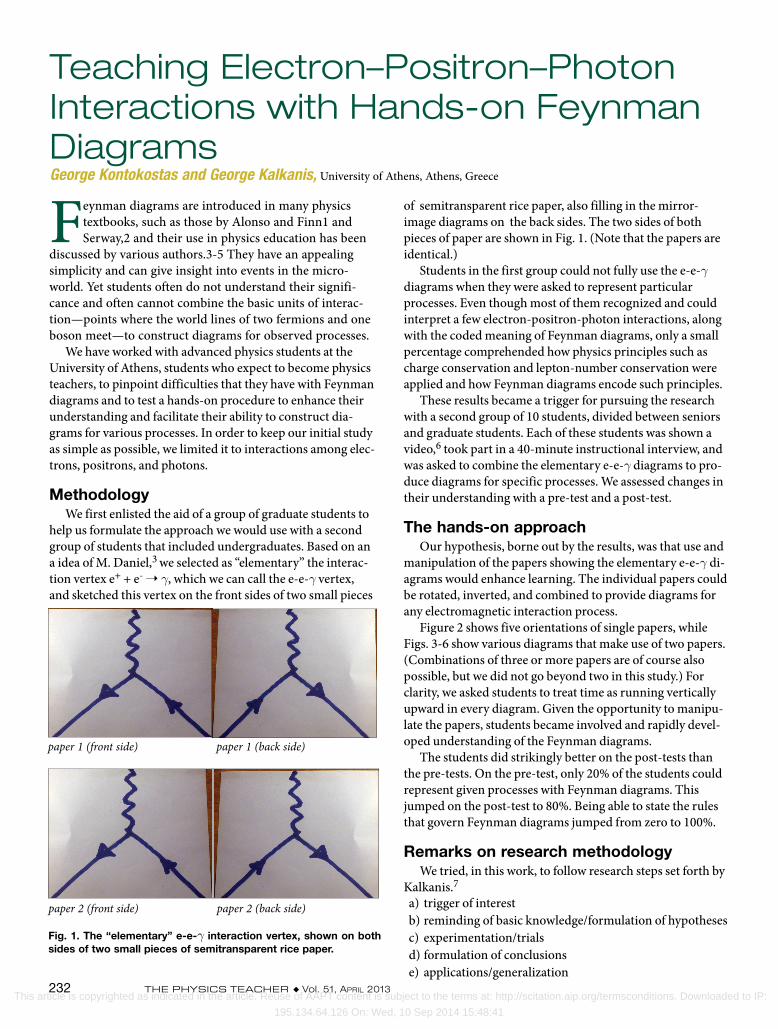
help us formulate the approach we would use with a second group of students that included undergraduates. Based on an a idea of M. Daniel,3 we selected as “elementary” the interac-tion vertex e+ + e- ➝ γ, which we can call the e-e-γ vertex, and sketched this vertex on the front sides of two small pieces
of semitransparent rice paper, also filling in the mirror-image diagrams on the back sides. The two sides of both pieces of paper are shown in Fig. 1. (Note that the papers are identical.)
Students in the first group could not fully use the e-e-γ diagrams when they were asked to represent particular processes. Even though most of them recognized and could interpret a few electron-positron-photon interactions, along with the coded meaning of Feynman diagrams, only a small percentage comprehended how physics principles such as charge conservation and lepton-number conservation were applied and how Feynman diagrams encode such principles.
These results became a trigger for pursuing the research with a second group of 10 students, divided between seniors and graduate students. Each of these students was shown a video,6 took part in a 40-minute instructional interview, and was asked to combine the elementary e-e-γ diagrams to pro-duce diagrams for specific processes. We assessed changes in their understanding with a pre-test and a post-test.
The hands-on approachOur hypothesis, borne out by the results, was that use and
manipulation of the papers showing the elementary e-e-γ di-agrams would enhance learning. The individual papers could be rotated, inverted, and combined to provide diagrams for any electromagnetic interaction process.
Figure 2 shows five orientations of single papers, while Figs. 3-6 show various diagrams that make use of two papers. (Combinations of three or more papers are of course also possible, but we did not go beyond two in this study.) For clarity, we asked students to treat time as running vertically upward in every diagram. Given the opportunity to manipu-late the papers, students became involved and rapidly devel-oped understanding of the Feynman diagrams.
The students did strikingly better on the post-tests than the pre-tests. On the pre-test, only 20% of the students could represent given processes with Feynman diagrams. This jumped on the post-test to 80%. Being able to state the rules that govern Feynman diagrams jumped from zero to 100%.
Remarks on research methodologyWe tried, in this work, to follow research steps set forth by
Kalkanis.7 a) trigger of interest b) reminding of basic knowledge/formulation of hypotheses c) experimentation/trials d) formulation of conclusions e) applications/generalization
Teaching Electron–Positron–Photon Interactions with Hands-on Feynman DiagramsGeorge Kontokostas and George Kalkanis, University of Athens, Athens, Greece
paper 1 (front side) paper 1 (back side)
paper 2 (front side) paper 2 (back side)
Fig. 1. The “elementary” e-e-γ interaction vertex, shown on both sides of two small pieces of semitransparent rice paper.
This article is copyrighted as indicated in the article. Reuse of AAPT content is subject to the terms at: http://scitation.aip.org/termsconditions. Downloaded to IP:
195.134.64.126 On: Wed, 10 Sep 2014 15:48:41

The Physics Teacher ◆ Vol. 51, April 2013 233
Regarding step e): We left the students with the challenge of carrying out similar exercises for the weak interaction involving the W and Z bosons and the strong interaction in-volving gluons.
Results, the evaluationThe hands-on manipulation of elementary interaction
vertices to generate Feynman diagrams for various processes seems to have clear value in student motivation and in stu-dent learning.
References1. M. Alonso and E. Finn, Fundamental University Physics, Vol. II
(Addison-Wesley Publishing Company, 1967).
2(a) 2(b) 2(c) 2(d) 2(e) Fig. 2. (a) Annihilation of electron, creation of electron, creation of photon e- ➝ e- + γ; (b) annihilation of electron, annihilation of pho-ton, creation of electron e- + γ ➝ e-; (c) annihilation of photon, creation of positron, creation of electron γ ➝ e+ + e-; (d) annihilation of positron, creation of photon, creation of positron e+ ➝ e+ + γ; (e) annihilation of positron, annihilation of photon, creation of positron e+ + γ ➝ e+.
Fig. 3. This combination of the two papers illustrates the interaction of two electrons, exchanging a vir-tual photon, known as electron-electron scattering e-+e - ➝e-+ e-.
Fig. 4. This combination of the two papers illustrates the interaction between an electron and a positron, known as electron-positron anihilation e++e - ➝γ+ γ.
2. R. A. Serway, Physics, Vol. IV (Saunders Golden Sunburst Series, 1990).
3. M. Daniel, “Particles, Feynman diagrams and all that,” Phys. Educ. 41 (2), 119–129 (2006).
4. P. Dune, “Looking for consistency in the construction and use of Feynman diagrams,” Phys. Educ. 36 (5), 366–374 (2001).
5. K. Kumericki, “Feynman Diagrams for Beginners,” in Notes at the Adriatic School on Particle Physics (Croatia, 2001).
6. G. Kontokostas, “Feynman Diagrams Video,” micro-kos-mos.uoa.gr (2011).
7. G. Kalkanis, “Scientific Educational Method,” micro-kos-mos.uoa.gr (2004).
[email protected]@primedu.uoa.gr
Fig. 5. This combination of the two papers (the inverse of Fig. 4) illustrates the interaction of two photons, known as pair production γ +γ ➝ e- + e+. (One of those photons is normally part of a strong static field that interacts with a high energy passing photon.)
Fig. 6. This combination of the two papers illustrates the interaction between an electron and a photon, known as electron-photon scattering e- + γ ➝e- + γ (also called Compton scattering).
This article is copyrighted as indicated in the article. Reuse of AAPT content is subject to the terms at: http://scitation.aip.org/termsconditions. Downloaded to IP:
195.134.64.126 On: Wed, 10 Sep 2014 15:48:41