teachers' and state employees' retirement system€¦ · we have completed a financial...
TRANSCRIPT

TEACHERS’ AND STATE EMPLOYEES’
RETIREMENT SYSTEM RALEIGH, NORTH CAROLINA
FINANCIAL AUDIT OF THE SCHEDULE OF EMPLOYER ALLOCATIONS AND
THE SCHEDULE OF PENSION AMOUNTS BY EMPLOYER FOR THE YEAR ENDED JUNE 30, 2014
STATE OF NORTH CAROLINA OFFICE OF THE STATE AUDITOR
BETH A. WOOD, CPA

STATE OF NORTH CAROLINA Office of the State Auditor
Beth A. Wood, CPA State Auditor
2 S. Salisbury Street 20601 Mail Service Center Raleigh, NC 27699-0601
Telephone: (919) 807-7500 Fax: (919) 807-7647
http://www.ncauditor.net
AUDITOR’S TRANSMITTAL
The Honorable Pat McCrory, Governor Members of the General Assembly of North Carolina The Honorable Janet Cowell, State Treasurer Department of State Treasurer
We have completed a financial audit of the Teachers’ and State Employees’ Retirement System Schedule of Employer Allocations for the year ended June 30, 2014 and June 30, 2013 and the Schedule of Pension Amounts by Employer for the year ended June 30, 2014, and our audit results are included in this report. You will note from the independent auditor’s report that we determined that the Schedule of Employer Allocations and the Schedule of Pension Amounts by Employer are presented fairly in all material respects.
The results of our tests disclosed no deficiencies in internal control over financial reporting that we consider to be material weaknesses in relation to our audit scope or any instances of noncompliance or other matters that are required to be reported under Government Auditing Standards.
North Carolina General Statutes require the State Auditor to make audit reports available to the public. Copies of audit reports issued by the Office of the State Auditor may be obtained through one of the options listed in the back of this report.
Beth A. Wood, CPA State Auditor

TABLE OF CONTENTS
PAGE
INDEPENDENT AUDITOR’S REPORT .................................................................... 1
ELEMENT OF THE FINANCIAL STATEMENTS
EMPLOYER ALLOCATION SCHEDULES
Schedule 1 Schedule of Employer Allocations, June 30, 2014 .............. 3
Schedule 2 Schedule of Employer Allocations, June 30, 2013 .............. 9
Schedule 3 Schedule of Pension Amounts by Employer, June 30, 2014 ................................................... 16
Notes to the Employer Allocation Schedules ....................................... 26
INDEPENDENT AUDITOR’S REPORT ON INTERNAL CONTROL OVER FINANCIAL REPORTING AND ON COMPLIANCE AND OTHER MATTERS BASED ON AN AUDIT OF FINANCIAL STATEMENTS PERFORMED IN ACCORDANCE WITH GOVERNMENT AUDITING STANDARDS ............................... 31
ORDERING INFORMATION ............................................................................... 33
Beth A. Wood, CPA
State Auditor
Article V, Chapter 147 of the North Carolina General Statutes, gives the Auditor broad powers to examine all books, records, files, papers, documents, and financial affairs of every state agency. The Auditor also has the power to summon people to produce records and to answer questions under oath.
STATE OF NORTH CAROLINA Office of the State Auditor
Beth A. Wood, CPA State Auditor
1
2 S. Salisbury Street 20601 Mail Service Center Raleigh, NC 27699-0601
Telephone: (919) 807-7500 Fax: (919) 807-7647
http://www.ncauditor.net
INDEPENDENT AUDITOR’S REPORT
The Honorable Pat McCrory, Governor Members of the General Assembly of North Carolina The Honorable Janet Cowell, State Treasurer Department of State Treasurer
Report on the Schedules
We have audited the accompanying Schedule of Employer Allocations of the Teachers’ and State Employee’s Retirement System as of and for the years ended June 30, 2014 and June 30, 2013, and the related notes. We have also audited the total for all entities of the columns titled net pension liability, total deferred outflows of resources, total deferred inflows of resources, and total pension expense included in the accompanying Schedule of Pension Amounts by Employer of the Teachers’ and State Employee’s Retirement System as of and for the year ended June 30, 2014, and the related notes (hereafter referred to as “the Schedules”).
Management’s Responsibility for the Schedules
Management is responsible for the preparation and fair presentation of these Schedules in accordance with accounting principles generally accepted in the United States of America; this includes the design, implementation, and maintenance of internal control relevant to the preparation and fair presentation of Schedules that are free from material misstatement, whether due to fraud or error.
Auditor’s Responsibility
Our responsibility is to express an opinion on the Schedules based on our audit. We conducted our audit in accordance with auditing standards generally accepted in the United States of America and the standards applicable to financial audits contained in Government Auditing Standards, issued by the Comptroller General of the United States. Those standards require that we plan and perform the audit to obtain reasonable assurance about whether the Schedules are free from material misstatement.
An audit involves performing procedures to obtain audit evidence about the amounts and disclosures in the Schedules. The procedures selected depend on the auditor’s judgment, including the assessment of the risks of material misstatement of the Schedules, whether due to fraud or error. In making those risk assessments, the auditor considers internal control relevant to the entity’s preparation and fair presentation of the Schedules in order to design

2
INDEPENDENT AUDITOR’S REPORT
audit procedures that are appropriate in the circumstances, but not for the purpose of expressing an opinion on the effectiveness of the entity’s internal control. Accordingly, we express no such opinion. An audit also includes evaluating the appropriateness of accounting policies used and the reasonableness of significant accounting estimates made by management, as well as evaluating the overall presentation of the Schedules.
We believe that the audit evidence we have obtained is sufficient and appropriate to provide a basis for our audit opinion.
Opinion
In our opinion, the Schedules referred to above present fairly, in all material respects, the employer allocations as of and for the years ended June 30, 2014 and June 30, 2013 and net pension liability, total deferred outflows of resources, total deferred inflows of resources, and total pension expense for the total of all participating entities of the Teachers’ and State Employee’s Retirement System as of and for the year ended June 30, 2014, in accordance with accounting principles generally accepted in the United States of America.
Other Matter
We have audited, in accordance with auditing standards generally accepted in the United States of America, the pension plans included in the State’s Comprehensive Annual Financial Report (CAFR) as of and for the year ended June 30, 2014, and our report thereon, dated December 2, 2014, expressed an unmodified opinion on those financial statements.
Other Reporting Required by Government Auditing Standards
In accordance with Government Auditing Standards, we have also issued our report dated June 16, 2015 on our consideration of the entity’s internal control over financial reporting and on our tests of its compliance with certain provisions of laws, regulations, contracts, and grant agreements and other matters. The purpose of that report is to describe the scope of our testing of internal control over financial reporting and compliance and the results of that testing, and not to provide an opinion on internal control over financial reporting or on compliance. That report is an integral part of an audit performed in accordance with Government Auditing Standards in considering the entity’s internal control over financial reporting and compliance.
Restriction on Use
Our report is intended solely for the information and use of the Teachers’ and State Employee’s Retirement System Management, the Teachers’ and State Employee’s Retirement System Plan employers and their auditors and the North Carolina Office of the State Controller and is not intended to be and should not be used by anyone other than these specified parties.
Beth A. Wood, CPA State Auditor
Raleigh, North Carolina
June 16, 2015

SCHEDULES

Teachers' and State Employees' Retirement System Schedule of Employer AllocationsJune 30, 2014 Schedule 1
Present Value of Present Value of Future Salary
Employer Future Salary Allocation
10200 North Carolina Education Lottery $ 125,875,016 0.11096%
10400 Department of Justice 541,193,266 0.47707%
10500 State Auditor 82,158,435 0.07242%
10700 Department of Cultural Resources 216,068,759 0.19047%
10800 Administrative Office of the Courts 2,247,271,769 1.98101%
10850 Office of Administrative Hearings 13,595,179 0.01198%
10900 Department of Administration 210,591,814 0.18564%
10910 Office of State Budget & Management 33,775,982 0.02977%
10930 Information Technology Services 274,428,668 0.24191%
10940 Office of State Controller 96,882,896 0.08540%
10950 N.C. School of Science & Mathematics 75,826,281 0.06684%
11300 Environment and Natural Resources 966,520,192 0.85201%
11310 N.C. Housing Finance Agency 58,607,338 0.05166%
11600 Wildlife Resources Commission 252,063,194 0.22220%
11900 State Board of Elections 25,116,931 0.02214%
12100 Governor's Office 28,577,749 0.02519%
12150 Lt. Governor's Office 3,820,193 0.00337%
12160 General Assembly 209,553,279 0.18473%
12220 Health & Human Services 5,583,055,974 4.92157%
12510 Department of Commerce 718,987,833 0.63380%
12600 Insurance Department 178,347,430 0.15722%
12700 Labor Department 140,428,632 0.12379%
13500 Revenue Department 481,434,474 0.42439%
13700 Secretary of State 65,346,540 0.05760%
14200 N.C. Cemetary Commission - 0.00000%
14300 State Treasurer 175,175,495 0.15442%
18400 Department of Agriculture 650,820,400 0.57371%
18600 Barber Examiners, State Board of 2,771,208 0.00244%
18640 North Carolina Board of Opticians 201,818 0.00018%
18670 State Board of Examiners for Electrical Contractors 402,388 0.00035%
18690 N.C. Real Estate Commission 1,355,717 0.00120%
18740 N.C. Auctioneers Licensing Board 777,109 0.00069%
18780 N.C. State Board of Examiners of Practicing Psychol 1,427,991 0.00126%
19005 Community Colleges Administration 91,565,851 0.08072%
19100 Department of Public Safety 7,858,005,194 6.92697%
20100 Appalachian State University 639,353,678 0.56360%
20200 N.C. School of the Arts 92,199,449 0.08128%
20300 East Carolina University 1,556,985,561 1.37251%
20400 Elizabeth City State University 167,303,736 0.14748%
20600 Fayetteville State University 239,879,573 0.21146%
20700 N.C. A&T University 468,236,580 0.41276%
20800 N.C. Central University 444,107,637 0.39149%
20900 University of North Carolina at Greensboro 601,536,582 0.53027%
21200 UNC - Pembroke 187,411,021 0.16521%
21300 N.C. State University 2,434,423,286 2.14599%
21520 UNC-CH CB 1260 3,657,566,926 3.22422%
21525 UNC-General Administration 156,407,774 0.13788%
21550 UNC Health Care System 4,147,041,931 3.65570%
EmployerNumber
3

Teachers' and State Employees' Retirement System Schedule of Employer AllocationsJune 30, 2014 Schedule 1
Present Value of Present Value of Future Salary
Employer Future Salary AllocationEmployerNumber
21570 University of North Carolina Press 21,202,873 0.01869%
21800 Western Carolina University 332,511,299 0.29312%
21900 Winston-Salem State University 279,823,236 0.24667%
22000 Department of Public Instruction 505,505,338 0.44561%
23000 University of North Carolina at Asheville 134,469,962 0.11854%
23100 University of North Carolina at Charlotte 769,223,434 0.67809%
23200 University of North Carolina at Wilmington 413,194,333 0.36424%
30000 Yancey County Schools 115,662,913 0.10196%
30100 Alamance County Schools 954,813,515 0.84169%
30102 Clover Garden Charter School 13,868,429 0.01223%
30103 River Mill Academy Charter 19,508,237 0.01720%
30104 The Hawbridge School 7,903,161 0.00697%
30105 Alamance Community College 94,140,537 0.08299%
30200 Alexander County Schools 229,894,082 0.20266%
30300 Alleghany County Schools 76,339,270 0.06729%
30400 Anson County Schools 144,695,518 0.12755%
30405 South Piedmont Community College 85,309,439 0.07520%
30500 Ashe County Schools 147,857,004 0.13034%
30600 Avery County Schools 114,993,041 0.10137%
30601 Grandfather Academy 2,394,288 0.00211%
30700 Beaufort County Schools 295,328,859 0.26034%
30705 Beaufort County Community College 58,070,323 0.05119%
30800 Bertie County Schools 129,890,794 0.11450%
30900 Bladen County Schools 209,001,258 0.18424%
30905 Bladen Community College 46,104,536 0.04064%
31000 Brunswick County Schools 543,642,618 0.47923%
31005 Brunswick Community College 54,354,741 0.04791%
31100 Buncombe County Schools 1,127,666,745 0.99406%
31101 F. Delany New School for Children 8,669,252 0.00764%
31102 Evergreen Community Charter School 17,775,261 0.01567%
31105 Asheville-Buncombe Technical College 177,541,546 0.15651%
31110 Asheville City Schools 254,746,003 0.22456%
31200 Burke County Schools 575,442,520 0.50726%
31205 Western Piedmont Community College 77,758,787 0.06855%
31300 Cabarrus County Schools 1,208,455,955 1.06528%
31301 Carolina International School 20,358,297 0.01795%
31320 Kannapolis City Schools 249,871,211 0.22027%
31400 Caldwell County Schools 537,609,886 0.47391%
31405 Caldwell Community College 119,760,969 0.10557%
31500 Camden County Schools 86,225,686 0.07601%
31600 Carteret County Schools 368,978,290 0.32526%
31601 Cape Lookout Marine Science H.S. 1,019,170 0.00090%
31605 Carteret Community College 54,168,931 0.04775%
31700 Caswell County Schools 108,494,603 0.09564%
31800 Catawba County Schools 706,452,624 0.62275%
31805 Catawba Valley Community College 139,952,636 0.12337%
31810 Hickory City Schools 170,249,645 0.15008%
31820 Newton-Conover City Schools 143,482,547 0.12648%
31900 Chatham County Schools 393,833,896 0.34717%
4

Teachers' and State Employees' Retirement System Schedule of Employer AllocationsJune 30, 2014 Schedule 1
Present Value of Present Value of Future Salary
Employer Future Salary AllocationEmployerNumber
32000 Cherokee County Schools 152,889,631 0.13478%
32005 Tri-County Community College 36,305,112 0.03200%
32100 Edenton-Chowan County Schools 108,982,605 0.09607%
32200 Clay County Schools 60,902,481 0.05369%
32300 Cleveland County Schools 716,859,181 0.63193%
32305 Cleveland Technical College 68,859,564 0.06070%
32400 Columbus County Schools 249,812,393 0.22021%
32405 Southeastern Community College 70,377,294 0.06204%
32410 Whiteville City Schools 97,801,380 0.08621%
32420 SEGS Academy 2,510,019 0.00221%
32500 New Bern/Craven County Board of Education 578,471,469 0.50993%
32505 Craven Community College 82,115,587 0.07239%
32600 Cumberland County Schools 2,138,089,662 1.88477%
32605 Fayetteville Technical Community College 285,790,550 0.25193%
32700 Currituck County Schools 166,659,207 0.14691%
32800 Dare County Schools 240,560,155 0.21206%
32900 Davidson County Schools 741,693,883 0.65382%
32901 Invest Collegiate Charter School 2,078,565 0.00183%
32905 Davidson County Community College 116,177,753 0.10241%
32910 Lexington City Schools 147,437,069 0.12997%
32920 Thomasville City Schools 114,454,678 0.10089%
33000 Davie County Schools 290,598,325 0.25617%
33001 N.E. Regional School for Biotechnology 4,903,565 0.00432%
33027 Cornerstone Academy 15,798,022 0.01393%
33100 Duplin County Schools 390,582,461 0.34431%
33105 James Sprunt Technical College 52,367,154 0.04616%
33200 Durham Public Schools 1,686,087,118 1.48632%
33202 Central Park School for Children 16,799,414 0.01481%
33203 Healthy Start Academy 13,646,701 0.01203%
33204 Voyager Academy 45,527,955 0.04013%
33205 Durham Technical Institute 139,355,171 0.12284%
33206 Bear Grass Charter School 11,206,326 0.00988%
33300 Edgecombe County Schools 259,992,987 0.22919%
33305 Edgecombe Technical College 73,693,359 0.06496%
33400 Winston-Salem-Forsyth County Schools 2,263,892,217 1.99566%
33402 Arts Based Elementary Charter 15,853,402 0.01398%
33403 Downtown Middle - 0.00000%
33405 Forsyth Technical Institute 232,586,218 0.20503%
33500 Franklin County Schools 367,900,104 0.32431%
33501 A Childs Garden Charter (AKA Cross Creek Charter) 6,930,631 0.00611%
33600 Gaston County Schools 1,171,889,066 1.03304%
33605 Gaston College 171,246,387 0.15096%
33700 Gates County Schools 92,125,008 0.08121%
33800 Graham County Schools 63,414,262 0.05590%
33900 Granville County Schools and Oxford Orphanage 344,909,160 0.30404%
34000 Greene County Schools 154,857,377 0.13651%
34100 Guilford County Schools 3,461,689,627 3.05155%
34105 Guilford Technical Community College 305,566,296 0.26936%
34200 Halifax County Schools 167,186,003 0.14738%
5

Teachers' and State Employees' Retirement System Schedule of Employer AllocationsJune 30, 2014 Schedule 1
Present Value of Present Value of Future Salary
Employer Future Salary AllocationEmployerNumber
34205 Halifax Community College 58,229,037 0.05133%
34220 Roanoke Rapids City Schools 122,501,074 0.10799%
34230 Weldon City Schools 57,153,773 0.05038%
34300 Harnett County Schools 830,833,789 0.73240%
34400 Haywood County Schools 333,431,998 0.29393%
34405 Haywood Technical College 71,308,288 0.06286%
34500 Henderson County Schools 561,254,120 0.49476%
34501 Mountain Community School 6,443,482 0.00568%
34505 Blue Ridge Community College 72,512,210 0.06392%
34600 Hertford County Schools 145,106,291 0.12791%
34605 Roanoke-Chowan Community College 32,668,377 0.02880%
34700 Hoke County Schools 360,783,274 0.31804%
34800 Hyde County Schools 39,251,773 0.03460%
34900 Iredell County Schools 855,060,410 0.75375%
34901 American Renaissance Middle School 22,010,113 0.01940%
34903 Success Institute 2,395,619 0.00211%
34905 Mitchell Community College 87,812,780 0.07741%
34910 Mooresville City Schools 239,147,085 0.21081%
35000 Jackson County Schools 163,163,973 0.14383%
35005 Southwestern Community College 80,177,765 0.07068%
35100 Johnston County Schools 1,420,194,885 1.25193%
35105 Johnston Technical College 137,255,681 0.12099%
35106 Neuse Charter School 25,557,546 0.02253%
35200 Jones County Schools 63,279,798 0.05578%
35300 Sanford-Lee County Board of Education 406,497,566 0.35834%
35305 Central Carolina Community College 140,020,549 0.12343%
35400 Lenoir County Schools 357,616,417 0.31525%
35401 Childrens Village Academy 2,619,768 0.00231%
35402 Kinston Charter Academy - 0.00000%
35405 Lenoir County Community College 122,797,133 0.10825%
35500 Lincoln County Schools 478,650,981 0.42194%
35600 Macon County Schools 193,368,453 0.17046%
35700 Madison County Schools 112,643,954 0.09930%
35800 Martin County Schools 167,445,333 0.14761%
35805 Martin Community College 23,009,953 0.02028%
35900 Mcdowell County Schools 291,258,951 0.25675%
35905 Mcdowell Technical College 42,567,947 0.03752%
36000 Charlotte-Mecklenburg County Schools 6,463,438,405 5.69764%
36001 Community Charter School 5,966,679 0.00526%
36002 Kennedy Charter 23,457,170 0.02068%
36003 Community School of Davidson 49,211,137 0.04338%
36004 Corvian Community School 9,789,900 0.00863%
36005 Central Piedmont Community College 526,494,118 0.46411%
36006 Lake Norman Charter School 60,452,238 0.05329%
36007 Socrates Academy 20,549,212 0.01811%
36008 Pine Lake Prep Charter 58,266,168 0.05136%
36009 Charlotte Secondary Charter 11,475,455 0.01012%
36100 Mitchell County Schools 89,730,523 0.07910%
36102 KIPP Charlotte Charter 18,769,234 0.01655%
6

Teachers' and State Employees' Retirement System Schedule of Employer AllocationsJune 30, 2014 Schedule 1
Present Value of Present Value of Future Salary
Employer Future Salary AllocationEmployerNumber
36105 Mayland Technical College 47,656,906 0.04201%
36200 Montgomery County Schools 181,439,445 0.15994%
36205 Montgomery Community College 28,881,219 0.02546%
36300 Moore County Schools 549,682,748 0.48456%
36301 Academy of Moore County 5,632,810 0.00497%
36302 Stars Charter School 11,944,427 0.01053%
36305 Sandhills Community College 109,598,330 0.09661%
36400 Nash-Rocky Mount Schools 626,815,460 0.55255%
36405 Nash Technical College 101,478,867 0.08946%
36500 New Hanover County Schools 1,162,560,484 1.02482%
36501 Cape Fear Center for Inquiry 12,518,955 0.01104%
36502 Wilmington Preperatory Academy 5,135,905 0.00453%
36505 Cape Fear Community College 244,238,104 0.21530%
36600 Northampton County Schools 99,573,188 0.08778%
36601 Gaston College Preparatory Charter 34,710,835 0.03060%
36700 Onslow County Schools 1,023,254,242 0.90202%
36701 ZECA School of the Arts and Technology 2,489,854 0.00219%
36705 Coastal Carolina Community College 115,474,116 0.10179%
36800 Orange County Schools 372,073,041 0.32799%
36801 PACE Academy 7,050,908 0.00622%
36802 Orange Charter School 9,842,515 0.00868%
36810 Chapel Hill - Carboro City Schools 713,421,404 0.62889%
36900 Pamlico County Schools 72,140,716 0.06359%
36901 Arapahoe Charter School 20,870,686 0.01840%
36905 Pamlico Community College 23,681,046 0.02088%
37000 Elizabeth City and Pasquotank County Schools 241,097,585 0.21253%
37005 College of the Albemarle 62,113,824 0.05475%
37100 Pender County Schools 333,193,402 0.29372%
37200 Perquimans County Schools 81,601,290 0.07193%
37300 Person County Schools 213,182,063 0.18792%
37301 Roxboro Community School 19,157,980 0.01689%
37305 Piedmont Community College 80,956,356 0.07136%
37400 Pitt County Schools 1,024,377,610 0.90301%
37405 Pitt Community College 213,831,361 0.18850%
37500 Polk County Schools 116,636,906 0.10282%
37600 Randolph County Schools 747,002,006 0.65850%
37601 Uwharrie Charter Academy 4,770,181 0.00421%
37605 Randolph Community College 84,450,341 0.07444%
37610 Asheboro City Schools 236,096,506 0.20812%
37700 Richmond County Schools 307,540,807 0.27110%
37705 Richmond Technical College 88,658,404 0.07815%
37800 Robeson County Schools 946,740,664 0.83457%
37801 Southeastern Academy Charter School 3,532,803 0.00311%
37805 Robeson Community College 93,131,487 0.08210%
37900 Rockingham County Schools 562,244,161 0.49563%
37901 Bethany Community Middle School 7,064,694 0.00623%
37905 Rockingham Community College 62,425,827 0.05503%
38000 Rowan-Salisbury School System 820,799,191 0.72355%
38005 Rowan-Cabarrus Community College 162,161,394 0.14295%
7

Teachers' and State Employees' Retirement System Schedule of Employer AllocationsJune 30, 2014 Schedule 1
Present Value of Present Value of Future Salary
Employer Future Salary AllocationEmployerNumber
38100 Rutherford County Schools 379,739,955 0.33475%
38105 Isothermal Community College 79,682,972 0.07024%
38200 Sampson County Schools 371,779,227 0.32773%
38205 Sampson Community College 55,791,740 0.04918%
38210 Clinton City Schools 132,462,535 0.11677%
38300 Scotland County Schools 287,240,246 0.25321%
38400 Stanly County Schools 360,886,045 0.31813%
38402 Gray Stone Day School 12,368,795 0.01090%
38405 Stanly Community College 88,057,203 0.07762%
38500 Stokes County Schools 297,704,591 0.26243%
38600 Surry County Schools 352,293,319 0.31055%
38601 Bridges Charter Schools 3,894,044 0.00343%
38602 Millennium Charter Academy 16,983,404 0.01497%
38605 Surry Community College 97,424,407 0.08588%
38610 Mount Airy City Schools 73,255,494 0.06458%
38620 Elkin City Schools 56,880,230 0.05014%
38700 Swain County Schools 96,145,955 0.08475%
38701 Mountain Discovery Charter 7,324,970 0.00646%
38800 Transylvania County Schools 171,575,529 0.15125%
38801 Brevard Academy Charter School 10,726,343 0.00946%
38900 Tyrrell County Schools 37,406,794 0.03297%
39000 Union County Schools 1,732,499,589 1.52723%
39100 Vance County Schools 288,861,250 0.25464%
39101 Vance Charter School 20,254,753 0.01785%
39105 Vance-Granville Community College 116,164,660 0.10240%
39200 Wake County Schools 6,778,726,167 5.97558%
39201 Endeavor Charter School 18,654,988 0.01644%
39204 Southern Wake Academy 8,339,918 0.00735%
39205 Wake Technical College 502,683,401 0.44313%
39208 East Wake Academy 43,773,233 0.03859%
39209 Casa Esperanza Montessori 18,153,529 0.01600%
39300 Warren County Schools 107,204,909 0.09450%
39301 Haliwa-Saponi Tribal Charter 8,121,677 0.00716%
39400 Washington County Schools 81,156,023 0.07154%
39401 Henderson Collegiate Charter School 12,603,810 0.01111%
39500 Watauga County Schools 223,420,025 0.19695%
39501 Two Rivers Community School 8,017,921 0.00707%
39600 Wayne County Schools 734,640,810 0.64760%
39605 Wayne Community College 105,866,014 0.09332%
39700 Wilkes County Schools 432,677,290 0.38141%
39703 Pinnacle Classical Academy 7,307,104 0.00644%
39705 Wilkes Community College 100,620,838 0.08870%
39800 Wilson County Schools 493,905,757 0.43539%
39805 Wilson Community College 55,725,776 0.04912%
39900 Yadkin County Schools 240,367,722 0.21189%
51000 Highway - Administrative 4,200,458,895 3.70279%
Total $ 113,440,528,077 $ 100.00000%
The accompanying notes to the schedules are an integral part of this schedule.
8
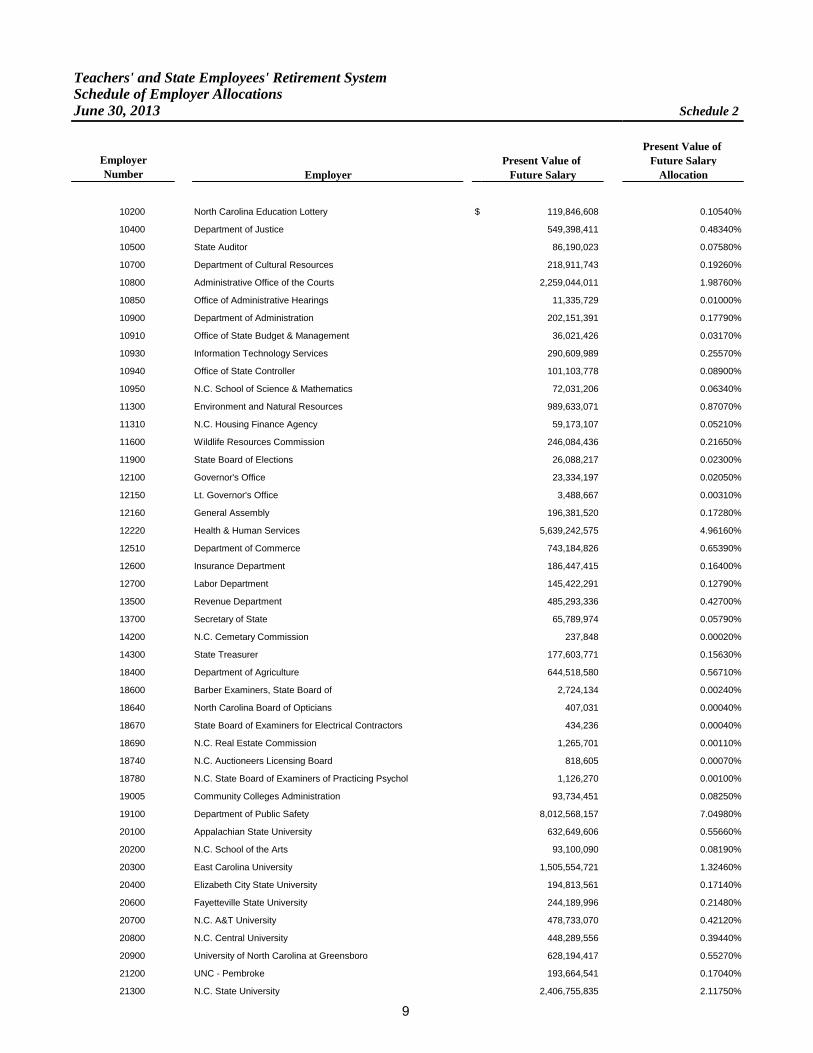
Teachers' and State Employees' Retirement System Schedule of Employer AllocationsJune 30, 2013 Schedule 2
Present Value of Present Value of Future Salary
Employer Future Salary Allocation
10200 North Carolina Education Lottery $ 119,846,608 0.10540%
10400 Department of Justice 549,398,411 0.48340%
10500 State Auditor 86,190,023 0.07580%
10700 Department of Cultural Resources 218,911,743 0.19260%
10800 Administrative Office of the Courts 2,259,044,011 1.98760%
10850 Office of Administrative Hearings 11,335,729 0.01000%
10900 Department of Administration 202,151,391 0.17790%
10910 Office of State Budget & Management 36,021,426 0.03170%
10930 Information Technology Services 290,609,989 0.25570%
10940 Office of State Controller 101,103,778 0.08900%
10950 N.C. School of Science & Mathematics 72,031,206 0.06340%
11300 Environment and Natural Resources 989,633,071 0.87070%
11310 N.C. Housing Finance Agency 59,173,107 0.05210%
11600 Wildlife Resources Commission 246,084,436 0.21650%
11900 State Board of Elections 26,088,217 0.02300%
12100 Governor's Office 23,334,197 0.02050%
12150 Lt. Governor's Office 3,488,667 0.00310%
12160 General Assembly 196,381,520 0.17280%
12220 Health & Human Services 5,639,242,575 4.96160%
12510 Department of Commerce 743,184,826 0.65390%
12600 Insurance Department 186,447,415 0.16400%
12700 Labor Department 145,422,291 0.12790%
13500 Revenue Department 485,293,336 0.42700%
13700 Secretary of State 65,789,974 0.05790%
14200 N.C. Cemetary Commission 237,848 0.00020%
14300 State Treasurer 177,603,771 0.15630%
18400 Department of Agriculture 644,518,580 0.56710%
18600 Barber Examiners, State Board of 2,724,134 0.00240%
18640 North Carolina Board of Opticians 407,031 0.00040%
18670 State Board of Examiners for Electrical Contractors 434,236 0.00040%
18690 N.C. Real Estate Commission 1,265,701 0.00110%
18740 N.C. Auctioneers Licensing Board 818,605 0.00070%
18780 N.C. State Board of Examiners of Practicing Psychol 1,126,270 0.00100%
19005 Community Colleges Administration 93,734,451 0.08250%
19100 Department of Public Safety 8,012,568,157 7.04980%
20100 Appalachian State University 632,649,606 0.55660%
20200 N.C. School of the Arts 93,100,090 0.08190%
20300 East Carolina University 1,505,554,721 1.32460%
20400 Elizabeth City State University 194,813,561 0.17140%
20600 Fayetteville State University 244,189,996 0.21480%
20700 N.C. A&T University 478,733,070 0.42120%
20800 N.C. Central University 448,289,556 0.39440%
20900 University of North Carolina at Greensboro 628,194,417 0.55270%
21200 UNC - Pembroke 193,664,541 0.17040%
21300 N.C. State University 2,406,755,835 2.11750%
EmployerNumber
9

Teachers' and State Employees' Retirement System Schedule of Employer AllocationsJune 30, 2013 Schedule 2
Present Value of Present Value of Future Salary
Employer Future Salary AllocationEmployerNumber
21520 UNC-CH CB 1260 3,637,189,760 3.20010%
21525 UNC-General Administration 157,607,686 0.13870%
21550 UNC Health Care System 3,866,757,712 3.40210%
21570 University of North Carolina Press 23,491,075 0.02070%
21800 Western Carolina University 322,363,211 0.28360%
21900 Winston-Salem State University 276,099,427 0.24290%
22000 Department of Public Instruction 496,343,428 0.43670%
23000 University of North Carolina at Asheville 126,333,902 0.11120%
23100 University of North Carolina at Charlotte 751,390,248 0.66110%
23200 University of North Carolina at Wilmington 435,294,423 0.38300%
30000 Yancey County Schools 119,264,042 0.10490%
30100 Alamance County Schools 978,347,927 0.86080%
30102 Clover Garden Charter School 13,002,761 0.01140%
30103 River Mill Academy Charter 17,350,695 0.01530%
30104 The Hawbridge School 6,178,759 0.00540%
30105 Alamance Community College 92,903,714 0.08170%
30200 Alexander County Schools 236,205,031 0.20780%
30300 Alleghany County Schools 77,037,912 0.06780%
30400 Anson County Schools 154,555,315 0.13600%
30405 South Piedmont Community College 79,035,829 0.06950%
30500 Ashe County Schools 151,897,442 0.13360%
30600 Avery County Schools 114,381,103 0.10060%
30601 Grandfather Academy 2,440,065 0.00210%
30700 Beaufort County Schools 295,516,969 0.26000%
30705 Beaufort County Community College 55,948,211 0.04920%
30800 Bertie County Schools 124,026,229 0.10910%
30900 Bladen County Schools 215,273,293 0.18940%
30905 Bladen Community College 47,395,795 0.04170%
31000 Brunswick County Schools 528,630,255 0.46510%
31005 Brunswick Community College 56,611,978 0.04980%
31100 Buncombe County Schools 1,132,013,533 0.99600%
31101 F. Delany New School for Children 8,429,684 0.00740%
31102 Evergreen Community Charter School 20,226,320 0.01780%
31105 Asheville-Buncombe Technical College 177,904,549 0.15650%
31110 Asheville City Schools 250,661,688 0.22050%
31200 Burke County Schools 584,325,262 0.51410%
31205 Western Piedmont Community College 83,411,439 0.07340%
31300 Cabarrus County Schools 1,233,811,689 1.08550%
31301 Carolina International School 18,481,646 0.01630%
31320 Kannapolis City Schools 258,044,802 0.22700%
31400 Caldwell County Schools 547,516,257 0.48170%
31405 Caldwell Community College 125,220,417 0.11020%
31500 Camden County Schools 86,458,285 0.07610%
31600 Carteret County Schools 361,313,946 0.31790%
31601 Cape Lookout Marine Science H.S. 1,037,573 0.00090%
10

Teachers' and State Employees' Retirement System Schedule of Employer AllocationsJune 30, 2013 Schedule 2
Present Value of Present Value of Future Salary
Employer Future Salary AllocationEmployerNumber
31605 Carteret Community College 56,395,258 0.04960%
31700 Caswell County Schools 112,763,250 0.09920%
31800 Catawba County Schools 708,450,172 0.62330%
31805 Catawba Valley Community College 142,196,235 0.12510%
31810 Hickory City Schools 181,499,456 0.15970%
31820 Newton-Conover City Schools 143,844,338 0.12660%
31900 Chatham County Schools 394,572,443 0.34720%
32000 Cherokee County Schools 155,424,063 0.13670%
32005 Tri-County Community College 34,494,062 0.03030%
32100 Edenton-Chowan County Schools 110,984,926 0.09760%
32200 Clay County Schools 59,482,532 0.05230%
32300 Cleveland County Schools 733,333,585 0.64520%
32305 Cleveland Technical College 66,962,415 0.05890%
32400 Columbus County Schools 262,425,270 0.23090%
32405 Southeastern Community College 73,636,774 0.06480%
32410 Whiteville City Schools 95,898,479 0.08440%
32500 New Bern/Craven County Board of Education 583,304,787 0.51320%
32505 Craven Community College 86,306,030 0.07590%
32600 Cumberland County Schools 2,205,636,955 1.94060%
32605 Fayetteville Technical Community College 287,543,731 0.25300%
32700 Currituck County Schools 165,788,335 0.14590%
32800 Dare County Schools 243,880,349 0.21460%
32900 Davidson County Schools 752,748,800 0.66230%
32905 Davidson County Community College 118,864,142 0.10460%
32910 Lexington City Schools 149,098,380 0.13120%
32920 Thomasville City Schools 121,113,871 0.10660%
33000 Davie County Schools 292,773,717 0.25760%
33001 N.E. Regional School for Biotechnology 2,123,490 0.00190%
33027 Cornerstone Academy 11,940,543 0.01050%
33100 Duplin County Schools 374,153,221 0.32920%
33105 James Sprunt Technical College 53,850,331 0.04740%
33200 Durham Public Schools 1,712,160,359 1.50640%
33202 Central Park School for Children 14,932,705 0.01310%
33203 Healthy Start Academy 13,241,812 0.01170%
33204 Voyager Academy 45,844,620 0.04030%
33205 Durham Technical Institute 140,475,608 0.12360%
33206 Bear Grass Charter School 10,108,062 0.00890%
33300 Edgecombe County Schools 275,186,408 0.24210%
33305 Edgecombe Technical College 80,005,076 0.07040%
33400 Winston-Salem-Forsyth County Schools 2,245,359,945 1.97550%
33402 Arts Based Elementary Charter 13,835,542 0.01220%
33403 Downtown Middle 4,507,075 0.00400%
33405 Forsyth Technical Institute 215,537,600 0.18960%
33500 Franklin County Schools 355,349,133 0.31260%
33501 A Childs Garden Charter (AKA Cross Creek Charter) 7,249,594 0.00640%
11

Teachers' and State Employees' Retirement System Schedule of Employer AllocationsJune 30, 2013 Schedule 2
Present Value of Present Value of Future Salary
Employer Future Salary AllocationEmployerNumber
33600 Gaston County Schools 1,185,678,465 1.04320%
33605 Gaston College 172,807,893 0.15200%
33700 Gates County Schools 90,629,421 0.07970%
33800 Graham County Schools 64,254,545 0.05650%
33900 Granville County Schools and Oxford Orphanage 350,495,580 0.30840%
34000 Greene County Schools 158,686,549 0.13960%
34100 Guilford County Schools 3,416,574,265 3.00600%
34105 Guilford Technical Community College 310,740,674 0.27340%
34200 Halifax County Schools 178,449,957 0.15700%
34205 Halifax Community College 59,854,734 0.05270%
34220 Roanoke Rapids City Schools 124,636,378 0.10970%
34230 Weldon City Schools 57,083,492 0.05020%
34300 Harnett County Schools 781,747,582 0.68780%
34400 Haywood County Schools 336,970,460 0.29650%
34405 Haywood Technical College 72,731,350 0.06400%
34500 Henderson County Schools 565,248,908 0.49730%
34501 Mountain Community School 6,308,321 0.00560%
34505 Blue Ridge Community College 70,137,799 0.06170%
34600 Hertford County Schools 151,402,904 0.13320%
34605 Roanoke-Chowan Community College 32,770,079 0.02880%
34700 Hoke County Schools 351,216,957 0.30900%
34800 Hyde County Schools 38,956,249 0.03430%
34900 Iredell County Schools 880,785,545 0.77490%
34901 American Renaissance Middle School 20,824,156 0.01830%
34903 Success Institute 2,478,127 0.00220%
34905 Mitchell Community College 89,031,923 0.07830%
34910 Mooresville City Schools 234,141,330 0.20600%
35000 Jackson County Schools 161,792,675 0.14240%
35005 Southwestern Community College 75,996,977 0.06690%
35100 Johnston County Schools 1,476,150,776 1.29880%
35105 Johnston Technical College 131,268,996 0.11550%
35106 Neuse Charter School 21,486,516 0.01890%
35200 Jones County Schools 61,676,346 0.05430%
35300 Sanford-Lee County Board of Education 416,671,750 0.36660%
35305 Central Carolina Community College 138,708,826 0.12200%
35400 Lenoir County Schools 359,952,682 0.31670%
35401 Childrens Village Academy 3,625,172 0.00320%
35402 Kinston Charter Academy 11,296,458 0.00990%
35405 Lenoir County Community College 121,344,089 0.10680%
35500 Lincoln County Schools 486,644,679 0.42820%
35600 Macon County Schools 200,755,477 0.17660%
35700 Madison County Schools 114,908,962 0.10110%
35800 Martin County Schools 171,227,640 0.15070%
35805 Martin Community College 24,279,801 0.02140%
35900 Mcdowell County Schools 301,188,452 0.26500%
12

Teachers' and State Employees' Retirement System Schedule of Employer AllocationsJune 30, 2013 Schedule 2
Present Value of Present Value of Future Salary
Employer Future Salary AllocationEmployerNumber
35905 Mcdowell Technical College 43,472,292 0.03820%
36000 Charlotte-Mecklenburg County Schools 6,440,214,616 5.66630%
36001 Community Charter School 6,664,515 0.00590%
36002 Kennedy Charter 19,701,762 0.01730%
36003 Community School of Davidson 46,853,404 0.04120%
36005 Central Piedmont Community College 505,206,821 0.44450%
36006 Lake Norman Charter School 56,762,619 0.04990%
36007 Socrates Academy 19,021,689 0.01670%
36008 Pine Lake Prep Charter 54,380,261 0.04780%
36009 Charlotte Secondary Charter 9,435,510 0.00830%
36100 Mitchell County Schools 94,585,884 0.08320%
36102 KIPP Charlotte Charter 18,895,261 0.01660%
36105 Mayland Technical College 50,095,669 0.04410%
36200 Montgomery County Schools 184,449,205 0.16230%
36205 Montgomery Community College 28,746,351 0.02530%
36300 Moore County Schools 555,578,030 0.48880%
36301 Academy of Moore County 5,360,555 0.00470%
36302 Stars Charter School 10,753,954 0.00950%
36305 Sandhills Community College 116,095,372 0.10210%
36400 Nash-Rocky Mount Schools 686,022,562 0.60360%
36405 Nash Technical College 94,019,920 0.08270%
36500 New Hanover County Schools 1,130,759,825 0.99490%
36501 Cape Fear Center for Inquiry 12,464,377 0.01100%
36502 Wilmington Preperatory Academy 4,377,895 0.00390%
36505 Cape Fear Community College 234,029,842 0.20590%
36600 Northampton County Schools 104,068,465 0.09160%
36601 Gaston College Preparatory Charter 31,222,146 0.02750%
36700 Onslow County Schools 1,003,869,141 0.88320%
36705 Coastal Carolina Community College 118,931,356 0.10460%
36800 Orange County Schools 376,729,054 0.33150%
36801 PACE Academy 7,087,049 0.00620%
36802 Orange Charter School 10,683,473 0.00940%
36810 Chapel Hill - Carboro City Schools 709,656,576 0.62440%
36900 Pamlico County Schools 71,954,797 0.06330%
36901 Arapahoe Charter School 20,767,417 0.01830%
36905 Pamlico Community College 23,517,070 0.02070%
37000 Elizabeth City and Pasquotank County Schools 251,739,138 0.22150%
37005 College of the Albemarle 63,100,902 0.05550%
37100 Pender County Schools 346,664,212 0.30500%
37200 Perquimans County Schools 84,579,563 0.07440%
37300 Person County Schools 224,304,813 0.19740%
37301 Roxboro Community School 18,785,153 0.01650%
37305 Piedmont Community College 84,505,733 0.07440%
37400 Pitt County Schools 1,028,121,926 0.90460%
37405 Pitt Community College 208,240,368 0.18320%
13

Teachers' and State Employees' Retirement System Schedule of Employer AllocationsJune 30, 2013 Schedule 2
Present Value of Present Value of Future Salary
Employer Future Salary AllocationEmployerNumber
37500 Polk County Schools 113,980,344 0.10030%
37600 Randolph County Schools 745,873,615 0.65620%
37605 Randolph Community College 84,497,022 0.07430%
37610 Asheboro City Schools 231,504,717 0.20370%
37700 Richmond County Schools 313,969,321 0.27620%
37705 Richmond Technical College 80,429,133 0.07080%
37800 Robeson County Schools 937,142,706 0.82450%
37805 Robeson Community College 89,241,133 0.07850%
37900 Rockingham County Schools 558,647,161 0.49150%
37901 Bethany Community Middle School 6,916,403 0.00610%
37905 Rockingham Community College 63,732,283 0.05610%
38000 Rowan-Salisbury School System 870,622,825 0.76600%
38005 Rowan-Cabarrus Community College 158,410,172 0.13940%
38100 Rutherford County Schools 397,568,007 0.34980%
38105 Isothermal Community College 80,430,327 0.07080%
38200 Sampson County Schools 366,093,312 0.32210%
38205 Sampson Community College 57,423,300 0.05050%
38210 Clinton City Schools 129,887,078 0.11430%
38300 Scotland County Schools 308,808,139 0.27170%
38400 Stanly County Schools 378,787,448 0.33330%
38402 Gray Stone Day School 10,972,959 0.00970%
38405 Stanly Community College 89,738,983 0.07900%
38500 Stokes County Schools 301,771,480 0.26550%
38600 Surry County Schools 369,873,433 0.32540%
38601 Bridges Charter Schools 3,384,319 0.00300%
38602 Millennium Charter Academy 16,836,208 0.01480%
38605 Surry Community College 96,161,700 0.08460%
38610 Mount Airy City Schools 72,119,172 0.06350%
38620 Elkin City Schools 56,370,285 0.04960%
38700 Swain County Schools 94,022,443 0.08270%
38701 Mountain Discovery Charter 8,260,390 0.00730%
38800 Transylvania County Schools 173,131,154 0.15230%
38801 Brevard Academy Charter School 7,647,304 0.00670%
38900 Tyrrell County Schools 40,200,847 0.03540%
39000 Union County Schools 1,751,999,809 1.54150%
39100 Vance County Schools 298,191,981 0.26240%
39101 Vance Charter School 20,264,286 0.01780%
39105 Vance-Granville Community College 114,830,560 0.10100%
39200 Wake County Schools 6,690,930,435 5.88690%
39201 Endeavor Charter School 18,312,757 0.01610%
39204 Southern Wake Academy 6,074,705 0.00530%
39205 Wake Technical College 472,043,235 0.41530%
39208 East Wake Academy 46,152,237 0.04060%
39209 Casa Esperanza Montessori 19,041,094 0.01680%
39300 Warren County Schools 110,283,248 0.09700%
14

Teachers' and State Employees' Retirement System Schedule of Employer AllocationsJune 30, 2013 Schedule 2
Present Value of Present Value of Future Salary
Employer Future Salary AllocationEmployerNumber
39301 Haliwa-Saponi Tribal Charter 6,227,814 0.00550%
39400 Washington County Schools 75,061,141 0.06600%
39401 Henderson Collegiate Charter School 9,146,007 0.00800%
39500 Watauga County Schools 220,374,878 0.19390%
39501 Two Rivers Community School 7,538,811 0.00660%
39600 Wayne County Schools 766,595,156 0.67450%
39605 Wayne Community College 103,425,767 0.09100%
39700 Wilkes County Schools 437,793,641 0.38520%
39705 Wilkes Community College 96,925,606 0.08530%
39800 Wilson County Schools 514,906,887 0.45300%
39805 Wilson Community College 58,690,947 0.05160%
39900 Yadkin County Schools 251,802,532 0.22150%
51000 Highway - Administrative 4,166,445,351 3.66580%
Total $ 113,658,217,358 $ 100.00000%
The accompanying notes to the schedules are an integral part of this schedule.
15

Teachers' and State Employees' Retirement System Schedule of Pension Amounts by EmployerJune 30, 2014
Employer Number Employer
Net Pension Liability
Differences Between Expected
and Actual Experience
Net Difference Between
Projected and Actual
Investment Earnings on Plan
InvestmentsChanges of
Assumptions
Changes in Proportion and
Differences Between Employer
Contributions and Proportionate Share
of Contributions
Total Deferred Outflows of Resources
10200 North Carolina Education Lottery $ 1,300,918 $ - $ - $ - $ 185,846 $ 185,846
10400 Department of Justice 5,593,269 - - - -
10500 State Auditor 849,067 - - - -
10700 Department of Cultural Resources 2,233,110 - - - 180,171 180,171
10800 Administrative Office of the Courts 23,225,777 - - - 261,286 261,286
10850 Office of Administrative Hearings 140,456 - - - 169,210 169,210
10900 Department of Administration 2,176,482 - - - 876,443 876,443
10910 Office of State Budget & Management 349,030 - - - - -
10930 Information Technology Services 2,836,204 - - - - -
10940 Office of State Controller 1,001,248 - - - - -
10950 N.C. School of Science & Mathematics 783,646 - - - 236,411 236,411
11300 Environment and Natural Resources 9,989,144 - - - - -
11310 N.C. Housing Finance Agency 605,673 - - - 30,575 30,575
11600 Wildlife Resources Commission 2,605,119 - - - 208,679 208,679
11900 State Board of Elections 259,574 - - - - -
12100 Governor's Office 295,333 - - - 262,802 262,802
12150 Lt. Governor's Office 39,511 - - - 11,531 11,531
12160 General Assembly 2,165,813 - - - 799,741 799,741
12220 Health & Human Services 57,701,520 - - - 2,198,807 2,198,807
12510 Department of Commerce 7,430,804 - - - 341,658 341,658
12600 Insurance Department 1,843,280 - - - - -
12700 Labor Department 1,451,340 - - - - -
13500 Revenue Department 4,975,637 - - - 188,468 188,468
13700 Secretary of State 675,314 - - - 38,408 38,408
14200 N.C. Cemetary Commission - - - - - -
14300 State Treasurer 1,810,453 - - - - -
18400 Department of Agriculture 6,726,297 - - - 821,395 821,395
18600 Barber Examiners, State Board of 28,607 - - - 6,066 6,066
18640 North Carolina Board of Opticians 2,110 - - - - -
18670 State Board of Examiners for Electrical Contractors 4,103 - - - - -
18690 N.C. Real Estate Commission 14,069 - - - 23,592 23,592
18740 N.C. Auctioneers Licensing Board 8,090 - - - 583 583
18780 N.C. State Board of Examiners of Practicing Psychol 14,773 - - - 14,489 14,489
19005 Community Colleges Administration 946,378 - - - 50,538 50,538
19100 Department of Public Safety 81,213,368 - - - - -
20100 Appalachian State University 6,607,765 - - - 594,587 594,587
20200 N.C. School of the Arts 952,944 - - - 105,648 105,648
20300 East Carolina University 16,091,595 - - - 2,771,437 2,771,437
20400 Elizabeth City State University 1,729,086 - - - - -
20600 Fayetteville State University 2,479,201 - - - 12,078 12,078
20700 N.C. A&T University 4,839,285 - - - 208,123 208,123
20800 N.C. Central University 4,589,911 - - - 194,550 194,550
20900 University of North Carolina at Greensboro 6,216,997 - - - - -
21200 UNC - Pembroke 1,936,957 - - - - -
21300 N.C. State University 25,160,037 - - - 2,557,862 2,557,862
21520 UNC-CH CB 1260 37,801,432 - - - 2,777,007 2,777,007
21525 UNC-General Administration 1,616,534 - - - 186,090 186,090
21550 UNC Health Care System 42,860,194 - - - 9,803,534 9,803,534
21570 University of North Carolina Press 219,125 - - - - -
21800 Western Carolina University 3,436,600 - - - 695,537 695,537
21900 Winston-Salem State University 2,892,011 - - - 411,092 411,092
22000 Department of Public Instruction 5,224,425 - - - 1,112,323 1,112,323
23000 University of North Carolina at Asheville 1,389,788 - - - 527,186 527,186
23100 University of North Carolina at Charlotte 7,950,070 - - - 1,183,458 1,183,458
23200 University of North Carolina at Wilmington 4,270,426 - - - - -
30000 Yancey County Schools 1,195,400 - - - - -
30100 Alamance County Schools 9,868,150 - - - - -
30102 Clover Garden Charter School 143,387 - - - 23,406 23,406
30103 River Mill Academy Charter 201,656 - - - 66,378 66,378
30104 The Hawbridge School 81,718 - - - 71,288 71,288
30105 Alamance Community College 972,992 - - - 159,744 159,744
Deferred Outflows of Resources
16

Schedule 3
Differences Between Expected
and Actual Experience
Net Difference Between
Projected and Actual
Investment Earnings on Plan
InvestmentsChanges of
Assumptions
Changes in Proportion and
Differences Between Employer
Contributions and Proportionate Share
of Contributions
Total Deferred Inflows of Resources
Proportionate Share of Pension
Expense
Net Amortization of Deferred Amounts from Changes in Proportion
and Differences Between Employer Contributions and Proportionate Share
of Contributions
Total Employer Pension Expense
$ 303,237 $ 4,395,328 $ - $ - $ 4,698,565 $ 556,859 $ 49,036 $ 605,895
1,303,761 18,897,611 - 2,337 20,203,709 2,394,204 (617) 2,393,587
197,913 2,868,688 - 120,522 3,187,123 363,444 (31,800) 331,644
520,526 7,544,863 - - 8,065,389 955,885 47,539 1,003,424
5,413,803 78,471,412 - - 83,885,215 9,941,818 68,941 10,010,759
32,740 474,550 - - 507,290 60,122 44,646 104,768
507,326 7,353,538 - - 7,860,864 931,645 231,252 1,162,897
81,357 1,179,244 - 65,940 1,326,541 149,403 (17,398) 132,005
661,104 9,582,495 - 295,900 10,539,499 1,214,040 (78,074) 1,135,966
233,385 3,382,849 - 59,924 3,676,158 428,585 (15,811) 412,774
182,664 2,647,654 - - 2,830,318 335,441 62,378 397,819
2,328,416 33,749,667 - 289,057 36,367,140 4,275,863 (76,268) 4,199,595
141,179 2,046,347 - - 2,187,526 259,259 8,067 267,326
607,239 8,801,746 - - 9,408,985 1,115,124 55,060 1,170,184
60,505 877,006 - 59,874 997,385 111,111 (15,798) 95,313
68,840 997,822 - - 1,066,662 126,418 69,341 195,759
9,210 133,492 - - 142,702 16,913 3,042 19,955
504,839 7,317,492 - - 7,822,331 927,079 211,013 1,138,092
13,449,913 194,952,345 - - 208,402,258 24,699,194 580,161 25,279,355
1,732,080 25,105,972 - - 26,838,052 3,180,763 90,147 3,270,910
429,659 6,227,770 - 68,266 6,725,695 789,018 (18,012) 771,006
338,300 4,903,547 - 14,549 5,256,396 621,248 (3,839) 617,409
1,159,794 16,810,860 - - 17,970,654 2,129,827 49,728 2,179,555
157,412 2,281,641 - - 2,439,053 289,069 10,134 299,203
- - - 9,607 9,607 - (2,535) (2,535)
422,007 6,116,857 - 76,264 6,615,128 774,966 (20,122) 754,844
1,567,863 22,725,697 - - 24,293,560 2,879,198 216,727 3,095,925
6,668 96,653 - - 103,321 12,245 1,601 13,846
492 7,130 - 10,033 17,655 903 (2,647) (1,744)
956 13,864 - 5,631 20,451 1,756 (1,486) 270
3,279 47,534 - - 50,813 6,022 6,225 12,247
1,886 27,332 - - 29,218 3,463 154 3,617
3,443 49,911 - - 53,354 6,323 3,823 10,146
220,596 3,197,466 - - 3,418,062 405,098 13,335 418,433
18,930,398 274,390,285 - 5,892,609 299,213,292 34,763,465 (1,554,778) 33,208,687
1,540,234 22,325,222 - - 23,865,456 2,828,460 156,883 2,985,343
222,126 3,219,649 - - 3,441,775 407,909 27,875 435,784
3,750,864 54,367,619 - - 58,118,483 6,888,024 731,250 7,619,274
403,041 5,841,951 - 974,025 7,219,017 740,137 (256,999) 483,138
577,888 8,376,315 - - 8,954,203 1,061,225 3,187 1,064,412
1,128,011 16,350,175 - - 17,478,186 2,071,461 54,914 2,126,375
1,069,883 15,507,631 - - 16,577,514 1,964,716 51,332 2,016,048
1,449,148 21,004,960 - 745,420 23,199,528 2,661,192 (196,681) 2,464,511
451,494 6,544,269 - 176,341 7,172,104 829,116 (46,528) 782,588
5,864,669 85,006,570 - - 90,871,239 10,769,780 674,898 11,444,678
8,811,310 127,717,222 - - 136,528,532 16,180,942 732,720 16,913,662
376,805 5,461,678 - - 5,838,483 691,959 49,100 741,059
9,990,480 144,808,930 - - 154,799,410 18,346,350 2,586,685 20,933,035
51,077 740,345 - 79,996 871,418 93,797 (21,107) 72,690
801,053 11,611,017 - - 12,412,070 1,471,040 183,519 1,654,559
674,112 9,771,048 - - 10,445,160 1,237,928 108,468 1,346,396
1,217,785 17,651,423 - - 18,869,208 2,236,321 293,489 2,529,810
323,952 4,695,585 - - 5,019,537 594,900 139,099 733,999
1,853,118 26,860,379 - - 28,713,497 3,403,035 312,258 3,715,293
995,413 14,428,209 - 624,560 16,048,182 1,827,960 (164,792) 1,663,168
278,641 4,038,821 - 192,564 4,510,026 511,692 (50,809) 460,883
2,300,213 33,340,873 - 1,392,902 37,033,988 4,224,072 (367,520) 3,856,552
33,423 484,453 - - 517,876 61,377 6,176 67,553
47,005 681,323 - - 728,328 86,319 17,514 103,833
19,048 276,094 - - 295,142 34,979 18,809 53,788
226,799 3,287,385 - - 3,514,184 416,490 42,149 458,639
Pension ExpenseDeferred Inflows of Resources
17

Teachers' and State Employees' Retirement System Schedule of Pension Amounts by EmployerJune 30, 2014
Employer Number Employer
Net Pension Liability
Differences Between Expected
and Actual Experience
Net Difference Between
Projected and Actual
Investment Earnings on Plan
InvestmentsChanges of
Assumptions
Changes in Proportion and
Differences Between Employer
Contributions and Proportionate Share
of Contributions
Total Deferred Outflows of Resources
Deferred Outflows of Resources
30200 Alexander County Schools 2,376,028 - - - - -
30300 Alleghany County Schools 788,922 - - - - -
30400 Anson County Schools 1,495,423 - - - - -
30405 South Piedmont Community College 881,661 - - - 287,601 287,601
30500 Ashe County Schools 1,528,134 - - - - -
30600 Avery County Schools 1,188,483 - - - 15,865 15,865
30601 Grandfather Academy 24,738 - - - - -
30700 Beaufort County Schools 3,052,281 - - - 61,696 61,696
30705 Beaufort County Community College 600,162 - - - 146,720 146,720
30800 Bertie County Schools 1,342,422 - - - 273,912 273,912
30900 Bladen County Schools 2,160,068 - - - - -
30905 Bladen Community College 476,472 - - - 1,845 1,845
31000 Brunswick County Schools 5,618,593 - - - 692,030 692,030
31005 Brunswick Community College 561,707 - - - - -
31100 Buncombe County Schools 11,654,568 - - - - -
31101 F. Delany New School for Children 89,573 - - - - -
31102 Evergreen Community Charter School 183,718 - - - - -
31105 Asheville-Buncombe Technical College 1,834,956 - - - 101,818 101,818
31110 Asheville City Schools 2,632,789 - - - 51,547 51,547
31200 Burke County Schools 5,947,223 - - - - -
31205 Western Piedmont Community College 803,695 - - - - -
31300 Cabarrus County Schools 12,489,566 - - - - -
31301 Carolina International School 210,450 - - - 48,976 48,976
31320 Kannapolis City Schools 2,582,492 - - - - -
31400 Caldwell County Schools 5,556,220 - - - - -
31405 Caldwell Community College 1,237,725 - - - - -
31500 Camden County Schools 891,157 - - - - -
31600 Carteret County Schools 3,813,417 - - - 428,557 428,557
31601 Cape Lookout Marine Science H.S. 10,552 - - - - -
31605 Carteret Community College 559,831 - - - - -
31700 Caswell County Schools 1,121,303 - - - - -
31800 Catawba County Schools 7,301,252 - - - - -
31805 Catawba Valley Community College 1,446,416 - - - 50,250 50,250
31810 Hickory City Schools 1,759,569 - - - - -
31820 Newton-Conover City Schools 1,482,878 - - - - -
31900 Chatham County Schools 4,070,294 - - - - -
32000 Cherokee County Schools 1,580,189 - - - - -
32005 Tri-County Community College 375,175 - - - 95,617 95,617
32100 Edenton-Chowan County Schools 1,126,345 - - - - -
32200 Clay County Schools 629,473 - - - 75,611 75,611
32300 Cleveland County Schools 7,408,880 - - - - -
32305 Cleveland Technical College 711,660 - - - 182,943 182,943
32400 Columbus County Schools 2,581,788 - - - - -
32405 Southeastern Community College 727,370 - - - - -
32410 Whiteville City Schools 1,010,744 - - - 143,618 143,618
32420 SEGS Academy 25,911 - - - 97,447 97,447
32500 New Bern/Craven County Board of Education 5,978,526 - - - - -
32505 Craven Community College 848,716 - - - - -
32600 Cumberland County Schools 22,097,439 - - - - -
32605 Fayetteville Technical Community College 2,953,680 - - - 229,355 229,355
32700 Currituck County Schools 1,722,404 - - - 77,196 77,196
32800 Dare County Schools 2,486,236 - - - 110,283 110,283
32900 Davidson County Schools 7,665,523 - - - - -
32901 Invest Collegiate Charter School 21,455 - - - 88,368 88,368
32905 Davidson County Community College 1,200,676 - - - - -
32910 Lexington City Schools 1,523,796 - - - - -
32920 Thomasville City Schools 1,182,856 - - - - -
33000 Davie County Schools 3,003,391 - - - - -
33001 N.E. Regional School for Biotechnology 50,649 - - - 107,692 107,692
33027 Cornerstone Academy 163,318 - - - 150,534 150,534
33100 Duplin County Schools 4,036,763 - - - 709,453 709,453
18

Schedule 3
Differences Between Expected
and Actual Experience
Net Difference Between
Projected and Actual
Investment Earnings on Plan
InvestmentsChanges of
Assumptions
Changes in Proportion and
Differences Between Employer
Contributions and Proportionate Share
of Contributions
Total Deferred Inflows of Resources
Proportionate Share of Pension
Expense
Net Amortization of Deferred Amounts from Changes in Proportion
and Differences Between Employer Contributions and Proportionate Share
of Contributions
Total Employer Pension Expense
Pension ExpenseDeferred Inflows of Resources
553,839 8,027,731 - 327,963 8,909,533 1,017,061 (86,534) 930,527
183,893 2,665,479 - 32,967 2,882,339 337,699 (8,698) 329,001
348,575 5,052,488 - 295,758 5,696,821 640,117 (78,036) 562,081
205,510 2,978,809 - - 3,184,319 377,396 75,884 453,280
356,200 5,163,005 - 188,421 5,707,626 654,119 (49,715) 604,404
277,029 4,015,450 - - 4,292,479 508,731 4,186 512,917
5,766 83,581 - 1,257 90,604 10,589 (332) 10,257
711,470 10,312,541 - - 11,024,011 1,306,532 16,279 1,322,811
139,895 2,027,729 - - 2,167,624 256,900 38,712 295,612
312,911 4,535,553 - - 4,848,464 574,625 72,272 646,897
503,500 7,298,082 - 135,113 7,936,695 924,619 (35,650) 888,969
111,063 1,609,824 - - 1,720,887 203,954 487 204,441
1,309,664 18,983,172 - - 20,292,836 2,405,045 182,594 2,587,639
130,931 1,897,802 - 37,166 2,065,899 240,439 (9,806) 230,633
2,716,617 39,376,526 - 437,990 42,531,133 4,988,750 (115,565) 4,873,185
20,879 302,634 - 7,434 330,947 38,342 (1,961) 36,381
42,824 620,717 - 130,622 794,163 78,641 (34,465) 44,176
427,718 6,199,646 - - 6,627,364 785,455 26,865 812,320
613,689 8,895,230 - - 9,508,919 1,126,968 13,601 1,140,569
1,386,265 20,093,492 - 558,507 22,038,264 2,545,715 (147,363) 2,398,352
187,337 2,715,390 - 178,619 3,081,346 344,022 (47,129) 296,893
2,911,250 42,197,680 - 1,775,772 46,884,702 5,346,172 (468,541) 4,877,631
49,055 711,032 - - 760,087 90,083 12,922 103,005
601,965 8,725,296 - 518,180 9,845,441 1,105,438 (136,723) 968,715
1,295,125 18,772,438 - 504,824 20,572,387 2,378,346 (133,199) 2,245,147
288,507 4,181,820 - 119,380 4,589,707 529,809 (31,499) 498,310
207,724 3,010,894 - 23,884 3,242,502 381,461 (6,302) 375,159
888,887 12,884,141 - - 13,773,028 1,632,337 113,076 1,745,413
2,460 35,651 - 8,303 46,414 4,517 (2,191) 2,326
130,494 1,891,464 - 19,091 2,041,049 239,636 (5,037) 234,599
261,370 3,788,474 - 91,099 4,140,943 479,975 (24,037) 455,938
1,701,882 24,668,261 - 164,781 26,534,924 3,125,308 (43,478) 3,081,830
337,152 4,886,910 - - 5,224,062 619,140 13,259 632,399
410,146 5,944,942 - 457,350 6,812,438 753,185 (120,673) 632,512
345,651 5,010,103 - 47,431 5,403,185 634,747 (12,515) 622,232
948,764 13,752,036 - 111,133 14,811,933 1,742,293 (29,323) 1,712,970
368,334 5,338,881 - 74,134 5,781,349 676,402 (19,560) 656,842
87,451 1,267,578 - - 1,355,029 160,594 25,229 185,823
262,545 3,805,508 - 60,637 4,128,690 482,133 (15,999) 466,134
146,727 2,126,759 - - 2,273,486 269,446 19,950 289,396
1,726,970 25,031,897 - 812,126 27,570,993 3,171,379 (214,281) 2,957,098
165,884 2,404,437 - - 2,570,321 304,627 48,270 352,897
601,801 8,722,919 - 449,270 9,773,990 1,105,137 (118,541) 986,596
169,546 2,457,517 - 57,642 2,684,705 311,351 (15,209) 296,142
235,599 3,414,935 - - 3,650,534 432,650 37,894 470,544
6,040 87,542 - - 93,582 11,091 25,712 36,803
1,393,562 20,199,255 - 219,481 21,812,298 2,559,114 (57,911) 2,501,203
197,831 2,867,500 - 117,233 3,182,564 363,294 (30,932) 332,362
5,150,794 74,659,170 - 3,223,725 83,033,689 9,458,831 (850,587) 8,608,244
688,487 9,979,406 - - 10,667,893 1,264,326 60,516 1,324,842
401,483 5,819,372 - - 6,220,855 737,277 20,368 757,645
579,528 8,400,083 - - 8,979,611 1,064,236 29,098 1,093,334
1,786,792 25,899,000 - 616,254 28,302,046 3,281,235 (162,600) 3,118,635
5,001 72,490 - - 77,491 9,184 23,316 32,500
279,871 4,056,646 - 83,046 4,419,563 513,951 (21,912) 492,039
355,189 5,148,348 - 72,034 5,575,571 652,262 (19,006) 633,256
275,717 3,996,437 - 276,032 4,548,186 506,323 (72,832) 433,491
700,074 10,147,360 - 206,870 11,054,304 1,285,605 (54,583) 1,231,022
11,806 171,123 - - 182,929 21,680 28,415 50,095
38,069 551,793 - - 589,862 69,909 39,719 109,628
940,948 13,638,746 - - 14,579,694 1,727,940 187,191 1,915,131
19

Teachers' and State Employees' Retirement System Schedule of Pension Amounts by EmployerJune 30, 2014
Employer Number Employer
Net Pension Liability
Differences Between Expected
and Actual Experience
Net Difference Between
Projected and Actual
Investment Earnings on Plan
InvestmentsChanges of
Assumptions
Changes in Proportion and
Differences Between Employer
Contributions and Proportionate Share
of Contributions
Total Deferred Outflows of Resources
Deferred Outflows of Resources
33105 James Sprunt Technical College 541,190 - - - - -
33200 Durham Public Schools 17,425,928 - - - - -
33202 Central Park School for Children 173,636 - - - 56,010 56,010
33203 Healthy Start Academy 141,042 - - - 5,336 5,336
33204 Voyager Academy 470,493 - - - - -
33205 Durham Technical Institute 1,440,202 - - - 37,643 37,643
33206 Bear Grass Charter School 115,835 - - - 38,230 38,230
33300 Edgecombe County Schools 2,687,072 - - - - -
33305 Edgecombe Technical College 761,605 - - - - -
33400 Winston-Salem-Forsyth County Schools 23,397,537 - - - 1,063,962 1,063,962
33402 Arts Based Elementary Charter 163,904 - - - 55,902 55,902
33403 Downtown Middle - - - - - -
33405 Forsyth Technical Institute 2,403,815 - - - 841,148 841,148
33500 Franklin County Schools 3,802,279 - - - 460,108 460,108
33501 A Childs Garden Charter (AKA Cross Creek Charter) 71,635 - - - - -
33600 Gaston County Schools 12,111,578 - - - - -
33605 Gaston College 1,769,887 - - - 73,492 73,492
33700 Gates County Schools 952,123 - - - 38,614 38,614
33800 Graham County Schools 655,383 - - - - -
33900 Granville County Schools and Oxford Orphanage 3,564,629 - - - - -
34000 Greene County Schools 1,600,472 - - - - -
34100 Guilford County Schools 35,777,013 - - - 731,183 731,183
34105 Guilford Technical Community College 3,158,033 - - - - -
34200 Halifax County Schools 1,727,914 - - - - -
34205 Halifax Community College 601,804 - - - - -
34220 Roanoke Rapids City Schools 1,266,097 - - - - -
34230 Weldon City Schools 590,666 - - - 2,519 2,519
34300 Harnett County Schools 8,586,811 - - - 1,630,076 1,630,076
34400 Haywood County Schools 3,446,097 - - - - -
34405 Haywood Technical College 736,984 - - - - -
34500 Henderson County Schools 5,800,670 - - - - -
34501 Mountain Community School 66,594 - - - 69 69
34505 Blue Ridge Community College 749,412 - - - 174,314 174,314
34600 Hertford County Schools 1,499,644 - - - - -
34605 Roanoke-Chowan Community College 337,657 - - - 22,432 22,432
34700 Hoke County Schools 3,728,768 - - - 144,632 144,632
34800 Hyde County Schools 405,658 - - - 62,365 62,365
34900 Iredell County Schools 8,837,123 - - - - -
34901 American Renaissance Middle School 227,450 - - - 21,655 21,655
34903 Success Institute 24,738 - - - - -
34905 Mitchell Community College 907,571 - - - - -
34910 Mooresville City Schools 2,471,581 - - - 111,891 111,891
35000 Jackson County Schools 1,686,293 - - - 2,808 2,808
35005 Southwestern Community College 828,667 - - - 180,624 180,624
35100 Johnston County Schools 14,677,890 - - - - -
35105 Johnston Technical College 1,418,512 - - - 199,903 199,903
35106 Neuse Charter School 264,146 - - - 141,628 141,628
35200 Jones County Schools 653,976 - - - 123,491 123,491
35300 Sanford-Lee County Board of Education 4,201,253 - - - - -
35305 Central Carolina Community College 1,447,119 - - - 155,023 155,023
35400 Lenoir County Schools 3,696,057 - - - - -
35401 Childrens Village Academy 27,083 - - - - -
35402 Kinston Charter Academy - - - - - -
35405 Lenoir County Community College 1,269,146 - - - 47,289 47,289
35500 Lincoln County Schools 4,946,913 - - - - -
35600 Macon County Schools 1,998,509 - - - - -
35700 Madison County Schools 1,164,214 - - - - -
35800 Martin County Schools 1,730,611 - - - - -
35805 Martin Community College 237,767 - - - - -
35900 Mcdowell County Schools 3,010,191 - - - - -
35905 Mcdowell Technical College 439,892 - - - 19,886 19,886
20

Schedule 3
Differences Between Expected
and Actual Experience
Net Difference Between
Projected and Actual
Investment Earnings on Plan
InvestmentsChanges of
Assumptions
Changes in Proportion and
Differences Between Employer
Contributions and Proportionate Share
of Contributions
Total Deferred Inflows of Resources
Proportionate Share of Pension
Expense
Net Amortization of Deferred Amounts from Changes in Proportion
and Differences Between Employer Contributions and Proportionate Share
of Contributions
Total Employer Pension Expense
Pension ExpenseDeferred Inflows of Resources
126,148 1,828,482 - 32,630 1,987,260 231,657 (8,610) 223,047
4,061,890 58,875,840 - 1,446,661 64,384,391 7,459,186 (381,705) 7,077,481
40,474 586,651 - - 627,125 74,325 14,778 89,103
32,876 476,530 - - 509,406 60,373 1,408 61,781
109,669 1,589,622 - 61,999 1,761,290 201,395 (16,359) 185,036
335,703 4,865,916 - - 5,201,619 616,480 9,932 626,412
27,001 391,365 - - 418,366 49,583 10,087 59,670
626,342 9,078,633 - 605,474 10,310,449 1,150,204 (159,756) 990,448
177,526 2,573,184 - 152,401 2,903,111 326,006 (40,211) 285,795
5,453,839 79,051,725 - - 84,505,564 10,015,339 280,729 10,296,068
38,205 553,773 - - 591,978 70,159 14,750 84,909
- - - 192,143 192,143 - (50,697) (50,697)
560,316 8,121,611 - - 8,681,927 1,028,955 221,939 1,250,894
886,291 12,846,509 - - 13,732,800 1,627,569 121,400 1,748,969
16,698 242,028 - 22,380 281,106 30,663 (5,905) 24,758
2,823,143 40,920,595 - 821,455 44,565,193 5,184,373 (216,743) 4,967,630
412,551 5,979,800 - - 6,392,351 757,602 19,391 776,993
221,935 3,216,876 - - 3,438,811 407,557 10,188 417,745
152,766 2,214,301 - 39,061 2,406,128 280,538 (10,306) 270,232
830,896 12,043,578 - 227,992 13,102,466 1,525,843 (60,156) 1,465,687
373,061 5,407,410 - 242,297 6,022,768 685,084 (63,930) 621,154
8,339,428 120,877,449 - - 129,216,877 15,314,387 192,924 15,507,311
736,120 10,669,840 - 92,481 11,498,441 1,351,799 (24,401) 1,327,398
402,767 5,837,990 - 462,977 6,703,734 739,635 (122,158) 617,477
140,277 2,033,275 - 13,805 2,187,357 257,603 (3,643) 253,960
295,120 4,277,680 - 25,985 4,598,785 541,954 (6,856) 535,098
137,681 1,995,643 - - 2,133,324 252,835 665 253,500
2,001,539 29,011,697 - - 31,013,236 3,675,593 430,099 4,105,692
803,267 11,643,102 - 205,158 12,651,527 1,475,105 (54,131) 1,420,974
171,787 2,489,999 - 52,457 2,714,243 315,467 (13,841) 301,626
1,352,105 19,598,344 - 221,410 21,171,859 2,482,983 (58,420) 2,424,563
15,523 224,995 - - 240,518 28,505 18 28,523
174,684 2,531,988 - - 2,706,672 320,786 45,993 366,779
349,559 5,066,748 - 206,464 5,622,771 641,924 (54,476) 587,448
78,706 1,140,820 - - 1,219,526 144,535 5,919 150,454
869,156 12,598,143 - - 13,467,299 1,596,103 38,161 1,634,264
94,557 1,370,569 - - 1,465,126 173,642 16,455 190,097
2,059,886 29,857,409 - 1,321,825 33,239,120 3,782,740 (348,766) 3,433,974
53,017 768,469 - - 821,486 97,360 5,714 103,074
5,766 83,581 - 4,292 93,639 10,589 (1,132) 9,457
211,550 3,066,351 - 15,103 3,293,004 388,487 (3,985) 384,502
576,112 8,350,568 - - 8,926,680 1,057,963 29,523 1,087,486
393,066 5,697,368 - - 6,090,434 721,819 741 722,560
193,158 2,799,763 - - 2,992,921 354,712 47,658 402,370
3,421,337 49,591,226 - 3,199,624 56,212,187 6,282,886 (844,228) 5,438,658
330,648 4,792,634 - - 5,123,282 607,196 52,745 659,941
61,571 892,454 - - 954,025 113,068 37,369 150,437
152,438 2,209,547 - - 2,361,985 279,935 32,583 312,518
979,289 14,194,500 - 521,488 15,695,277 1,798,351 (137,596) 1,660,755
337,316 4,889,287 - - 5,226,603 619,441 40,903 660,344
861,531 12,487,626 - 83,009 13,432,166 1,582,101 (21,902) 1,560,199
6,313 91,503 - 40,545 138,361 11,593 (10,698) 895
- - - 475,555 475,555 - (125,476) (125,476)
295,831 4,287,980 - - 4,583,811 543,259 12,477 555,736
1,153,099 16,713,811 - 475,732 18,342,642 2,117,531 (125,523) 1,992,008
465,842 6,752,231 - 257,139 7,475,212 855,464 (67,847) 787,617
271,372 3,933,454 - 123,699 4,328,525 498,343 (32,638) 465,705
403,396 5,847,101 - 112,302 6,362,799 740,790 (29,631) 711,159
55,422 803,328 - 25,118 883,868 101,776 (6,627) 95,149
701,659 10,170,335 - 551,861 11,423,855 1,288,515 (145,610) 1,142,905
102,537 1,486,235 - - 1,588,772 188,296 5,247 193,543
21

Teachers' and State Employees' Retirement System Schedule of Pension Amounts by EmployerJune 30, 2014
Employer Number Employer
Net Pension Liability
Differences Between Expected
and Actual Experience
Net Difference Between
Projected and Actual
Investment Earnings on Plan
InvestmentsChanges of
Assumptions
Changes in Proportion and
Differences Between Employer
Contributions and Proportionate Share
of Contributions
Total Deferred Outflows of Resources
Deferred Outflows of Resources
36000 Charlotte-Mecklenburg County Schools 66,800,328 - - - - -
36001 Community Charter School 61,669 - - - - -
36002 Kennedy Charter 242,457 - - - 129,778 129,778
36003 Community School of Davidson 508,596 - - - 15,027 15,027
36004 Corvian Community School 101,180 - - - 416,073 416,073
36005 Central Piedmont Community College 5,441,323 - - - 1,230,805 1,230,805
36006 Lake Norman Charter School 624,783 - - - 63,317 63,317
36007 Socrates Academy 212,325 - - - 40,557 40,557
36008 Pine Lake Prep Charter 602,155 - - - 61,454 61,454
36009 Charlotte Secondary Charter 118,649 - - - 79,448 79,448
36100 Mitchell County Schools 927,385 - - - - -
36102 KIPP Charlotte Charter 194,036 - - - - -
36105 Mayland Technical College 492,534 - - - - -
36200 Montgomery County Schools 1,875,170 - - - - -
36205 Montgomery Community College 298,498 - - - 41,636 41,636
36300 Moore County Schools 5,681,083 - - - - -
36301 Academy of Moore County 58,269 - - - 11,172 11,172
36302 Stars Charter School 123,456 - - - 38,870 38,870
36305 Sandhills Community College 1,132,676 - - - - -
36400 Nash-Rocky Mount Schools 6,478,212 - - - - -
36405 Nash Technical College 1,048,848 - - - 330,673 330,673
36500 New Hanover County Schools 12,015,205 - - - 1,189,430 1,189,430
36501 Cape Fear Center for Inquiry 129,435 - - - 5,293 5,293
36502 Wilmington Preperatory Academy 53,111 - - - 24,864 24,864
36505 Cape Fear Community College 2,524,222 - - - 492,818 492,818
36600 Northampton County Schools 1,029,151 - - - - -
36601 Gaston College Preparatory Charter 358,761 - - - 99,364 99,364
36700 Onslow County Schools 10,575,472 - - - 644,967 644,967
36701 ZECA School of the Arts and Technology 25,676 - - - 105,565 105,565
36705 Coastal Carolina Community College 1,193,407 - - - - -
36800 Orange County Schools 3,845,424 - - - - -
36801 PACE Academy 72,925 - - - - -
36802 Orange Charter School 101,766 - - - - -
36810 Chapel Hill - Carboro City Schools 7,373,238 - - - 37,797 37,797
36900 Pamlico County Schools 745,543 - - - 14,591 14,591
36901 Arapahoe Charter School 215,725 - - - - -
36905 Pamlico Community College 244,802 - - - 40,270 40,270
37000 Elizabeth City and Pasquotank County Schools 2,491,746 - - - - -
37005 College of the Albemarle 641,900 - - - 28,222 28,222
37100 Pender County Schools 3,443,635 - - - - -
37200 Perquimans County Schools 843,322 - - - - -
37300 Person County Schools 2,203,214 - - - - -
37301 Roxboro Community School 198,022 - - - 28,680 28,680
37305 Piedmont Community College 836,640 - - - - -
37400 Pitt County Schools 10,587,079 - - - - -
37405 Pitt Community College 2,210,014 - - - 256,551 256,551
37500 Polk County Schools 1,205,483 - - - 171,102 171,102
37600 Randolph County Schools 7,720,392 - - - - -
37601 Uwharrie Charter Academy 49,359 - - - 197,831 197,831
37605 Randolph Community College 872,750 - - - - -
37610 Asheboro City Schools 2,440,043 - - - 22,046 22,046
37700 Richmond County Schools 3,178,433 - - - - -
37705 Richmond Technical College 916,247 - - - 346,726 346,726
37800 Robeson County Schools 9,784,674 - - - 492,662 492,662
37801 Southeastern Academy Charter School 36,462 - - - 152,430 152,430
37805 Robeson Community College 962,558 - - - 167,845 167,845
37900 Rockingham County Schools 5,810,870 - - - 186,788 186,788
37901 Bethany Community Middle School 73,042 - - - 885 885
37905 Rockingham Community College 645,183 - - - 4,636 4,636
38000 Rowan-Salisbury School System 8,483,052 - - - - -
38005 Rowan-Cabarrus Community College 1,675,976 - - - 227,127 227,127
22

Schedule 3
Differences Between Expected
and Actual Experience
Net Difference Between
Projected and Actual
Investment Earnings on Plan
InvestmentsChanges of
Assumptions
Changes in Proportion and
Differences Between Employer
Contributions and Proportionate Share
of Contributions
Total Deferred Inflows of Resources
Proportionate Share of Pension
Expense
Net Amortization of Deferred Amounts from Changes in Proportion
and Differences Between Employer Contributions and Proportionate Share
of Contributions
Total Employer Pension Expense
Pension ExpenseDeferred Inflows of Resources
15,570,795 225,693,890 - 3,453,670 244,718,355 28,593,948 (911,259) 27,682,689
14,375 208,358 - 44,002 266,735 26,398 (11,610) 14,788
56,515 819,172 - - 875,687 103,784 34,242 138,026
118,551 1,718,361 - - 1,836,912 217,705 3,965 221,670
23,584 341,850 - - 365,434 43,310 109,782 153,092
1,268,343 18,384,242 - - 19,652,585 2,329,164 324,751 2,653,915
145,634 2,110,914 - - 2,256,548 267,439 16,706 284,145
49,492 717,370 - - 766,862 90,886 10,701 101,587
140,359 2,034,463 - - 2,174,822 257,753 16,215 273,968
27,656 400,872 - - 428,528 50,788 20,962 71,750
216,168 3,133,295 - 160,342 3,509,805 396,968 (42,307) 354,661
45,229 655,576 - 34,241 735,046 83,057 (9,035) 74,022
114,807 1,664,093 - 54,174 1,833,074 210,830 (14,294) 196,536
437,092 6,335,514 - 66,848 6,839,454 802,668 (17,638) 785,030
69,578 1,008,517 - - 1,078,095 127,773 10,986 138,759
1,324,230 19,194,303 - 238,265 20,756,798 2,431,793 (62,867) 2,368,926
13,582 196,871 - - 210,453 24,942 2,948 27,890
28,777 417,112 - - 445,889 52,845 10,256 63,101
264,021 3,826,898 - 123,226 4,214,145 484,843 (32,513) 452,330
1,510,036 21,887,511 - 2,375,974 25,773,521 2,773,005 (626,906) 2,146,099
244,481 3,543,673 - - 3,788,154 448,960 87,249 536,209
2,800,679 40,594,985 - - 43,395,664 5,143,121 313,834 5,456,955
30,171 437,314 - - 467,485 55,405 1,396 56,801
12,380 179,442 - - 191,822 22,734 6,561 29,295
588,383 8,528,425 - - 9,116,808 1,080,496 130,031 1,210,527
239,890 3,477,126 - 145,886 3,862,902 440,529 (38,492) 402,037
83,625 1,212,122 - - 1,295,747 153,568 26,217 179,785
2,465,085 35,730,654 - - 38,195,739 4,526,841 170,176 4,697,017
5,985 86,750 - - 92,735 10,991 27,853 38,844
278,177 4,032,087 - 119,495 4,429,759 510,839 (31,529) 479,310
896,347 12,992,281 - 146,535 14,035,163 1,646,037 (38,664) 1,607,373
16,998 246,386 - 12,362 275,746 31,215 (3,262) 27,953
23,721 343,831 - 51,808 419,360 43,561 (13,670) 29,891
1,718,662 24,911,477 - - 26,630,139 3,156,122 9,973 3,166,095
173,782 2,518,916 - - 2,692,698 319,130 3,850 322,980
50,284 728,857 - 1,874 781,015 92,342 (495) 91,847
57,062 827,095 - - 884,157 104,788 10,625 115,413
580,813 8,418,700 - 375,483 9,374,996 1,066,595 (99,072) 967,523
149,624 2,168,747 - - 2,318,371 274,766 7,447 282,213
802,693 11,634,784 - 714,002 13,151,479 1,474,051 (188,391) 1,285,660
196,574 2,849,278 - 104,540 3,150,392 360,985 (27,583) 333,402
513,557 7,443,853 - 495,753 8,453,163 943,088 (130,806) 812,282
46,158 669,044 - - 715,202 84,763 7,567 92,330
195,016 2,826,699 - 87,330 3,109,045 358,124 (23,042) 335,082
2,467,791 35,769,870 - 685,836 38,923,497 4,531,810 (180,959) 4,350,851
515,142 7,466,828 - - 7,981,970 945,999 67,692 1,013,691
280,992 4,072,887 - - 4,353,879 516,008 45,146 561,154
1,799,582 26,084,383 - 216,859 28,100,824 3,304,722 (57,219) 3,247,503
11,505 166,766 - - 178,271 21,128 52,198 73,326
203,433 2,948,704 - 6,261 3,158,398 373,582 (1,652) 371,930
568,761 8,244,012 - - 8,812,773 1,044,463 5,817 1,050,280
740,876 10,738,764 - 289,383 11,769,023 1,360,532 (76,354) 1,284,178
213,572 3,095,664 - - 3,309,236 392,200 91,485 483,685
2,280,755 33,058,837 - - 35,339,592 4,188,340 129,990 4,318,330
8,499 123,193 - - 131,692 15,608 40,219 55,827
224,367 3,252,130 - - 3,476,497 412,024 44,286 456,310
1,354,482 19,632,806 - - 20,987,288 2,487,349 49,284 2,536,633
17,026 246,782 - - 263,808 31,266 233 31,499
150,389 2,179,838 - - 2,330,227 276,171 1,223 277,394
1,977,354 28,661,132 - 2,147,869 32,786,355 3,631,179 (566,720) 3,064,459
390,661 5,662,510 - - 6,053,171 717,403 59,928 777,331
23
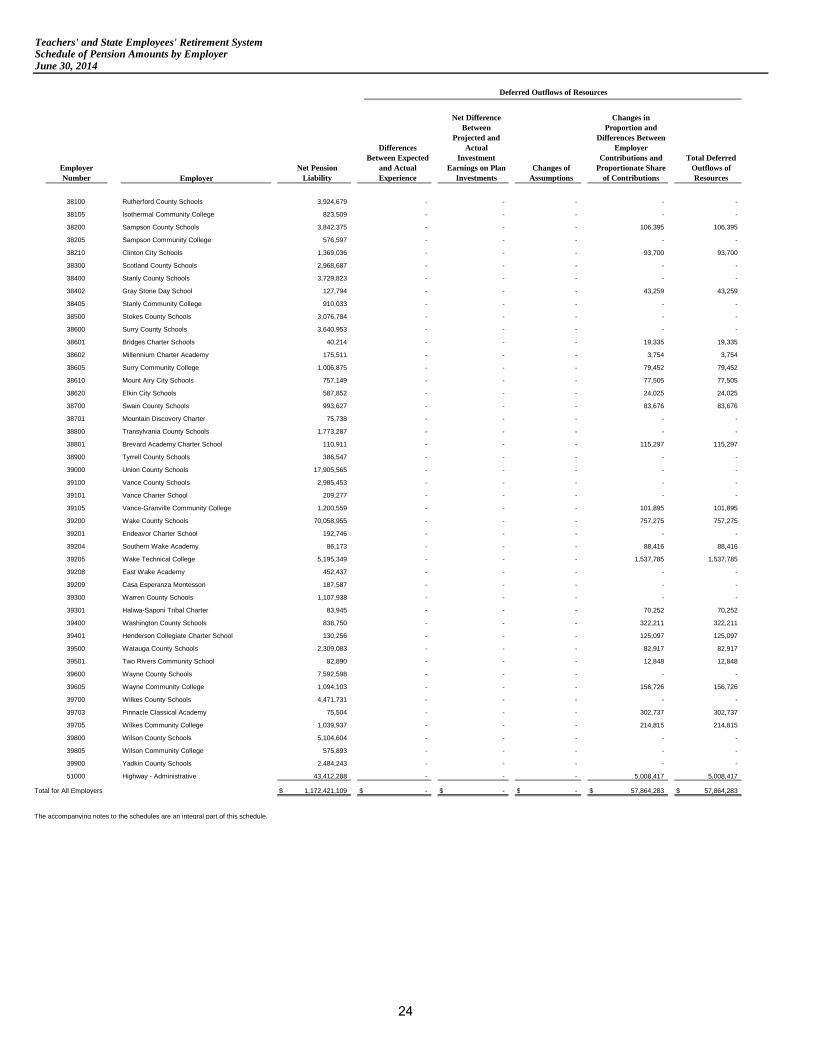
Teachers' and State Employees' Retirement System Schedule of Pension Amounts by EmployerJune 30, 2014
Employer Number Employer
Net Pension Liability
Differences Between Expected
and Actual Experience
Net Difference Between
Projected and Actual
Investment Earnings on Plan
InvestmentsChanges of
Assumptions
Changes in Proportion and
Differences Between Employer
Contributions and Proportionate Share
of Contributions
Total Deferred Outflows of Resources
Deferred Outflows of Resources
38100 Rutherford County Schools 3,924,679 - - - - -
38105 Isothermal Community College 823,509 - - - - -
38200 Sampson County Schools 3,842,375 - - - 106,395 106,395
38205 Sampson Community College 576,597 - - - - -
38210 Clinton City Schools 1,369,036 - - - 93,700 93,700
38300 Scotland County Schools 2,968,687 - - - - -
38400 Stanly County Schools 3,729,823 - - - - -
38402 Gray Stone Day School 127,794 - - - 43,259 43,259
38405 Stanly Community College 910,033 - - - - -
38500 Stokes County Schools 3,076,784 - - - - -
38600 Surry County Schools 3,640,953 - - - - -
38601 Bridges Charter Schools 40,214 - - - 19,335 19,335
38602 Millennium Charter Academy 175,511 - - - 3,754 3,754
38605 Surry Community College 1,006,875 - - - 79,452 79,452
38610 Mount Airy City Schools 757,149 - - - 77,505 77,505
38620 Elkin City Schools 587,852 - - - 24,025 24,025
38700 Swain County Schools 993,627 - - - 83,676 83,676
38701 Mountain Discovery Charter 75,738 - - - - -
38800 Transylvania County Schools 1,773,287 - - - - -
38801 Brevard Academy Charter School 110,911 - - - 115,297 115,297
38900 Tyrrell County Schools 386,547 - - - - -
39000 Union County Schools 17,905,565 - - - - -
39100 Vance County Schools 2,985,453 - - - - -
39101 Vance Charter School 209,277 - - - - -
39105 Vance-Granville Community College 1,200,559 - - - 101,895 101,895
39200 Wake County Schools 70,058,955 - - - 757,275 757,275
39201 Endeavor Charter School 192,746 - - - - -
39204 Southern Wake Academy 86,173 - - - 88,416 88,416
39205 Wake Technical College 5,195,349 - - - 1,537,785 1,537,785
39208 East Wake Academy 452,437 - - - - -
39209 Casa Esperanza Montessori 187,587 - - - - -
39300 Warren County Schools 1,107,938 - - - - -
39301 Haliwa-Saponi Tribal Charter 83,945 - - - 70,252 70,252
39400 Washington County Schools 838,750 - - - 322,211 322,211
39401 Henderson Collegiate Charter School 130,256 - - - 125,097 125,097
39500 Watauga County Schools 2,309,083 - - - 82,917 82,917
39501 Two Rivers Community School 82,890 - - - 12,848 12,848
39600 Wayne County Schools 7,592,598 - - - - -
39605 Wayne Community College 1,094,103 - - - 156,726 156,726
39700 Wilkes County Schools 4,471,731 - - - - -
39703 Pinnacle Classical Academy 75,504 - - - 302,737 302,737
39705 Wilkes Community College 1,039,937 - - - 214,815 214,815
39800 Wilson County Schools 5,104,604 - - - - -
39805 Wilson Community College 575,893 - - - - -
39900 Yadkin County Schools 2,484,243 - - - - -
51000 Highway - Administrative 43,412,288 - - - 5,008,417 5,008,417
Total for All Employers $ 1,172,421,109 $ - $ - $ - $ 57,864,283 $ 57,864,283
The accompanying notes to the schedules are an integral part of this schedule.
24

Schedule 3
Differences Between Expected
and Actual Experience
Net Difference Between
Projected and Actual
Investment Earnings on Plan
InvestmentsChanges of
Assumptions
Changes in Proportion and
Differences Between Employer
Contributions and Proportionate Share
of Contributions
Total Deferred Inflows of Resources
Proportionate Share of Pension
Expense
Net Amortization of Deferred Amounts from Changes in Proportion
and Differences Between Employer Contributions and Proportionate Share
of Contributions
Total Employer Pension Expense
Pension ExpenseDeferred Inflows of Resources
914,822 13,260,057 - 807,295 14,982,174 1,679,963 (213,007) 1,466,956
191,955 2,782,334 - 30,766 3,005,055 352,504 (8,118) 344,386
895,637 12,981,982 - - 13,877,619 1,644,733 28,073 1,672,806
134,402 1,948,109 - 27,467 2,109,978 246,813 (7,247) 239,566
319,115 4,625,472 - - 4,944,587 586,017 24,723 610,740
691,985 10,030,109 - 890,706 11,612,800 1,270,750 (235,015) 1,035,735
869,402 12,601,708 - 873,627 14,344,737 1,596,554 (230,508) 1,366,046
29,788 431,769 - - 461,557 54,702 11,414 66,116
212,124 3,074,669 - 90,367 3,377,160 389,541 (23,844) 365,697
717,182 10,395,330 - 238,224 11,350,736 1,317,021 (62,856) 1,254,165
848,687 12,301,451 - 811,679 13,961,817 1,558,514 (214,163) 1,344,351
9,374 135,869 - - 145,243 17,214 5,102 22,316
40,911 592,989 - - 633,900 75,128 991 76,119
234,697 3,401,863 - - 3,636,560 430,994 20,964 451,958
176,487 2,558,131 - - 2,734,618 324,099 20,450 344,549
137,025 1,986,137 - - 2,123,162 251,631 6,339 257,970
231,609 3,357,102 - - 3,588,711 425,323 22,078 447,401
17,654 255,892 - 43,674 317,220 32,420 (11,524) 20,896
413,344 5,991,288 - 48,080 6,452,712 759,057 (12,686) 746,371
25,853 374,728 - - 400,581 47,476 30,421 77,897
90,102 1,306,002 - 103,198 1,499,302 165,462 (27,229) 138,233
4,173,691 60,496,360 - 1,980,301 66,650,352 7,664,495 (522,507) 7,141,988
695,893 10,086,754 - 262,006 11,044,653 1,277,926 (69,131) 1,208,795
48,781 707,071 - 13,131 768,983 89,581 (3,465) 86,116
279,844 4,056,250 - - 4,336,094 513,901 26,885 540,786
16,330,364 236,703,599 - - 253,033,963 29,988,807 199,809 30,188,616
44,928 651,218 - 20,776 716,922 82,505 (5,482) 77,023
20,086 291,147 - - 311,233 36,886 23,329 60,215
1,211,008 17,553,186 - - 18,764,194 2,223,874 405,748 2,629,622
105,461 1,528,620 - 165,964 1,800,045 193,666 (43,790) 149,876
43,726 633,789 - 68,278 745,793 80,297 (18,015) 62,282
258,254 3,743,317 - 65,851 4,067,422 474,254 (17,375) 456,879
19,567 283,621 - - 303,188 35,933 18,536 54,469
195,508 2,833,830 - - 3,029,338 359,028 85,016 444,044
30,362 440,087 - - 470,449 55,756 33,007 88,763
538,235 7,801,548 - - 8,339,783 988,405 21,878 1,010,283
19,321 280,056 - - 299,377 35,481 3,390 38,871
1,769,794 25,652,615 - 1,319,981 28,742,390 3,250,019 (348,280) 2,901,739
255,030 3,696,575 - - 3,951,605 468,332 41,352 509,684
1,042,336 15,108,344 - 365,736 16,516,416 1,914,129 (96,500) 1,817,629
17,600 255,100 - - 272,700 32,320 79,878 112,198
242,404 3,513,568 - - 3,755,972 445,146 56,679 501,825
1,189,856 17,246,590 - 1,007,680 19,444,126 2,185,031 (265,879) 1,919,152
134,238 1,945,733 - 75,425 2,155,396 246,512 (19,901) 226,611
579,064 8,393,349 - 471,290 9,443,703 1,063,383 (124,351) 939,032
10,119,170 146,674,251 - - 156,793,421 18,582,674 1,321,482 19,904,156
$ 273,285,034 $ 3,961,182,394 $ - $ 57,863,892 $ 4,292,331,320 $ 501,856,048 $ 103 $ 501,856,151
25

NOTES TO THE SCHEDULES

26
NOTES TO THE SCHEDULES
NOTE 1 - PLAN DESCRIPTION
A. Plan Administration - The State of North Carolina administers the Teachers’ and State Employees’ Retirement System (TSERS or Plan) plan. This Plan is a cost-sharing, multiple-employer, defined benefit plan established by the State to provide pension benefits for general employees and law enforcement officers (LEOs) of the State, general employees and LEOs of its component units, and employees of Local Education Agencies (LEAs) and charter schools not in the reporting entity. Membership is comprised of employees of the State (state agencies and institutions), universities, community colleges, and certain proprietary component units along with the LEAs and charter schools. Benefit provisions are established by North Carolina General Statute 135-5 and may be amended only by the North Carolina General Assembly. The number of employers receiving allocations that made contributions during fiscal year ended June 30, 2014, is 293.
Management of the Plan is vested in the TSERS Board of Trustees, which consists of 13 members – nine appointed by the Governor, one appointed by the state Senate, one appointed by the state House of Representatives, and the State Treasurer and the State Superintendent, who serve as ex-officio members.
B. Benefits Provided - TSERS provides retirement and survivor benefits. Retirement benefits are determined as 1.82% of the member’s average final compensation times the member’s years of creditable service. A member’s average final compensation is calculated as the average of a member’s four highest consecutive years of compensation. General employee plan members are eligible to retire with full retirement benefits at age 65 with five years of creditable service (or 10 years of creditable service for members joining TSERS on or after August 1, 2011), at age 60 with 25 years of creditable service, or at any age with 30 years of creditable service. General employee plan members are eligible to retire with partial retirement benefits at age 50 with 20 years of creditable service or at age 60 with five years of creditable service (or 10 years of creditable service for members joining TSERS on or after August 1, 2011). Survivor benefits are available to eligible beneficiaries of general members who die while in active service or within 180 days of their last day of service and who also have either completed 20 years of creditable service regardless of age, or have completed five years of service and have reached age 60 (10 years for members joining on or after August 1, 2011). Eligible beneficiaries may elect to receive a monthly Survivor’s Alternate Benefit for life or a return of the member’s contributions. The plan does not provide for automatic postretirement benefit increases. Increases are contingent upon actuarial gains of the plan.
TSERS plan members who are LEOs are eligible to retire with full retirement benefits at age 55 with five years of creditable service as an officer (or 10 years of creditable service for members joining TSERS on

27
NOTES TO THE SCHEDULES
or after August 1, 2011), or at any age with 30 years of creditable service. LEO plan members are eligible to retire with partial retirement benefits at age 50 with 15 years of creditable service as an officer. Survivor benefits are available to eligible beneficiaries of LEO members who die while in active service or within 180 days of their last day of service and who also have either completed 20 years of creditable service regardless of age, or have completed 15 years of creditable service as an LEO and have reached age 50, or have completed five years of creditable service as an LEO and have reached age 55, or have completed 15 years of creditable service as an LEO if killed in the line of duty. Eligible beneficiaries may elect to receive a monthly Survivor’s Alternate Benefit for life or a return of the member’s contributions.
C. Contributions - Benefits and administrative expenses are funded by member contributions of 6% of compensation, investment income, and by an actuarially determined employer contribution established by legislation. For the fiscal year ended June 30, 2014, the State and other participating employers made statutory contributions of 8.69% of covered payroll. This was equal to the actuarially determined contribution. Contribution provisions are established by North Carolina General Statute 135-8 and may be amended only by the North Carolina General Assembly.
D. Refunds of Contributions - Members who have terminated service as a contributing member, may file an application for a refund of their contributions. By state law, refunds to members with at least five years of service include 4% interest. State law requires a 60 day waiting period after service termination before the refund may be paid. The acceptance of a refund payment cancels the individual’s right to the employer contributions or any other benefit provided by TSERS.
NOTE 2 - SUMMARY OF SIGNIFICANT ACCOUNTING AND REPORTING POLICIES
A. Basis of Accounting - Employers participating in TSERS are required to report pension information in their financial statements for fiscal periods beginning on or after June 15, 2014 in accordance with Governmental Accounting Standards Board Statement No. 68, Accounting and Financial Reporting for Pensions (GASB Statement No. 68). The Schedules of Employer Allocations and the Schedule of Pension Amounts by Employer provide employers with the required information for financial reporting.
There are three schedules (two Schedules of Employer Allocations for the fiscal years ended June 30, 2013 and June 30, 2014 and a Schedule of Pension Amounts by Employer for the fiscal year ended June 30, 2014, collectively the “pension schedules”) for use by the employers in the TSERS plan. The underlying financial information used to prepare the pension schedules is based on TSERS’s financial statements. The financial statements of this Plan are prepared using the accrual basis of accounting. Plan member contributions are recognized in the period in which the contributions are due. Employer contributions are
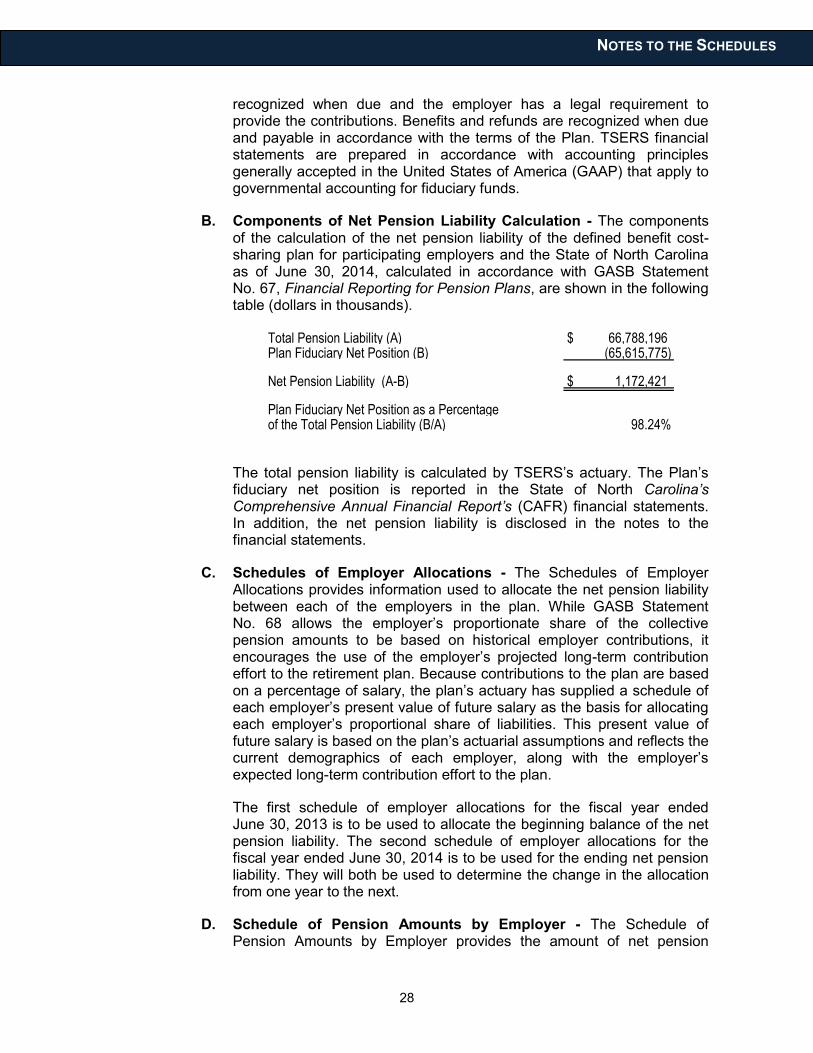
28
NOTES TO THE SCHEDULES
recognized when due and the employer has a legal requirement to provide the contributions. Benefits and refunds are recognized when due and payable in accordance with the terms of the Plan. TSERS financial statements are prepared in accordance with accounting principles generally accepted in the United States of America (GAAP) that apply to governmental accounting for fiduciary funds.
B. Components of Net Pension Liability Calculation - The components of the calculation of the net pension liability of the defined benefit cost-sharing plan for participating employers and the State of North Carolina as of June 30, 2014, calculated in accordance with GASB Statement No. 67, Financial Reporting for Pension Plans, are shown in the following table (dollars in thousands).
Total Pension Liability (A) $ 66,788,196Plan Fiduciary Net Position (B) (65,615,775)
Net Pension Liability (A-B) $ 1,172,421
Plan Fiduciary Net Position as a Percentageof the Total Pension Liability (B/A) 98.24%
The total pension liability is calculated by TSERS’s actuary. The Plan’s fiduciary net position is reported in the State of North Carolina’s Comprehensive Annual Financial Report’s (CAFR) financial statements. In addition, the net pension liability is disclosed in the notes to the financial statements.
C. Schedules of Employer Allocations - The Schedules of Employer Allocations provides information used to allocate the net pension liability between each of the employers in the plan. While GASB Statement No. 68 allows the employer’s proportionate share of the collective pension amounts to be based on historical employer contributions, it encourages the use of the employer’s projected long-term contribution effort to the retirement plan. Because contributions to the plan are based on a percentage of salary, the plan’s actuary has supplied a schedule of each employer’s present value of future salary as the basis for allocating each employer’s proportional share of liabilities. This present value of future salary is based on the plan’s actuarial assumptions and reflects the current demographics of each employer, along with the employer’s expected long-term contribution effort to the plan.
The first schedule of employer allocations for the fiscal year ended June 30, 2013 is to be used to allocate the beginning balance of the net pension liability. The second schedule of employer allocations for the fiscal year ended June 30, 2014 is to be used for the ending net pension liability. They will both be used to determine the change in the allocation from one year to the next.
D. Schedule of Pension Amounts by Employer - The Schedule of Pension Amounts by Employer provides the amount of net pension

29
NOTES TO THE SCHEDULES
liability as well as deferred inflows and outflows and pension expense to be reported in the financial statements of each employer participant in the plan. Amounts reported on the Schedule of Pension Amounts by Employer may not precisely agree with the percentages in the Schedules of Employer Allocations due to the number of decimal places used in allocating the collective pension amounts.
The Proportional Share of Pension Expense includes the amortization of the difference between expected and actual experience with regard to economic and demographic factors as well as any changes of assumptions, if applicable, which are amortized over a closed period equal to the average of the expected remaining service lives of all employees that are provided with pensions through the pension plan. This period is 4.79 years. The remaining unamortized balance is included in either deferred outflow of resources or in deferred inflow of resources as indicated.
NOTE 3 - ACTUARIAL METHODS AND ASSUMPTIONS
The total pension liability was determined by an actuarial valuation performed as of December 31, 2013. The total pension liability was calculated through the use of update procedures to roll forward from the actuarial valuation date to the measurement date of June 30, 2014. The update procedures incorporated the actuarial assumptions used in the valuation. The entry age normal actuarial cost method was utilized. Inflation is assumed to be 3% and salary increases range 4.25% to 9.10% which includes 3.5% inflation and productivity factor. The long-term expected rate of return on pension plan investments used in the determination of the total pension liability is 7.25% and is net of pension plan investment expense, including inflation.
TSERS currently uses mortality tables that vary by age, gender, employee group (i.e. teacher, general, law enforcement officer) and health status (i.e. disabled and healthy). The current mortality rates are based on published tables and based on studies that cover significant portions of the U.S. population. The healthy mortality rates also contain a provision to reflect future mortality improvements.
The actuarial assumptions used in the December 31, 2013 valuations were based on the results of an actuarial experience study for the period January 1, 2005 through December 31, 2009.
NOTE 4 - ADDITIONAL FINANCIAL AND ACTUARIAL INFORMATION
These financial schedules are designed to provide employers information for implementation of GASB Statement No. 68. Additional financial information for TSERS (including the disclosure of the net pension liability) is located in the State of North Carolina’s Comprehensive Annual Financial Report for the fiscal year ended June 30, 2014. The additional financial and actuarial

30
NOTES TO THE SCHEDULES
information is available at http://www.osc.nc.gov/financial/14_cafr/index.html or by contacting TSERS at:
TSERS 3200 Atlantic Avenue Raleigh, North Carolina 27604, https://www.nctreasurer.com/ret/Pages/Valuation-Reports.aspx.

STATE OF NORTH CAROLINA Office of the State Auditor
Beth A. Wood, CPA
State Auditor
31
2 S. Salisbury Street 20601 Mail Service Center Raleigh, NC 27699-0601
Telephone: (919) 807-7500 Fax: (919) 807-7647
http://www.ncauditor.net
INDEPENDENT AUDITOR’S REPORT ON INTERNAL CONTROL OVER FINANCIAL REPORTING
AND ON COMPLIANCE AND OTHER MATTERS BASED ON AN AUDIT OF FINANCIAL STATEMENTS PERFORMED IN ACCORDANCE WITH
GOVERNMENT AUDITING STANDARDS
The Honorable Janet Cowell, State Treasurer and Management of the Department of State Treasurer
We have audited, in accordance with the auditing standards generally accepted in the United States of America and the standards applicable to financial audits contained in Government Auditing Standards issued by the Comptroller General of the United States, the accompanying Schedule of Employer Allocations of the Teachers’ and State Employee’s Retirement System as of and for the years ended June 30, 2014 and June 30, 2013, and the related notes and the total for all entities of the columns titled net pension liability, total deferred outflows of resources, total deferred inflows of resources, and the total pension expense included in the accompanying Schedule of Pension Amounts by Employer as of and for the year ended June 30, 2014, and the related notes (hereafter referred to as “the Schedules”) and have issued our report thereon dated June 16, 2015.
Internal Control Over Financial Reporting
In planning and performing our audit of the Schedules, we considered the entity’s internal control over financial reporting (internal control) to determine the audit procedures that are appropriate in the circumstances for the purpose of expressing our opinion on the Schedules, but not for the purpose of expressing an opinion on the effectiveness of the entity’s internal control. Accordingly, we do not express an opinion on the effectiveness of the entity’s internal control.
A deficiency in internal control exists when the design or operation of a control does not allow management or employees, in the normal course of performing their assigned functions, to prevent, or detect and correct, misstatements on a timely basis. A material weakness is a deficiency, or a combination of deficiencies, in internal control such that there is a reasonable possibility that a material misstatement of the entity’s Schedules will not be prevented, or detected and corrected on a timely basis. A significant deficiency is a deficiency, or a combination of deficiencies, in internal control that is less severe than a material weakness, yet important enough to merit attention by those charged with governance.

32
INDEPENDENT AUDITOR’S REPORT
Our consideration of internal control was for the limited purpose described in the first paragraph of this section and was not designed to identify all deficiencies in internal control that might be material weaknesses or significant deficiencies. Given these limitations, during our audit we did not identify any deficiencies in internal control that we consider to be material weaknesses. However, material weaknesses may exist that have not been identified.
Compliance and Other Matters
As part of obtaining reasonable assurance about whether the entity’s Schedules are free from material misstatement, we performed tests of its compliance with certain provisions of laws, regulations, contracts, and grant agreements, noncompliance with which could have a direct and material effect on the determination of the amounts in the Schedules. However, providing an opinion on compliance with those provisions was not an objective of our audit, and accordingly, we do not express such an opinion. The results of our tests disclosed no instances of noncompliance or other matters that are required to be reported under Government Auditing Standards.
Purpose of this Report
The purpose of this report is solely to describe the scope of our testing of internal control and compliance and the results of that testing, and not to provide an opinion on the effectiveness of the entity’s internal control or on compliance. This report is an integral part of an audit performed in accordance with Government Auditing Standards in considering the entity’s internal control and compliance. Accordingly, this communication is not suitable for any other purpose.
Beth A. Wood, CPA State Auditor
Raleigh, North Carolina
June 16, 2015

This audit required 402.5 audit hours at an approximate cost of $37,835.
33
ORDERING INFORMATION
COPIES OF THIS REPORT MAY BE OBTAINED BY CONTACTING:
Office of the State Auditor
State of North Carolina
2 South Salisbury Street
20601 Mail Service Center
Raleigh, North Carolina 27699-0601
Telephone: 919-807-7500
Facsimile: 919-807-7647
Internet: http://www.ncauditor.net
To report alleged incidents of fraud, waste or abuse in state government contact the
Office of the State Auditor Fraud Hotline: 1-800-730-8477
or download our free app.
https://play.google.com/store/apps/details?id=net.ncauditor.ncauditor
https://itunes.apple.com/us/app/nc-state-auditor-hotline/id567315745
For additional information contact:
Bill Holmes
Director of External Affairs
919-807-7513