teacher supply and demand in new york state supply and demand in new york state third annual report...
TRANSCRIPT
Teacher Supply and Demand in New York State
Third Annual Report
The University of the State of New York The New York State Education Department
Office of Higher Education May 2008

THE UNIVERSITY OF THE STATE OF NEW YORK
Regents of The University
ROBERT M. BENNETT, Chancellor, B.A., M.S. ................................................................. Tonawanda MERRYL H. TISCH, Vice Chancellor, B.A., M.A., Ed.D. ................................................ New York SAUL B. COHEN, B.A., M.A., Ph.D. ................................................................................ New Rochelle JAMES C. DAWSON, A.A., B.A., M.S., Ph.D. ................................................................. Peru ANTHONY S. BOTTAR, B.A., J.D. .................................................................................... Syracuse GERALDINE D. CHAPEY, B.A., M.A., Ed.D. ................................................................... Belle Harbor ARNOLD B. GARDNER, B.A., LL.B. .................................................................................. Buffalo HARRY PHILLIPS, 3rd, B.A., M.S.F.S. ............................................................................. Hartsdale JOSEPH E. BOWMAN, JR., B.A., M.L.S., M.A., M.Ed., Ed.D........................................... Albany JAMES R. TALLON, JR., B.A., M.A. ................................................................................. Binghamton MILTON L. COFIELD, B.S., M.B.A., Ph.D. ...................................................................... Rochester ROGER B. TILLES, B.A., J.D............................................................................................... Great Neck KAREN BROOKS HOPKINS, B.A., M.F.A.......................................................................... Brooklyn CHARLES R. BENDIT, B.A. ............................................................................................... Manhattan BETTY A. ROSA, B.A., M.S. in Ed., M.S. in Ed., M.Ed., Ed.D…………………………. Bronx LESTER W. YOUNG, JR., B.S., M.S., Ed. D ……………………………………………….. Oakland Gardens President of The University and Commissioner of Education RICHARD P. MILLS Senior Deputy Commissioner of Education: P‐16 JOHANNA DUNCAN‐POITIER Associate Commissioner JOSEPH P. FREY Special Projects Coordinator NANCY WILLIE‐SCHIFF

i
Executive Summary This third annual report on teacher supply and demand is part of the ongoing evaluation of the teaching policies established by the Board of Regents (Regents). It contains multiple indicators of progress based on data from school year 2006-2007, the most recent available. Summary of findings New York State’s public schools made progress toward meeting Regents and federal teacher quality goals. In 2006-2007, students were more likely to be taught by appropriately certified, highly qualified and experienced teachers than in prior years. But more progress is needed to address remaining shortages.
• Teachers of core academic subjects. In 2006-2007, over 95 percent of classes in core academic subjects in New York State’s public schools were taught by teachers who met the federal definition of highly qualified, but the percent was lower in high poverty middle and secondary schools, in three of the State’s large cities, and in subject areas such as languages other than English and science. To be highly qualified, teachers must have a bachelor’s degree or higher, meet State certification standards and demonstrate that they know the subject(s) they teach using one of the methods required by federal law.
• Inexperienced teachers. Federal law requires states and districts to have plans
to ensure that low income and minority children are as likely as other children to have experienced teachers. Teachers with no prior experience are less likely than other teachers to be effective at raising student achievement. In 2006-2007, five percent of teachers in New York State had no prior teaching experience, a slight decline from prior years. In New York City, more than eight percent of teachers had no prior teaching experience.
• Teachers of all subjects. In 2006-2007, five percent of full-time equivalent
teaching assignments in all subjects in New York State’s public schools were taught by teachers without appropriate certification. The percent was higher in New York City and in subject areas such as bilingual education, languages other than English (LOTE), library/school media specialists, sciences, middle/secondary level special education and bilingual special education.
• Certificates issued to new teachers. In 2006-2007, New York State issued
over 39,900 certificates to new teachers, defined as teachers who had not been in the public school workforce in the prior five years. More than two certificates were issued to new teachers for each vacancy for a new teacher that year in most subject areas and geographic regions, which suggests that there were enough teachers to meet districts’ hiring needs if teachers were willing and able to work where they were needed. However, three subject

ii
areas had two or fewer certificates issued to new teachers for each vacancy for a new teacher, suggesting shortages. These subject areas were career and technical education, LOTE and library/school media specialists.
• Teachers’ race/ethnicity. In fall 2004, Black and Hispanic students were 40
percent of all public school students, but Black and Hispanic teachers were only 15 percent of all teachers. In 2006-2007, among the sixty percent of new teachers whose race/ethnicity was known, only six percent of certificates issued to new teachers went to teachers who were Black or Hispanic. There are clear shortages of Black and Hispanic teachers compared to the student population.
• Future demand for teachers. In 2006-2007, 18 percent of FTE teaching
positions were held by teachers who were age 55 or older, a larger share than in prior years. There were large percentages of this age cohort in every subject area and region. Demand for new teachers is likely to continue at current levels as “baby boomers” continue to retire.
Initiatives to address remaining shortages The Regents and State Education Department use multiple approaches to help school districts meet their hiring needs and will continue to seek new approaches until all students have the qualified teachers they need. Four key strategies to address remaining shortages are a certification policy review, financial incentives, regional partnerships and strengthening teaching and learning.
• Certification policy review. To ensure that certification requirements are not inadvertently contributing to teacher shortages, the Regents plan to continue the Individual Evaluation (Transcript Evaluation) pathway to certification beyond February 2009 when it is scheduled to expire. In addition, the Regents will be asked to consider certification reforms in shortage subject areas such as special education, career and technical education, languages other than English and science to increase the supply of certified teachers without compromising quality. (See initiatives to address remaining shortages on page 32 for greater detail.)
• Financial incentives. New York State must offer financial incentives to attract
and retain public school teachers because we are competing with other states for the available supply of teachers and with other industries that are attractive to young professionals. The Department will review existing incentive programs to ensure that they are sufficiently targeted on the most hard-to-staff subject areas and schools and will explore new federal programs focused on teacher shortages. Current State and federal programs that provide funds to teacher preparation institutions, school districts and individual teachers for recruitment, preparation and retention are shown below.

iii
Federal programs − NCLB Title I and Title II-A allocations to districts − NCLB Teacher-Leader Partnerships − Troops to Teachers − Transition to Teaching − Loan forgiveness for teachers − TEACH grants
State programs
− Teachers of Tomorrow − Teacher Opportunity Corps − The Mentor Internship program − Scholarships for math and science teachers − Teacher Centers − Albert Shanker stipends for National Board Certification
In addition, the Regents and Department are advocating for State legislation to eliminate the pension penalty for retired public employees who agree to work in shortage subjects in high need schools and to create a new $25 million program to prepare 1,000 new teachers in hard-to-staff subject areas and schools. The Department is also advocating for federal legislation to enhance teacher recruitment in shortage areas and provide loan forgiveness to BOCES teachers, who are currently excluded. Local districts are also using financial incentives, such as the New York City housing incentive.
Finally, the Department is examining its internal structure and operations to improve its statewide approach to addressing teacher shortages. We must align our research, policy and financial resources and be more strategic in our use of existing financial and human resources to help to ensure that all children are taught by highly qualified teachers.
• Regional partnerships. The Department is working in five regions of the State
with BOCES, school districts, teacher preparation institutions and others to create or strengthen partnerships to support teacher quality. The five regions include the Rochester area, the Syracuse area, the Southern Tier, the Mid-Hudson area and Long Island. The partnerships are addressing such issues as obtaining regional data on districts’ hiring needs, improving pre-service field experience and student teaching, and extending the knowledge, skills and abilities of new and veteran teachers. The Department plans to extend partnerships to all regions of the State.
The Department is releasing reports and databases for use in these regional partnerships to inform school districts, BOCES, teacher preparation institutions and the general public about the subject areas and regions where new teachers are needed or not needed. The information can help colleges and

iv
universities plan their programs, districts and BOCES plan their recruitment strategies, and students and their families make educational and career choices.
• Strengthening teaching and learning. On May 12, 2008 the Regents are
convening a special meeting in Yonkers to discuss the needs of urban students and how they can be met, including the knowledge, skills and abilities that new and veteran teachers need to have to help their students succeed. Participants will consider best practices for meeting the needs of urban students, including those who are at risk of dropping out of school, require special education services or are learning English. The Department is also applying for a Wallace Foundation grant to focus on the preparation and professional development of school leaders who play a critical role in school improvement.
v
Table of Contents
Introduction ................................................................................................................ 1 Indicator 1 Percent of Core Classes Taught by Teachers Who Were Not Highly Qualified....................................................................................... 2 Figures 1.1 through 1.6 ................................................................................................... 3 Indicator 2 Percent of Full-time Equivalent Teaching Assignments Held by Teachers with No Prior Teaching Experience .................................................... 7 Figures 2.1 and 2.2 ......................................................................................................... 8 Indicator 3 Percent of Full-time Equivalent Teaching Assignments Held by Teachers without Appropriate Certification ........................................................ 9 Figures 3.1 through 3.10 ............................................................................................... 10 Indicator 4 Number of Certificates Issued to New Teachers for Each Vacancy Filled by a New Teacher................................................................... 17 Figures 4.1 through 4.7 ................................................................................................. 20 Indicator 5 Percent of Full-Time Equivalent Teaching Positions Held by Teachers Age 55 or Older ................................................................................ 27 Figures 5.1 and 5.3 ....................................................................................................... 27 Indicator 6 Percent of Certificates Issued to New Teachers Who Were Black or Hispanic......................................................................................... 30 Figure 6.1 ...................................................................................................................... 30 Summary of Findings ............................................................................................ `31 Figure 7.1 ...................................................................................................................... 31 Initiatives to Address Remaining Shortages ................................................. 32 References ................................................................................................................ 37 Appendix A Technical Information .................................................................................................... 38
1
Introduction This third annual report on teacher supply and demand is part of the ongoing
evaluation of the teaching policies established by the Board of Regents (Regents). It contains multiple indicators of teacher shortages based on data from 2006-2007, the most recent available.
New York State’s public schools made progress toward meeting Regents and
federal teacher quality goals. In 2006-2007, students were more likely to be taught by appropriately certified, highly qualified and experienced teachers than in prior years. But more progress is needed to address remaining shortages.
The Regents strategies to enhance teacher quality are part of their overarching
strategy to improve student learning and close achievement gaps and have contributed to progress made through 2006-2007. For example:
• The Regents set new, high standards for teacher preparation programs and
teacher certification so that new teachers are prepared to help all students meet New York State Learning Standards.
• The Regents eliminated temporary licenses and modified temporary licenses for
uncertified individuals as of September 2005. • The Regents established new pathways to certification to enable school districts
and their university partners to recruit career changers and others into teaching. • The Regents required districts to provide mentoring to all first year teachers to
help them succeed and encourage them to stay in the classroom. • The Department’s new online certification system, TEACH, helps eligible
candidates become certified quickly to meet districts’ hiring needs.
• The Teachers of Tomorrow program and other State and federal programs gave resources to school districts and institutions of higher education for teacher preparation, recruitment and retention.
• In response to the Regents and federal teacher quality requirements, local
districts and BOCES stepped up their efforts to recruit, place and retain certified and highly qualified teachers.
• Increased State Aid to school districts to support teacher recruitment and
retention.
2
Indicator 1 Percent of Core Classes Taught by Teachers
Who Were Not Highly Qualified Federal law requires all public school classes in core academic subjects to be taught by teachers who are “highly qualified.” Highly qualified teachers have a bachelor’s degree or higher, meet State certification standards and demonstrate knowledge of the subject(s) they teach. For the most part, certified teachers in New York State who are teaching in their area of certification are also highly qualified. In 2006-2007, 4.3 percent of New York State’s public school classes in core academic subjects were taught by teachers who were not highly qualified, down from 5.5 percent in 2005-2006 and 7.9 percent in 2004-2005. Figure 1.1 When five percent or more core classes are taught by teachers who are not highly qualified, there may be a shortage of teachers because there are not enough teachers to meet districts’ hiring needs or teachers are not willing or able to work where they are needed. • High and low poverty schools. Federal law requires states and school districts to
have plans to ensure that low income and minority children are not more likely than other children to be taught by unqualified teachers. In 2006-2007, children in high poverty schools were more likely than children in low poverty schools to be taught core subjects by teachers who were not highly qualified, although the gap narrowed compared to earlier years. The widest remaining gap in 2006-2007 was in middle/secondary schools, where high poverty middle/secondary schools had 16.1 percent of core classes taught by teachers who were not highly qualified, compared to 2.9 percent in low poverty middle/secondary schools. Figure 1.1
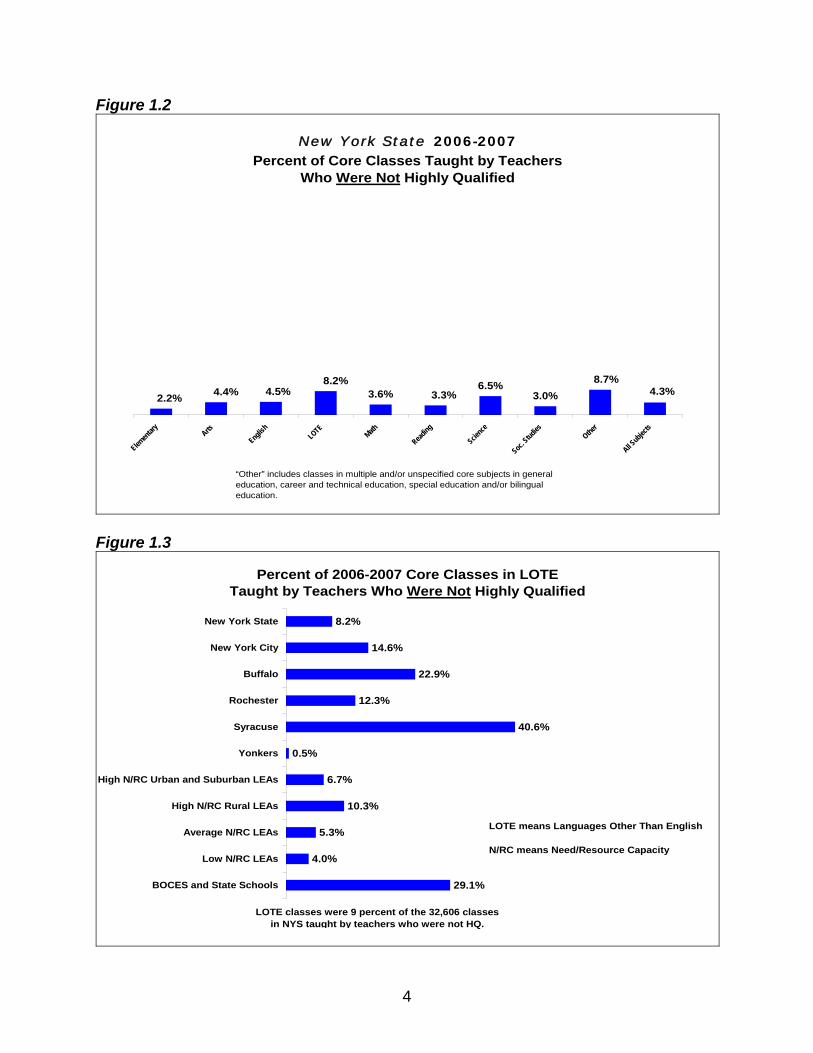
• Core subjects. In 2006-2007, every core subject area had some classes taught by teachers who were not highly qualified. More than five percent of classes were taught by teachers who were not highly qualified in languages other than English (8.2 percent), science (6.5 percent) and “other core classes” (8.7 percent), which included core classes with multiple or unknown subjects in general education, special education, career and technical education and/or bilingual education. Figure 1.2
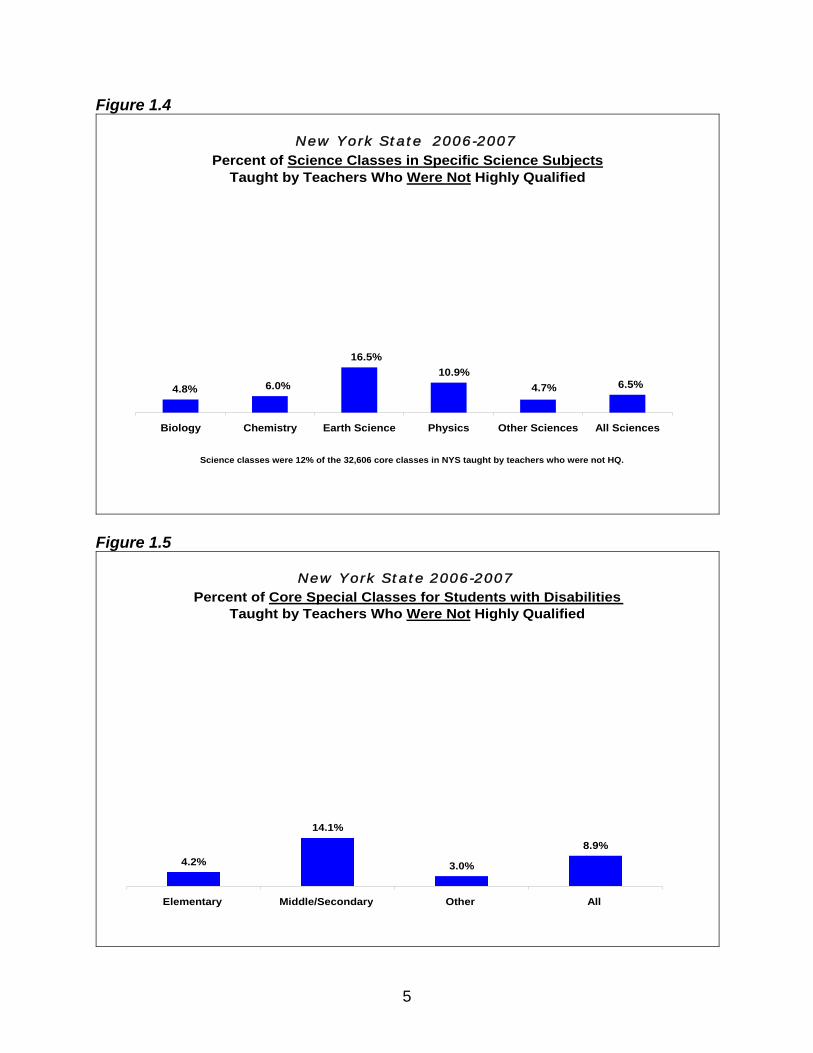
• Languages other than English. Nearly every large city and Need/Resource
Capacity category of districts had more than five percent of classes in languages other than English (LOTE) taught by teachers who were not highly qualified. Figures 1.3
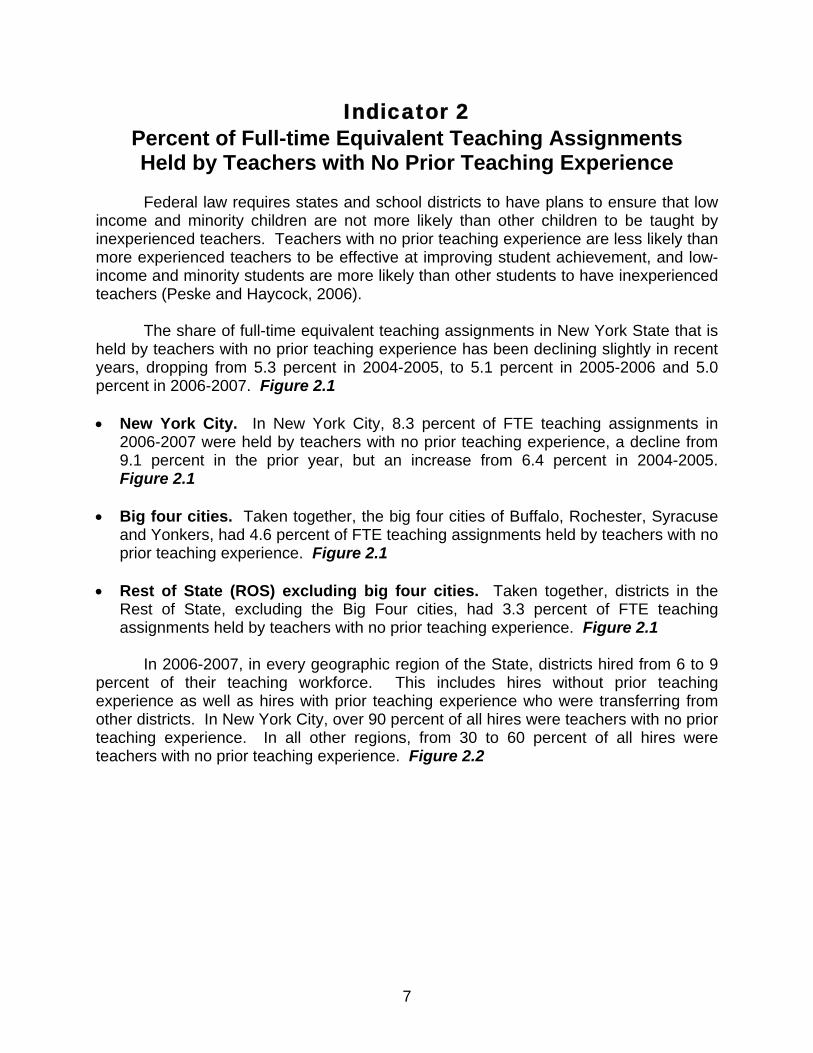
• Specific science subjects. In the subject area of science, more than five percent
of core classes were taught by teachers who were not highly qualified in chemistry (6.0 percent), earth science (16.5 percent) and physics (10.9 percent). Figure 1.4

3
• Special classes for students with disabilities. In core special classes for
students with disabilities at the middle/secondary level (grades 7-12), 14.1 percent were taught by teachers who were not highly qualified. Figure 1.5
• Need/Resource Capacity (N/RC) categories of districts. High need districts,
including the large cities, were more likely than other districts to have core classes taught by teachers who were not highly qualified. Figure 1.6
Figure 1.1
New York StatePercent of Classes in Core Academic Subjects
Taught by Teachers Who Were Not Highly Qualified
7.9%
19.7%
2.8%1.9%
18.3%
5.5% 8.1%
0.9%2.2%
17.4%
2.9%5.1%
16.1%
0.9%4.3%
All schools High povertyelementary schools
Low povertyelementary schools
High povertymiddle &
secondary schools
Low poverty middle& secondary
schools
2004-2005 2005-2006 2006-2007
4
Figure 1.2
New York State 2006-2007Percent of Core Classes Taught by Teachers
Who Were Not Highly Qualified
3.6%6.5%
3.0%4.4%8.2%
4.5%2.2% 3.3%8.7%
4.3%
Element
ary
Arts
English
LOTEMath
Reading
Science
Soc. Studie
sOthe
r
All Subje
cts
“Other” includes classes in multiple and/or unspecified core subjects in general education, career and technical education, special education and/or bilingual education.
Figure 1.3
Percent of 2006-2007 Core Classes in LOTE Taught by Teachers Who Were Not Highly Qualified
8.2%
14.6%
22.9%
12.3%
40.6%
0.5%
6.7%
10.3%
5.3%
4.0%
29.1%
New York State
New York City
Buffalo
Rochester
Syracuse
Yonkers
High N/RC Urban and Suburban LEAs
High N/RC Rural LEAs
Average N/RC LEAs
Low N/RC LEAs
BOCES and State Schools
LOTE means Languages Other Than English
N/RC means Need/Resource Capacity
LOTE classes were 9 percent of the 32,606 classes in NYS taught by teachers who were not HQ.
5
Figure 1.4
New York State 2006-2007Percent of Science Classes in Specific Science Subjects
Taught by Teachers Who Were Not Highly Qualified
6.5%4.7%10.9%
16.5%
6.0%4.8%
Biology Chemistry Earth Science Physics Other Sciences All Sciences
Science classes were 12% of the 32,606 core classes in NYS taught by teachers who were not HQ.
Figure 1.5
New York State 2006-2007Percent of Core Special Classes for Students with Disabilities
Taught by Teachers Who Were Not Highly Qualified
4.2%
14.1%
3.0%
8.9%
Elementary Middle/Secondary Other All

6
Figure 1.6
Percent of 2006-2007 Core Classes Taught by Teachers Who Were Not Highly Qualified in Each Need/Resource Capacity (N/RC) Category
4.3%
9.2%
5.0%
10.2%
7.7%
0.3%
2.6%
2.1%
1.4%
1.4%
7.6%
New York State
New York City
Buffalo
Rochester
Syracuse
Yonkers
High N/RC Urban and Suburban LEAs
High N/RC Rural LEAs
Average N/RC LEAs
Low N/RC LEAs
BOCES and State Schools
7
Indicator 2 Percent of Full-time Equivalent Teaching Assignments Held by Teachers with No Prior Teaching Experience
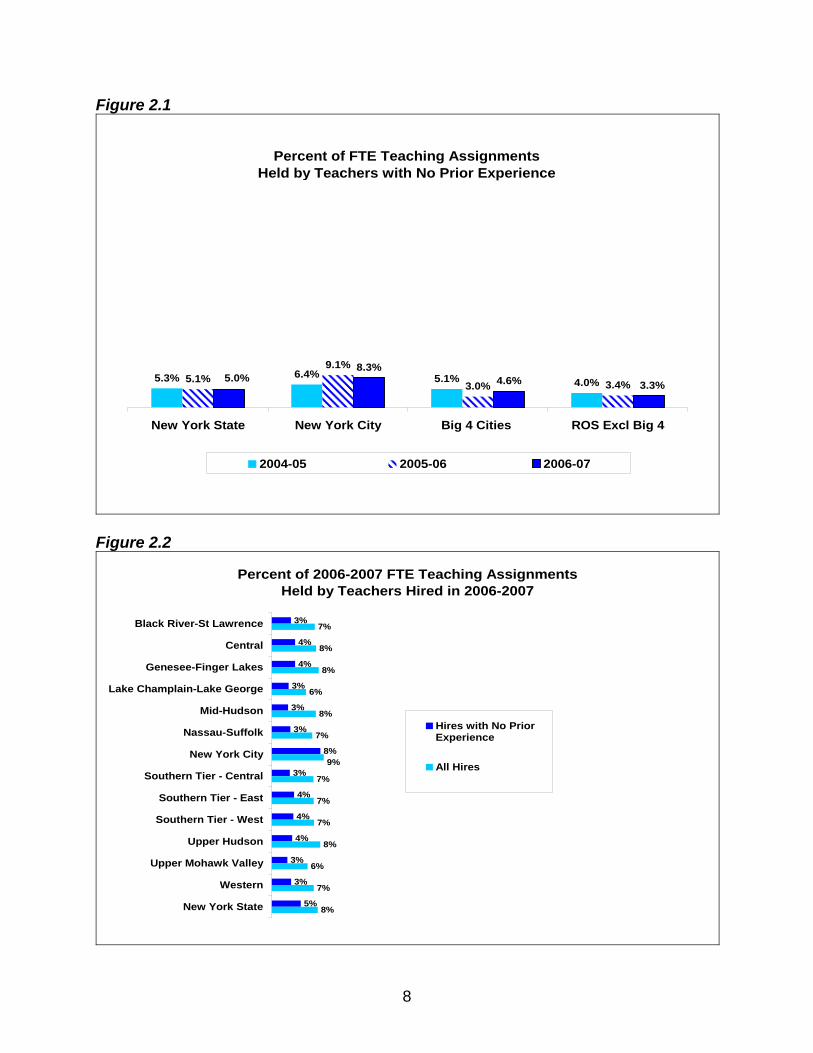
Federal law requires states and school districts to have plans to ensure that low income and minority children are not more likely than other children to be taught by inexperienced teachers. Teachers with no prior teaching experience are less likely than more experienced teachers to be effective at improving student achievement, and low-income and minority students are more likely than other students to have inexperienced teachers (Peske and Haycock, 2006). The share of full-time equivalent teaching assignments in New York State that is held by teachers with no prior teaching experience has been declining slightly in recent years, dropping from 5.3 percent in 2004-2005, to 5.1 percent in 2005-2006 and 5.0 percent in 2006-2007. Figure 2.1 • New York City. In New York City, 8.3 percent of FTE teaching assignments in
2006-2007 were held by teachers with no prior teaching experience, a decline from 9.1 percent in the prior year, but an increase from 6.4 percent in 2004-2005. Figure 2.1
• Big four cities. Taken together, the big four cities of Buffalo, Rochester, Syracuse and Yonkers, had 4.6 percent of FTE teaching assignments held by teachers with no prior teaching experience. Figure 2.1
• Rest of State (ROS) excluding big four cities. Taken together, districts in the
Rest of State, excluding the Big Four cities, had 3.3 percent of FTE teaching assignments held by teachers with no prior teaching experience. Figure 2.1
In 2006-2007, in every geographic region of the State, districts hired from 6 to 9 percent of their teaching workforce. This includes hires without prior teaching experience as well as hires with prior teaching experience who were transferring from other districts. In New York City, over 90 percent of all hires were teachers with no prior teaching experience. In all other regions, from 30 to 60 percent of all hires were teachers with no prior teaching experience. Figure 2.2
8
Figure 2.1
Percent of FTE Teaching Assignments Held by Teachers with No Prior Experience
5.3% 6.4% 5.1% 4.0%5.1%9.1%
3.0% 3.4%8.3%
4.6%5.0%3.3%
New York State New York City Big 4 Cities ROS Excl Big 4
2004-05 2005-06 2006-07
Figure 2.2
Percent of 2006-2007 FTE Teaching Assignments Held by Teachers Hired in 2006-2007
3%
4%
4%
3%
3%
3%
3%
4%
4%
4%
3%
3%
5%
7%
8%
8%
6%
8%
7%
7%
7%
7%
8%
6%
7%
8%
8%9%
Black River-St Lawrence
Central
Genesee-Finger Lakes
Lake Champlain-Lake George
Mid-Hudson
Nassau-Suffolk
New York City
Southern Tier - Central
Southern Tier - East
Southern Tier - West
Upper Hudson
Upper Mohawk Valley
Western
New York State
Hires with No PriorExperience
All Hires
9
Indicator 3 Percent of Full-time Equivalent Teaching Assignments
Held by Teachers without Appropriate Certification
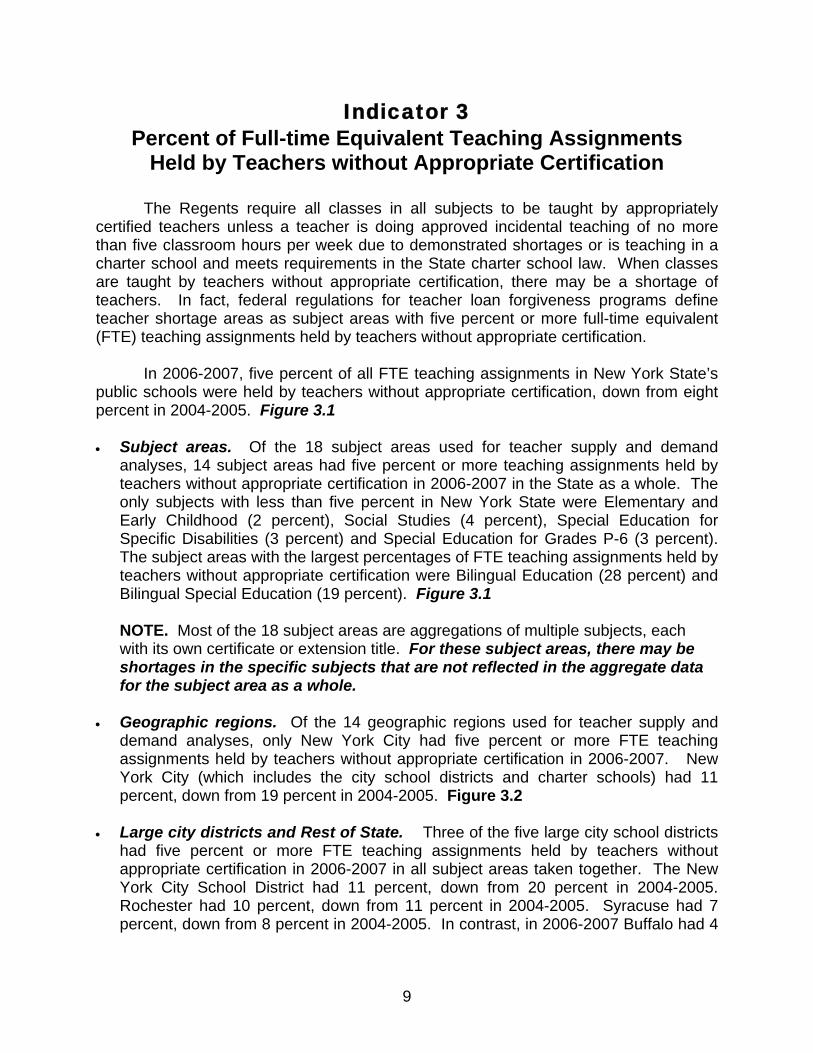
The Regents require all classes in all subjects to be taught by appropriately certified teachers unless a teacher is doing approved incidental teaching of no more than five classroom hours per week due to demonstrated shortages or is teaching in a charter school and meets requirements in the State charter school law. When classes are taught by teachers without appropriate certification, there may be a shortage of teachers. In fact, federal regulations for teacher loan forgiveness programs define teacher shortage areas as subject areas with five percent or more full-time equivalent (FTE) teaching assignments held by teachers without appropriate certification. In 2006-2007, five percent of all FTE teaching assignments in New York State’s public schools were held by teachers without appropriate certification, down from eight percent in 2004-2005. Figure 3.1 • Subject areas. Of the 18 subject areas used for teacher supply and demand
analyses, 14 subject areas had five percent or more teaching assignments held by teachers without appropriate certification in 2006-2007 in the State as a whole. The only subjects with less than five percent in New York State were Elementary and Early Childhood (2 percent), Social Studies (4 percent), Special Education for Specific Disabilities (3 percent) and Special Education for Grades P-6 (3 percent). The subject areas with the largest percentages of FTE teaching assignments held by teachers without appropriate certification were Bilingual Education (28 percent) and Bilingual Special Education (19 percent). Figure 3.1
NOTE. Most of the 18 subject areas are aggregations of multiple subjects, each with its own certificate or extension title. For these subject areas, there may be shortages in the specific subjects that are not reflected in the aggregate data for the subject area as a whole.
• Geographic regions. Of the 14 geographic regions used for teacher supply and
demand analyses, only New York City had five percent or more FTE teaching assignments held by teachers without appropriate certification in 2006-2007. New York City (which includes the city school districts and charter schools) had 11 percent, down from 19 percent in 2004-2005. Figure 3.2
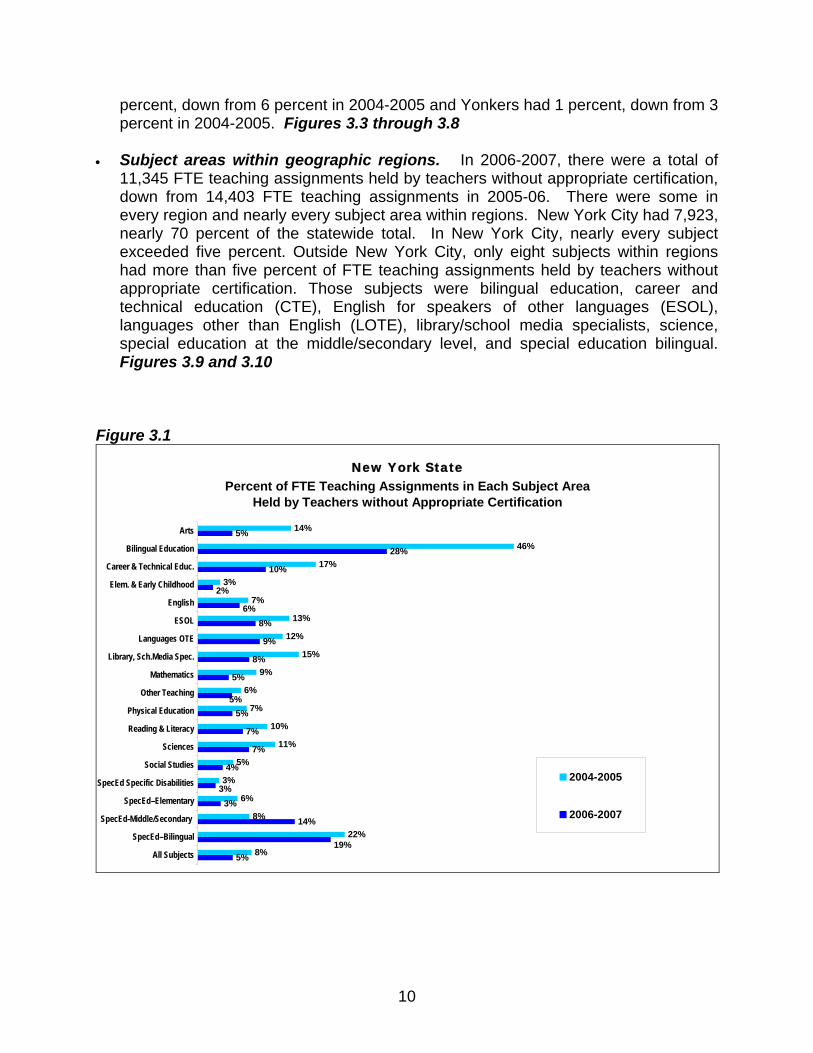
• Large city districts and Rest of State. Three of the five large city school districts
had five percent or more FTE teaching assignments held by teachers without appropriate certification in 2006-2007 in all subject areas taken together. The New York City School District had 11 percent, down from 20 percent in 2004-2005. Rochester had 10 percent, down from 11 percent in 2004-2005. Syracuse had 7 percent, down from 8 percent in 2004-2005. In contrast, in 2006-2007 Buffalo had 4
10
percent, down from 6 percent in 2004-2005 and Yonkers had 1 percent, down from 3 percent in 2004-2005. Figures 3.3 through 3.8
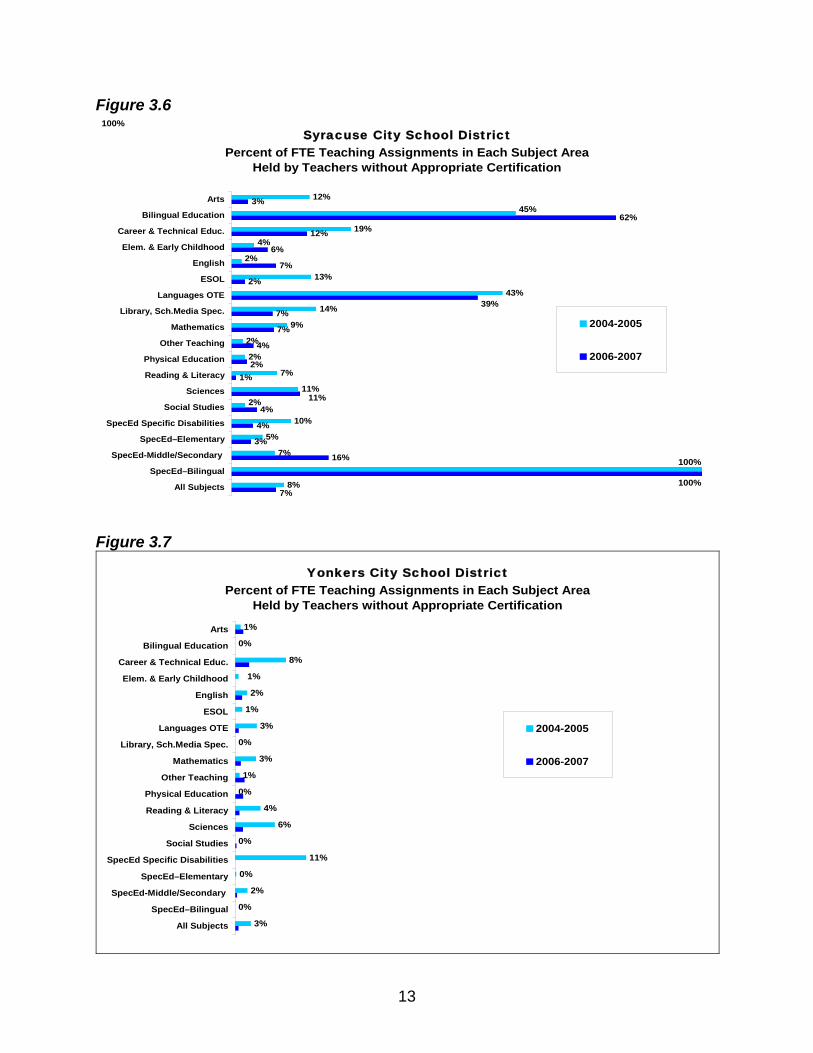
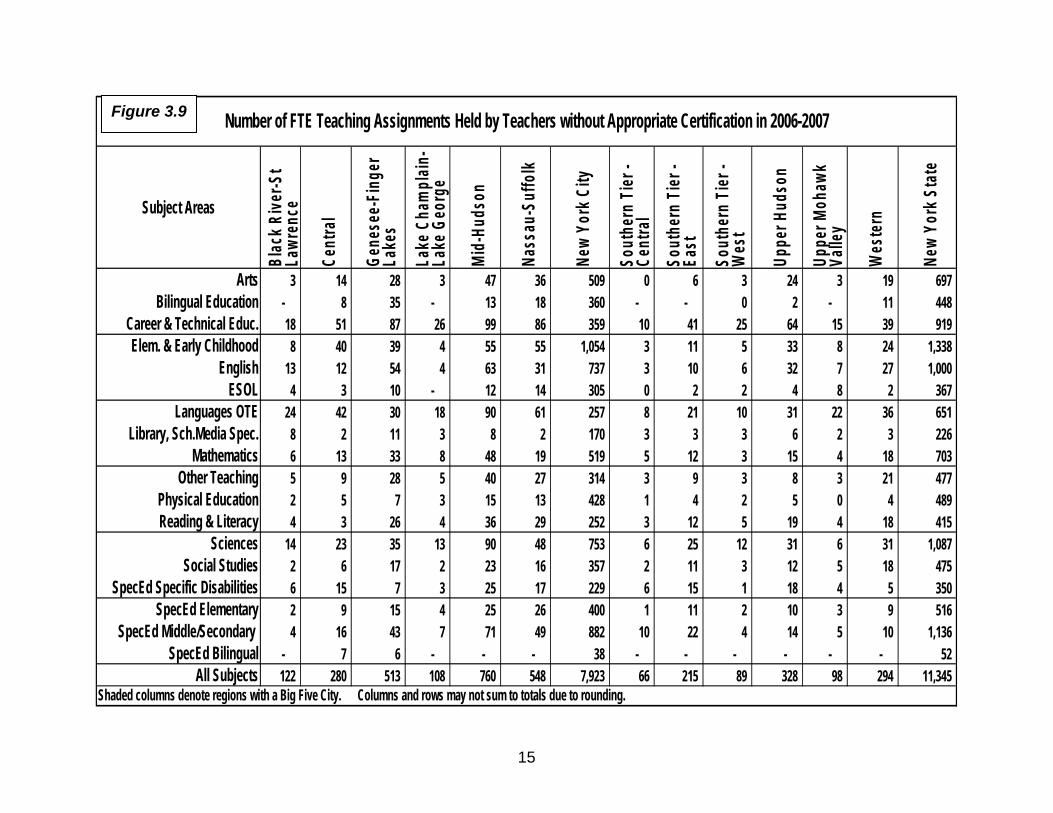
• Subject areas within geographic regions. In 2006-2007, there were a total of
11,345 FTE teaching assignments held by teachers without appropriate certification, down from 14,403 FTE teaching assignments in 2005-06. There were some in every region and nearly every subject area within regions. New York City had 7,923, nearly 70 percent of the statewide total. In New York City, nearly every subject exceeded five percent. Outside New York City, only eight subjects within regions had more than five percent of FTE teaching assignments held by teachers without appropriate certification. Those subjects were bilingual education, career and technical education (CTE), English for speakers of other languages (ESOL), languages other than English (LOTE), library/school media specialists, science, special education at the middle/secondary level, and special education bilingual. Figures 3.9 and 3.10
Figure 3.1
New York StatePercent of FTE Teaching Assignments in Each Subject Area
Held by Teachers without Appropriate Certification
14%
46%
17%
3%
7%
13%
12%
15%
9%
6%
7%
10%
11%
5%
3%
6%
8%
22%
8%
5%
28%
10%
8%
9%
8%
5%
5%
7%
7%
4%
3%
14%
5%19%
3%
5%
6%
2%
Arts
Bilingual Education
Career & Technical Educ.
Elem. & Early Childhood
English
ESOL
Languages OTE
Library, Sch.Media Spec.
Mathematics
Other Teaching
Physical Education
Reading & Literacy
Sciences
Social Studies
SpecEd Specific Disabilities
SpecEd–Elementary
SpecEd-Middle/Secondary
SpecEd–Bilingual
All Subjects
2004-2005
2006-2007

11
Figure 3.2
New York StatePercent of FTE Teaching Assignments in Each Geographic Region
Held by Teachers without Appropriate Certification
2%
3%
3%
3%
3%
2%
19%
3%
4%
3%
2%
3%
3%
8%
3%
3%
3%
3%
3%
1%
11%
2%
3%
2%
2%
2%
2%
5%
Black River-St Lawrence
Central
Genesee-Finger Lakes
Lake Champlain-Lake George
Mid-Hudson
Nassau-Suffolk
New York City
Southern Tier - Central
Southern Tier - East
Southern Tier - West
Upper Hudson
Upper Mohawk Valley
Western
New York State
2004-2005
2006-2007
Figure 3.3
New York City School DistrictPercent of FTE Teaching Assignments in Each Subject Area
Held by Teachers without Appropriate Certification
47%
52%
47%
7%
16%
20%
24%
51%
19%
12%
25%
29%
27%
13%
12%
14%
22%
22%
20%
17%
29%
21%
4%
12%
12%
15%
33%
9%
10%
17%
18%
16%
8%
7%
7%
27%
18%
11%
Arts
Bilingual Education
Career & Technical Educ.
Elem. & Early Childhood
English
ESOL
Languages OTE
Library, Sch.Media Spec.
Mathematics
Other Teaching
Physical Education
Reading & Literacy
Sciences
Social Studies
SpecEd Specific Disabilities
SpecEd–Elementary
SpecEd-Middle/Secondary
SpecEd–Bilingual
All Subjects
2004-2005
2006-2007

12
Figure 3.4
Buffalo City School District Percent of FTE Teaching Assignments in Each Subject Area
Held by Teachers without Appropriate Certification
5%
23%
12%
0%
3%
2%
34%
0%
4%
28%
3%
13%
6%
7%
0%
1%
0%
6%
3%
16%
33%
1%
7%
11%
1%
1%
4%
4%
1%
0%
4%
0%
24%
11%1%
2%
2%
5%
Arts
Bilingual Education
Career & Technical Educ.
Elem. & Early Childhood
English
ESOL
Languages OTE
Library, Sch.Media Spec.
Mathematics
Other Teaching
Physical Education
Reading & Literacy
Sciences
Social Studies
SpecEd Specific Disabilities
SpecEd–Elementary
SpecEd-Middle/Secondary
SpecEd–Bilingual
All Subjects
2004-2005
2006-2007
Figure 3.5
Rochester City School District Percent of FTE Teaching Assignments in Each Subject Area
Held by Teachers without Appropriate Certification
52%
30%
6%
20%
15%
5%
3%
9%
9%
28%
4%
4%
11%
10%
3%
19%
8%
13%
7%
2%
52%
11%
1%
13%
47%
8%
12%
5%
9%
27%
42%
50%31%
15%
13%
10%
4%
8%
Arts
Bilingual Education
Career & Technical Educ.
Elem. & Early Childhood
English
ESOL
Languages OTE
Library, Sch.Media Spec.
Mathematics
Other Teaching
Physical Education
Reading & Literacy
Sciences
Social Studies
SpecEd Specific Disabilities
SpecEd–Elementary
SpecEd-Middle/Secondary
SpecEd–Bilingual
All Subjects
2004-2005
2006-2007
13
Figure 3.6
Syracuse City School District Percent of FTE Teaching Assignments in Each Subject Area
Held by Teachers without Appropriate Certification
12%
19%
13%
43%
14%
9%
2%
2%
7%
11%
10%
5%
7%
8%
3%
62%
12%
6%
7%
2%
7%
7%
4%
1%
4%
4%
3%
16%
2%
2%
4%
45%
7%
2%
39%
11%
Arts
Bilingual Education
Career & Technical Educ.
Elem. & Early Childhood
English
ESOL
Languages OTE
Library, Sch.Media Spec.
Mathematics
Other Teaching
Physical Education
Reading & Literacy
Sciences
Social Studies
SpecEd Specific Disabilities
SpecEd–Elementary
SpecEd-Middle/Secondary
SpecEd–Bilingual
All Subjects
2004-2005
2006-2007
100%
100%
100%
Figure 3.7
Yonkers City School District Percent of FTE Teaching Assignments in Each Subject Area
Held by Teachers without Appropriate Certification1%
0%
8%
2%
1%
3%
0%
3%
1%
0%
4%
6%
0%
11%
0%
2%
0%
3%
1%
Arts
Bilingual Education
Career & Technical Educ.
Elem. & Early Childhood
English
ESOL
Languages OTE
Library, Sch.Media Spec.
Mathematics
Other Teaching
Physical Education
Reading & Literacy
Sciences
Social Studies
SpecEd Specific Disabilities
SpecEd–Elementary
SpecEd-Middle/Secondary
SpecEd–Bilingual
All Subjects
2004-2005
2006-2007

14
Figure 3.8
Rest of State Excluding the Big Four Cities Percent of FTE Teaching Assignments in Each Subject Area
Held by Teachers without Appropriate Certification
19%
8%
1%
2%
5%
8%
4%
2%
3%
1%
4%
4%
1%
1%
1%
2%
19%
2%
16%
7%
2%
1%
5%
0%
2%
3%
7%
2%
1%
1%
3%
1%
2%
2%
2%
1%
2%
3%
Arts
Bilingual Education
Career & Technical Educ.
Elem. & Early Childhood
English
ESOL
Languages OTE
Library, Sch.Media Spec.
Mathematics
Other Teaching
Physical Education
Reading & Literacy
Sciences
Social Studies
SpecEd Specific Disabilities
SpecEd–Elementary
SpecEd-Middle/Secondary
SpecEd–Bilingual
All Subjects
2004-2005
2006-2007
Labels rounded. Bars not rounded.
15
Subject Areas
Blac
k Rive
r-St
Lawr
ence
Cent
ral
Gene
see-
Fing
er
Lake
s
Lake
Cha
mpl
ain-
Lake
Geo
rge
Mid-
Huds
on
Nass
au-S
uffo
lk
New
York
City
Sout
hern
Tier
- Ce
ntra
lSo
uthe
rn T
ier -
East
Sout
hern
Tier
- W
est
Uppe
r Hud
son
Uppe
r Moh
awk
Valle
y
Wes
tern
New
York
Sta
te
Arts 3 14 28 3 47 36 509 0 6 3 24 3 19 697 Bilingual Education - 8 35 - 13 18 360 - - 0 2 - 11 448
Career & Technical Educ. 18 51 87 26 99 86 359 10 41 25 64 15 39 919 Elem. & Early Childhood 8 40 39 4 55 55 1,054 3 11 5 33 8 24 1,338
English 13 12 54 4 63 31 737 3 10 6 32 7 27 1,000 ESOL 4 3 10 - 12 14 305 0 2 2 4 8 2 367
Languages OTE 24 42 30 18 90 61 257 8 21 10 31 22 36 651 Library, Sch.Media Spec. 8 2 11 3 8 2 170 3 3 3 6 2 3 226
Mathematics 6 13 33 8 48 19 519 5 12 3 15 4 18 703 Other Teaching 5 9 28 5 40 27 314 3 9 3 8 3 21 477
Physical Education 2 5 7 3 15 13 428 1 4 2 5 0 4 489 Reading & Literacy 4 3 26 4 36 29 252 3 12 5 19 4 18 415
Sciences 14 23 35 13 90 48 753 6 25 12 31 6 31 1,087 Social Studies 2 6 17 2 23 16 357 2 11 3 12 5 18 475
SpecEd Specific Disabilities 6 15 7 3 25 17 229 6 15 1 18 4 5 350 SpecEd Elementary 2 9 15 4 25 26 400 1 11 2 10 3 9 516
SpecEd Middle/Secondary 4 16 43 7 71 49 882 10 22 4 14 5 10 1,136 SpecEd Bilingual - 7 6 - - - 38 - - - - - - 52
All Subjects 122 280 513 108 760 548 7,923 66 215 89 328 98 294 11,345 Shaded columns denote regions with a Big Five City. Columns and rows may not sum to totals due to rounding.
Number of FTE Teaching Assignments Held by Teachers without Appropriate Certification in 2006-2007Figure 3.9

16
Subject Areas
Blac
k Rive
r-St
Lawr
ence
Cent
ral
Gene
see-
Fing
er
Lake
s
Lake
Cha
mpl
ain-
Lake
Geo
rge
Mid-
Huds
on
Nass
au-S
uffo
lk
New
York
City
Sout
hern
Tier
- Ce
ntra
l
Sout
hern
Tier
- Ea
st
Sout
hern
Tier
- W
est
Uppe
r Hud
son
Uppe
r Moh
awk
Valle
y
Wes
tern
New
York
Sta
te
Arts 18% 5%Bilingual Education 62% 50% 11% 17% 29% 100% 100% 24% 28%
Career & Technical Educ. 6% 8% 9% 9% 8% 5% 22% 6% 11% 9% 9% 6% 5% 10%Elem. & Early Childhood
English 12% 6%ESOL 40% 6% 12% 10% 5% 9% 20% 8%
Languages OTE 17% 11% 5% 13% 8% 16% 9% 9% 7% 6% 17% 7% 9%Library, Sch.Media Spec. 12% 33% 6% 5% 8%
Mathematics 9% Other Teaching 10% 5%
Physical Education 18% 5%Reading & Literacy 6% 19% 7%
Sciences 5% 17% 5% 7%Social Studies 9%
SpecEd Specific Disabilities 7% SpecEd Elementary 7%
SpecEd Middle/Secondary 5% 8% 7% 5% 6% 27% 9% 10% 6% 14%SpecEd Bilingual 100% 47% 18% 19%
All Subjects 11% 5%
Subject Areas and Regions with 5 Percent or More FTE Teaching AssignmentsHeld by Teachers without Appropriate Certification in 2006-2007
Shaded columns denote regions with a Big Five City.
Shortage AreasFigure 3.10

17
Indicator 4
Number of Certificates Issued to New Teachers For Each Vacancy Filled by a New Teacher
In 2006-2007, there were clear shortages of new teachers in a few subject areas and geographic regions, as indicated by a comparison between the number of certificates issued to new teachers and the number of vacancies for new teachers. New teachers are defined as teachers who were not in the public school workforce for the five years prior to receiving the certificate.
Shortages are considered to occur when two or fewer certificates were issued to new teachers for each vacancy filled by a new teacher. This definition of a shortage refers to potential supply and demand, and accounts for the fact that some new teachers receive more than one certificate each year. Districts may prefer to have more than two new teachers per vacancy for a new teacher so that they can be more selective in their hiring. The definition could be changed upon request to show shortages based on other definitions, such as three or four certificates per vacancy. Even when there were more than two certificates issued to new teachers for each vacancy for a new teacher in a subject area or geographic region, there may not have been enough new teachers to meet districts’ hiring needs in 2006-2007 for the following reasons. • There were more certificates issued to new teachers than there were new teachers
because some new teachers received multiple certificates in the same or different subject areas in 2006-2007.
• Within subject areas, specific subjects with surpluses may be offsetting specific subjects with shortages. To identify shortages in specific subjects, such as biology or chemistry, it would be necessary to drill down within subject areas that have multiple specific subjects, such as the arts, languages other than English, science and others.
• Some new teachers receiving certificates in 2006-2007 were not willing or able to work where they were needed.
• Some new teachers may not have been located in the region indicated by the mailing address on their certificate records, but those records are the only data source for their location.
• Some new teachers may not have met the hiring standards of specific districts. For example, some districts have preferences for hiring teachers with multiple certifications or other characteristics that fit the districts’ staffing needs.

18
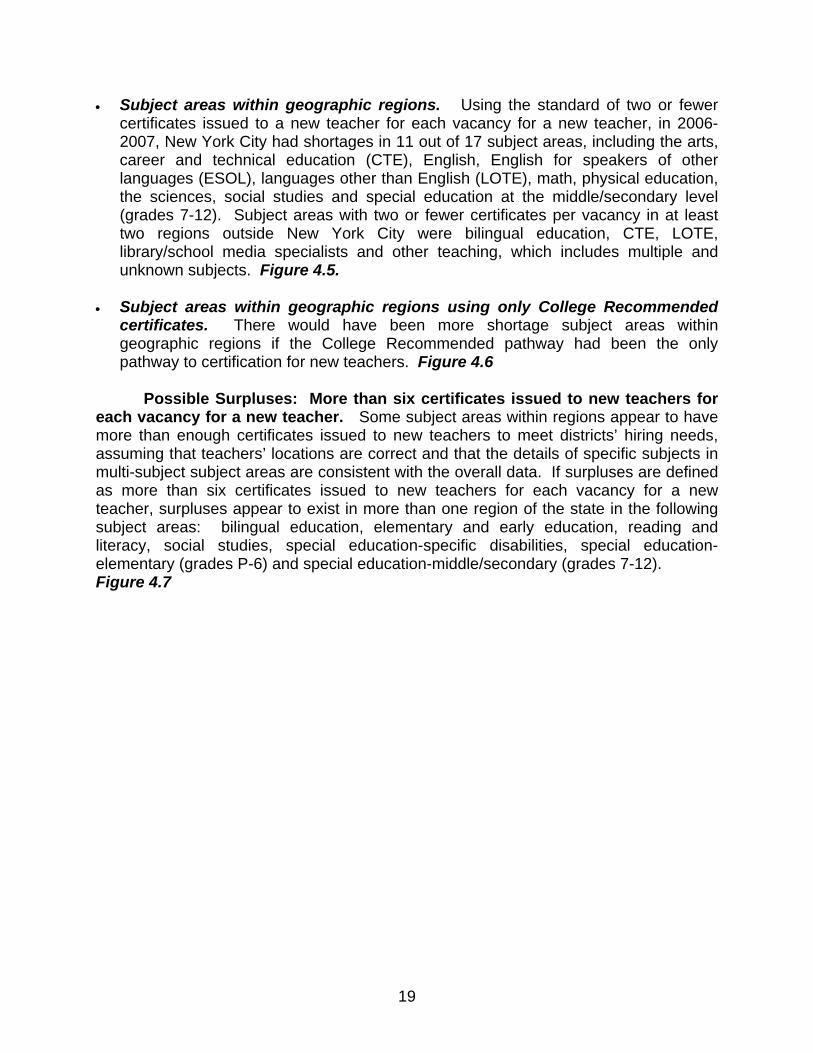
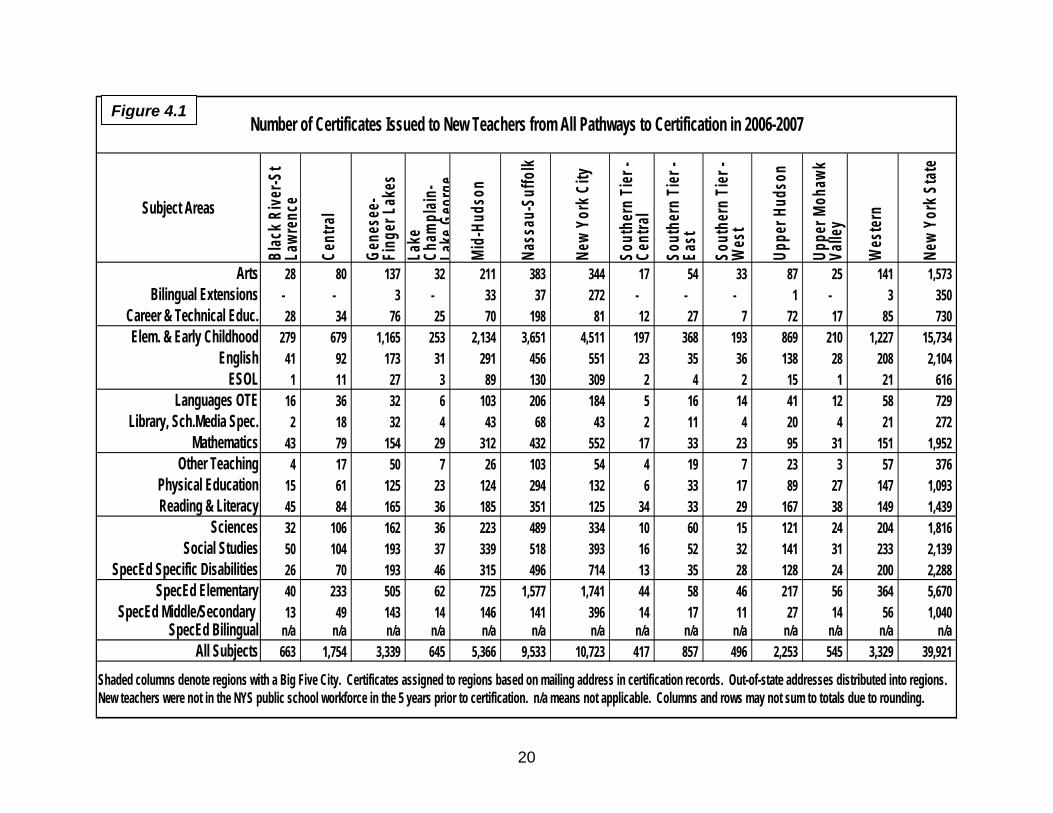
Certificates issued to new teachers. In 2006-2007, over 39,900 classroom teaching certificates were issued to new teachers from all pathways to certification, including the College Recommended pathway, the Individual Evaluation (or Transcript Evaluation) pathway, the Out-of-State Reciprocity pathway and the Certificate Progression pathway. This was more than in 2004-2005 (over 26,000 certificates) and 2005-2006 (over 30,800 certificates). In 2006-2007, certificates were issued to new teachers in nearly every subject area and geographic region of the State. Note that there are no certificates for bilingual special education; rather, candidates must obtain a special education certificate and a bilingual extension. Figure 4.1 • College Recommended certificates issued to new teachers. In 2006-2007, more
than 27,000 certificates were issued to new teachers from the College Recommended pathway, 68 percent of all certificates issued to new teachers. College Recommended certificates went to candidates who completed registered traditional or alternative teacher preparation programs in nearly every subject area and geographic region. Viewing the data on a regional basis, the number of College Recommended certificates ranged from a low of 0 percent of all certificates issued to new teachers in bilingual extensions and ESOL in rural regions to highs of 87 to 100 percent of all special education certificates issued to teachers in the New York City and Long Island regions and bilingual extensions in the Genesee-Finger Lakes region. Figures 4.2 and 4.3
Vacancies for new teachers. In 2006-2007, there were 11,038 vacancies for new teachers in New York State’s public schools (compared to 11, 245 in 2005-2006), with some in every subject area and geographic region. Vacancies for new teachers are defined as the number of full-time equivalent teaching positions held by teachers who reported that they had no prior teaching experience in any district. This definition underestimates total demand for new teachers because it excludes unfilled vacancies and suppressed vacancies (not created due to shortages), for which there is no data source. Of the total number of filled vacancies for new teachers statewide, 55 percent were in New York City, 11 percent were in the Long Island region and 7 percent were in the Mid-Hudson region. Other regions had from 1 to 6 percent of the total. Figure 4.4 Shortages: Two or fewer certificates issued to new teachers for each vacancy for a new teacher. Statewide, there were 3.6 certificates issued to new teachers for each vacancy for a new teacher in 2006-2007, indicating that New York State certifies more than three new teachers for every vacancy for a new teacher. This indicator is computed as the number of certificates issued to new teachers divided by the number of vacancies for new teachers. However, this statistic has limited value because it does not reflect the requirement that teachers must work in the subject areas of their certificates or the fact that they tend to work in their home regions (Boyd et al, 2005).
19
• Subject areas within geographic regions. Using the standard of two or fewer certificates issued to a new teacher for each vacancy for a new teacher, in 2006-2007, New York City had shortages in 11 out of 17 subject areas, including the arts, career and technical education (CTE), English, English for speakers of other languages (ESOL), languages other than English (LOTE), math, physical education, the sciences, social studies and special education at the middle/secondary level (grades 7-12). Subject areas with two or fewer certificates per vacancy in at least two regions outside New York City were bilingual education, CTE, LOTE, library/school media specialists and other teaching, which includes multiple and unknown subjects. Figure 4.5.
• Subject areas within geographic regions using only College Recommended
certificates. There would have been more shortage subject areas within geographic regions if the College Recommended pathway had been the only pathway to certification for new teachers. Figure 4.6
Possible Surpluses: More than six certificates issued to new teachers for each vacancy for a new teacher. Some subject areas within regions appear to have more than enough certificates issued to new teachers to meet districts’ hiring needs, assuming that teachers’ locations are correct and that the details of specific subjects in multi-subject subject areas are consistent with the overall data. If surpluses are defined as more than six certificates issued to new teachers for each vacancy for a new teacher, surpluses appear to exist in more than one region of the state in the following subject areas: bilingual education, elementary and early education, reading and literacy, social studies, special education-specific disabilities, special education-elementary (grades P-6) and special education-middle/secondary (grades 7-12). Figure 4.7
20
Subject Areas
Blac
k Rive
r-St
Lawr
ence
Cent
ral
Gene
see-
Fing
er L
akes
Lake
Ch
ampl
ain-
Lake
Geo
rge
Mid-
Huds
on
Nass
au-S
uffo
lk
New
York
City
Sout
hern
Tier
- Ce
ntra
l
Sout
hern
Tier
- Ea
st
Sout
hern
Tier
- W
est
Uppe
r Hud
son
Uppe
r Moh
awk
Valle
y
Wes
tern
New
York
Sta
te
Arts 28 80 137 32 211 383 344 17 54 33 87 25 141 1,573 Bilingual Extensions - - 3 - 33 37 272 - - - 1 - 3 350
Career & Technical Educ. 28 34 76 25 70 198 81 12 27 7 72 17 85 730 Elem. & Early Childhood 279 679 1,165 253 2,134 3,651 4,511 197 368 193 869 210 1,227 15,734
English 41 92 173 31 291 456 551 23 35 36 138 28 208 2,104 ESOL 1 11 27 3 89 130 309 2 4 2 15 1 21 616
Languages OTE 16 36 32 6 103 206 184 5 16 14 41 12 58 729 Library, Sch.Media Spec. 2 18 32 4 43 68 43 2 11 4 20 4 21 272
Mathematics 43 79 154 29 312 432 552 17 33 23 95 31 151 1,952 Other Teaching 4 17 50 7 26 103 54 4 19 7 23 3 57 376
Physical Education 15 61 125 23 124 294 132 6 33 17 89 27 147 1,093 Reading & Literacy 45 84 165 36 185 351 125 34 33 29 167 38 149 1,439
Sciences 32 106 162 36 223 489 334 10 60 15 121 24 204 1,816 Social Studies 50 104 193 37 339 518 393 16 52 32 141 31 233 2,139
SpecEd Specific Disabilities 26 70 193 46 315 496 714 13 35 28 128 24 200 2,288 SpecEd Elementary 40 233 505 62 725 1,577 1,741 44 58 46 217 56 364 5,670
SpecEd Middle/Secondary 13 49 143 14 146 141 396 14 17 11 27 14 56 1,040 SpecEd Bilingual n/a n/a n/a n/a n/a n/a n/a n/a n/a n/a n/a n/a n/a n/a
All Subjects 663 1,754 3,339 645 5,366 9,533 10,723 417 857 496 2,253 545 3,329 39,921
Shaded columns denote regions with a Big Five City. Certificates assigned to regions based on mailing address in certification records. Out-of-state addresses distributed into regions. New teachers were not in the NYS public school workforce in the 5 years prior to certification. n/a means not applicable. Columns and rows may not sum to totals due to rounding.
Number of Certificates Issued to New Teachers from All Pathways to Certification in 2006-2007Figure 4.1
21
Subject Areas
Blac
k Rive
r-St
Lawr
ence
Cent
ral
Gene
see-
Fing
er
Lake
s
Lake
Cha
mpl
ain-
Lake
Geo
rge
Mid-
Huds
on
Nass
au-S
uffo
lk
New
York
City
Sout
hern
Tier
- Ce
ntra
l
Sout
hern
Tier
- Ea
st
Sout
hern
Tier
- W
est
Uppe
r Hud
son
Uppe
r Moh
awk
Valle
y
Wes
tern
New
York
Sta
te
Arts 17 56 93 19 122 249 206 10 25 25 61 17 103 1,003 Bilingual Extensions - - 3 - 20 23 174 - - - - - 2 223
Career & Technical Educ. 9 20 36 5 16 59 17 4 9 2 33 9 33 253 Elem. & Early Childhood 203 447 859 141 1,435 2,585 3,300 96 213 123 543 140 911 10,996
English 31 60 118 18 180 298 380 7 19 19 86 17 133 1,367 ESOL - 4 22 - 53 88 207 1 2 2 7 - 8 393
Languages OTE 9 21 22 2 50 89 86 1 5 7 14 8 37 351 Library, Sch.Media Spec. - 13 24 1 34 41 20 1 6 2 15 2 18 177
Mathematics 34 53 107 15 227 286 373 7 22 16 64 18 110 1,332 Other Teaching 2 13 22 2 6 40 8 1 12 2 12 1 33 155
Physical Education 7 42 86 9 74 204 68 4 26 10 61 19 118 728 Reading & Literacy 35 68 143 22 156 290 102 23 26 24 126 30 116 1,161
Sciences 17 71 93 18 136 239 209 2 31 5 58 13 101 992 Social Studies 37 81 157 22 223 347 278 11 38 23 94 22 179 1,512
SpecEd Specific Disabilities 9 29 89 11 82 173 330 3 10 15 36 7 73 867 SpecEd Elementary 30 177 454 48 624 1,380 1,514 23 39 26 185 38 236 4,772
SpecEd Middle/Secondary 7 26 122 4 110 70 342 3 4 1 17 7 11 725 SpecEd Bilingual n/a n/a n/a n/a n/a n/a n/a n/a n/a n/a n/a n/a n/a n/a
All Subjects 448 1,183 2,450 336 3,547 6,463 7,603 199 489 304 1,411 350 2,224 27,007
Shaded columns denote regions with a Big Five City. Certificates assigned to regions based on mailing address in certification records. Out-of-state addresses distributed into regions. n/a means not applicable. Columns and rows may not sum to totals due to rounding.
Number of Certificates Issued to New Teachers from the College Recommended Pathway to Certification in 2006-2007Figure 4.2

22
Subject Areas
Blac
k Rive
r-St
Lawr
ence
Cent
ral
Gene
see-
Fing
er
Lake
sLa
ke C
ham
plain
-La
ke G
eorg
e
Mid-
Huds
on
Nass
au-S
uffo
lk
New
York
City
Sout
hern
Tier
- Ce
ntra
lSo
uthe
rn T
ier -
East
Sout
hern
Tier
- W
est
Uppe
r Hud
son
Uppe
r Moh
awk
Valle
y
Wes
tern
New
York
Sta
te
Arts 62% 69% 68% 59% 58% 65% 60% 56% 46% 77% 70% 70% 73% 64%Bilingual Extensions - - 100% - 61% 63% 64% - - - 0% - 67% 64%
Career & Technical Educ. 33% 60% 47% 21% 23% 30% 21% 33% 35% 29% 46% 53% 38% 35%Elem. & Early Childhood 73% 66% 74% 56% 67% 71% 73% 49% 58% 64% 62% 67% 74% 70%
English 76% 65% 68% 59% 62% 65% 69% 33% 54% 53% 62% 61% 64% 65%ESOL 0% 40% 80% 0% 59% 68% 67% 50% 50% 100% 43% 0% 37% 64%
Languages OTE 59% 57% 68% 33% 49% 43% 47% 20% 33% 53% 33% 71% 63% 48%Library, Sch.Media Spec. 0% 71% 77% 25% 78% 60% 46% 50% 60% 50% 74% 50% 85% 65%
Mathematics 78% 67% 69% 52% 73% 66% 68% 44% 68% 68% 67% 59% 73% 68%Other Teaching 49% 80% 43% 28% 24% 39% 15% 25% 66% 28% 54% 33% 57% 41%
Physical Education 49% 70% 68% 40% 60% 69% 52% 66% 77% 62% 69% 68% 80% 67%Reading & Literacy 77% 81% 86% 62% 85% 83% 81% 69% 81% 82% 75% 80% 78% 81%
Sciences 53% 67% 57% 50% 61% 49% 63% 22% 51% 36% 48% 52% 50% 55%Social Studies 74% 78% 81% 59% 66% 67% 71% 66% 73% 72% 67% 72% 77% 71%
SpecEd Specific Disabilities 33% 41% 46% 23% 26% 35% 46% 25% 27% 53% 28% 32% 37% 38%SpecEd Elementary 74% 76% 90% 76% 86% 87% 87% 52% 67% 58% 85% 68% 65% 84%
SpecEd Middle/Secondary 58% 53% 85% 31% 75% 49% 87% 23% 25% 10% 62% 54% 19% 70%SpecEd Bilingual n/a n/a n/a n/a n/a n/a n/a n/a n/a n/a n/a n/a n/a n/a
All Subjects 67% 67% 73% 52% 66% 68% 71% 48% 57% 61% 63% 64% 67% 68%
College Recommended as a Percent of All Certificates Issued to New Teachers in 2006-2007
Shaded columns denote regions with a Big Five City. Certificates assigned to regions based on mailing address in certification records. Out-of-state addresses distributed into regions. n/a means not applicable.
Figure 4.3

23
Subject Areas
Blac
k Rive
r-St
Lawr
ence
Cent
ral
Gene
see-
Fing
er
Lake
s
Lake
Cha
mpl
ain-
Lake
Geo
rge
Mid-
Huds
on
Nass
au-S
uffo
lk
New
York
City
Sout
hern
Tier
- Ce
ntra
l
Sout
hern
Tier
- Ea
st
Sout
hern
Tier
- W
est
Uppe
r Hud
son
Uppe
r Moh
awk
Valle
y
Wes
tern
New
York
Sta
te
Arts 8 30 49 6 61 128 234 4 19 8 43 7 28 625 Bilingual Education - 2 5 - 3 4 95 - - - - - 5 113
Career & Technical Educ. 11 18 36 8 29 71 61 6 16 8 38 7 23 332 Elem. & Early Childhood 39 117 144 28 161 201 1,746 22 55 39 109 23 112 2,797
English 10 35 64 7 77 112 588 5 19 14 33 7 52 1,024 ESOL 1 3 7 - 13 22 231 - - - - - 6 283
Languages OTE 10 21 21 7 38 66 141 3 9 6 17 11 18 369 Library, Sch.Media Spec. 2 10 9 4 9 12 18 2 15 4 8 1 5 99
Mathematics 8 40 54 10 75 134 554 4 27 9 42 6 45 1,009 Other Teaching 6 25 43 6 48 63 207 5 15 12 20 11 26 486
Physical Education 4 26 31 6 46 58 149 2 11 12 23 3 14 386 Reading & Literacy 4 4 15 6 15 13 18 1 3 6 8 1 14 107
Sciences 8 30 44 7 61 122 433 4 20 7 34 6 31 808 Social Studies 9 19 43 1 55 78 373 10 14 7 34 6 29 679
SpecEd Specific Disabilities 8 19 26 3 47 44 253 11 16 10 18 5 9 470 SpecEd Elementary 9 34 44 11 56 94 638 6 23 11 33 9 50 1,017
SpecEd Middle/Secondary 3 5 24 4 26 23 310 3 7 1 7 1 7 421 SpecEd Bilingual - 2 2 - - - 9 - - - - - - 13
All Subjects 141 439 660 114 820 1,247 6,058 89 269 156 468 105 473 11,038
FTE teaching assignments held by teachers with no prior experience were FTE vacancies filled by new teachers. Shaded columns denote regions with a Big Five City. Columns and rows may not sum to totals due to rounding.
Number of Vacancies Filled by New Teachers
Number of FTE Teaching Assignments Held by Teachers with No Prior Teaching Experience in 2006-2007
Figure 4.4

24
Subject Areas
Blac
k Rive
r-St
Lawr
ence
Cent
ral
Gene
see-
Fing
er
Lake
s
Lake
Cha
mpl
ain-
Lake
Geo
rge
Mid-
Huds
on
Nass
au-S
uffo
lk
New
York
City
Sout
hern
Tier
- Ce
ntra
l
Sout
hern
Tier
- Ea
st
Sout
hern
Tier
- W
est
Uppe
r Hud
son
Uppe
r Moh
awk
Valle
y
Wes
tern
New
York
Sta
te
Arts 1.5 Bilingual Education 0.7 0.6
Career & Technical Educ. 1.9 1.3 1.6 0.9 1.9 Elem. & Early Childhood
English 0.9 1.9 ESOL 1.3
Languages OTE 1.6 1.7 1.5 0.9 1.3 1.8 1.8 1.0 2.0 Library, Sch.Media Spec. 1.0 1.8 1.0 1.0 0.7 1.0
Mathematics 1.0 1.2 1.9 Other Teaching 0.7 0.7 1.2 1.3 0.5 1.6 0.3 0.8 1.3 0.6 1.2 0.3 0.8
Physical Education 0.9 1.3 Reading & Literacy
Sciences 0.8 Social Studies 1.1 1.7
SpecEd Specific Disabilities 1.2 SpecEd Elementary
SpecEd Middle/Secondary 1.3 SpecEd Bilingual n/a n/a n/a n/a n/a n/a n/a n/a n/a n/a n/a n/a n/a n/a
All Subjects 1.8
for Each FTE Vacancy for a New Teacher in 2006-2007
Shortage AreasSubject Areas and Regions with 2 or Fewer Certificates Issued to New Teachers in 2006-2007
Certificates assigned to regions based on mailing address in certification records. Shaded columns denote regions with a large city. n/a means not applicable.
CAUTION: Data not adjusted for teachers receiving multiple certificates in the same subject area, or for different certificate titles required in same subject area, which means that table shows a "best case" scenario.
Figure 4.5

25
Subject Areas
Blac
k Rive
r-St
Lawr
ence
Cent
ral
Gene
see-
Fing
er
Lake
s
Lake
Cha
mpl
ain-
Lake
Geo
rge
Mid-
Huds
on
Nass
au-S
uffo
lk
New
York
City
Sout
hern
Tier
- Ce
ntra
l
Sout
hern
Tier
- Ea
st
Sout
hern
Tier
- W
est
Uppe
r Hud
son
Uppe
r Moh
awk
Valle
y
Wes
tern
New
York
Sta
te
Arts 1.9 1.9 2.0 1.9 0.9 1.3 1.4 1.6 Bilingual Education - 0.7 1.8 0.4 2.0
Career & Technical Educ. 0.8 1.1 1.0 0.6 0.6 0.8 0.3 0.7 0.6 0.2 0.9 1.3 1.4 0.8 Elem. & Early Childhood 1.9
English 1.7 1.8 0.6 1.7 1.0 1.3 1.3 ESOL - 1.5 0.9 1.4 1.4
Languages OTE 1.0 1.0 1.0 0.3 1.3 1.3 0.6 0.3 0.6 1.2 0.8 0.7 1.0 Library, Sch.Media Spec. - 1.3 0.3 1.1 0.5 0.4 0.5 1.8 1.8
Mathematics 1.3 2.0 1.5 0.7 1.7 0.8 1.7 1.5 1.3 Other Teaching 0.3 0.5 0.5 0.4 0.1 0.6 0.0 0.2 0.8 0.2 0.6 0.1 1.3 0.3
Physical Education 1.8 1.6 1.5 1.6 0.5 0.8 1.9 Reading & Literacy
Sciences 2.0 0.5 0.5 1.5 0.8 1.7 1.2 Social Studies 0.7 1.1
SpecEd Specific Disabilities 1.0 1.5 1.7 1.3 0.3 0.6 1.5 2.0 1.5 1.8 SpecEd Elementary 1.7
SpecEd Middle/Secondary 1.0 1.1 1.0 0.6 0.9 1.6 1.7 SpecEd Bilingual n/a n/a n/a n/a n/a n/a n/a n/a n/a n/a n/a n/a n/a n/a
All Subjects 1.3 1.8 2.0
Shortage Areas - If College Recommended Pathway Were the Only PathwaySubject Areas and Regions with 2 or Fewer Certificates Issued to New Teachers in 2006-2007
for Each FTE Vacancy for a New Teacher in 2006-2007
Certificates assigned to regions based on mailing address in certification records. Shaded columns denote regions with a large city. n/a means not applicable.
CAUTION: Data not adjusted for teachers receiving multiple certificates in the same subject area, or for different certificate titles required in same subject area, which means that table shows a "best case" scenario.
Figure 4.6

26
Subject Areas
Blac
k Rive
r-St
Lawr
ence
Cent
ral
Gene
see-
Fing
er
Lake
sLa
ke C
ham
plain
-La
ke G
eorg
e
Mid-
Huds
on
Nass
au-S
uffo
lk
New
York
City
Sout
hern
Tier
- Ce
ntra
lSo
uthe
rn T
ier -
East
Sout
hern
Tier
- W
est
Uppe
r Hud
son
Uppe
r Moh
awk
Valle
y
Wes
tern
New
York
Sta
te
Arts Bilingual Education 11.0 9.3
Career & Technical Educ. Elem. & Early Childhood 7.1 8.1 9.0 13.3 18.2 8.8 6.7 8.0 9.0 10.9
English ESOL 6.7
Languages OTE Library, Sch.Media Spec.
Mathematics Other Teaching
Physical Education 9.0 10.2 Reading & Literacy 11.7 18.9 11.2 6.3 12.1 27.8 7.1 24.0 12.8 21.6 37.8 10.9 13.4
Sciences 6.6 Social Studies 25.7 6.2 6.6 8.0
SpecEd Specific Disabilities 7.3 15.4 6.7 11.2 6.9 22.9 SpecEd Elementary 6.9 11.5 12.9 16.8 6.9 6.5 6.2 7.3
SpecEd Middle/Secondary 10.4 6.0 6.1 9.4 9.8 8.4 SpecEd Bilingual n/a n/a n/a n/a n/a n/a n/a n/a n/a n/a n/a n/a n/a n/a
All Subjects 6.5 7.6 7.0
Possible Surpluses
for Each FTE Vacancy for a New Teacher in 2006-2007Subject Areas and Regions with More Than 6.0 Certificates to New Teachers
Certificates assigned to regions based on mailing address in certification records. Shaded columns denote regions with a large city. n/a means not applicable.
Figure 4.7
27
Indicator 5 Percent of Full-Time Equivalent Teaching Positions
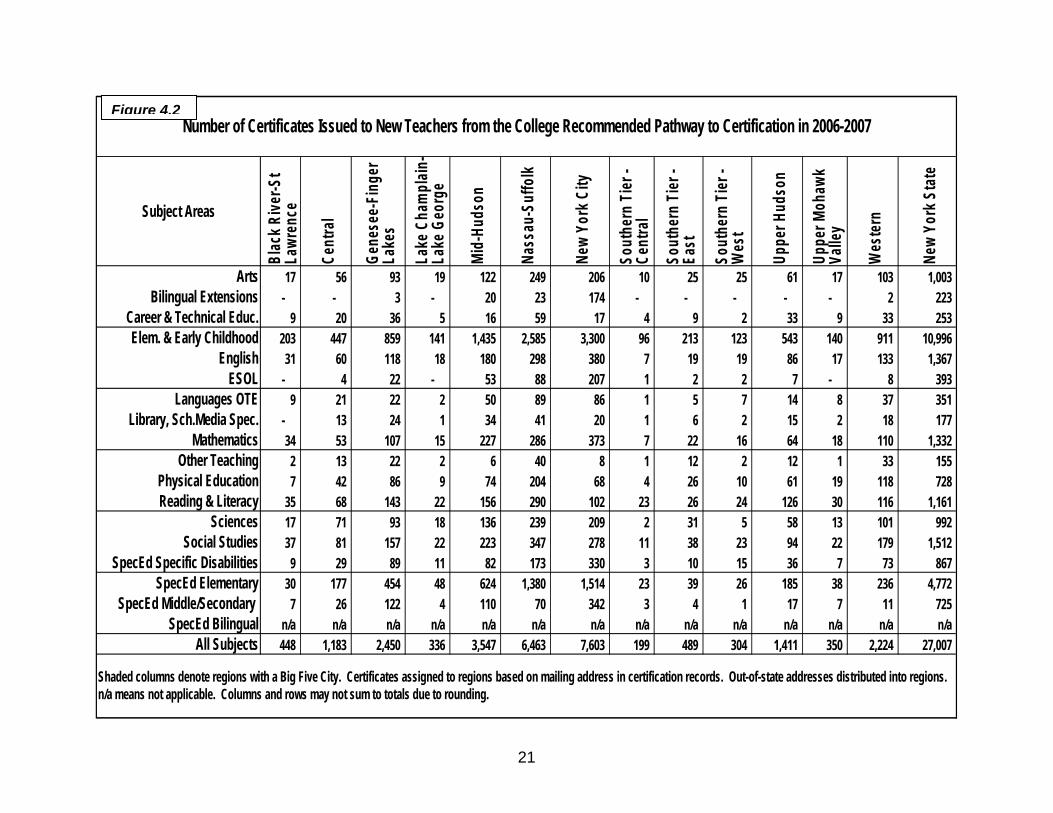
Held by Teachers Age 55 or Older In 2006-2007, nearly 39,600 FTE teaching assignments were held by teachers age 55 or older. This was 18 percent of all FTE teaching assignments, a share that has risen steadily in recent years. Public school teachers over age 55 were in every subject area and region of New York State. Demand for new teachers will remain stable in the immediate future as “baby boomers” retire. Figures 5.1 through 5.3 Retirements are not the only influence on future demand for new public school teachers. Demand could drop due to enrollment declines of 2.8 percent projected by the National Center for Education Statistics (NCES, 2007); improved retention of new teachers resulting from induction and mentoring; constraints on districts’ expenditures; and growth in alternative schooling models, such as home and on-line schooling. On the other hand, demand for new teachers could rise due to the impact of State policies such as universal pre-kindergarten and full-day kindergarten; increasing academic support services for students who do not meet State Learning Standards; improved student retention rates due to early college programs and other initiatives; and extended high school programs for students who need more time to earn a diploma. Figure 5.1
New York StateChanging Age Distribution of Public School Teachers
30% 32% 32% 32% 32%
21% 22% 23% 24% 25% 25%
35% 32% 29% 27% 26% 24%
15% 16% 16% 17% 17% 18%
29%
2000-01 2001-02 2003-04 2004-05 2005-06 2006-2007
55+ yrs
45-54 yrs
35-44 yrs
<35 yrs
Data not available for 2002-2003.

28
Subject Areas
Blac
k Rive
r-St
Lawr
ence
Cent
ral
Gene
see-
Fing
er L
akes
Lake
Ch
ampl
ain-
Lake
Geo
rge
Mid-
Huds
on
Nass
au-S
uffo
lk
New
York
City
Sout
hern
Tier
- Ce
ntra
l
Sout
hern
Tier
- Ea
st
Sout
hern
Tier
- W
est
Uppe
r Hud
son
Uppe
r Moh
awk
Valle
y
Wes
tern
New
York
Sta
te
Arts 40 138 173 45 376 470 632 33 101 43 163 52 158 2,422 Bilingual Education - 1 13 - 19 7 283 - - 0 - - 7 331
Career & Technical Educ. 53 138 187 57 350 391 495 48 80 54 152 41 162 2,210 Elem. & Early Childhood 207 579 630 163 1,358 1,545 3,667 131 352 202 566 242 637 10,278
English 51 124 167 46 387 379 934 40 102 58 144 47 148 2,628 ESOL 3 24 49 - 121 157 599 - 13 2 12 12 26 1,018
Languages OTE 24 60 83 20 259 264 375 19 48 24 90 28 84 1,377 Library, Sch.Media Spec. 22 64 95 23 200 210 235 18 41 18 79 24 83 1,112
Mathematics 39 100 134 42 359 423 962 30 72 55 159 39 138 2,552 Other Teaching 25 112 154 48 239 285 752 28 82 45 98 57 89 2,015
Physical Education 22 58 88 22 205 204 389 18 36 29 73 27 68 1,239 Reading & Literacy 32 64 112 25 286 333 480 25 62 44 137 29 99 1,728
Sciences 30 88 143 34 372 333 763 25 73 34 131 48 131 2,204 Social Studies 45 122 128 37 287 268 720 19 75 41 129 41 129 2,040
SpecEd Specific Disabilities 34 126 159 49 374 397 884 26 64 32 148 42 142 2,477 SpecEd Elementary 26 92 148 33 340 377 1,017 19 57 25 110 35 116 2,395
SpecEd Middle/Secondary 13 22 88 24 249 187 746 15 35 15 40 15 66 1,514 SpecEd Bilingual - 1 1 - - - 51 - - - - - - 53
All Subjects 665 1,913 2,552 667 5,780 6,229 13,984 492 1,293 724 2,231 777 2,284 39,591
Shaded columns denote regions with a Big Five City. Columns and rows may not sum to totals due to rounding.
Future Demand for New TeachersNumber of FTE Teaching Assignments That Were Held by Teachers Age 55 or Older in 2006-2007
Figure 5.2

29
Subject Areas
Blac
k Rive
r-St
Lawr
ence
Cent
ral
Gene
see-
Fing
er
Lake
s
Lake
Cha
mpl
ain-
Lake
Geo
rge
Mid-
Huds
on
Nass
au-S
uffo
lk
New
York
City
Sout
hern
Tier
- Ce
ntra
lSo
uthe
rn T
ier -
East
Sout
hern
Tier
- W
est
Uppe
r Hud
son
Uppe
r Moh
awk
Valle
y
Wes
tern
New
York
Sta
te
Arts 14% 17% 14% 17% 18% 16% 22% 16% 19% 14% 17% 18% 15% 18%Bilingual Education - - - - - - - - - - - - - -
Career & Technical Educ. 18% 23% 20% 20% 29% 23% 30% 26% 21% 20% 21% 17% 21% 24%Elem. & Early Childhood 18% 20% 16% 18% 19% 16% 16% 17% 20% 19% 17% 23% 17% 17%
English 17% 17% 14% 18% 18% 15% 16% 22% 20% 20% 16% 18% 14% 16%ESOL 27% 30% 27% 0% 23% 21% 24% 0% 33% 12% 15% 28% 24% 24%
Languages OTE 17% 16% 15% 14% 22% 17% 24% 21% 20% 17% 18% 22% 16% 19%Library, Sch.Media Spec. 30% 32% 34% 38% 44% 33% 45% 34% 32% 27% 34% 34% 38% 37%
Mathematics 14% 14% 13% 16% 18% 16% 17% 17% 15% 19% 17% 15% 14% 16%Other Teaching 13% 22% 18% 20% 22% 20% 24% 20% 22% 20% 19% 23% 18% 21%
Physical Education 11% 11% 10% 12% 15% 11% 16% 12% 10% 13% 11% 15% 10% 13%Reading & Literacy 19% 22% 23% 22% 31% 25% 35% 25% 24% 26% 25% 25% 22% 27%
Sciences 11% 12% 14% 14% 18% 12% 17% 15% 16% 12% 14% 18% 14% 15%Social Studies 18% 19% 13% 16% 16% 12% 17% 11% 18% 16% 16% 18% 15% 16%
SpecEd Specific Disabilities - - - - - - - - - - - - - -SpecEd Elementary 10% 13% 14% 13% 16% 14% 19% 11% 13% 10% 13% 15% 12% 16%
SpecEd Middle/Secondary 16% 11% 15% 18% 21% 15% 23% 14% 16% 16% 14% 16% 14% 19%SpecEd Bilingual 14% 8% 0% 0% 24% 0% 20%
All Subjects 16% 18% 16% 17% 20% 16% 19% 17% 18% 17% 17% 20% 16% 18%
Future Demand for New Teachers
Percent of All FTE Teaching Assignments That Were Held by Teachers Age 55 or Older in 2006-2007
Shaded columns denote regions with a Big Five City.
Figure 5.3

Indicator 6 Percent of Certificates Issued to New Teachers
Who Were Black or Hispanic
In fall 2004, Black and Hispanic students were nearly 40 percent of all public school students, but Black and Hispanic teachers were 15 percent of all teachers. Race/ethnicity was known for 60 percent of new teachers receiving certificates in 2006-2007. Of the new teachers with known race/ethnicity, only 6 percent of certificates issued to new teachers went to new teachers who were Black or Hispanic. There are clear shortages of Black and Hispanic teachers compared to the student population. Figure 6.1 Figure 6.1
New York StateRace/Ethnic Distribution of Students and Teachers
20%
9%
4%
20%
6%
2%
Public School Students (Fall 2004) Public School Teachers (Fall 2004) Certificates Issued to New Teacherswith Known Race/Ethnicity (2006-2007)
Percent Black Percent Hispanic
Race/ethnicity known for only 60 percent of new teachers.

2
Summary of Findings Multiple indicators based on data from school year 2006-2007 suggest that New York State faced teacher shortages in some subject areas, geographic areas and hard-to-staff districts as well as shortages of teachers from underrepresented race/ethnic groups. In addition, nearly one-fifth (18 percent) of all full-time equivalent teaching assignments in 2006-2007 were held by teachers who were age 55 or older, indicating that demand for teachers will remain at current levels as “baby boomers” retire. Figure 7.1 Figure 7.1
WorkforceCertificates per Vacancy Workforce
Certificates per Vacancy Workforce
Certificates per Vacancy
Workforce Excluding Big 4 Cities
Certificates per Vacancy Including Big 4 Cities
Arts x x x x -Bilingual Education x x x x x
Career & Technical Educ. x x x x - x xElem. & Early Childhood -
English x x x x -ESOL x x x -
Languages OTE x x x x x - x xLibrary, Schl. Media Spec. x x x -
Mathematics x x x x -Other Teaching x x x x x -
Physical Education x x x -Reading & Literacy x x x -
Sciences x x x x -Social Studies x x x -
Spec. Ed. Spec. Disabilities x -Spec. Ed. Elementary x -
Spec, Ed, Middle/Secondary x x x x - x xSpec, Ed. Bilingual x x x x - x
Summary of Teacher Shortage Areas in 2006-2007By Subject Area and Geographic Region
Subject Area
New York City Big Four Cities Rest of State
- denotes that it was not possible to calculate the certificates per vacancy indicator.
The workforce columns show subject areas with 5 or more percent of FTE teaching assignments held by teachers without appropriate certification.
The certificates per vacancy columns show subject areas with 2 or fewer certificates issued to new teachers for each vacancy for a new teacher.
New York State
3
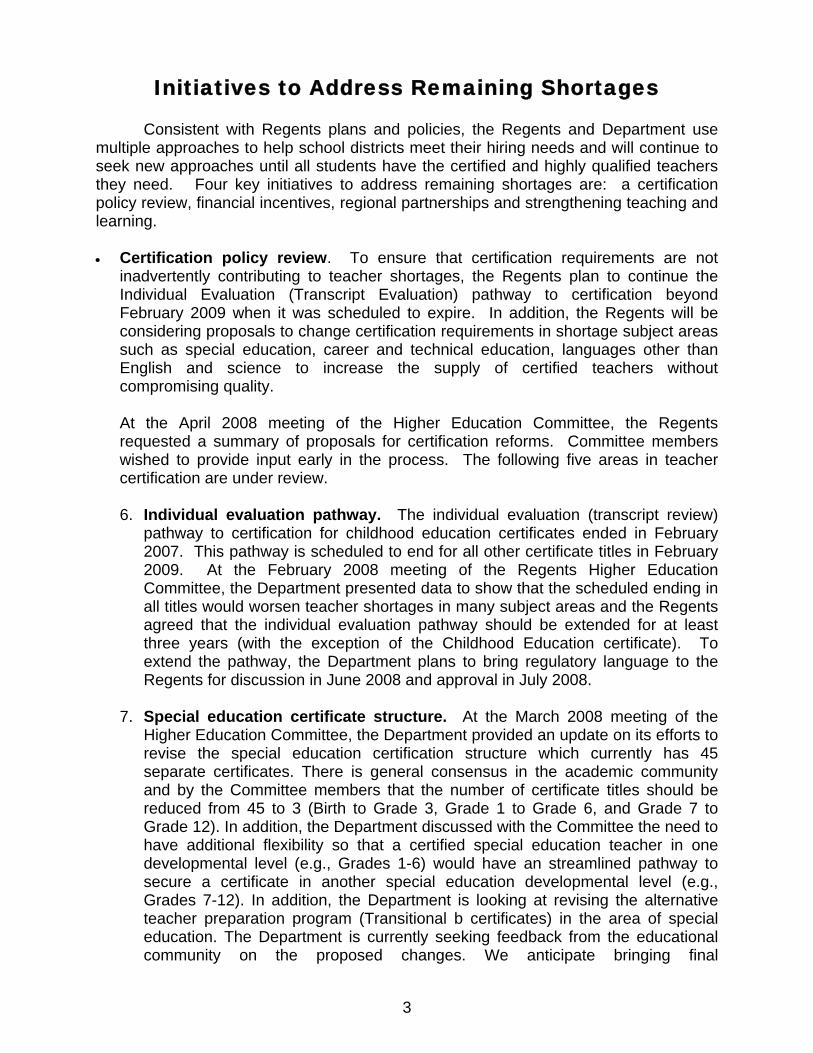
Initiatives to Address Remaining Shortages
Consistent with Regents plans and policies, the Regents and Department use multiple approaches to help school districts meet their hiring needs and will continue to seek new approaches until all students have the certified and highly qualified teachers they need. Four key initiatives to address remaining shortages are: a certification policy review, financial incentives, regional partnerships and strengthening teaching and learning. • Certification policy review. To ensure that certification requirements are not
inadvertently contributing to teacher shortages, the Regents plan to continue the Individual Evaluation (Transcript Evaluation) pathway to certification beyond February 2009 when it was scheduled to expire. In addition, the Regents will be considering proposals to change certification requirements in shortage subject areas such as special education, career and technical education, languages other than English and science to increase the supply of certified teachers without compromising quality. At the April 2008 meeting of the Higher Education Committee, the Regents requested a summary of proposals for certification reforms. Committee members wished to provide input early in the process. The following five areas in teacher certification are under review. 6. Individual evaluation pathway. The individual evaluation (transcript review)
pathway to certification for childhood education certificates ended in February 2007. This pathway is scheduled to end for all other certificate titles in February 2009. At the February 2008 meeting of the Regents Higher Education Committee, the Department presented data to show that the scheduled ending in all titles would worsen teacher shortages in many subject areas and the Regents agreed that the individual evaluation pathway should be extended for at least three years (with the exception of the Childhood Education certificate). To extend the pathway, the Department plans to bring regulatory language to the Regents for discussion in June 2008 and approval in July 2008.
7. Special education certificate structure. At the March 2008 meeting of the Higher Education Committee, the Department provided an update on its efforts to revise the special education certification structure which currently has 45 separate certificates. There is general consensus in the academic community and by the Committee members that the number of certificate titles should be reduced from 45 to 3 (Birth to Grade 3, Grade 1 to Grade 6, and Grade 7 to Grade 12). In addition, the Department discussed with the Committee the need to have additional flexibility so that a certified special education teacher in one developmental level (e.g., Grades 1-6) would have an streamlined pathway to secure a certificate in another special education developmental level (e.g., Grades 7-12). In addition, the Department is looking at revising the alternative teacher preparation program (Transitional b certificates) in the area of special education. The Department is currently seeking feedback from the educational community on the proposed changes. We anticipate bringing final

4
recommendations to the Regents for restructuring of special education certification at its September 2008 meeting.
8. Certification in career and technical education. At the January 2008 meeting of the EMSC Committee of the Board of Regents at the Brooklyn Automotive High School, the Regents requested that the Department reexamine the requirements for certification of career and technical education teachers to ensure an adequate supply of CTE teachers to meet the growing needs for career and technical education programs in our State. The Department has established an internal workgroup to examine the following:
Labor market supply and demand information regarding emerging careers in
New York State by Department of Labor regions; Teacher workforce data to determine the actual number of uncertified CTE
teachers statewide, by school district and by certification title;
The current certification pathway for CTE teachers and the CTE program approval process to determine where efficiencies can be found;
National industry certifications and licenses and the feasibility of using
industry certifications and licenses in lieu of part of the experience or education requirements for CTE certification;
Existing pathways to certification, or new pathways to certification that could
reduce the shortage of CTE teachers, including an expansion of the existing Supplementary Certification to CTE areas; and
The desirability and feasibility of increasing the number of institutions that
prepare CTE teachers, including community colleges in partnership with four year institutions.
Representatives of the community colleges, the three colleges offering CTE teacher education programs, and representatives of CUNY and SUNY system administrations will be brought together to provide further input into the suggested modification/expansions of the pathways to CTE certification. The Department will be presenting a preliminary set of ideas for consideration to the Higher Education Committee at its September or October 2008 meeting.

5
9. Languages other than English (LOTE). There is a shortage of teachers of LOTE in nearly every region of New York State. To qualify for certification in a LOTE, candidates must complete 30 semester hours of study in the target language regardless of their language proficiencies or intercultural knowledge. An internal work group in the Department is developing recommendations for consideration by the Regents that would permit two national examinations developed by the American Council on the Teaching of Foreign Languages (ACTFL) to be used in lieu of some or all of the 30 semester hours for candidates with high levels of language proficiencies and intercultural knowledge. The work group is seeking to use examinations in lieu of semester hours for individuals who already hold a LOTE teaching certificate and wish to obtain an additional certification in another language; for individuals who hold a non-LOTE certificate and are seeking their first certificate in LOTE; and for individuals who are not certified but who are proficient in a LOTE and are seeking their first teaching certificate. The LOTE Content Specialty Test would continue to be required. After additional consultation with the field, the Department expects to bring a proposal to the Regents in the fall of 2008.
10. Additional science certificates. The Department has not yet begun work on this topic, but we plan to examine the requirements for certified science teachers who seek an additional science certificate. At present, a teacher certified in one science subject must complete the full content core requirement (30 semester hours) and pass a Content Specialty Test (CST) in another science subject to qualify for an additional science certificate. It may be educationally sound for certified, experienced science teachers to complete fewer semester hours and pass a CST in the additional science subject. The Department’s review of these issues is scheduled for mid-2009.
• Financial incentives. New York State must offer financial incentives to attract and retain public school teachers because we are competing with other states for the available supply of teachers and with other industries that are attractive to young professionals. The Department will review existing incentive programs to ensure that they are sufficiently targeted on the most hard-to-staff subject areas and schools and will explore new federal programs focused on teacher shortages. Illustrative State and federal programs that provide funds to teacher preparation institutions, school districts and individual teachers for recruitment, preparation and retention are listed below.
Federal programs NCLB Title I and Title II-A allocations to districts NCLB Teacher-Leader Partnerships Troops to Teachers Transition to Teaching Loan forgiveness for teachers TEACH grants State programs Teachers of Tomorrow Teacher Opportunity Corps
6
The Mentor Internship program Scholarships for math and science teachers Teacher Centers Albert Shanker stipends for National Board Certification
In addition, the Regents and Department are advocating for State legislation to eliminate the pension penalty for retired public employees who agree to work in shortage subjects in high need schools and to create a new $25 million program to prepare 1,000 new teachers in hard-to-staff subject areas and schools. The Department is also advocating for federal legislation to enhance teacher recruitment in shortage areas and provide loan forgiveness to BOCES teachers, who are currently excluded. Local districts are also using financial incentives, such as the New York City housing incentive.
Finally, the Department is examining its internal structure and operations to improve its statewide approach to addressing teacher shortages and align research, policy and financial resources and be more strategic in its use of existing financial and human resources to help ensure that all children are taught by certified and highly qualified teachers.
• Regional partnerships. The Department is working in five regions of the State with BOCES, school districts, teacher preparation institutions and others to create or strengthen partnerships to support teacher quality. The five regions include the Rochester area, the Syracuse area, the Southern Tier, the Mid-Hudson area and Long Island. The partnerships are addressing such issues as obtaining regional data on districts’ hiring needs, improving pre-service field experience and student teaching, and extending the knowledge, skills and abilities of new and veteran teachers. The Department plans to extend partnerships to all regions of the State.
The Department is releasing reports and databases for use in these regional partnerships to inform school districts, BOCES, teacher preparation institutions and the general public about the subject areas and regions where new teachers are needed or not needed. The information can help colleges and universities plan their programs, districts and BOCES plan their recruitment strategies, and students and their families make educational and career choices.
• Strengthening teaching and learning. On May 12, 2008 the Regents are
convening a special meeting in Yonkers to discuss the needs of urban students and how they can be met, including the knowledge, skills and abilities that new and veteran teachers need to have to help their students succeed. Participants will consider best practices for meeting the needs of urban students, including those who are at risk of dropping out of school, require special education services or are learning English. The Department is also applying for a Wallace Foundation grant to focus on the preparation and professional development of school leaders who play a critical role in school improvement.
7
References
Boyd, Donald; Lankford, Hamilton; Loeb, Susanna; and Wyckoff, James (2005) The Draw of Home: How Teachers’ Preferences for Proximity Disadvantage Urban Schools. Journal of Policy Analysis and Management, Winter 2005, Vol. 24, No.1, 113-132. http://www.teacherpolicyresearch.org/ResearchPapers/tabid/103/Default.aspx National Center for Education Statistics (2007) Projections of Education Statistics to 2016. Report # 2008-060. http://nces.ed.gov/programs/projections/projections2016/sec1c.asp New York State Board of Regents (1998) New York’s Commitment: Teaching to Higher Standards. http://www.nysed.gov/facmtg/paper20.pdf New York State Board of Regents Statewide Plan for Higher Education (2005) http://www.highered.nysed.gov/Quality_Assurance/statewideplan/page1.htm
New York State Board of Regents P-16 Education: A Plan for Action (2006) http://usny.nysed.gov/summit/p-16ed.htm#aims
New York State Education Department (2006) New York State’s Revised Plan to Enhance Teacher Quality http://www.ed.gov/programs/teacherqual/hqtplans/index.html#ny Peske, Heather and Haycock, Kati (2006) Teaching Inequality: How Poor and Minority Students Are Shortchanged on Teacher Quality. The Education Trust. http://www2.edtrust.org/EdTrust/Product+Catalog/subject+search (Select Teacher Quality)

8
Appendix A Technical Information
Data sources The New York State Education Department’s (NYSED) Basic Educational Data System (BEDS) Personnel Master File (PMF) was the source of teacher workforce data. The Department’s TEACH system was the source for teacher certification data. Definitions of Terms
Certificates issued. Certificates issued includes classroom teaching certificates and other credentials (such as bilingual extensions) that were issued in each school year, which is defined as September 1 through August 31 for certificate purposes, but it excludes teaching credentials that do not apply to academic instruction in pre-school through grade 12. Full-time equivalent teaching assignments. In the BEDS PMF, each teaching assignment is weighted based on its share of a full-time equivalent assignment. For example, when a teacher has 4 assignments, each has a weight of 25 percent. When a teacher is not appropriately certified for 1 out of 4 assignments, 25 percent of an FTE teaching assignment is counted as being taught by a teacher without appropriate certification and 75 percent of an FTE teaching assignment is counted as being taught by a teacher with appropriate certification. Full-time equivalent teaching assignments held by teachers without appropriate certification. Full-time equivalent (FTE) teaching assignments held by teachers without appropriate certification include all teaching assignments that were: • before September 1, 2005, classes taught by individuals with temporary or
modified temporary licenses, as permitted by Part 80 of the Regulations of the Commissioner of Education;
• classes in approved “incidental” subjects, due to demonstrated shortages, as permitted by Part 80;
• classes taught by uncertified individuals serving as long-term substitutes, as permitted by Part 80;
• classes taught by uncertified or out-of-field teachers in charter schools, as permitted by State Education Law;
• classes taught by certified teachers doing out-of-field teaching beyond approved “incidental” teaching, due to shortages or administrative decisions; and
• classes taught by uncertified individuals for unknown reasons.
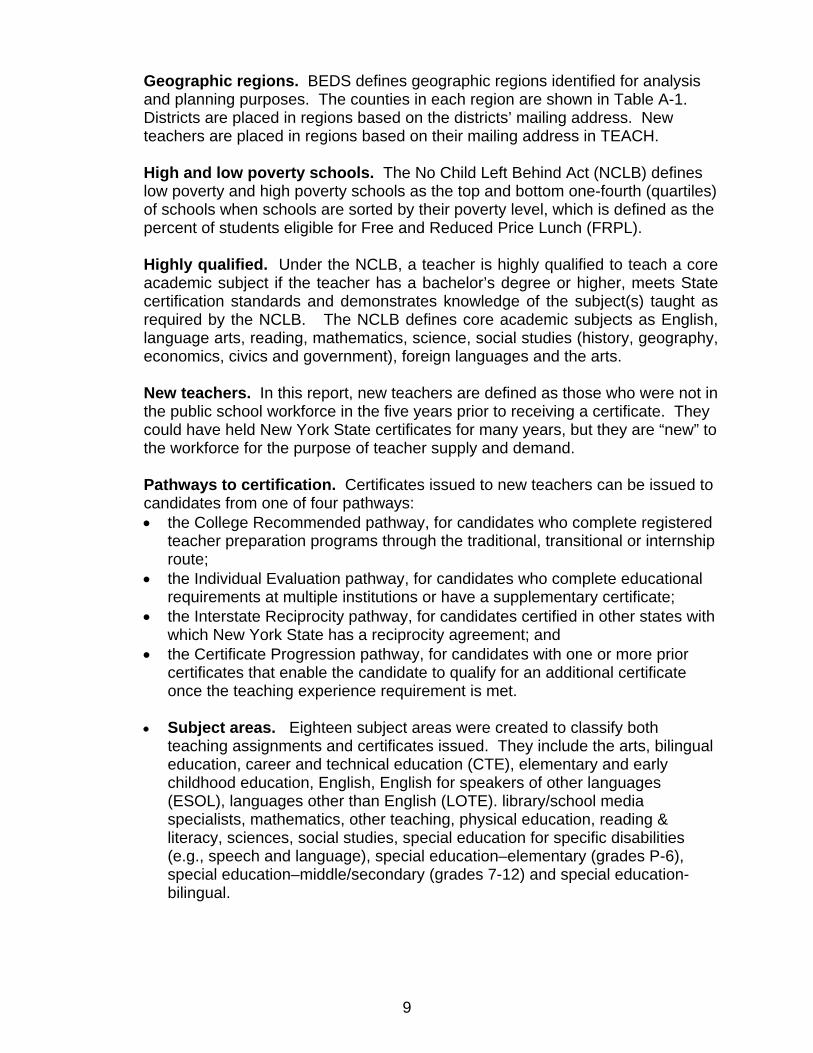
9
Geographic regions. BEDS defines geographic regions identified for analysis and planning purposes. The counties in each region are shown in Table A-1. Districts are placed in regions based on the districts’ mailing address. New teachers are placed in regions based on their mailing address in TEACH. High and low poverty schools. The No Child Left Behind Act (NCLB) defines low poverty and high poverty schools as the top and bottom one-fourth (quartiles) of schools when schools are sorted by their poverty level, which is defined as the percent of students eligible for Free and Reduced Price Lunch (FRPL). Highly qualified. Under the NCLB, a teacher is highly qualified to teach a core academic subject if the teacher has a bachelor’s degree or higher, meets State certification standards and demonstrates knowledge of the subject(s) taught as required by the NCLB. The NCLB defines core academic subjects as English, language arts, reading, mathematics, science, social studies (history, geography, economics, civics and government), foreign languages and the arts. New teachers. In this report, new teachers are defined as those who were not in the public school workforce in the five years prior to receiving a certificate. They could have held New York State certificates for many years, but they are “new” to the workforce for the purpose of teacher supply and demand. Pathways to certification. Certificates issued to new teachers can be issued to candidates from one of four pathways: • the College Recommended pathway, for candidates who complete registered
teacher preparation programs through the traditional, transitional or internship route;
• the Individual Evaluation pathway, for candidates who complete educational requirements at multiple institutions or have a supplementary certificate;
• the Interstate Reciprocity pathway, for candidates certified in other states with which New York State has a reciprocity agreement; and
• the Certificate Progression pathway, for candidates with one or more prior certificates that enable the candidate to qualify for an additional certificate once the teaching experience requirement is met.
• Subject areas. Eighteen subject areas were created to classify both
teaching assignments and certificates issued. They include the arts, bilingual education, career and technical education (CTE), elementary and early childhood education, English, English for speakers of other languages (ESOL), languages other than English (LOTE). library/school media specialists, mathematics, other teaching, physical education, reading & literacy, sciences, social studies, special education for specific disabilities (e.g., speech and language), special education–elementary (grades P-6), special education–middle/secondary (grades 7-12) and special education- bilingual.
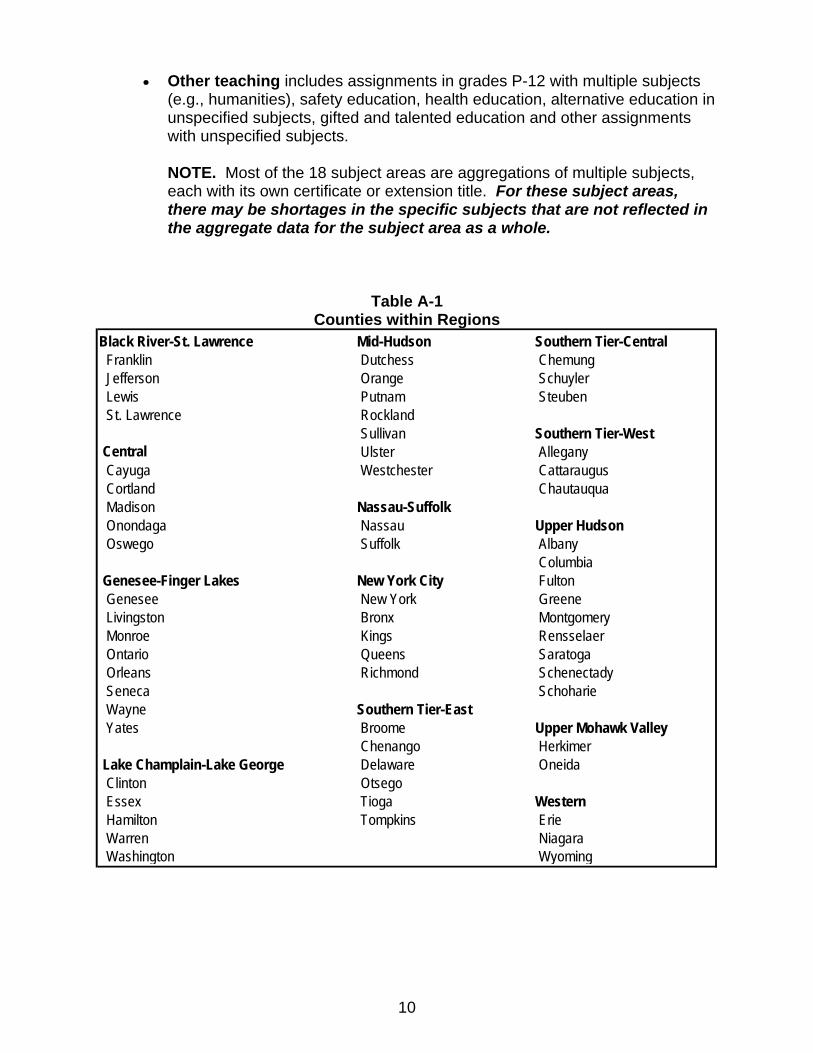
10
• Other teaching includes assignments in grades P-12 with multiple subjects (e.g., humanities), safety education, health education, alternative education in unspecified subjects, gifted and talented education and other assignments with unspecified subjects.
NOTE. Most of the 18 subject areas are aggregations of multiple subjects, each with its own certificate or extension title. For these subject areas, there may be shortages in the specific subjects that are not reflected in the aggregate data for the subject area as a whole.
Table A-1 Counties within Regions
Black River-St. Lawrence Mid-Hudson Southern Tier-Central Franklin Dutchess Chemung Jefferson Orange Schuyler Lewis Putnam Steuben St. Lawrence Rockland
Sullivan Southern Tier-West Central Ulster Allegany Cayuga Westchester Cattaraugus Cortland Chautauqua Madison Nassau-Suffolk Onondaga Nassau Upper Hudson Oswego Suffolk Albany
Columbia Genesee-Finger Lakes New York City Fulton Genesee New York Greene Livingston Bronx Montgomery Monroe Kings Rensselaer Ontario Queens Saratoga Orleans Richmond Schenectady Seneca Schoharie Wayne Southern Tier-East Yates Broome Upper Mohawk Valley
Chenango Herkimer Lake Champlain-Lake George Delaware Oneida Clinton Otsego Essex Tioga Western Hamilton Tompkins Erie Warren Niagara Washington Wyoming