teacher mobility and effectiveness in restructuring and ... · 2 teacher mobility and effectiveness...
TRANSCRIPT

1
Teacher Mobility and Effectiveness in Restructuring and Non-Restructuring
Schools in an Inner-City District
Steven M. Ross William L. Sanders Weiping Wang S. Paul Wright
The University of Memphis The University of Tennessee
Sam StringfieldJohns Hopkins University
October, 1999

2
Teacher Mobility and Effectiveness in Restructuring and Non-Restructuring
Schools in an Inner-City District
EXECUTIVE SUMMARY
Teaching effectiveness in association with educational reform is typically dealt in
the literature anecdotally and qualitatively, or through quantitative studies that are limited
to small numbers of teachers or lack adequate control groups. Practitioners and policy
makers have much more information about teachers’ reactions rather than behaviors in
response to the educational reform process. In the present research, we examined two
major categories of teacher behavior that could be influenced by reform: (a) teaching
effectiveness, as reflected for individual teachers by their contributions to their students’
academic achievement; and (b) mobility, as reflected by teachers’ decisions to remain at
or leave their schools once reform designs were adopted. The context for the study was
Memphis City Schools, a large urban district consisting of about 115,000 students. Over
80% of the students are African American and over 70% qualify for free or reduced-price
lunch. Research questions were:
1. Does teacher effectiveness differ overall for restructuring schools versus non-
restructuring schools.
2. Does the level of teacher mobility differ overall for restructuring schools
versus non-restructuring schools?
3. Are mobility and teacher effectiveness outcomes consistent for two cohorts of
restructuring schools?
3
4. Are mobility and teacher effectiveness outcomes consistent for individual
restructuring designs?
The Tennessee Value-Added Assessment System (TVAAS) was developed by
William Sanders and associates at The University of Tennessee to provide performance
scores free of the biases normally associated with standardized test outcomes data
(Sanders & Horn, 1995a, 1995b). By measuring the amount that students gain in their
standardized test scale scores from one year to the next, TVAAS scores reflect growth
regardless of initial level of performance. The resultant estimates of student and teacher
effects have been demonstrated to be statistically independent of socioeconomic
confoundings and do not require direct measures of these variables. The TVAAS scores
over a four-year period were used to judge teacher effectiveness.
Schools involved in the present study were 25 restructuring schools that began
implementation in 1995-1996 (to be referred to as R95 schools), 12 that began
implementation in 1996-1997 (R96 schools), and 61 non-restructuring schools (NR
schools). All were elementary schools. Teacher effectiveness and mobility rates were
examined in the years 1994-1995, 1995-1996, 1996-1997, and 1997-1998.
Conclusions
Results of the present study supported the following conclusions:
1. Overall, teachers in their first year at a school (regardless of experience) had
consistently negative effectiveness scores, while those who stayed in the same school
for six or more years had consistently positive effectiveness scores. “All other”
teachers fell in the middle, showing a mixture of low negative and low positive

4
scores. Experience in teaching at a particular school therefore was positively
correlated with student achievement gains.
2. First-year teachers in R95 schools had the most negative effectiveness scores in the
third year of restructuring. A possible explanation is that, as schools progress in their
implementation of reform designs, new teachers, who are likely to be unfamiliar with
and unskilled in the new teaching methods, may experience a more difficult
adjustment than when the reforms are just starting. Typically, professional
development opportunities associated with reform designs are most extensive in the
first year of implementation and tend to receive decreasing emphasis over time.
3. Six-year teachers in R95 schools, but not in NR schools, tended to increase in
effectiveness each year following design selection. Roots and Wings veteran
teachers, in particular, showed substantial and statistically significant improvement
by increasing from a negative pre-reform effectiveness mean of –0.25 to a highly
positive mean of 2.28 three years later. The suggestion is that the veteran teachers
benefited from the professional development and perhaps “renewal” effects
associated with the restructuring. It is sometimes assumed that experienced teachers
are resistant to change or are less able to improve than are novice teachers for whom
traditional strategies are not as strongly ingrained. Our findings suggest the opposite
pattern, i.e., that the veteran teachers can make dramatic improvements in a context of
reform, while less experienced teachers have difficulty adjusting. Results from
classroom observations showed that teaching strategies changed in the restructuring
schools in the direction of greater student centeredness and active learning (Smith et
al., 1998). The pattern for six-year teachers, however, was not replicated overall or

5
for any design in the R96 cohort, so its generalizabilty remains in question. Possibly,
the quality and intensity of training were not equivalent for the two cohorts.
4. Teacher mobility was not strongly affected by restructuring. Although more teachers
tended to leave restructuring schools than non-restructuring schools, this outcome
appeared mostly attributable to the district’s waiver of transfer restrictions for
teachers in schools initiating reform designs the next year. Thus, mobility in
restructuring schools peaked the first year of implementation (i.e., there were more
First Year teachers in that year), but leveled off to NR school rates in subsequent
years.
5. The design most consistently associated with higher mobility levels after being
selected was Roots & Wings. Compared to other designs, Roots & Wings involves
the most extensive professional development and changes in curriculum. Its primary
program component, Success For All (Slavin, Madden, Dolan, & Wasik, 1996),
requires teachers to use prescribed research-based strategies and a special curriculum
for teaching reading. Designs imposing greater demands and changes on teachers
seem likely, at least in early implementation years, to increase teacher mobility.
Other designs having relatively high mobility following selection were ELOB-95,
Co-NECT-95, and Audrey Cohen College-95.
6. Teacher mobility tended to be higher for less effective teachers than more effective
teachers, and for first-year teachers than for six-year teachers. Neither of these
effects seems surprising. Teachers who are experiencing success would probably
want to continue in their present situation, as would teachers who have established
“roots” at a school over time. However, our results did not indicate differential

6
mobility rates based on whether or not teachers were located at restructuring schools.
As previously discussed (see #1 above), restructuring effects on mobility rates were
rather low in general.
While further research is needed to corroborate the present findings, the suggestion is
that educational reform can have a positive impact on teaching effectiveness, and does
not lead to more capable teachers leaving restructuring schools for more traditional
settings. However, as restructuring progresses at a school, it may become more difficult
for new teachers to adapt and be successful. More attention to preparing them through
both preservice and inservice professional development is encouraged.
Introduction
Our nation’s schools are entering the year 2000 with greater impetus and
incentive than ever in the past for implementing “comprehensive” school reform (CSR)
designs. The CSR movement calls for programs that affect all aspects of school
functioning-- instruction, curriculum, governance, professional development, parental
and community involvement, and support services. The overall goal is to make schools
more efficient and successful in preparing students as citizens and workers in the 21st
century (e.g., Herman, 1999; Schlecty, 1997).
Today, federal programs such as Title I school-wide projects and the
Comprehensive School Reform Demonstration (“Obey-Porter”) legislation directly
promote schools’ adoptions of CSR designs (Ross, Alberg, & Nunnery, 1999; Slavin,
1999). But do these designs work to improve student achievement? While there is
isolated supportive (and sometimes equivocal or negative) evidence regarding effects of

7
individual designs (see Herman, 1999), there is no clear assurance that CSR will typically
be successful compared to traditional orientations. Much seems to depend on such
factors as teacher buy-in, principal leadership, design implementation quality, design fit
to school needs, resource allocation, and other factors (Smith et al., 1998).
Our recent research in Memphis, however, has produced suggestive evidence that
restructuring done in a systematic way on a large scale can have beneficial effects overall
(Ross, Sanders, Wright, & Stringfield, 1998; Ross, Wang, Sanders, Wright, & Stringfield,
1999). Specifically, our findings indicated that 25 Memphis elementary schools which
began restructuring in 1995 had two years later (in 1997) significantly higher value-added
(gain) scores on the state-mandated standardized achievement test than did non-
restructuring schools. The restructuring schools also demonstrated a directional
advantage over the non-restructuring schools after three years (in 1998). Individual
designs associated with the strongest benefits were Roots & Wings, Co-NECT, and
Accelerated Schools. Directional advantages over control schools were further shown
after two years by a second cohort consisting of 12 elementary schools that began
restructuring in 1996.
The present study extended this prior work by examining the impacts of
restructuring on teachers, specifically, their mobility and their effectiveness in raising
student achievement. The literature on teachers and educational reform primarily
emphasizes such factors as teacher buy-in, attitudes, empowerment, and professional
development (see e.g., Ayers, 1993; DuFour, 1992; Holland, 1998; Koppich, 1993). For
example, Covaleskie (1994) discusses how reforms that make education more
individualized may be verbally embraced but are likely to be ineffective. Teachers may

8
commit to supporting active learning, but quickly revert to traditional “chalk and talk.”
For many teachers, however, the expectancy to employ new teaching methods is
threatening. According to Slaton, Atwood, Shake, and Hales (1997), for those teachers
who were at retirement age when the reform was mandated, 74% of those who chose to
retire attributed their retirement directly to the reform. Teaching strategies found to have
a low level of support by those teachers were multi-age grouping, mainstreaming, and
non-graded classrooms.
Teaching effectiveness in association with educational reform is typically dealt in
the literature anecdotally and qualitatively, or through quantitative studies that are limited
to small numbers of teachers or lack adequate control groups. Practitioners and policy
makers have much more information about teachers’ reactions rather than behaviors in
response to the educational reform process. In the present research, we examined two
major categories of teacher behavior that could be influenced by reform: (a) teaching
effectiveness, as reflected for individual teachers by their contributions to their students’
academic achievement relative to an “average” teacher in their school district; and (b)
mobility, as reflected by teachers’ decisions to remain at or leave their schools once
reform designs were adopted. The context for the study was Memphis City Schools, a
large urban district consisting of about 115,000 students. Over 80% of the students are
African American and over 70% qualify for free or reduced-price lunch. Research
questions were:
1. Does teacher effectiveness differ overall for restructuring schools versus non-
restructuring schools.

9
2. Does the level of teacher mobility differ overall for restructuring schools
versus non-restructuring schools?
3. Are mobility and teacher effectiveness outcomes consistent for two cohorts of
restructuring schools?
4. Are mobility and teacher effectiveness outcomes consistent for individual
restructuring designs?

10
Background For This Report
The Tennessee Value-Added Assessment System (TVAAS) was developed by
William Sanders and associates at The University of Tennessee to provide performance
scores free of the biases normally associated with standardized test outcomes data
(Sanders & Horn, 1995a, 1995b). By measuring the amount that students gain in their
standardized test scale scores from one year to the next, TVAAS scores reflect growth
regardless of initial level of performance. The resultant estimates of student and teacher
effects have been demonstrated to be statistically independent of socioeconomic
confoundings and do not require direct measures of these variables.
In 1997, using TVAAS scores, we compared the progress of the 25 elementary
schools in Memphis that began restructuring in 1995 (to be referred to as R95 schools) to
34 demographically-matched control schools, and the 40 remaining (“Other”) non-
restructuring elementary schools (Ross et al., 1998). TCAP was a form of the CTBS-4
(CTB/McGraw-Hill, 1990).
In a subsequent study, conducted on spring 1998 test results, comparable analyses
were made for the original 25 R95 schools, an additional 12 schools that began
restructuring in 1996 (R96 schools), and 61 non-restructuring (NR) schools which served
as controls. The state-mandated standardized test employed in 1998 was the TerraNova
or CTBS-5 (CTB/MacMillan/McGraw Hill, 1997). An equating analysis conducted by
William Sanders and his staff in 1999 allowed for the conversion of TCAP scores to the
TerraNova scale so that longitudinal 1998 effects could be determined (personal
communication, William Sanders, April, 1999). In Memphis City Schools, CTBS/4 had

11
been administered in Grade 2, thereby allowing for the computation of 1998 TVAAS
scores in grades 3, 4, 5.
In the present study, teacher effectiveness scores were derived from the 1998
TVAAS results. The former scores reflected the degree to which students taught by
individual teachers improved each year in five subjects (math, reading, language, science,
and social studies. In the next section, we will examine the teacher effectiveness
outcomes for restructuring schools overall and for individual designs.
Teacher Effectiveness
The following analyses addressed the question of whether teaching in a
restructuring school influenced teacher effectiveness over time. For this analysis, we
used the TVAAS Teacher Effect (TTE) for each teacher each year. The TTE measures
individual teachers’ contributions to their students’ academic achievement relative to an
“average” teacher in their school district. Thus, a positive TTE represents an above-
average performance, whereas a negative TTE represents a below-average performance.
The TTEs are calculated from a multivariate, longitudinal, mixed-model analysis of
TerraNova scores as part of TVAAS (Sanders, Saxon, & Horn, 1997).
In the present analyses, we averaged TTE scores over grades for any teachers who
taught the same subject in more than one grade in the same year. Then, we averaged over
the five TerraNova subjects to obtain an overall teacher effect for each teacher each year.
For grades 3-6, which were used in the analyses, most teachers taught all five subjects.
After averaging over four grades (3-6) and five subjects, there were 4,419 TTEs in the
analyses. The overall mean TTE was essentially zero with a standard deviation of 3.2.

12
There were 59% of the TTEs between –2.00 and +2.00, with 21% below –2.00 and 19%
above +2.00.
Teachers included in the present analyses were those (n = 1,869) who taught all
five subjects. If a teacher taught the same subject in more than one grade, we used the
subject mean across grades in the analysis.
Design
The primary analytical design compared TTE scores for three program cohorts of
teachers: R95, R96, and NR. The teacher sample sizes differed from year to year, with
the median sizes being 281, 127, and 699 teachers in the three groups, respectively. An
additional analysis compared NR school means to those of 11 individual restructuring
design groups comprised of at least two schools each. For each restructuring cohort (R95
and R96), post-reform TTE scores were compared to pre-reform TTE scores. In the case
of R95 schools, pre-reform consisted of 1994-95 and post-reform of 1996-97 and 1997-
98 averaged; for R96 schools, pre-reform was 1994-95 and l995-96 averaged, and post-
reform was 1997-98. In addition to program type and year, a third variable was three
groupings of teachers: (a) those who were at the same school for six years (the period for
which TTE scores were available), (b) those who were in their first year at a school, and
(c) all others.
Combined Restructuring Groups
In the initial set of analyses, we examined TTEs for all restructuring designs
combined by comparing R95, R96, and NR teachers from 1994-95 to 1997-98. Figure 1
illustrates those results graphically. As may be seen, R95 teachers (n = 271) had a
negative TTE mean (M = -0.40) in 1994-95, the pre-reform year, but steadily improved
13
each year, culminating in a positive mean of +0.38. NR teachers (n = 667), however,
averaged close to zero (M = -0.10) in the pre-reform year, and declined slightly over time,
averaging in the low-negative range (from -0.11 to -0.32). R96 teachers (n = 121)
demonstrated a unique pattern, by performing highest (M’s = +0.08 and +0.23) in their
pre-reform years (1994-95 and 1995-96), declining in Year 1 (1996-97) to a moderately
negative level (M = -0.53), and then increasing in Year 2 (1997-98) to a slightly negative
level (M = -0.07). Thus, across all teachers, only the R95 cohort showed consistent
improvement across the restructuring years.
Effects by Teacher Type
Follow-up analyses examined TTE scores in R95, R96, and NR schools by three
types of teachers: (a) those who were in their first year at the school, (b) those who were
in the school for six or more years, and (c) all others. While sample sizes varied across
years, the median n’s for the resultant 9 groups were:
First Year Six Years Others
R95 64 89 123
R96 27 40 60
NR 145 260 294
Results are graphically displayed for the R95 cohort vs. NR schools in Tables 2 to
4, and for the R96 cohort vs. NR in Tables 5 to 7. A brief descriptive summary of the
results is provided below.
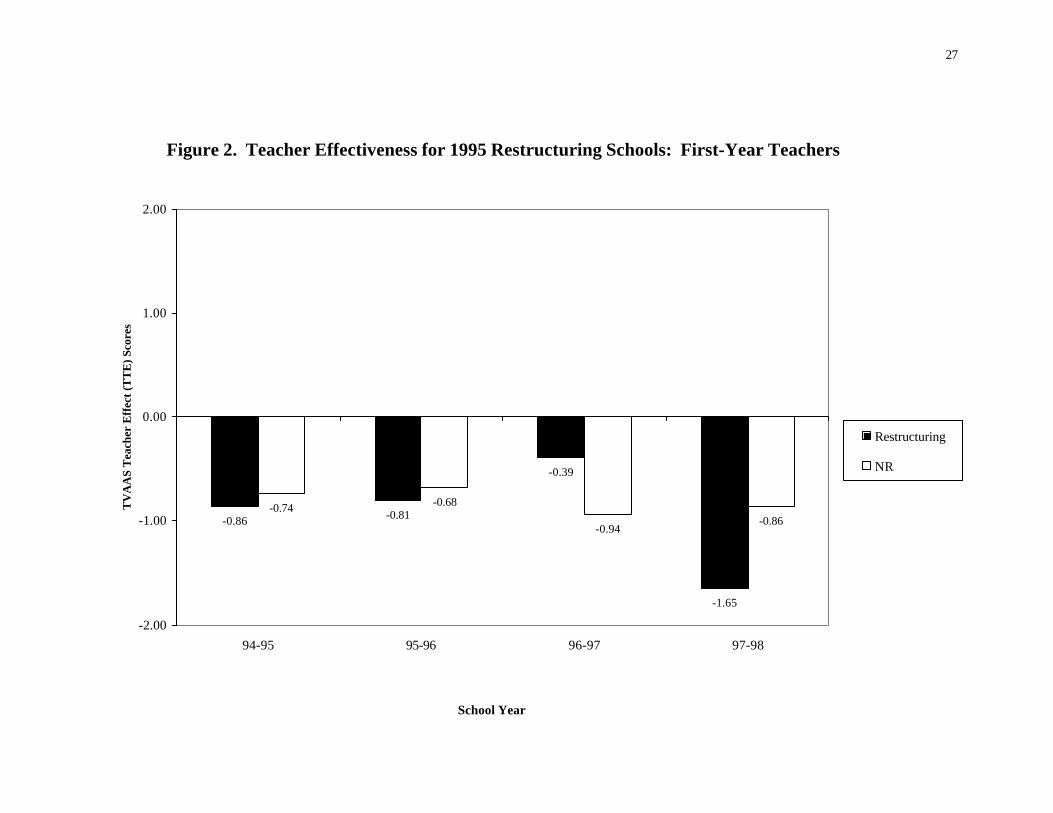
For the R95 cohort, first-year teachers had consistently negative TTEs in both the
R95 and NR schools (see Figure 2). Differences between program groups are small and

14
fluctuate from year to year. However, interestingly, R95 first-year teachers demonstrated
an extensive decline in TTE in 1997-98, the third year of restructuring. In contrast, six-
year R95 and NR teachers (see Figure 3) showed consistently positive TTEs in all four
years. Interestingly, the R95 teachers steadily increased (from +.05 in 1994-95 to 1.51 in
1997-98) whereas NR teachers performed fairly consistently. All other teachers (Figure
4) demonstrated the least consistent pattern, with a mixture of positive and negative TTE
means. Similar to the six-year teachers, the most noticeable program differences
occurred in 1997-98, with R95 teachers scoring relatively high (M = +0.71) and NR
teachers close to zero (M = +0.11).
Results for the R96 cohort were similar with regard to teacher type effects, but the
patterns for programs were less interpretable than for the R95 program. As shown in
Figure 5, first-year teachers performed negatively in both program groups in all years;
program outcomes, however, were very similar. Six-year teachers (Figure 6) performed
positively in all cases, but the advantage indicated for the R96 teachers over NR teachers
was comparable in pre-reform and post-reform years. All other teachers (Figure 7)
performed close to zero in both programs in all years.
Significance tests compared post-reform minus pre-reform differences of R95
versus NR teachers within each group (first-year, six-year, all others). Results were
significant for six-year teachers (p = .0003) and all other teachers (p = .0410), but not for
first-year teachers (p = .986). In both of the former cases, R95 teachers surpassed NR
teachers. None of the parallel significance tests for the R96 cohort, however, approached
significance. While program therefore had some effect for the 1995 cohort, teacher type
was by far the most significant variable in the overall analysis, F(2, 1868) = 38.52, p <

15
.0001. Group mean TTE scores, averaged over designs and years, were –0.891 for first-
year teachers, +0.648 for six-year teachers, and +0.13 for all other teachers.
Supplementary analyses examined program effects on pre- to post-reform TTE
change scores separately for each reform design that was represented by two or more
schools. The only significant effect occurred for six-year teachers in Roots & Wings-95
schools (p = .0040). In 1994-95, six-year R&W teachers (n = 23) averaged –0.25 in TTE,
whereas they averaged +0.84 (n = 25) in 1996-97 and +2.28 (n = 19) in 1997-98. No
other R95 or R96 design cohort or NR cohort made a larger gain.
Teacher Mobility
Analyses were made by implementation year of the proportion of teachers in R95
schools (n = 25), R96 schools (n = 12), and NR schools (n = 61) who were in their first
and last year at the particular school. Such results reflect teacher mobility as a possible
function of design influences. First Year teachers were those who were working in the
particular school for the first time, and thus were not necessarily beginning their teaching
careers. Because First Year and Last Year results are highly correlated, we have chosen
to report only the First Year outcomes here. Note that the reason for the high correlation
between the two mobility measures is that the proportion of teachers leaving a school in a
given year directly influences the number of replacement (First Year) teachers likely to
be hired for the following year. Important to the interpretation of results is knowing that
Memphis City Schools intentionally facilitated transfer requests by teachers in the first
year of their present schools’ design implementation. Consequently, R95 schools might
be expected to have peaked in mobility in 1995-1996, and R96 schools in 1996-1997.

16
Overall Results
Figure 8 depicts results for the three groups of schools. Note from the figure that
NR school proportions for First Year teachers remain fairly stable, ranging from .17 in
1994-95 to .22 in both 1996-97 and 1997-98. Because the designs were not selected by
R95 schools until spring of 1995, the proportion of First Year teachers in the 1994-1995
school year would have been completely unaffected by the restructuring initiative.
Following design selection, some teachers might have anticipated negative experiences
and chosen not to return for 1995-96, thus inflating the proportion of First Year teachers
that year. Those who joined or remained on the faculty would then have experienced the
first year of design implementation. Their decision whether to continue at their schools
in 1996-97 and in 1997-98 would then have impacted First Year placements in those
years. By the same reasoning, First Year teacher mobility in R96 schools would have
been completely unaffected by school restructuring in 1994-95 and 1995-96, susceptible
in 1996-97 to prior year design anticipation effects, and susceptible in 1997-98 to design
implementation effects.
As shown in Figure 8, in the baseline year (1994-95), R95 schools averaged about
22% new teachers. With the design selected and about to be implemented in the fall-
1995, the percentage of new teachers at these schools increased to 28% compared to only
18% at the NR schools. Again, this result seems largely attributable to the district’s
policy of facilitating transfers prior to the initial design implementation. In subsequent
years (1996-97 and 1997-98), the percentage of First Year teachers leveled off to 20%
and 25%, respectively. Statistical comparisons of the proportions showed significantly

17
higher First Year levels for R95 schools relative to NR schools in 1994-95 (p = .0392)
and in 1995-96 (p = .0001).
Results for R96 teachers show a similar type of pattern. Prior to design selection
(1994-95 and 1995-96), the percentages of First Year teachers at those schools averaged
21% and 18%, respectively. With design implementations starting in fall-1996, the
number of First Year teachers increased to 28%. The next year, the percentage declined
slightly to 24%. Comparisons of R96 and NR school mobility rates were not significant
in any of the school years analyzed.
Design Results
To determine whether particular designs had relatively greater effects on teacher
mobility, we analyzed the First Year teacher results for each design that was represented
by two or more schools. Figures 9 to 18 summarize the results for R95 and R96 design
cohorts. The highlighted years on the graphs are those in which teacher mobility could
have been affected by the restructuring implementation for the particular cohort.
R95 designs. Designs represented by two or more schools were Roots & Wings
(n= 8), Co-NECT (n = 4), Accelerated Schools (n = 3), Audrey Cohen College (n = 3),
ATLAS (n = 2), and ELOB (n = 2). As shown in Figures 9-14, the individual design
patterns generally mirrored the overall tendency for mobility to peak in the first
implementation year (1995-96). Again, readers should note that: (a) First Year teachers
were replacing teachers who had not yet experienced implementation at their schools; but
(b) might have been exercising the opportunity provided by the school district to transfer
schools prior to the initial design implementation. Designs having the highest First Year
levels were Roots & Wings-95 (32%) and ELOB-95 (39%). Statistical comparisons of
18
First Year levels between R95 design schools and NR schools were significant (p < .05)
in 1995-1996 for Roots & Wings-95 (p =.003), Co-NECT-95 (p = .025), and Audrey
Cohen College-95 (p = .047). The only other significant comparison was ELOB-95 in
1997-1998 (p = .029). In all cases, mobility was higher at the design schools.
R96 designs. R96 designs represented by two or more schools were Roots &
Wings (n = 4), Accelerated Schools (n = 3), ELOB (n = 2), and Paideia (n = 2). Again,
the typical pattern (see Figures 15-18) was for mobility to peak in the first year of design
implementation (i.e., 1997-98). Comparisons with NR schools showed significantly
higher mobility for Roots & Wings-96 in 1994-95 (40.5%, p = .0005) and in 1996-1997
(48.6%, p = .0002); and significantly lower mobility for ELOB-96 in 1994-95 (3.4%, p =
.033) and in 1995-1996 (3.4%, p = .0272).
Summary
Under normal (non-restructuring) conditions, schools in Memphis replaced about
20% of their staff. However, when teachers at new restructuring schools were given the
opportunity to transfer without penalty, the number of First Year replacements for both
the R95 and R96 cohorts increased to about 28%. In subsequent years, the mobility rate
at restructuring schools decreased to levels approximating that of the NR schools.
Overall, the restructuring initiative appeared to have had a small effect on teacher
mobility, which was largely driven by a relaxation in district policies for transferring in
the implementation year. The design most consistently associated with higher mobility
levels after being selected was Roots & Wings. In the first year of implementation, the
mobility rate at the four Root & Wings-96 schools was close to half (49%) of the

19
teachers. Other designs having relatively high mobility following selection were ELOB-
95, Co-NECT-95, and Audrey Cohen College-95.
Which Teachers Leave?
Another research question of interest concerns whether more effective teachers
are more or less likely to leave a school than are less effective teachers. And, if such
effects occur, do they vary for R schools and NR schools? To address these questions,
our analyses examined the proportion of teachers who were in their last year in a school
across a three-year period (1994-95, 1995-96, and 1996-97) based on: (a) whether the
teacher was in a R school or NR school, (b) whether or not the teacher was in his/her first
year in the school; and (c) whether the teacher had a relatively high TTE score (>+2,) a
relatively low TTE score ( < -2) or near-average TTE score (>=-2 and <= +2).
Approximately 60% of the overall sample fell in the latter category.
The analyses failed to show strong or significant effects for any of the above
variables. In general, more effective teachers were less likely to leave their schools. For
example, in 1994-95, 37% of first-year NR teachers in the low-TTE group left, whereas
only 16% of those in the high-TTE group left. Another general pattern was for first-year
teachers to be more likely to leave a school than were veteran teachers. The data,
however, did not indicate differential mobility rates based on whether or not teachers
were at restructuring or non-restructuring schools.

20
Conclusions
Results of the present study supported the following conclusions:
1. Overall, first-year teachers had consistently negative effectiveness scores, while six-
year teachers had consistently positive effectiveness scores. “All other” teachers fell
in the middle, showing a mixture of low negative and low positive scores.
Experience in teaching at the same school therefore was positively correlated with
student achievement gains.
2. First-year teachers in R95 schools had the most negative effectiveness scores in the
third year of restructuring. A possible explanation is that, as schools progress in their
implementation of reform designs, new teachers, who are likely to be unfamiliar with
and unskilled in the new teaching methods, may experience a more difficult
adjustment than when the reforms are just starting. Typically, professional
development opportunities associated with reform designs are most extensive in the
first year of implementation and tend to receive decreasing emphasis over time.
3. Six-year teachers in R95 schools, but not in NR schools, tended to increase in
effectiveness each year following design selection. Roots and Wings veteran teachers,
in particular, showed marked and statistically significant improvement by increasing
from a negative pre-reform effectiveness mean of –0.25 to a highly positive mean of
2.28 three years later. The suggestion is that the veteran teachers benefited from the
professional development and perhaps “renewal” effects associated with the
restructuring. It is sometimes assumed that experienced teachers are resistant to
change or less able to improve than are novice teachers for whom traditional
strategies are not as strongly ingrained (e.g., Slaton et al., 1997). Our findings

21
suggest the opposite pattern, i.e., that the veteran teachers can make dramatic
improvements in a context of reform, while less experienced teachers have difficulty
adjusting. Results from classroom observations showed that teaching strategies
changed in the restructuring schools in the direction of greater student centeredness
and active learning (Smith et al., 1998). The pattern for six-year teachers, however,
was not replicated overall or for any design in the R96 cohort, so its generalizabilty
remains in question. Possibly, the quality and intensity of training were not
equivalent for the two cohorts.
4. Teacher mobility was not strongly affected by restructuring. Although more teachers
tended to leave restructuring schools than non-restructuring schools, this outcome
appeared mostly attributable to the district’s waiver of transfer restrictions for
teachers in schools initiating reform designs the next year. Thus, mobility in R
schools peaked the first year of restructuring (i.e., there were more First Year teachers
in that year), but leveled off to NR school rates in subsequent years.
5. The design most consistently associated with higher mobility levels after being
selected was Roots & Wings. Compared to other designs, Roots & Wings involves
the most extensive professional development and changes in curriculum. Its primary
program component, Success For All (Slavin, Madden, Dolan, & Wasik, 1996),
requires teachers to use prescribed research-based strategies and a special curriculum
for teaching reading. Designs imposing greater demands and changes on teachers
seem likely, at least in early implementation years, to increase teacher mobility.
Other designs having relatively high mobility following selection were ELOB-95,
Co-NECT-95, and Audrey Cohen College-95.

22
6. Teacher mobility tended to be higher for less effective teachers than more effective
teachers, and for first-year teachers than for six-year teachers. Neither of these
effects seems surprising. Teachers who are experiencing success would probably
want to continue in their present situation, as would teachers who have established
“roots” at a school over time. However, our results did not indicate differential
mobility rates based on whether or not teachers were located at restructuring schools.
As previously discussed (see #1 above), restructuring effects on mobility rates were
rather low in general.
While further research is needed to corroborate the present findings, the suggestion is
that educational reform can have a positive impact on teaching effectiveness, and does
not lead to more capable teachers leaving restructuring schools for more traditional
settings. However, as restructuring progresses at a school, it may become more difficult
for new teachers to adapt to the changes associated with school reform and be successful.
More attention to preparing these teachers through both preservice and inservice
professional development is encouraged.

23
References
Ayers, W. (1993). Chicago: A restless sea of social forces. In C. T. Kerchner
(Ed.), A union of professionals: Labor relations and educational reform (pp. 177-193).
New York: Teachers’ College Press.
Covaleskie, J. (1994). The educational system and resistance to reform: The
limits of policy. Educational Policy Analysis Archives, http//olam.ed.asu/epaa/v2n4html
DuFour, R. (1992). Creating the new American school: A principal’s guide to
school improvement. Bloomington, IN: National Educational Service.
Holland, H. (1998). Making change: Three educators join the battle for better
schools. Portsmouth, NH: Heineman.
Herman, R. (1999). An educators’ guide to schoolwide reform. Arlington, VA.
Educational Research Service.
Koppich, J. E. (1993). Rochester: The rocky road to reform. In C. T. Kerchner
(Ed.), A union of professionals: Labor relations and educational reform (pp. 136-157).
New York: Teachers College Press.
Ross, S. M., Alberg, M., & Nunnery, J. (1999). Selection and evaluation of
locally developed versus externally developed schoolwide programs. In G. Orfield & E.
H. DeBray (Eds.), Hard work for good schools: Facts not fads in Title I reform (pp. 147-
158). Cambridge, MA: The Civil Rights Project, Harvard University.
Ross, S. M., Sanders, W. L., Wright, S. P., & Stringfield, S. (June, 1998). The
Memphis restructuring initiative: Achievement results for years 1 and 2 on the Tennessee
Value-Added Assessment System (TVAAS). Memphis, TN: Center for Research in
Educational Policy, The University of Memphis.

24
Ross, S. M., Wang, W., Sanders, W. L., Wright, S. P., & Stringfield, S. (1999).
Two- and three-year achievement results on the Tennessee value-added assessment
system for restructuring schools in Memphis. Memphis, TN: Center for Research in
Educational Policy: The University of Memphis.
Sanders, W. L., & Horn, S. P. (1995a). Educational assessment reassessed: The
usefulness of standardized and alternative measures of student achievement as indicators
for the assessment of educational outcomes. Educational Policy Analysis Archives, 3(6).
Sanders, W. L., & Horn, S. P. (1995b). The Tennessee Value-Added Assessment
System (TVAAS): Mixed model methodology in educational assessment. In A. J.
Shinkfield & D. Stufflebeam (Eds.), Teacher evaluation: Guide to effective practice (pp.
337-350). Boston: Kluwer.
Sanders, W. L., Sexton, A. M., & Horn, S. P. (1997). The Tennessee Value-
Added Assessment System: A quantitative outcomes-based approach to educational
assessment. In J. Millman (ed.), Grading teachers, grading schools: Is student
achievement a valid education measure? Thousand Oaks, CA: Corwin Press.
Schlecty, P. C. (1997). Inventing better schools: An action plan for educational
reform. San Francisco: Josey-Bass.
Slaton, D., Atwood, V., Shake, M., & Hales, R. (1997). Experienced teachers’
reactions to mandated reform and nongraded primary school programs. Journal of
Research in Childhood Education, 12, 5-15.

25
Slavin, R. E. (1999). How title I can become the engine of reform in America’s
schools. In G. Orfield & E. H. DeBray (Eds.), Hard work for good schools: Facts not
fads in Title I reform (pp. 86-101). Cambridge, MA: The Civil Rights Project, Harvard
University.
Slavin, R. E., Madden, N. A., Dolan, L., & Wasik, B. (1996). Every child, every
school: Success For All. Newbury Park, CA: Corwin.
Smith, L., Ross, S., McNelis, M., Squires, M., Wasson, R., Maxwell, S., Weddle,
K., Nath, L., Grehan, A., & Buggey, T. (1998). The Memphis restructuring initiative:
Analyses of activities and outcomes that impact implementation success. Education and
Urban Society, 30(3), 296-325

26
Figure 1. Teacher Effectiveness for 1995 and 1996 Restructuring School: All Teachers
-0.40
-0.17
0.18
0.38
0.08
0.23
-0.53
-0.07-0.10
-0.19
-0.32
-0.11
-1.00
-0.50
0.00
0.50
1.00
94-95 95-96 96-97 97-98
TV
AA
S T
each
er E
ffec
t (T
TE
) Sco
res
R95R96
NR
School Year
27
Figure 2. Teacher Effectiveness for 1995 Restructuring Schools: First-Year Teachers
-0.86 -0.81
-0.39
-1.65
-0.74 -0.68
-0.94-0.86
-2.00
-1.00
0.00
1.00
2.00
94-95 95-96 96-97 97-98
TV
AA
S T
each
er E
ffec
t (T
TE
) Sco
res
Restructuring
NR
School Year

28
Figure 3. Teacher Effectiveness for 1995 Restructuring Schools: Six-Year Teachers
0.05
0.51
1.10
1.51
0.44
0.13
0.400.23
-2.00
-1.00
0.00
1.00
2.00
94-95 95-96 96-97 97-98
TV
AA
S T
each
er E
ffec
t (T
TE
) Sco
res
RestructuringNR
School Year

29
Figure 4. Teacher Effectiveness for 1995 Restructuring Schools: All Other Teachers
-0.26
0.030.20
0.71
-0.18-0.10
-0.43
0.11
-2.00
-1.00
0.00
1.00
2.00
94-95 95-96 96-97 97-98
TV
AA
S T
each
er E
ffec
t (T
TE
) Sco
res
RestructuringNR
School Year

30
Figure 5. Teacher Effectiveness for 1996 Restructuring Schools: First-Year Teachers
-0.59-0.68
-1.57
-0.92
-0.74 -0.68
-0.94-0.86
-2.00
-1.00
0.00
1.00
2.00
94-95 95-96 96-97 97-98
TV
AA
S T
each
er E
ffec
t (T
TE
) Sco
res
Restructuring
NR
School Year

31
Figure 6. Teacher Effectiveness for 1996 Restructuring Schools: Six-Year Teachers
1.041.20
0.29
0.91
0.44
0.13
0.400.23
-2.00
-1.00
0.00
1.00
2.00
94-95 95-96 96-97 97-98
TV
AA
S T
each
er E
ffec
t (T
TE
) Sco
res
Restructuring
NR
School Year

32
Figure 7. Teacher Effectiveness for 1996 Restructuring Schools: All Other Teachers
0.00
0.27
0.02
-0.23-0.18-0.10
-0.43
0.11
-2.00
-1.00
0.00
1.00
2.00
94-95 95-96 96-97 97-98
TV
AA
S T
each
er E
ffec
t (T
TE
) Sco
res
RestructuringNR
School Year

33
Figure 8. Proportion of First-Year Teachers at R95, R96, and Non-Restructuring (NR) Schools
0.22
0.28
0.20
0.25
0.21
0.18
0.28
0.24
0.170.18
0.22 0.22
0
0.1
0.2
0.3
0.4
0.5
94-95 95-96 96-97 97-98
School Year
Prop
ortio
ns
R95
R96
NR

34
Figure 9. Proportion of First-Year Teachers at R95 Roots & Wings Schools (n = 8)
0.23
0.32
0.16
0.30
0.00
0.10
0.20
0.30
0.40
0.50
94-95 95-96 96-97 97-98
Pro
port
ion
School Year
Figure 10. Proportion of First-Year Teachers at R95 Co-NECT Schools (n = 4)
0.19
0.290.25
0.17
0.00
0.10
0.20
0.30
0.40
0.50
94-95 95-96 96-97 97-98
Pro
port
ion
School Year
Figure 11. Proportion of First-Year Teachers atR95 Accelerated Schools (n = 3)
0.23 0.240.29
0.16
0.00
0.10
0.20
0.30
0.40
0.50
94-95 95-96 96-97 97-98
Pro
port
ion
School Year
Figure 12. Proportion of First-Year Teachers at R95 Audrey Cohen College Schools (n = 3)
0.230.29
0.18
0.29
0.00
0.10
0.20
0.30
0.40
0.50
94-95 95-96 96-97 97-98
Pro
port
ion
School Year

35
Figure 13. Porportion of First-Year Teachers at R95 ATLAS Schools (n = 2)
0.26 0.240.28
0.13
0.00
0.10
0.20
0.30
0.40
0.50
94-95 95-96 96-97 97-98
Pro
port
ion
School Year
Figure 15. Proportion of First-Year Teachers at R96 Roots and Wings Schools (n = 4)
0.41
0.270.30
0.49
0.00
0.10
0.20
0.30
0.40
0.50
0.60
94-95 95-96 96-97 97-98
Pro
port
ion
School Year
Figure 14. Porportion of First-Year Teachers at R95 Expeditionary Learning Outward Bound Schools (n =2)
0.29
0.39
0.06
0.44
0.00
0.10
0.20
0.30
0.40
0.50
94-95 95-96 96-97 97-98
Pro
port
ion
School Year
Figure 16. Proportion of First-Year Teachers at R96 Accelerated Schools (n = 3)
0.21
0.14
0.230.27
0.00
0.10
0.20
0.30
0.40
0.50
94-95 95-96 96-97 97-98
Pro
port
ion
School Year

36
Figure 17. Proportion of First-Year Teachers at R96 Expeditionary Learning Outward Bound Schools (n = 2)
0.03 0.03
0.13
0.23
0.00
0.10
0.20
0.30
0.40
0.50
94-95 95-96 96-97 97-98
Pro
port
ion
School Year
Figure 18. Proportion of First-Year Teachers at R96 Paideia Schools (n = 2)
0.15
0.24
0.13
0.22
0.00
0.10
0.20
0.30
0.40
0.50
94-95 95-96 96-97 97-98
Pro
port
ion
School Year