teacher guide - western reserve public media · credits project coordinator....
TRANSCRIPT
Teacher Guidehttp://www.WesternReservePublicMedia.org/quizbus

�
Table of ContentsCredits...................................................................................4
QuizBus:.Dealing.with.Data.—.Introduction.......................5
Video 1: Introduction to Data Analysis .......................................7
Labeling.Graphs...................................................................9
What’s.This.Graph.Telling.Me?..................................11
Interpreting.Graphs.Using.CBR.and.Graphing..Calculator............................................................................13
Exit.Ticket:.Interpreting.Graphs..................................15
Interpreting.Graphs.Direction.Sheet..........................16
Misleading.Graphs............................................................17
CNN.and.the.Schiavo.Case......................................18
Mean,.Median,.Mode.and.Range...................................21
What’s.the.Deal?.Mean,.Median,.Mode..and.Range................................................................... 24
Measures.of.Center.and.Spread.............................. 25
Types.of.Data:.Categorical.vs..Measurement..and.Discrete.vs..Continuous..............................................27
Measurement.vs..Continuous.Data........................... 30
Discrete.vs..Continuous.Data......................................31
Types.of.Data:.Evaluation.......................................... 32
Video 2: Line Plots, Bar Graphs, Histograms and Circle Graphs ........ 33
Wheel.of.Fortune:.Line.Plots............................................. 35
Wheel.of.Fortune.Data.Sheet.....................................37
Line.Plots............................................................................. 38
How.Many.Keys?.Line.Plots....................................... 40
Bar.Graphs.........................................................................41
Grades:.Making.a.Histogram.......................................... 43
Zodiac.Circle.Graphs....................................................... 45
Zodiac.Table............................................................... 48
A.Variety.of.Graphs.......................................................... 49
A.Variety.of.Graphs:.Sample.Data........................... 52
All.About.You.Survey:.Which.Graph.Is.Best?................. 54
All.About.You.Survey..................................................57
All.About.You.Graphs................................................ 58
Video 3: Stem-and-Leaf Plots, Box-and-Whisker Plots and Scatter Plots ........61
Stem-and-Leaf.Plots............................................................ 63
How.Many.Calories?.Stem-and-Leaf.Plots............... 65
Human.Box-and-Whisker.Plots..........................................67
Box-and-Whisker.Plots....................................................... 70
Sample.Box-and-Whisker.Plots.................................. 73
Penny.Drop...................................................................74
Scatter.Plots.and.Median.Fit.Line..................................... 77
Day.1:.Are.You.Regular?........................................... 82
Day.2:.Are.You.Regular?........................................... 85
Day.2:.Are.You.Regular?.Answer.Key...................... 86
Monopoly.Madness...........................................................87
Monopoly.Madness................................................... 89
Video 4: Doing Data Projects ...........91Data.Projects.—.Basic.Information.................................... 93
The.Need.to.Use.a.Random.Sample................................94
100.Random.Rectangles............................................ 96
Learning.About.Sampling..................................................97
Choosing.a.Sample.................................................... 99
Taking.a.Survey............................................................... 101
Asking.Good.Survey.Questions.............................. 103
Surveys:.Asking.the.Questions................................. 104
Doing.a.Data.Project....................................................... 106
Project.Requirements................................................. 111
Statistics.Project..........................................................112
Video 5: Probability ........................113An.Introduction.to.Probability..........................................115
Tree.Diagrams...................................................................118
Multiplying.the.Probability.............................................. 123
Compound.Probability............................................. 125
Compound.Probability.—.Answers.......................... 126
Probability:.Native.American.Stick.Game.................... 127
Native.American.Stick.Game.................................. 130
�
CreditsProject Coordinator.Maria.Mastromatteo,.Western.Reserve.Public.Media
Teacher GuideDesign Team
Theresa.Boyle,.Crestwood.Local.School.DistrictAbby.Jurkovic,.Streetsboro.City.School.DistrictLori.Smith,.Springfield.Local.School.District.(Summit.Co.)Kristy.Welsh,.Canton.City.School.District
Teacher Guide Layout and Design.Paula.Kritz,.Western.Reserve.Public.Media
VideoProduced.by.Western.Reserve.Public.Media.(WNEO/WEAO,.Youngstown/Akron,.Ohio)
Executive Producer.Maria.Mastromatteo,.Western.Reserve.Public.Media
Producer.Duilio.Mariola,.Western.Reserve.Public.Media
Videographer.Duilio.Mariola,.Western.Reserve.Public.Media
Script.Larry.Chance,.Chance.Productions
WebLayout and Design.Paula.Kritz,.Western.Reserve.Public.Media
FundingThis.series.was.funded.by.the.Ohio.Legislature.through.the.eTech.Ohio.Commission.
••••
Experimental.vs..Theoretical.Probability:.The.Checkout.Game.................................................................................131
The.Checkout.Game................................................. 133
The.Checkout.Game:.Directions.............................. 134
Experimental.Probability.......................................... 135
Area.Model:.Possible.Sums.With.Two.Dice........... 136
The.Checkout.Game:.What.Did.You.Learn?.......... 137
Area.Models.or.Geometric.Probability......................... 138
Penny.Tossing.Fools?.Game.Board......................... 140
Penny.Tossing.Fools?.................................................141
Resources ........................................ 143Categorical.and.Measurement.Data.(Qualitative..and.Quantitative.Data)................................................... 145
Discrete.and.Continuous.Data....................................... 146
Excel.XP/2003................................................................ 147
Graphs.and.Plots:.Bar.Graphs....................................... 149
Graphs.and.Plots:.Box-and-Whisker.Plots......................151
Graphs.and.Plots:.Circle.Graphs.or.Pie.Charts............ 153
Graphs.and.Plots:.Histograms........................................ 154
Graphs.and.Plots:.Line.Plots........................................... 156
Graphs.and.Plots:.Scatter.Plots...................................... 157
Graphs.and.Plots:.Scatter.Points.................................... 159
Graphs.and.Plots:.Stem-and-Leaf.Plots.......................... 160
Graph.Paper.................................................................... 162
Selecting.a.Sample......................................................... 163
TI-84.Graphing.Calculator............................................. 164
Table.of.Random.Numbers............................................. 167
Vocabulary....................................................................... 168
Standards ........................................ 173Data.Standards............................................................... 175
�
QuizBus: Dealing with DataIntroduction
Videos
The TreatmentQuizBus:.Dealing with Data.is.patterned.loosely.after.the.TV.program.“Cash.Cab.”.The.actual.quiz.show.takes.place.in.a.school.bus..At.the.start.of.the.program,.the.bus.arrives.at.a.school.and.agents.exit.it.in.search.of.“contestants”.—.four.math.teachers..The.contestants.are.led.from.the.classroom.to.the.QuizBus,.which.has.an.on-camera.quiz.master.and.an.announcer/sidekick,.the.bus.driver..The.game.begins.on.the.bus,.where.the.quiz.show.host.asks.a.preliminary.question.or.poses.a.problem.that.each.of.the.four.contestants.tries.to.answer..
Round 1: In.this.round,.the.two.teams.who.answer.correctly.move.on.to.Round.2...
Round 2: The.two.remaining.teams.compete.in..a.head-to-head.question-and-answer.match..One.of.these.two.teams.will.be.eliminated,.leaving.a.final.contestant.to.answer.in.the.program.champion.round..
Champion Round: The.remaining.team.correctly.answers.a.championship.question.
The Content
Video 1This.package.includes.information.on.the.following:
The.dangers.of.acting.on.decisions.not.supported.by.evidence
The.basic.tenets.of.teaching.data.analysis
Graphs.and.how.to.interpret.them
Measures.of.center.and.spread.(mean,.median,.mode,.range,.etc.
Categorical.vs..measurement.data
Continuous.vs..discrete.data
.
Video 2The.following.types.of.plots.are.discussed:
Line.plot
Bar.graph
Histogram
Circle.plot.(pie.graph).
•
•
•
•
•
•
•
•
•
•
We.are.inundated.with.information:.about.our.health,.about.our.leisure.activities,.about.sports.and.so.much.more..Information.is.just.information..It.is.our.responsibility.to.process.that.information.and.to.use.it.wisely..That.is.one.of.the.reasons.we.study.data.analysis..We.need.to.not.only.evaluate.this.information,.but.also.to.base.personal.decisions.on.evidence.(data)..We.also.need.to.see.the.dangers.of.acting.on.decisions.that.are.not.supported.by.the.evidence..The.question.then.becomes,.“How.do.we.get.that.evidence?”.Of.course.the.answer.is.by.analyzing.the.data.that.we.are.using.to.make.those.decisions.
QuizBus: Dealing with Data.will.help.students.in.Grades.4-8.have.practice.with.collecting.data,.presenting.it.in.an.understandable.fashion,.analyzing.the.data.through.graphing,.identifying.ways.data.can.be.distorted.and.looking.at.both.arithmetic.and.geometric.probability.(area.models)..This.multimedia.package.contains.five.videos,.a.teacher.guide.and.a.Web.site,.http://www.WesternReservePublicMedia.org/quizbus..

�
Video 3The.following.types.of.plots.are.discussed:
Stem-and-leaf
Box-and-whisker
Scatter
Lines.of.best.fit
Video 4Students.use.experiments.and.surveys.to.determine.the.following:
What.question.they.want.answered
What.the.outcome.might.be
What.the.population.and.sample.are,.and.how.to.find.them..
What.the.process.is.for.gathering.data
What.plots.can.be.used.to.show.the.data
What.conclusions.can.be.drawn.from.the.plots
What.changes.could.be.made.if.they.did.this.project.again
How.to.present.their.data
.
Video 5Probability.lessons.are.covered.using.the.following:
Arithmetic
Geometry
The Teacher GuideThe.teacher.guide.is.divided.into.four.sections:.
Teacher pages give.complete.instructions.on.how.to.conduct.the.lessons..Each.lesson.is.keyed.to.Ohio.standards.in.mathematics..
Student handouts offer.easy.access.to.materials.that.can.help.the.students.complete.the.projects.
•
•
•
•
•
•
•
•
•
•
•
•
•
•
1.
2.
Resource pages can.be.used.by.either.teachers.or.students.to.get.more.information.on.a.topic.
Data standards are.listed.for.each.grade.level.and.include.the.corresponding.lessons.that.meet.each.indicator..
The Basic Tenets of Teaching Data AnalysisThe.lessons.in.the.teacher.guide.are.built.around.the.basic.concepts.listed.below.
Recognize.the.need.to.base.personal.decisions.on.evidence.(data)..
See.dangers.of.acting.on.decisions.that.are.not.supported.by.the.evidence.
Understand.that.tables.of.data.can.be.viewed.in.a.more.simple.or.readable.format.through.the.use.of.a.graph.
Become.aware.of.the.fact.that.graphs.can.be.misleading.if.data.is.not.accurately.portrayed.
Know.that.there.is.more.than.one.way.to.solve.a.problem.
It.is.important.to.use.real.(and.relevant).data..
Emphasis.should.be.on.good.examples.which.lead.to.intuition.
Project.work.is.important..Students.need.to.recognize.the.difficulty.in.asking.the.“right.question.”.
Variability.is.ubiquitous.(ever.present).
Always.use.appropriate.vocabulary.
Technology.can.be.used,.where.appropriate.
The QuizBus Web SiteThe.QuizBus.Web.site,.http://www.WesternReservePublicMedia.org/quizbus,.offers.the.project.videos.in.a.streaming.format..The.videos.can.also.be.downloaded..The.complete.teacher.guide.is.onthis.site,.as.well.as.other.games.and.activities.that.are.not.included.in.the.teacher.guide.
3.
4.
1.
2.
3.
4.
5.
6.
7.
8.
9.
10.
11.
http://www.WesternReservePublicMedia.org/quizbus
Video 1Introduction to Data Analysis

�
Labeling Graphs
ObjectiveStudents.will.be.able.to.correctly.label.a.graph.
Standards Addressed
Mathematics — Data Analysis
Grade 6
Statistical Methods, Benchmark G
06.. Make.logical.inferences.from.statistical.data.
ProcedureHave.each.student.work.with.a.partner.
Distribute.the.student.handout,.What’s.This.Graph.Telling.Me?
Tell.the.students.that.the.labels.were.left.off.these.graphs.and.they.need.to.use.the.information.given.to.finish.the.graph.
Have.the.students.write.a.few.sentences.to.tell.how.they.figured.out.which.bar.matched.the.color.
1.
2.
3.
4.
OverviewStudents.look.at.a.graph.
that.has.no.labels.for.the.axes..They.then.use.the.
information.given.to.write.the.labels.on.the.graph.
10
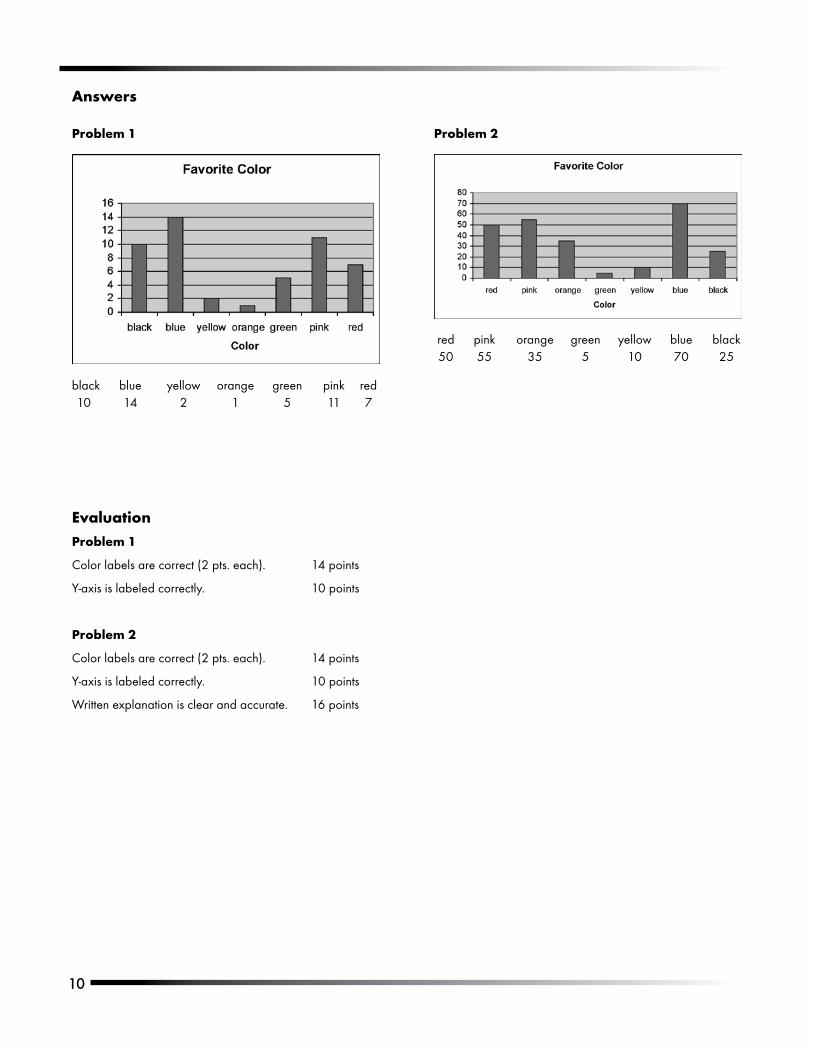
Answers
EvaluationProblem 1
Color.labels.are.correct.(2.pts..each)... 14.points
Y-axis.is.labeled.correctly.. . . 10.points
Problem 2
Color.labels.are.correct.(2.pts..each)... 14.points
Y-axis.is.labeled.correctly.. . . 10.points
Written.explanation.is.clear.and.accurate.. 16.points
Problem 1 Problem 2
.black. blue. yellow. orange. green. pink. red
.10. 14. 2. 1. 5. 11. 7
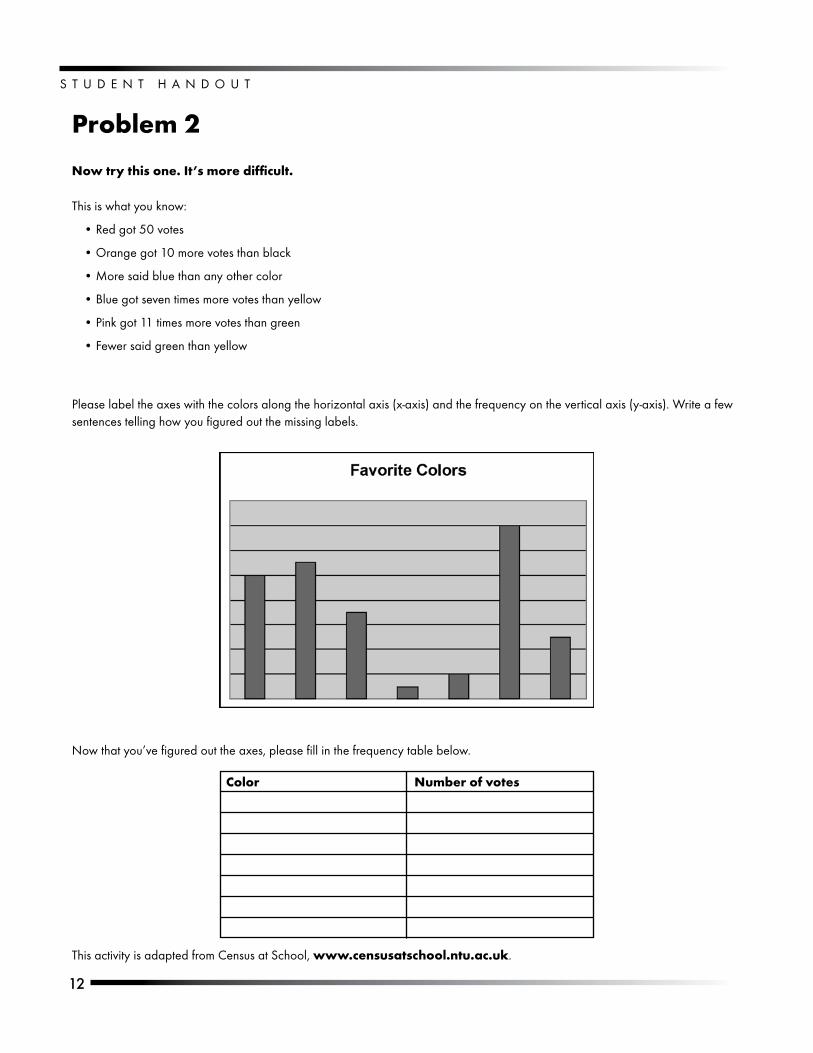
.red. pink. orange. green. yellow. blue. black
.50. 55. 35. 5. 10. 70. 25
11
S T U D E N T . H A N D O U T
Name._____________________________________
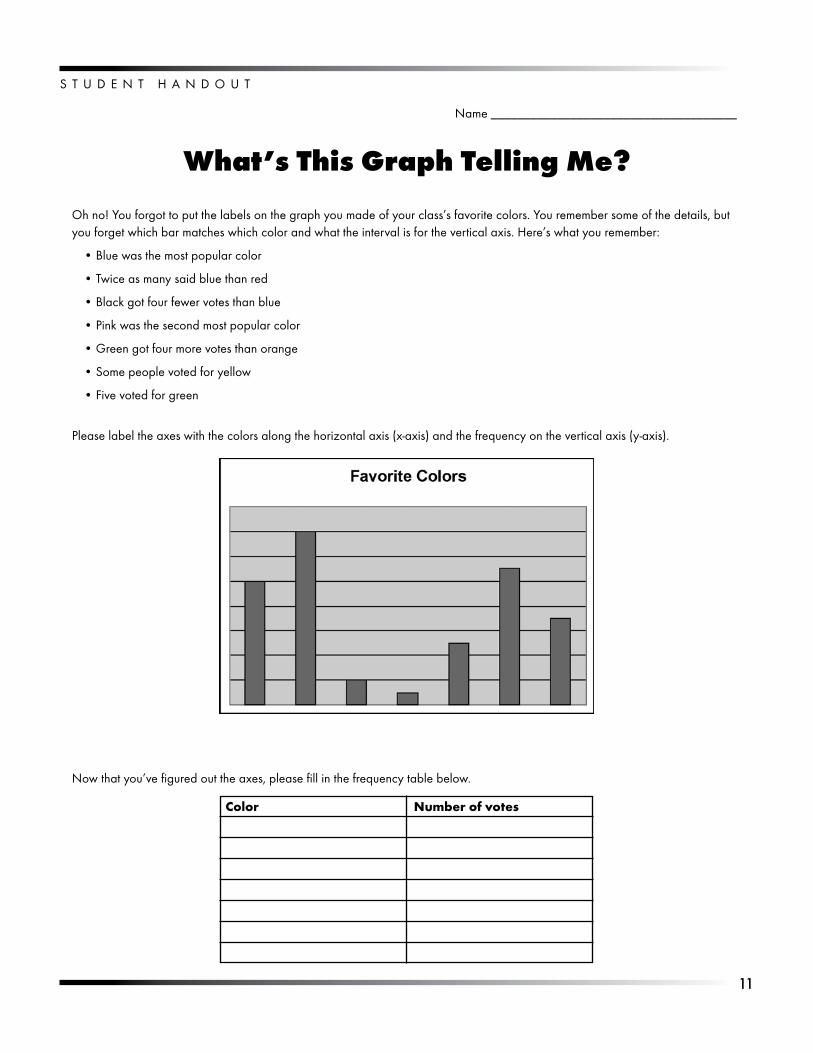
What’s This Graph Telling Me?
Oh.no!.You.forgot.to.put.the.labels.on.the.graph.you.made.of.your.class’s.favorite.colors..You.remember.some.of.the.details,.but.you.forget.which.bar.matches.which.color.and.what.the.interval.is.for.the.vertical.axis..Here’s.what.you.remember:
Blue.was.the.most.popular.color
Twice.as.many.said.blue.than.red
Black.got.four.fewer.votes.than.blue
Pink.was.the.second.most.popular.color
Green.got.four.more.votes.than.orange
Some.people.voted.for.yellow
Five.voted.for.green
Please.label.the.axes.with.the.colors.along.the.horizontal.axis.(x-axis).and.the.frequency.on.the.vertical.axis.(y-axis).
•
•
•
•
•
•
•
Now.that.you’ve.figured.out.the.axes,.please.fill.in.the.frequency.table.below.
Color Number of votes
S T U D E N T . H A N D O U T
12
Problem 2
Now try this one. It’s more difficult.
This.is.what.you.know:
Red.got.50.votes
Orange.got.10.more.votes.than.black
More.said.blue.than.any.other.color
Blue.got.seven.times.more.votes.than.yellow
Pink.got.11.times.more.votes.than.green
Fewer.said.green.than.yellow
Please.label.the.axes.with.the.colors.along.the.horizontal.axis.(x-axis).and.the.frequency.on.the.vertical.axis.(y-axis)..Write.a.few.sentences.telling.how.you.figured.out.the.missing.labels.
•
•
•
•
•
•
Now.that.you’ve.figured.out.the.axes,.please.fill.in.the.frequency.table.below.
Color Number of votes
This.activity.is.adapted.from.Census.at.School,.www.censusatschool.ntu.ac.uk..
1�
Interpreting Graphs Using CBR and Graphing
Calculator
OverviewUsing.graphing.
calculator.technology,.students.learn.about.
creating.and.interpreting.graphs..This.lesson.is.to.be.used.as.an.introduction.to.interpretation.of.graphs..
ObjectiveStudents.will.be.able.to.describe.an.appropriate.scenario.given.a.graph.or.choose.an.appropriate.graph.given.a.scenario.
Standards Addressed
Mathematics — Data Analysis
Grade 4
Data Collection, Benchmark B
02..Represent.and.interpret.data.using.tables,.bar.graphs,.line.plots.and.line.graphs..
05..Propose.and.explain.interpretations.and.predictions.based.on.data.displayed.in.tables,.charts.and.graphs..
Grade 5
Data Collection, Benchmark C
05..Modify.initial.conclusions,.propose.and.justify.new.interpretations.and.predictions.as.additional.data.are.collected..
Grade 8
Statistical Methods, Benchmark F
06.. Make.conjectures.about.possible.relationship.in.a.scatter.plot.and.approximate.line.of.best.fit.
09..Construct.convincing.arguments.based.on.analysis.of.data.and.interpretation.of.graphs..
MaterialsOverhead.projector
TI-83.or.TI-84.view.screen
TI-.83.or.TI-84.calculator
CBR.with.cords,.screen.or.blank.wall.to.project.on
•
•
•
•

1�
VocabularyCoordinate.plane.(quadrant.one)
X-coordinate,.y-coordinate
X-axis.(time)
Y-axis.(distance)
Origin
Independent.variable
Dependent.variable
Procedure Control.the.calculator.for.younger.groups..Have.older.students.do.the.projects.themselves..(Directions.for.the.calculator.are.included.as.a.separate.sheet)
Group.students.in.teams.of.four.or.five.
Introduce.students.to.the.CBR.(students.are.told.that.they.will.be.working.with.a.device.with.a.magic.eye).
Ask.for.a.volunteer.to.walk.down.a.hallway..Let.students.look.at.the.graph.created..Allow.for.another.volunteer.
Students.should.discuss.in.their.groups.what.they.think.is.being.measured..
What.two.variables.are.involved.in.the.graph?.Answer: Distance.in.feet.and.time.in.seconds..
What.is.happening.at.the.origin?.Answer: No.time.has.elapsed.and.no.distance.was.traveled.
Discuss.answers..Decide.appropriate.labels.to.figure.out.speed.—.ft./sec..or.mi./hr..or.in./min.?.(An.extension.of.the.lesson.could.address.an.additional.variable.discussion.of.conversion.between.units.)
Describe.situations.and.ask.students.to.model.them.by.walking.and.checking.their.path.on.the.calculator,.if.possible,.i.e..line.straight.across.(zero.slope),.downhill.(negative.slope),.uphill.positive.slope,.vertical.line.(undefined).
Show.a.match.graph.and.ask.groups.to.discuss.how.
•
•
•
•
•
•
•
1.
2.
3.
4.
5.
a.
b.
6.
7.
8.
they.think.they.should.walk.to.re-create.the.graph..Have.groups.write.down.their.plan..Call.on.students.to.walk.and.attempt.to.match.it..Discuss.the.graph.created,.revise.the.plan.and.try.again..Do.several.times.with.students.from.various.groups..
Discuss.distance.from.origin.at.start.of.graph,.speed.(rate.of.change.of.the.graph),.slope.of.the.line.and.what.is.occurring.when.slope.is.positive.or.negative..(For.younger.groups.you.may.want.to.omit.discussion.of.slope.)
Show.a.match.graph.and.devise.a.possible.scenario.to.go.with.it.(e..g.,.Bob.left.his.house.to.walk.to.his.friend’s.house..Halfway.there.he.stopped.to.talk.with.the.postman,.looked.and.saw.that.he.was.late.and.ran.the.rest.of.the.way.there.).Have.a.student.act.out.your.scenario.and.see.if.it.matches.the.graph..
Give.students.another.graph.and.ask.them.to.come.up.with.a.possible.scenario.in.their.groups..Have.various.groups.give.their.scenarios.and.then.act.them.out.to.see.if.they.match.the.graph.correctly.
Give.students.several.scenarios.and.ask.them.to.draw.an.appropriate.graph.in.their.groups..The.correctness.can.be.checked.by.acting.it.out.and.having.the.graph.drawn.
Give.students.“exit.tickets”.to.be.completed.individually.to.check.comprehension.
EvaluationUse.Interpreting.Graphs.Direction.Sheet.and.Exit.Ticket.student.handouts.
9.
10.
11.
12.
13.
1�
S T U D E N T . H A N D O U T
Name._____________________________________
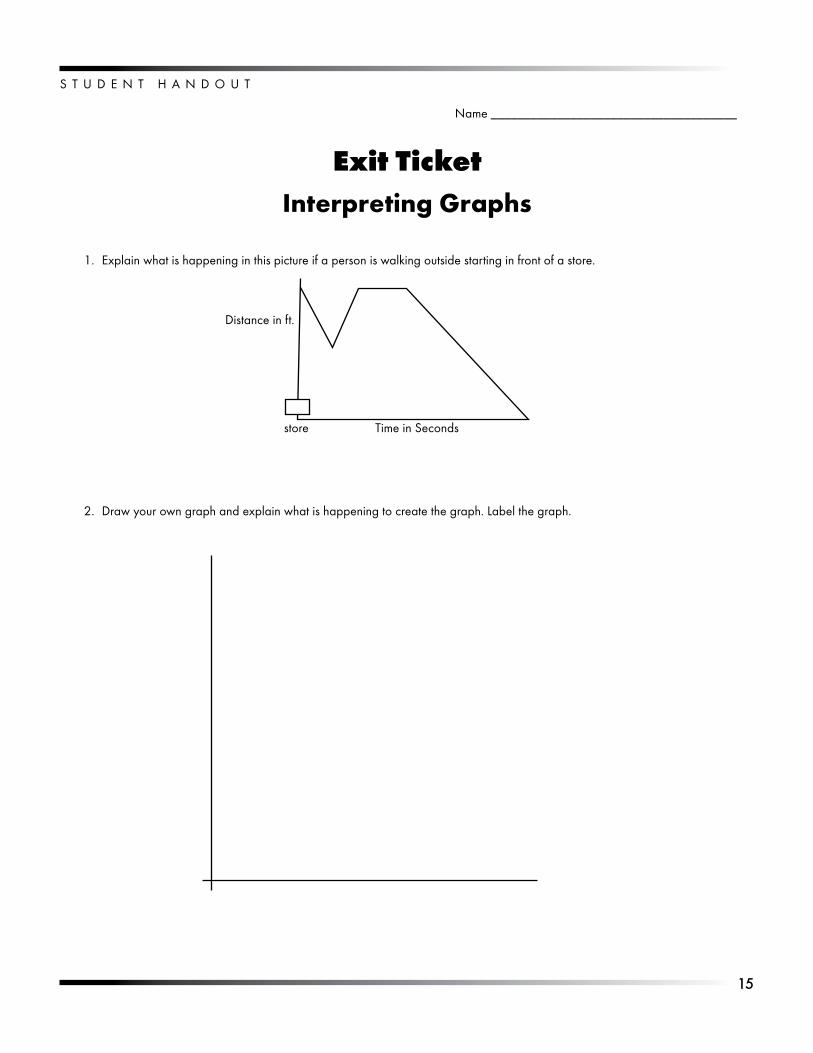
Exit TicketInterpreting Graphs
Explain.what.is.happening.in.this.picture.if.a.person.is.walking.outside.starting.in.front.of.a.store.1.
Draw.your.own.graph.and.explain.what.is.happening.to.create.the.graph..Label.the.graph.2.
Time.in.Secondsstore
Distance.in.ft.
S T U D E N T . H A N D O U T
1�
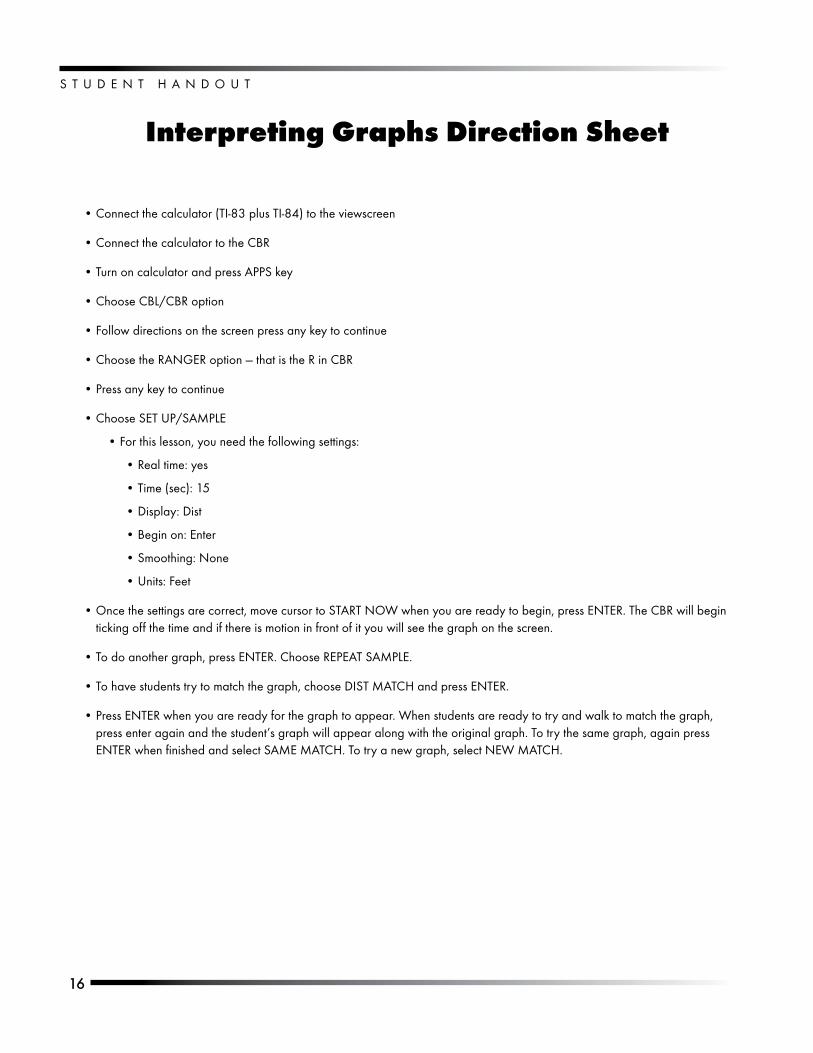
Interpreting Graphs Direction Sheet
Connect.the.calculator.(TI-83.plus.TI-84).to.the.viewscreen
Connect.the.calculator.to.the.CBR
Turn.on.calculator.and.press.APPS.key
Choose.CBL/CBR.option
Follow.directions.on.the.screen.press.any.key.to.continue
Choose.the.RANGER.option.—.that.is.the.R.in.CBR
Press.any.key.to.continue
Choose.SET.UP/SAMPLE
For.this.lesson,.you.need.the.following.settings:
Real.time:.yes
Time.(sec):.15
Display:.Dist
Begin.on:.Enter
Smoothing:.None
Units:.Feet
Once.the.settings.are.correct,.move.cursor.to.START.NOW.when.you.are.ready.to.begin,.press.ENTER..The.CBR.will.begin.ticking.off.the.time.and.if.there.is.motion.in.front.of.it.you.will.see.the.graph.on.the.screen.
To.do.another.graph,.press.ENTER..Choose.REPEAT.SAMPLE.
To.have.students.try.to.match.the.graph,.choose.DIST.MATCH.and.press.ENTER.
Press.ENTER.when.you.are.ready.for.the.graph.to.appear..When.students.are.ready.to.try.and.walk.to.match.the.graph,.press.enter.again.and.the.student’s.graph.will.appear.along.with.the.original.graph..To.try.the.same.graph,.again.press.ENTER.when.finished.and.select.SAME.MATCH..To.try.a.new.graph,.select.NEW.MATCH.
•
•
•
•
•
•
•
•
•
•
•
•
•
•
•
•
•
•
•
17
Misleading Graphs
OverviewStudents.look.at.real-life.
graphs.to.determine.why.they.are.misleading.
ObjectiveStudents.will.be.able.to.correct.a.graph.that.is.drawn.incorrectly.and.describe.why.it.is.incorrect.
Standards Addressed
Mathematics — Data Analysis
Grade 7
Statistical Methods, Benchmark G
06..Identify.misuses.of.statistical.data.in.articles,.advertisementsand.other.media.
ProcedureTalk.about.how.a.graph.helps.to.make.data.easy.to.understand.
Distribute.the.student.handouts..
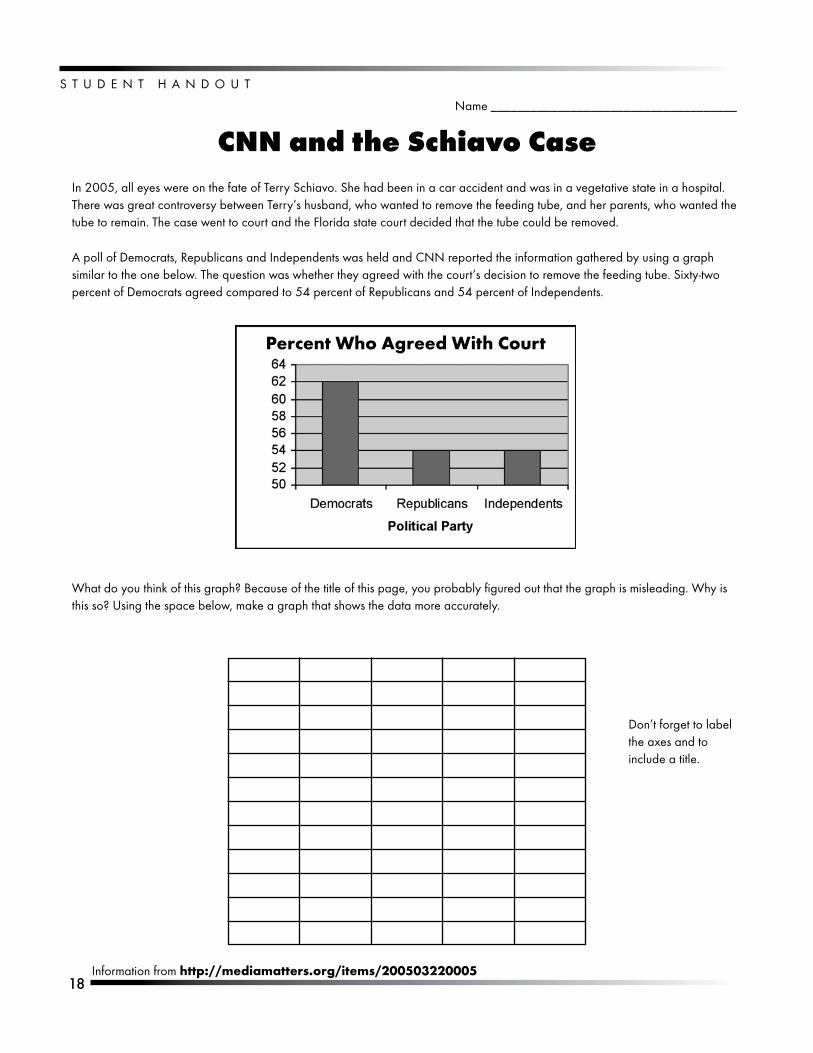
Review.the.handout.CNN.and.the.Schiavo.Case.with.the.students..Have.them.study.the.graph.and.discuss.why.it.is.misleading..
Answer:.The.vertical.axis.does.not.begin.with.zero,.so.the.difference.shown.leads.you.into.thinking.that.the.difference.is.great..
Ask.students.to.draw.the.graph.correctly..They.will.see.the.difference.when.they.make.the.graph.with.zero.as.the.origin.of.both.the.x.and.the.Y.axes.
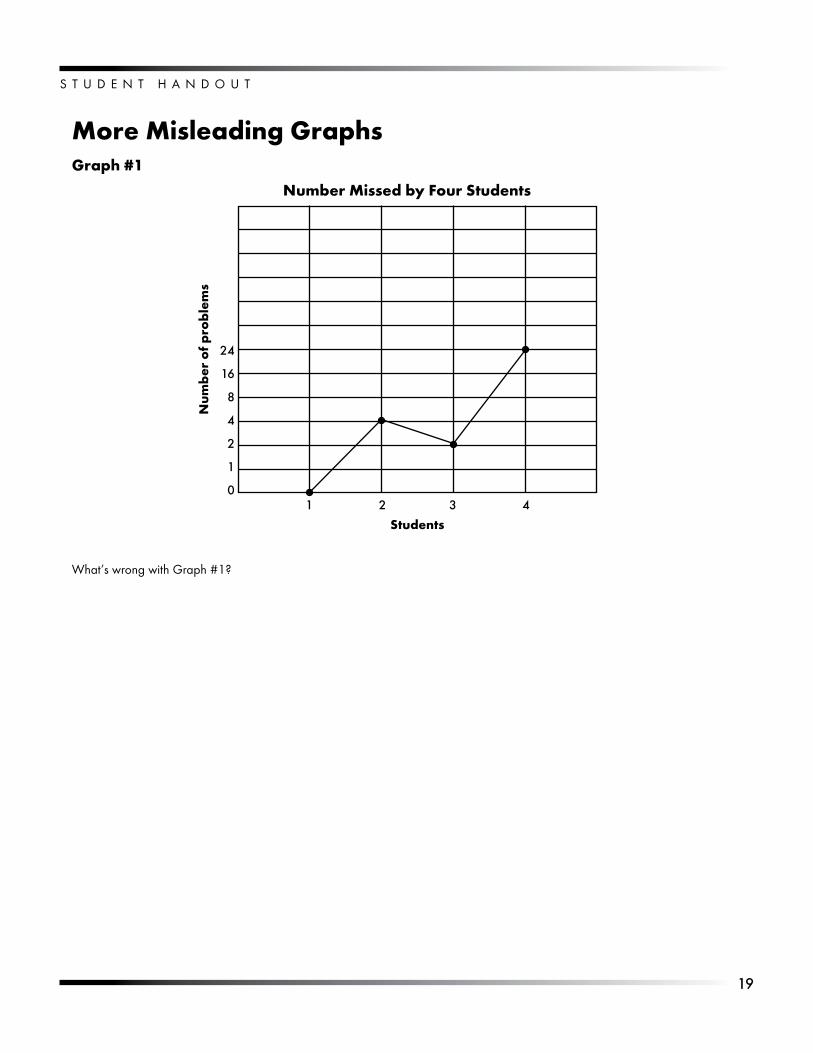
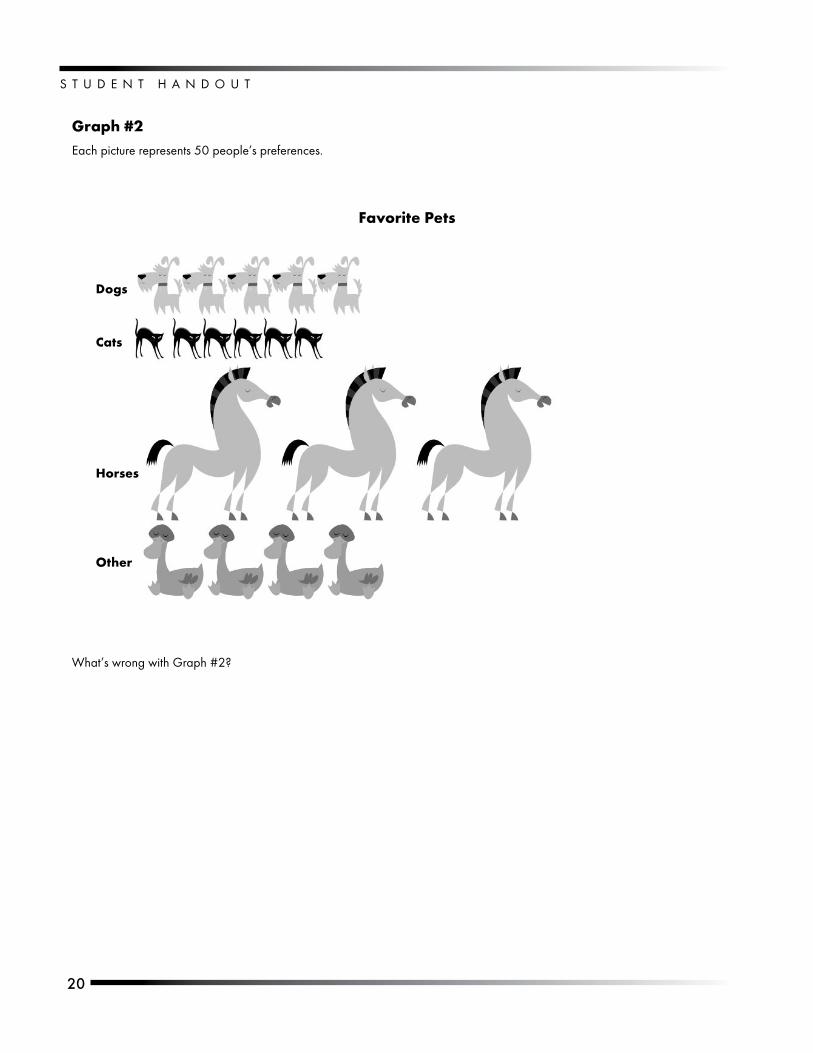
Have.students.look.at.the.following.graphs.and.write.a.sentence.or.two.as.to.why.they.are.misleading.
Answers: Graph.#1.—.The.x-axis.is.fine,.but.the.y-axis.has.inconsistent.intervals.
Graph.#2.—.The.pictures.in.the.graph.are.not.of.equal.size..It.looks.as.if.there.are.more.people.who.have.horses.as.pets.
EvaluationEvaluation.could.be.done.as.a.class.where.students.share.their.reasons.why.the.graphs.are.misleading,.or.points.could.be.given.if.answers.are.correct.
1.
2.
3.
4.
5.
S T U D E N T . H A N D O U T
18
Name._____________________________________
CNN and the Schiavo CaseIn.2005,.all.eyes.were.on.the.fate.of.Terry.Schiavo..She.had.been.in.a.car.accident.and.was.in.a.vegetative.state.in.a.hospital..There.was.great.controversy.between.Terry’s.husband,.who.wanted.to.remove.the.feeding.tube,.and.her.parents,.who.wanted.the.tube.to.remain..The.case.went.to.court.and.the.Florida.state.court.decided.that.the.tube.could.be.removed..
A.poll.of.Democrats,.Republicans.and.Independents.was.held.and.CNN.reported.the.information.gathered.by.using.a.graph.similar.to.the.one.below..The.question.was.whether.they.agreed.with.the.court’s.decision.to.remove.the.feeding.tube..Sixty-two.percent.of.Democrats.agreed.compared.to.54.percent.of.Republicans.and.54.percent.of.Independents.
What.do.you.think.of.this.graph?.Because.of.the.title.of.this.page,.you.probably.figured.out.that.the.graph.is.misleading..Why.is.this.so?.Using.the.space.below,.make.a.graph.that.shows.the.data.more.accurately.
Don’t.forget.to.label.the.axes.and.to.include.a.title.
Information.from.http://mediamatters.org/items/200503220005
Percent Who Agreed With Court
1�
S T U D E N T . H A N D O U T
More Misleading GraphsGraph #1
Number Missed by Four Students
What’s.wrong.with.Graph.#1?
2�
1�
8
�
2
1
0 1 2 � �
Students
Nu
mb
er o
f p
rob
lem
s
S T U D E N T . H A N D O U T
20
Graph #2 Each.picture.represents.50.people’s.preferences.
Favorite Pets
Dogs
Cats
Horses
Other
What’s.wrong.with.Graph.#2?
21
Mean, Median, Mode and Range
OverviewStudents.play.a.card.
game.to.determine.whether.mean,.median,.mode.or.range.will.give.them.the.highest.result.
ObjectiveStudents.will.be.able.to.estimate.and.compute.mean,.median,.mode.and.range.
Standards AddressedMathematics — Data Analysis and Probability
Grade 4
Statistical Methods. Benchmark E
07..Identify.the.median.of.a.set.of.data.and.describe.what.it.indicates.about.the.data.
08..Use.range,.median.and.mode.to.make.comparisons.among.related.sets.of.data.
Grade 5
Statistical Methods, Benchmark F
06..Determine.and.use.the.range,.mean,.median.and.mode,.and.explain.what.each.does.and.does.not.indicate.about.the.set.of.data.
Grade 6
Statistical Methods, Benchmark F
04.. Understand.the.different.information.provided.by.measures.of.center.(mean,.mode.and.median).and.measures.of.spread.(range).
Grade 7 (Enrichment Activity)
Data Collection, Benchmark A
01.. Read,.create.and.interpret.box-and-whisker.plots,.stem-and-leaf.plots.and.other.types.of.graphs,.when.appropriate.
Statistical Methods, Benchmark F
03.. .Analyze.a.set.of.data.by.using.and.comparing.combinations.of.measures.of.center.(mean,.mode,.median).and.measures.of.spread.(range,.quartile,.interquartile.range),.and.describe.how.the.inclusion.or.exclusion.of.outliers.affects.those.measures.
22
MaterialsOne.deck.of.cards.per.pair.students
ProcedureGive.each.pair.of.students.a.deck.of.cards..Ask.them.to.take.out.all.of.the.face.cards.so.that.they.will.only.keep.the.cards.ace.through.10.
Distribute.to.each.pair.of.students.the.handout.What’s.the.Deal:.Mean,.Median,.Mode.and.Range.
The.goal.of.the.game.is.to.get.the.highest.score.at.the.end.of.the.time.period.
Review.mean,.median,.mode.and.range.and.how.to.calculate.each.
Before.the.students.play,.ask.each.to.player.specify.which.measure.they.would.expect.to.have.the.highest.total.after.five.or.10.sets.of.numbers.have.been.drawn..
Have.each.pair.of.students.deal.out.seven.cards.and.list.the.numbers.that.are.dealt..Then.instruct.them.to.compute.the.mean,.median,.mode.and.range,.and.record.the.data.on.the.handout..
•
1.
2.
3.
4.
5.
6.
Students.could.repeat.the.exercise.as.man.as.10.times,.depending.on.how.much.class.time.you.have..The.students.need.to.shuffle.the.cards.each.time.before.redealing.them.
Have.the.students.exchange.papers.between.groups.to.check.the.accuracy.of.their.answers.
Any.student.who.selected.the.correct.column.as.being.the.highest.can.enter.his/her.score.to.see.who.the.classroom.winner.is.(the.person.with.the.highest.score).
Enrichment: Depending.upon.the.amount.of.time.available,.you.could.gather.classroom.data.from.each.group.for.each.item.and.make.box-and-whisker.plots.with.the.composite.data..Students.can.then.write.the.results.of.the.experiment.using.the.information.from.the.box-and-whisker.plot.
Students.can.write.about.why.range.will.often.give.them.the.highest.score.
Extension:.Have.students.complete.the.handout.Measures.of.Center.and.Spread.
7.
8.
9.
10.
11.
12.
Grade 8
Statistical Methods, Benchmark D
04..Compare.two.sets.of.data.using.measures.of.center.(mean,.mode,.median).and.measures.of.spread.(range,.quartiles,.interquartile.range,.percentiles)..
2�
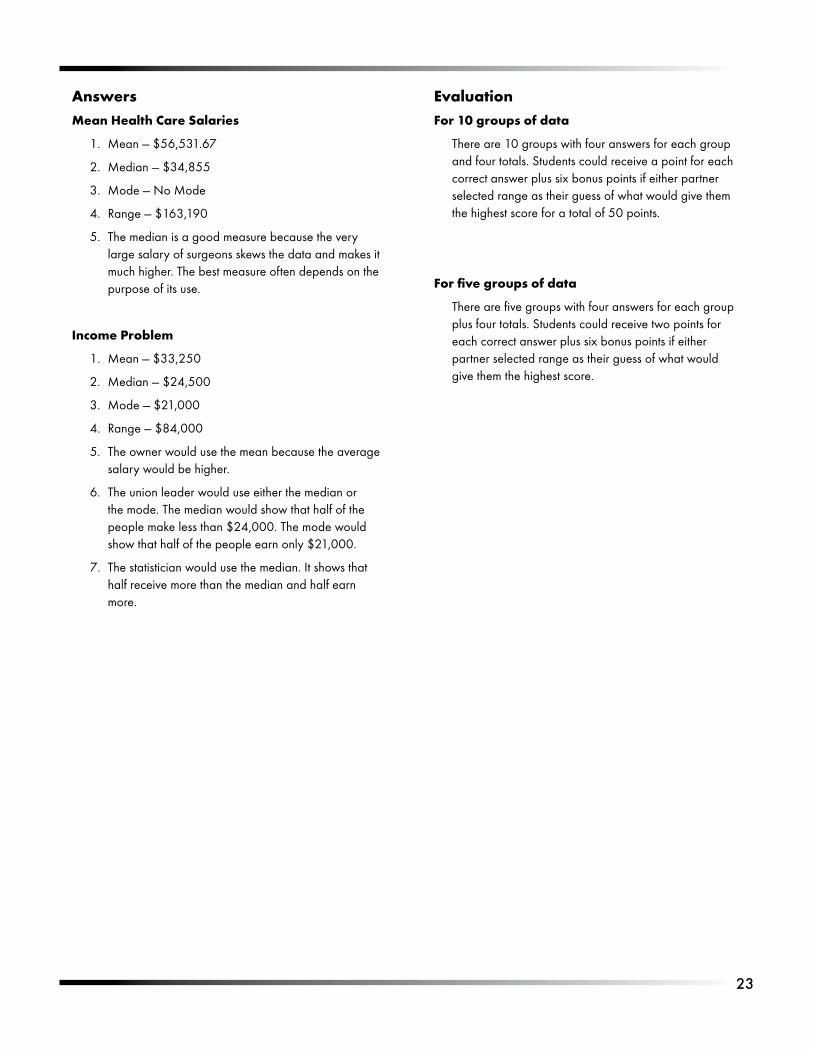
AnswersMean Health Care Salaries
Mean.—.$56,531.67
Median.—.$34,855
Mode.—.No.Mode
Range.—.$163,190
The.median.is.a.good.measure.because.the.very.large.salary.of.surgeons.skews.the.data.and.makes.it.much.higher..The.best.measure.often.depends.on.the.purpose.of.its.use.
Income Problem
Mean.—.$33,250
Median.—.$24,500
Mode.—.$21,000
Range.—.$84,000
The.owner.would.use.the.mean.because.the.average.salary.would.be.higher.
The.union.leader.would.use.either.the.median.or.the.mode..The.median.would.show.that.half.of.the.people.make.less.than.$24,000..The.mode.would.show.that.half.of.the.people.earn.only.$21,000.
The.statistician.would.use.the.median..It.shows.that.half.receive.more.than.the.median.and.half.earn.more..
1.
2.
3.
4.
5.
1.
2.
3.
4.
5.
6.
7.
EvaluationFor 10 groups of data
There.are.10.groups.with.four.answers.for.each.group.and.four.totals..Students.could.receive.a.point.for.each.correct.answer.plus.six.bonus.points.if.either.partner.selected.range.as.their.guess.of.what.would.give.them.the.highest.score.for.a.total.of.50.points.
For five groups of data
There.are.five.groups.with.four.answers.for.each.group.plus.four.totals..Students.could.receive.two.points.for.each.correct.answer.plus.six.bonus.points.if.either.partner.selected.range.as.their.guess.of.what.would.give.them.the.highest.score.
S T U D E N T . H A N D O U T
2�
Name._____________________________________
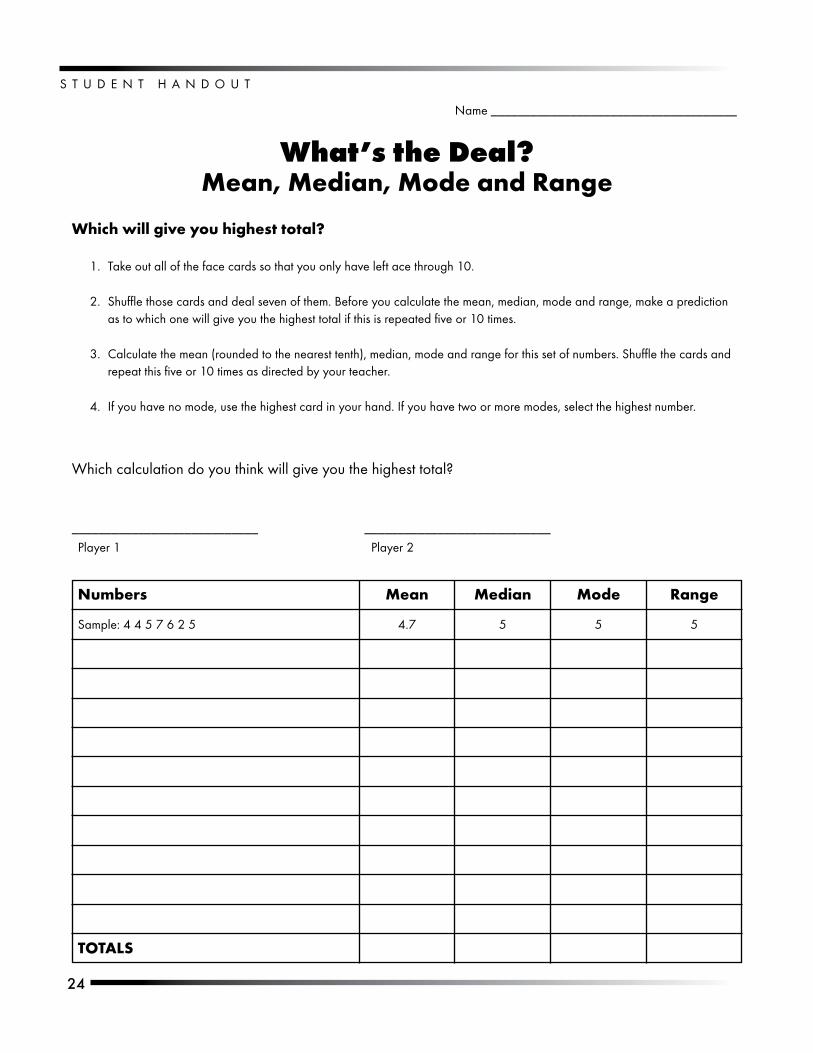
What’s the Deal?Mean, Median, Mode and Range
Which will give you highest total?
Take.out.all.of.the.face.cards.so.that.you.only.have.left.ace.through.10..
Shuffle.those.cards.and.deal.seven.of.them..Before.you.calculate.the.mean,.median,.mode.and.range,.make.a.prediction.as.to.which.one.will.give.you.the.highest.total.if.this.is.repeated.five.or.10.times.
Calculate.the.mean.(rounded.to.the.nearest.tenth),.median,.mode.and.range.for.this.set.of.numbers..Shuffle.the.cards.and.repeat.this.five.or.10.times.as.directed.by.your.teacher.
If.you.have.no.mode,.use.the.highest.card.in.your.hand..If.you.have.two.or.more.modes,.select.the.highest.number.
Which.calculation.do.you.think.will.give.you.the.highest.total?.
____________________________ . . ____________________________
Player.1. Player.2
1.
2.
3.
4.
Numbers Mean Median Mode Range
Sample:.4.4.5.7.6.2.5. 4.7. 5. 5. 5
TOTALS

2�
S T U D E N T . H A N D O U T
Name._____________________________________
Measures of Center and SpreadMeasures of Center
Mean.—.A.number.that.represents.the.middle.point,.or.average..It.is.the.quotient.obtained.by.dividing.the.sum.total.of.a.set.of.figures.by.the.number.of.figures.
Median.—.The.value.in.an.ordered.set.of.values.that.represents.the.point.of.which.there.are.as.many.instances.higher.as.there.are.lower.
Mode.—.The.most.frequent.value.of.a.set.of.data.
Measure of Dispersion (Spread)Range.—.The.difference.between.the.highest.and.the.lowest.numbers.in.a.set.of.data.
Try TheseMean.Health.Care.Salaries.(2006).http://www.bls.gov/oes/current/oes_nat.htm#b00-0000.
Surgeon $184,150
Home.Health.Aides 20,960
Nurses.Aides 22,960
Dental.Assistants 30,850
Physical.Therapists 41,410
Athletic.Trainers 38,860
Mean._______________________ . Mode.________________________. .
Median.______________________ . Range. _______________________.
Which.measure.best.describes.this.set.of.data.and.why?
S T U D E N T . H A N D O U T
2�
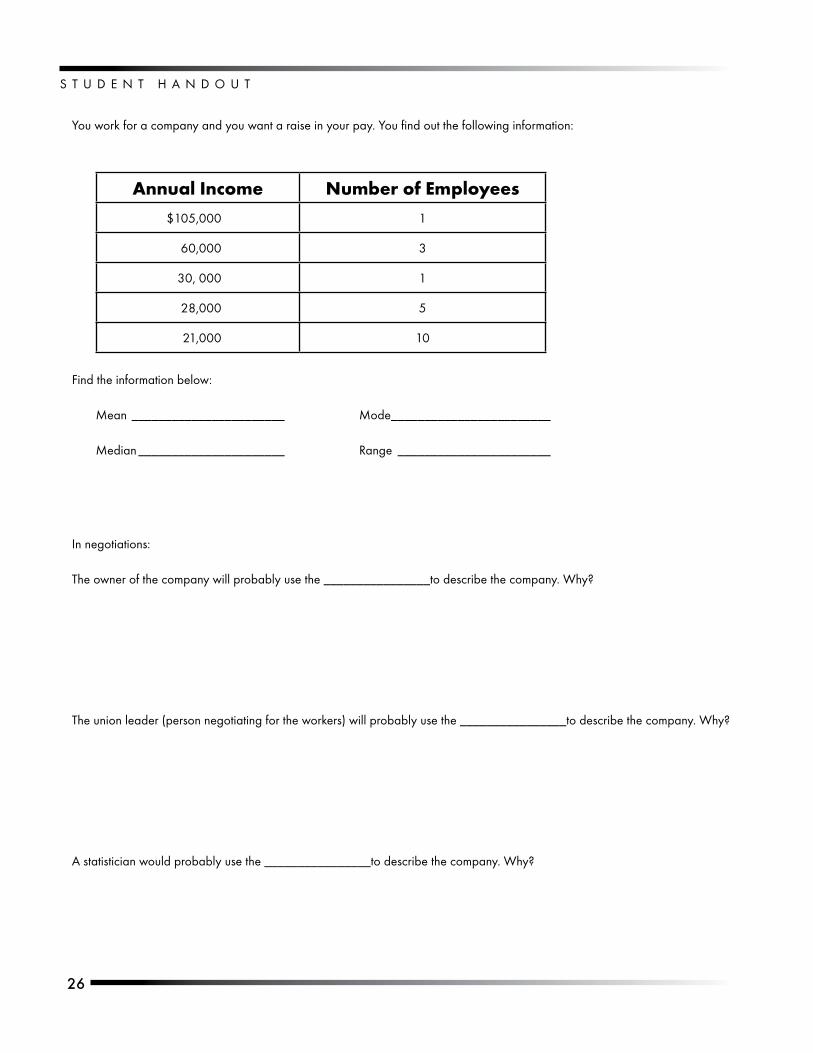
You.work.for.a.company.and.you.want.a.raise.in.your.pay..You.find.out.the.following.information:
Annual Income Number of Employees
$105,000 1
60,000 3
30,.000 1
28,000 5
21,000 10
Find.the.information.below:
Mean._______________________ . Mode.________________________. .
Median.______________________ . Range. _______________________.
In.negotiations:
The.owner.of.the.company.will.probably.use.the.________________to.describe.the.company..Why?
The.union.leader.(person.negotiating.for.the.workers).will.probably.use.the.________________to.describe.the.company..Why?
A.statistician.would.probably.use.the.________________to.describe.the.company..Why?
27
Types of DataCategorical vs. Measurement and Discrete vs. Continuous
OverviewStudents.work.
together.to.determine.if.various.types.of.data.
gathered.are.categorical.(qualitative).or.measurement.(quantitative).data..The.enrichment.activity.allows.students.to.determine.if.the.measurement.data.is.discrete.or.
continuous.
ObjectiveStudents.will.be.able.to.distinguish.between.categorical.and.measurement.data.
Standards AddressedMathematics — Data Analysis
Grade 5
Data Collection, Benchmark E
02. Select.and.use.a.graph.that.is.appropriate.for.the.type.of.data.to.be.displayed;.e.g.,.numerical.vs..categorical.data,.discrete.vs..continuous.data.
Grade 8
Data Collection, Benchmark B
03.. Differentiate.between.discrete.and.continuous.data.and.appropriate.ways.to.represent.each.
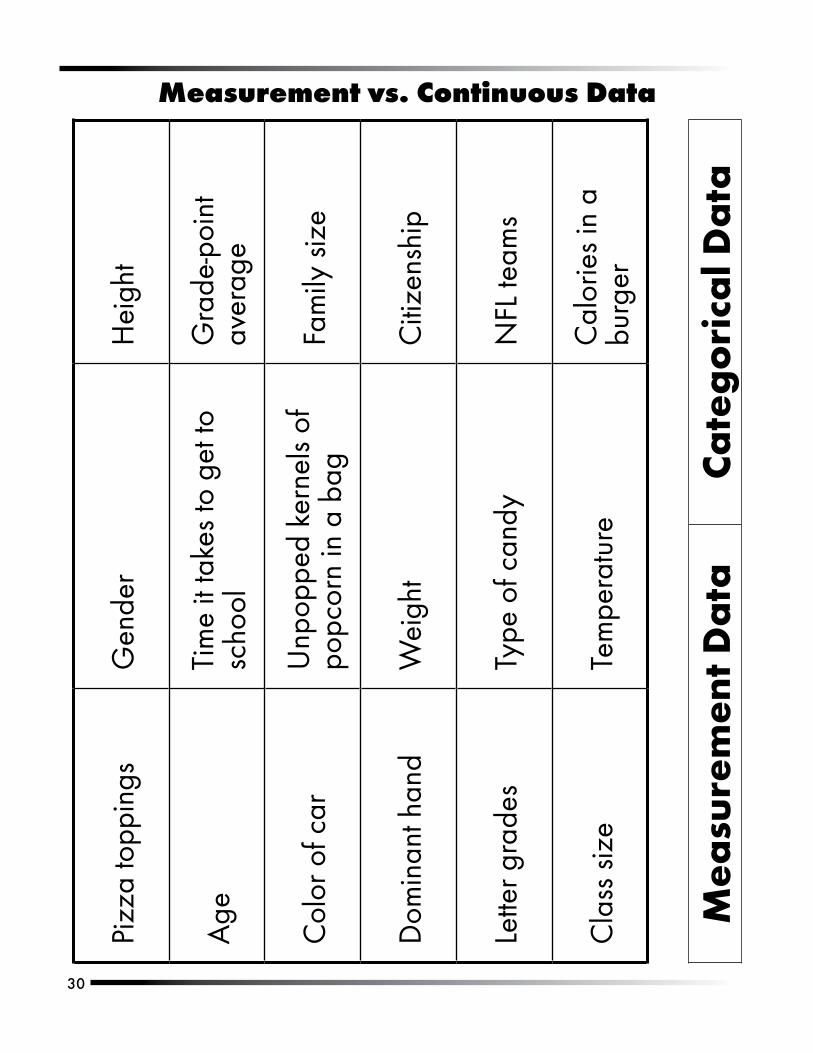
ProcedurePhotocopy.and.cut.out.the.labels.on.the.Measurement.vs..Continuous.Data.page..Divide.the.students.into.pairs.or.groups.and.give.each.group.an.envelope.that.contains.the.labels.
Have.a.class.discussion.of.the.difference.between.categorical.and.measurement.data..
Have.each.group.place.the.items.under.the.Measurement.Data.headings.or.Categorical.Data..Remind.them.that.measurement.data.or.amounts.of.categorical.data.can.be.put.on.a.number.line..
Discuss.answers..You.can.go.around.the.room.and.have.the.each.group.tell.you.where.they.put.the.data.and.then.get.some.class.consensus.to.each.item.
1.
2.
3.
4.
28
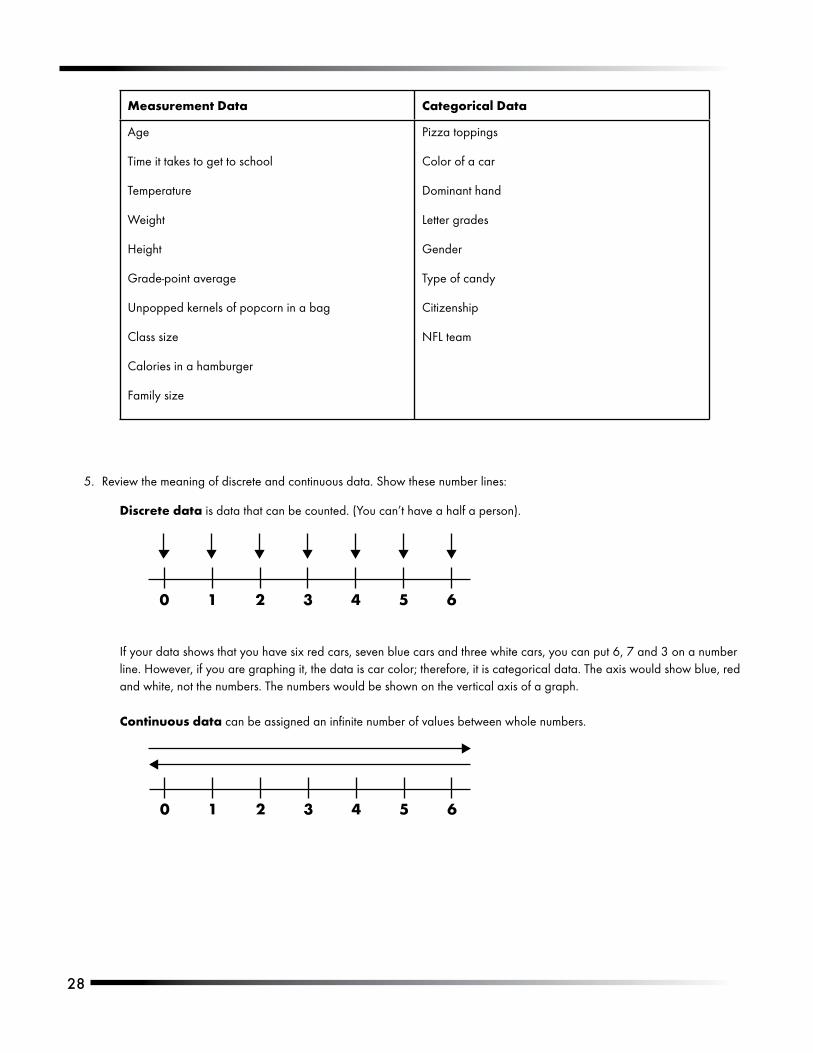
Measurement Data Categorical Data
Age
Time.it.takes.to.get.to.school
Temperature
Weight
Height
Grade-point.average
Unpopped.kernels.of.popcorn.in.a.bag
Class.size
Calories.in.a.hamburger
Family.size
Pizza.toppings
Color.of.a.car
Dominant.hand
Letter.grades
Gender
Type.of.candy
Citizenship
NFL.team
Review.the.meaning.of.discrete.and.continuous.data..Show.these.number.lines:
Discrete.data.is.data.that.can.be.counted..(You.can’t.have.a.half.a.person).
.
If.your.data.shows.that.you.have.six.red.cars,.seven.blue.cars.and.three.white.cars,.you.can.put.6,.7.and.3.on.a.number.line..However,.if.you.are.graphing.it,.the.data.is.car.color;.therefore,.it.is.categorical.data..The.axis.would.show.blue,.red.and.white,.not.the.numbers..The.numbers.would.be.shown.on.the.vertical.axis.of.a.graph.
Continuous data can.be.assigned.an.infinite.number.of.values.between.whole.numbers.
5.
0 1 2 3 4 5 6
0 1 2 3 4 5 6
2�
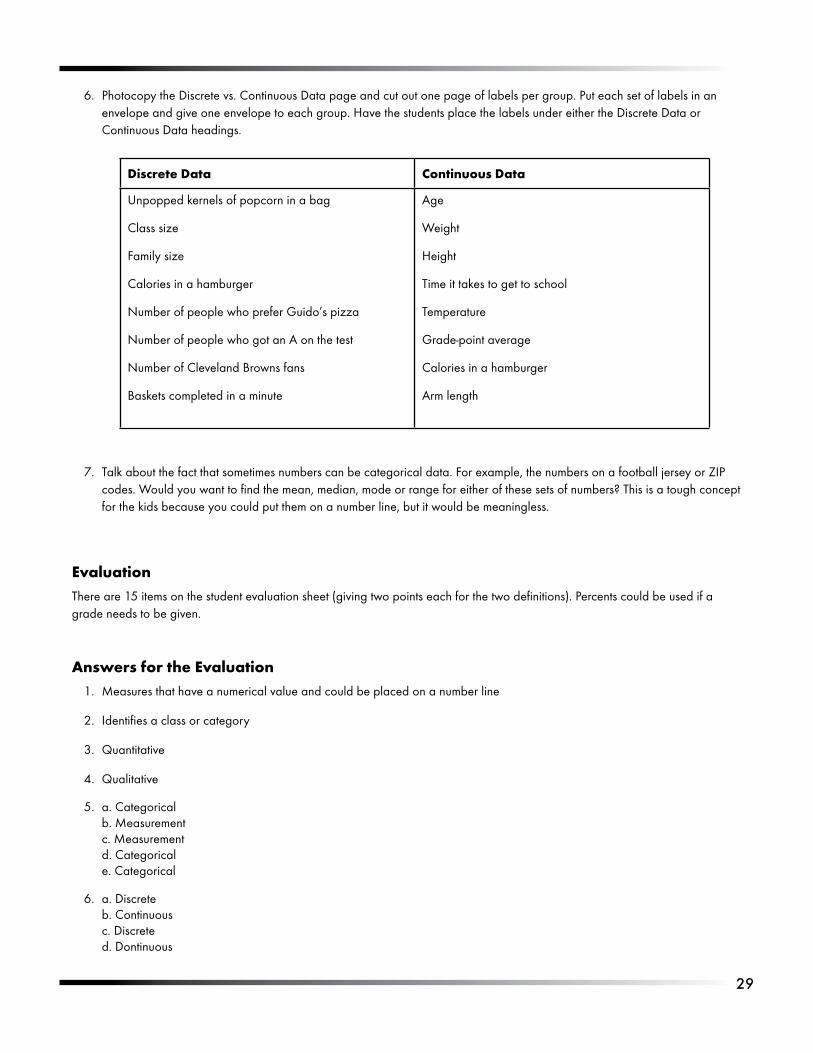
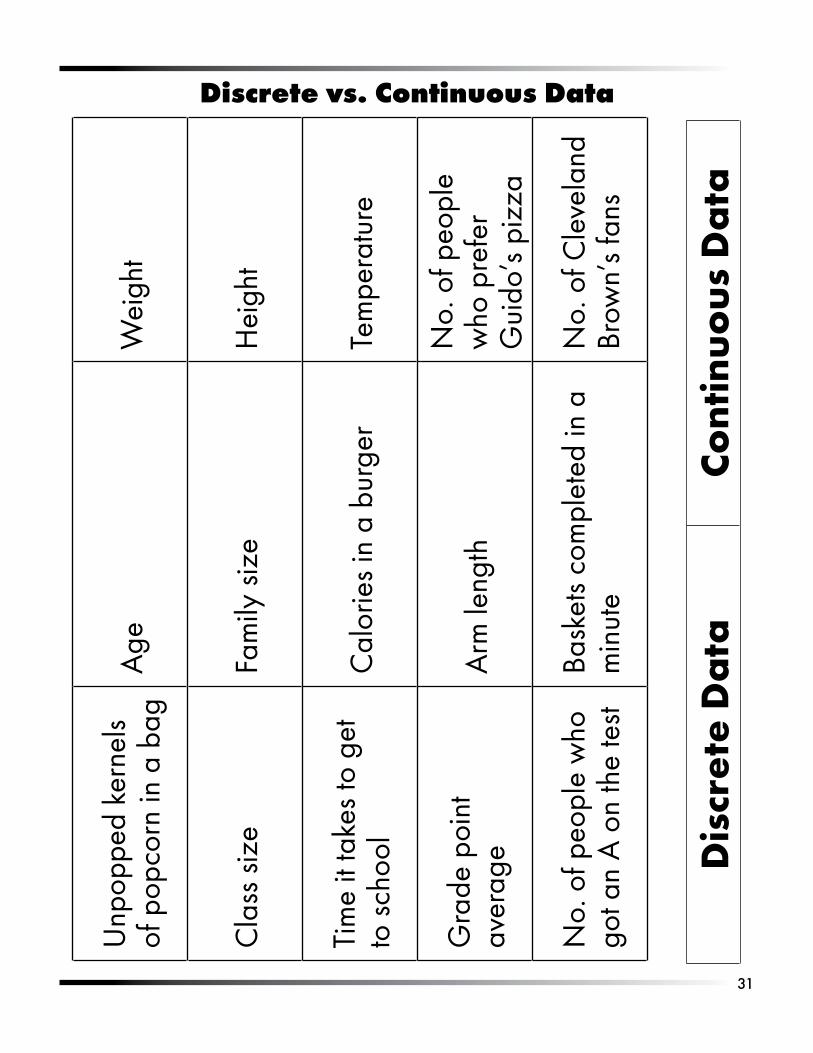
Photocopy.the.Discrete.vs..Continuous.Data.page.and.cut.out.one.page.of.labels.per.group..Put.each.set.of.labels.in.an.envelope.and.give.one.envelope.to.each.group..Have.the.students.place.the.labels.under.either.the.Discrete.Data.or.Continuous.Data.headings.
Discrete Data Continuous Data
Unpopped.kernels.of.popcorn.in.a.bag
Class.size
Family.size
Calories.in.a.hamburger
Number.of.people.who.prefer.Guido’s.pizza
Number.of.people.who.got.an.A.on.the.test
Number.of.Cleveland.Browns.fans
Baskets.completed.in.a.minute
Age
Weight
Height
Time.it.takes.to.get.to.school
Temperature
Grade-point.average
Calories.in.a.hamburger
Arm.length
Talk.about.the.fact.that.sometimes.numbers.can.be.categorical.data..For.example,.the.numbers.on.a.football.jersey.or.ZIP.codes..Would.you.want.to.find.the.mean,.median,.mode.or.range.for.either.of.these.sets.of.numbers?.This.is.a.tough.concept.for.the.kids.because.you.could.put.them.on.a.number.line,.but.it.would.be.meaningless.
EvaluationThere.are.15.items.on.the.student.evaluation.sheet.(giving.two.points.each.for.the.two.definitions)..Percents.could.be.used.if.a.grade.needs.to.be.given..
Answers for the EvaluationMeasures.that.have.a.numerical.value.and.could.be.placed.on.a.number.line
Identifies.a.class.or.category
Quantitative
Qualitative
a..Categoricalb..Measurementc..Measurementd..Categoricale..Categorical
a..Discreteb..Continuousc..Discreted..Dontinuous
6.
7.
1.
2.
3.
4.
5.
6.
�0
Pizz
a.to
ppin
gsG
ende
rH
eigh
t
Age
Tim
e.it.
take
s.to
.get
.to.
scho
olG
rade
-poi
nt.
aver
age
Col
or.o
f.car
Unp
oppe
d.ke
rnel
s.of
.po
pcor
n.in
.a.b
agFa
mily
.siz
e
Dom
inan
t.han
dW
eigh
tC
itize
nshi
p
Lette
r.gra
des
Type
.of.c
andy
NFL
.team
s
Cla
ss.s
ize
Tem
pera
ture
Cal
orie
s.in
.a.
burg
er
Mea
sure
men
t Da
taC
ate
go
rica
l Da
ta
Measurement vs. Continuous Data
�1
Unp
oppe
d.ke
rnel
s.of
.pop
corn
.in.a
.bag
Age
Wei
ght
Cla
ss.s
ize
Fam
ily.s
ize
Hei
ght
Tim
e.it.
take
s.to
.get
.to
.sch
ool
Cal
orie
s.in
.a.b
urge
rTe
mpe
ratu
re
Gra
de.p
oint
.av
erag
eA
rm.le
ngth
No.
.of.p
eopl
e.w
ho.p
refe
r.G
uido
’s.p
izza
No.
.of.p
eopl
e.w
ho.
got.a
n.A
.on.
the.
test
Bask
ets.
com
plet
ed.in
.a.
min
ute
No.
.of.C
leve
land
.Br
own’
s.fa
ns
Dis
cret
e D
ata
Co
ntin
uo
us
Da
ta
Discrete vs. Continuous Data
S T U D E N T . H A N D O U T
�2
Name._____________________________________
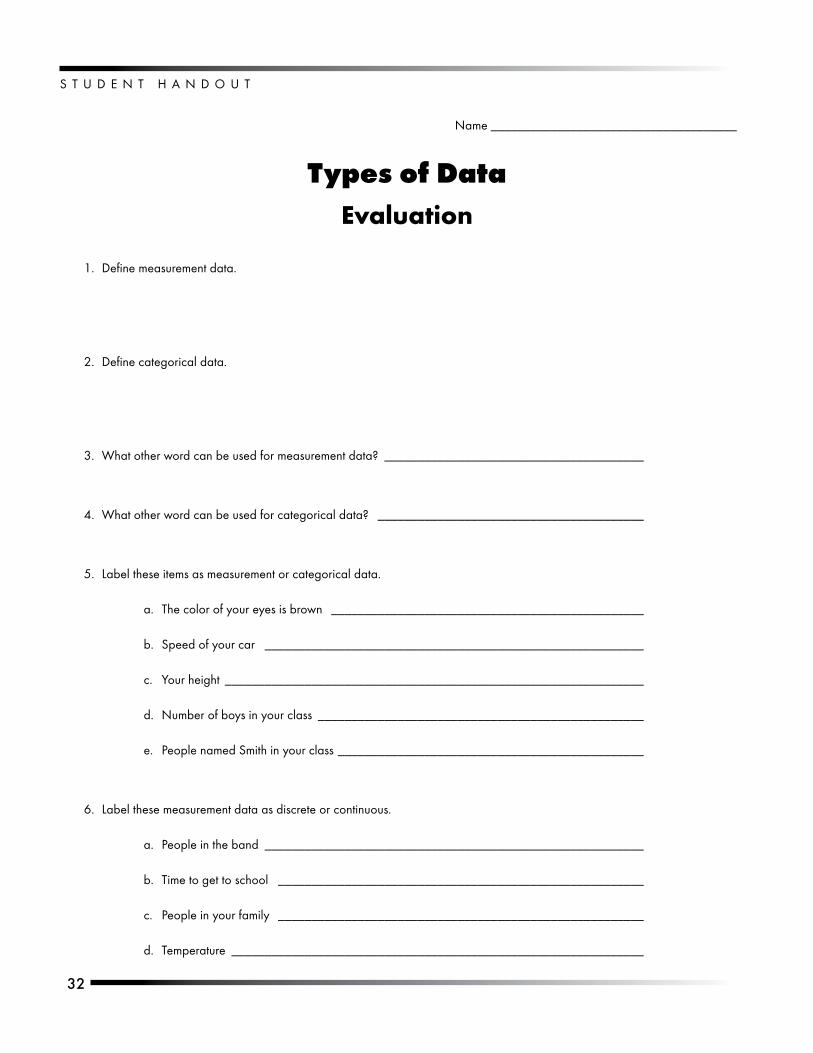
Types of DataEvaluation
Define.measurement.data.
Define.categorical.data.
What.other.word.can.be.used.for.measurement.data?. _______________________________________
What.other.word.can.be.used.for.categorical.data?.. ________________________________________
Label.these.items.as.measurement.or.categorical.data.
The.color.of.your.eyes.is.brown.. _______________________________________________
Speed.of.your.car.. _________________________________________________________
Your.height. _______________________________________________________________
Number.of.boys.in.your.class.._________________________________________________
People.named.Smith.in.your.class..______________________________________________
Label.these.measurement.data.as.discrete.or.continuous.
People.in.the.band.._________________________________________________________
Time.to.get.to.school.. _______________________________________________________
People.in.your.family.. _______________________________________________________
Temperature..______________________________________________________________
1.
2.
3.
4.
5.
a.
b.
c.
d.
e.
6.
a.
b.
c.
d.
http://www.WesternReservePublicMedia.org/quizbus
Video 2Line Plots, Bar Graphs,
Histograms and Circle Graphs

��
Wheel of FortuneLine PlotsOverview
Students.make.a.line.plot.of.letter.usage.using.
50.words.from.any.book..They.then.play.an.online.
Wheel.of.Fortune.game.using.what.they.have.learned..
ObjectiveStudents.will.understand.how.to.gather.and.interpret.data.and.then.construct.a.line.plot.
Standards AddressedMathematics — Data Analysis
Grade 5
Data Collection, Benchmark E
02.. Select.and.use.a.graph.that.is.appropriate.for.the.type.of.data.to.be.displayed.
04..Determine.appropriate.data.to.be.collected.to.answer.questions.posed.by.students.or.teacher,.collect.and.display.data,.and.clearly.communicate.findings.
Statistical Methods, Benchmark F
06.. Determine.and.use.range,.mean,.median.and.mode,.and.explain.what.each.does.and.does.not.indicate.about.the.set.of.data.
Grade 6
Data Collection, Benchmark A
01..Read,.construct.and.interpret.line.graphs,.circle.graphs.and.histograms.
Statistical Methods, Benchmark B
05.. .Describe.the.frequency.distribution.of.a.set.of.data,.as.shown.in.a.histogram.or.frequency.table,.by.general.appearance.of.shape:.e.g..number.of.modes,.middle.of.data,.level.of.symmetry,.outliers.
Data Collection, Benchmark E
02.. .Select,.create.and.use.graphical.representations.that.are.appropriate.for.the.type.of.data.collected.
Statistical Methods, Benchmark F
04.. Understand.the.different.information.provided.by.measures.of.center.(mean,.mode.and.media).and.measures.of.spread.(range)..
Statistical Methods, Benchmark G
06.. .Make.logical.inferences.from.statistical.data.
��
MaterialsAny.book.or.textbook
Computer.with.Internet.Access
ProcedureStudents.should.bring.a.book.to.class.or.use.their.textbooks.and.randomly.select.a.50-word.passage.
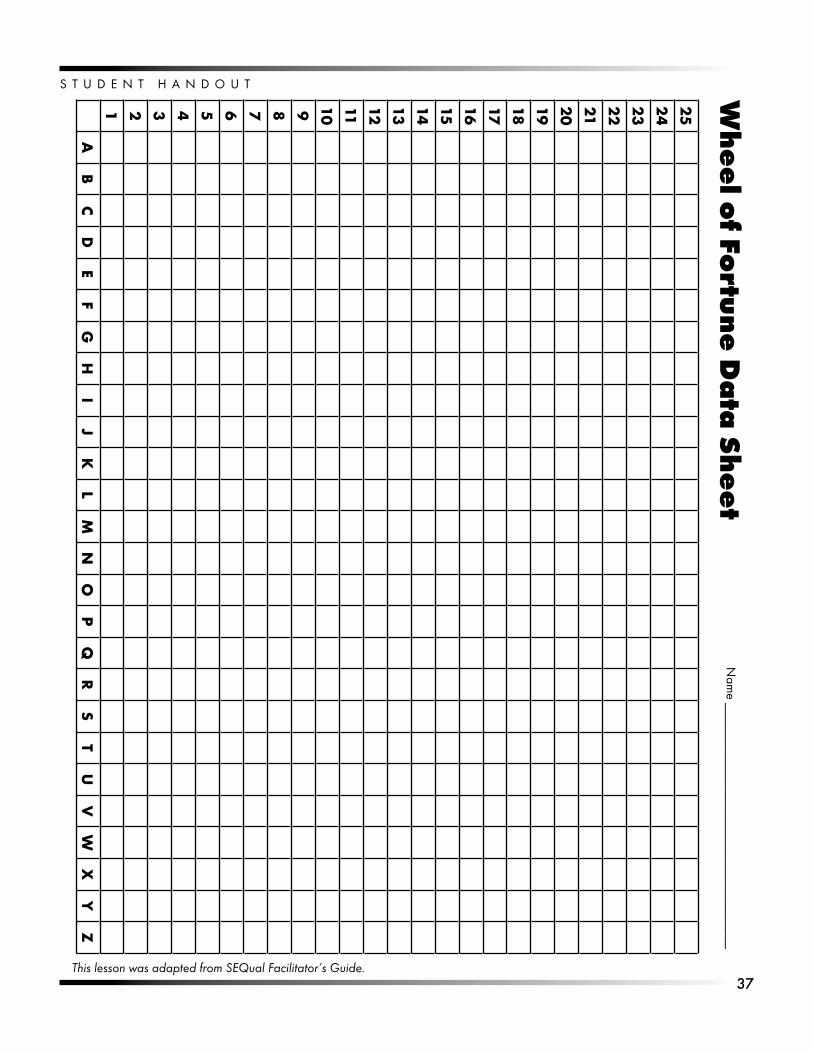
Using.the.Wheel.of.Fortune.Data.Sheet,.have.the.students.make.a.line.plot.of.the.letters.used.
Instruct.the.students.to.go.to.www.station.sony.com/casualproduct.vm?Id=041.and.play.Wheel.of.Fortune..They.should.use.only.the.most-common.letters.that.appear.on.their.data.sheets..(If.the.Sony.link.is.dead,.go.to.google.com.and.type.in.“Wheel.of.Fortune.”.There.are.many.sites.that.have.this.game.)
Collate.the.data.as.a.class..There.are.a.variety.of.ways.this.can.be.done..The.way.we.found.worked.the.best.was.to.have.a.series.of.papers,.each.labeled.with.one.of.the.letters..Put.the.papers.on.the.board.and.have.each.student.go.to.each.of.the.sheets.and.record.their.count.for.that.letter..Then.break.the.students.into.groups.and.give.them.the.sheets.to.find.the.mean.of.that.letter..Write.the.mean.in.large.letters.and.put.them.back.on.the.board..Students.can.then.go.around.and.fill.in.the.mean.on.their.data.sheet.
Allow.the.students.to.play.the.game.again.using.the.classroom.data.
As.a.class,.students.can.then.compare.the.results.of.the.game.when.their.personal.data.was.used.with.the.results.when.classroom.data.was.used.
Have.the.students.write.a.few.sentences.explaining.the.result.of.using.their.own.data.and.the.class.data.
•
•
1.
2.
3.
4.
5.
6.
7.
Extensions: A.second.class.can.perform.the.same.activity.and.the.results.can.be.compared.
Textbooks.in.various.subjects.can.be.used.to.see.if.the.same.distribution.is.true.for.math,.science,.social.studies.or.other.texts.
EvaluationThis.is.an.introductory.activity..Areas.to.note.are.the.correctness.of.the.plot.and.the.presence.of.a.title..The.sentences.should.tell.how.close.the.personal.data.was.to.the.class.data.and.if.it.made.a.difference.when.they.played.the.game.
This lesson was adapted from SEQual Facilitator’s Guide.
8.a.
b.
�7
S T U D E N T . H A N D O U T
This lesson was adapted from SEQual Facilitator’s Guide.
25
24
23
22212019181716151413121110987654321
AB
CD
EF
GH
IJ
KL
MN
OP
QR
ST
UV
WX
YZ
Wh
ee
l of Fo
rtun
e D
ata
Sh
ee
tN
ame._____________________________________
�8
Line PlotsOverviewA.line.plot.is.a.way.
to.organize.data.on.a.horizontal.number.line.to.
show.frequency..In.this.activity,.students.collect.data.to.create.
a.line.plot.representing.the.number.of.keys.carried.on.keychains..
ObjectiveStudents.will.be.able.to.gather.and.organize.data.and.then.construct.a.line.plot..
Standards AddressedMathematics — Data Analysis
Grade 5
Data Collection, Benchmark E
02.. Select.and.use.a.graph.that.is.appropriate.for.the.type.of.data.to.be.displayed.
04.. Determine.appropriate.data.to.be.collected.to.answer.questions.posed.by.students.or.teacher,.collect.and.display.data,.and.clearly.communicate.findings.
Statistical Methods, Benchmark F
06.. Determine.and.use.range,.mean,.median.and.mode,.and.explain.what.each.does.and.does.not.indicate.about.the.set.of.data.
Grade 6
Statistical Methods, Benchmark B
05.. Describe.the.frequency.distribution.of.a.set.of.data,.as.shown.in.a.histogram.or.frequency.table,.by.general.appearance.of.shape:.e.g..number.of.modes,.middle.of.data,.level.of.symmetry,.outliers.
Data Collection, Benchmark E
02.. Select,.create.and.use.graphical.representations.that.are.appropriate.for.the.type.of.data.collected.
Statistical Methods, Benchmark F
04.. Understand.the.different.information.provided.by.measures.of.center.(mean,.mode.and.media).and.measures.of.spread.(range).
Statistical Methods, Benchmark G
06.. Make.logical.inferences.from.statistical.data.
��
ProcedureHave.the.students.complete.the.How.Many.Keys?.handout.as.homework..
Instruct.them.to.construct.a.line.plot.showing.key.survey.data.on.the.horizontal.axis..Display.a.segment.of.line,.starting.with.the.lowest.or.minimum.value.and.ending.with.the.highest.or.maximum.value..They.may.want.to.go.one.below.the.minimum.and.one.above.the.maximum.on.their.number.line.
For.each.person.surveyed,.students.should.place.an.“x”.above.the.corresponding.key.value.on.the.horizontal.axis.
Have.them.continue.until.there.is.an.x.for.each.value.in.the.data.collected.
When.the.line.plot.is.complete,.the.number.of.x’s.above.each.value.indicates.the.frequency.that.this.key.count.appears.in.the.data.
Students.should.then.add.a.title.to.the.graph.
Encourage.the.class.to.find.and.discuss.patterns.in.the.data..Students.can.find.variability, clusters, gaps.and outliers.on.their.line.plots,.and.can.compare.their.plots.with.those.around.them.
Ask.the.students.to.find.the.mean,.median,.mode.and.range.of.the.data.
Class.discussion.should.include.students’.summaries.of.their.findings..They.can.refer.to.the.mean,.median,.mode.and.range.of.the.data.to.support.their.findings..Questions.might.include.the.following:
Who.had.the.highest.mean?.Median?.The.lowest?
Did.anyone.not.have.a.mode?.More.than.one.mode?
What.was.the.largest.range?.The.smallest?
Did.anyone.have.big.gaps.in.their.data?.Large.clusters.of.data?
(This.could.also.be.done.with.students.working.in.groups.instead.of.as.a.whole.class.).
1.
2.
3.
4.
5.
6.
7.
8.
9.
a.
b.
c.
d.
EvaluationEvaluate.line.plots.using.criteria.checklist
._______ . Title
._______ . .Correct.spelling
._______ . Neatness.(used.a.ruler)
._______ . Accurate.data.placement
._______ . Correct.calculation.of.mean,.median,.mode.and.range
S T U D E N T . H A N D O U T
�0
Name._____________________________________
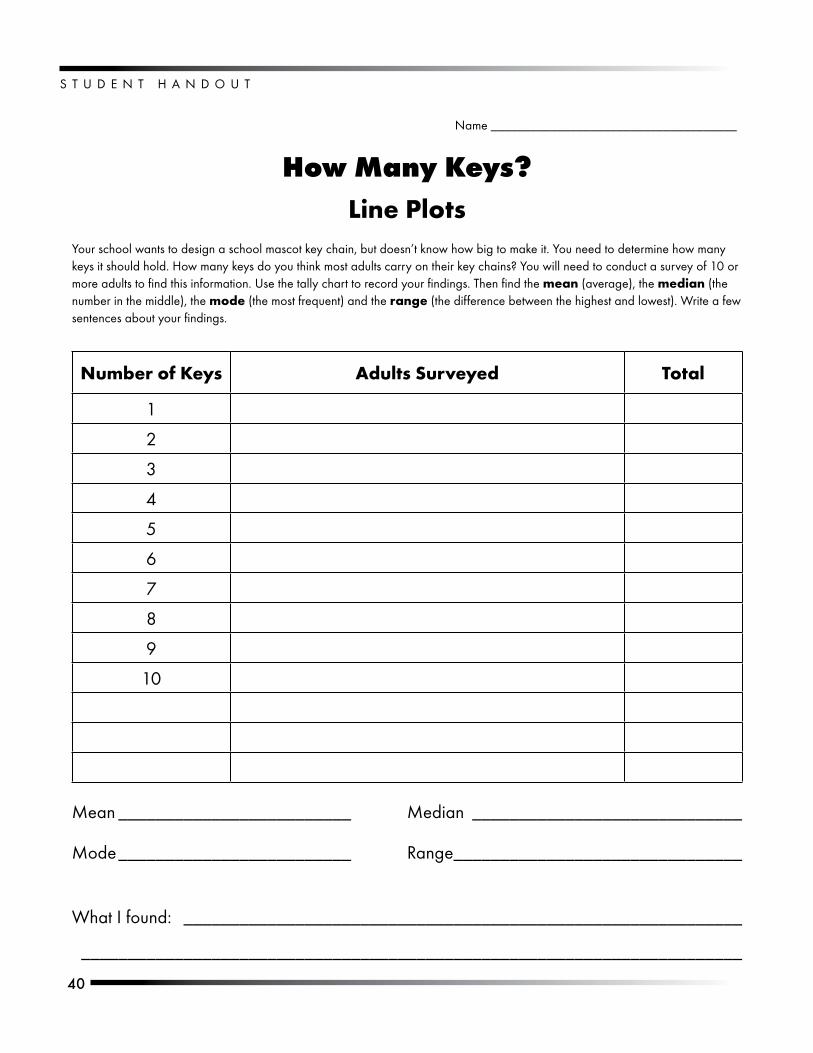
How Many Keys?Line Plots
Your.school.wants.to.design.a.school.mascot.key.chain,.but.doesn’t.know.how.big.to.make.it..You.need.to.determine.how.many.keys.it.should.hold..How.many.keys.do.you.think.most.adults.carry.on.their.key.chains?.You.will.need.to.conduct.a.survey.of.10.or.more.adults.to.find.this.information..Use.the.tally.chart.to.record.your.findings..Then.find.the mean.(average),.the.median.(the.number.in.the.middle),.the.mode.(the.most.frequent).and.the range.(the.difference.between.the.highest.and.lowest)..Write.a.few.sentences.about.your.findings.
Number of Keys Adults Surveyed Total
1
2
3
4
5
6
7
8
9
10
Mean._________________________ . Median. _____________________________
Mode._________________________ . Range._______________________________
What.I.found:.. ____________________________________________________________
._______________________________________________________________________
�1
Bar GraphsOverview
The.students.use.M&M.candies.to.make.a.variety.
of.graphs.using.the.same.data..The.lesson.focuses.on.the.need.and.value.of.graphing.techniques..
Objective
Students.will.be.able.to.make.a.variety.of.graphs.using.the.same.data..They.will.gain.an.understanding.of..how.organizing.the.data.makes.it.easier.to.analyze.
Standards AddressedMathematics — Data Analysis
Grade 5
Data Collection, Benchmark E
02.. Select.and.use.a.graph.that.is.appropriate.for.the.type.of.data.to.be.displayed.
04.. Determine.appropriate.data.to.be.collected.to.answer.questions.posed.by.students.or.teachers,.collect.and.display.data,.and.clearly.communicate.findings.
Grade 6
Data Collection, Benchmark D
03..Compare.representations.of.the.same.data.in.different.types.of.graphs.such.as.bar.graph.and.circle.graph.
Data Collection, Benchmark E
02.. Select,.create.and.use.graphical.representations.that.are.appropriate.for.the.type.of.data.collected.
Statistical Methods, Benchmark G
06.. Make.logical.inferences.from.statistical.data.
MaterialsSix.3-¼.oz.bags.of.M&Ms
Each.bag.should.be.emptied.into.six.clear.containers,.i.e..8-oz.plastic.cups,.sandwich.bags,.snack.bags,.plastic.bowls,.etc.
Poster-size.paper
Rulers
Colored.markers.
•
•
•
•
•
�2
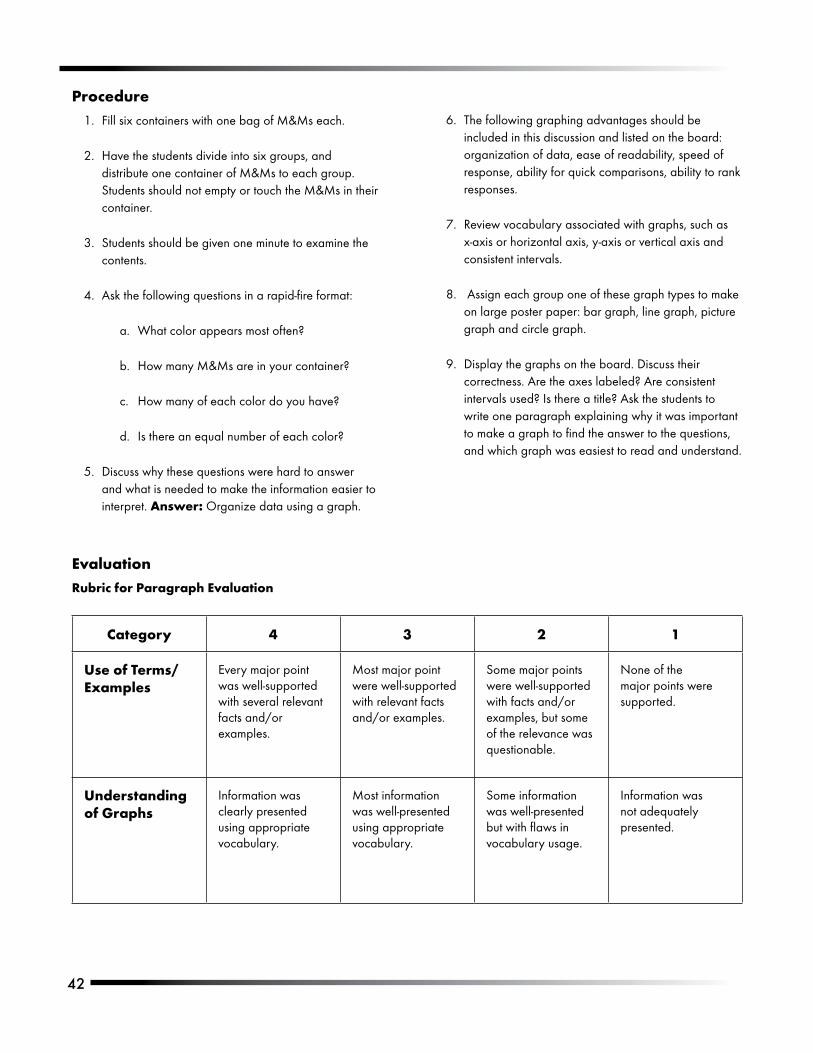
ProcedureFill.six.containers.with.one.bag.of.M&Ms.each..
Have.the.students.divide.into.six.groups,.and.distribute.one.container.of.M&Ms.to.each.group..Students.should.not.empty.or.touch.the.M&Ms.in.their.container.
Students.should.be.given.one.minute.to.examine.the.contents.
Ask.the.following.questions.in.a.rapid-fire.format:.
What.color.appears.most.often?
How.many.M&Ms.are.in.your.container?
How.many.of.each.color.do.you.have?
Is.there.an.equal.number.of.each.color?
Discuss.why.these.questions.were.hard.to.answer.and.what.is.needed.to.make.the.information.easier.to.interpret..Answer: Organize.data.using.a.graph..
1.
2.
3.
4.
a.
b.
c.
d.
5.
The.following.graphing.advantages.should.be.included.in.this.discussion.and.listed.on.the.board:.organization.of.data,.ease.of.readability,.speed.of.response,.ability.for.quick.comparisons,.ability.to.rank.responses.
Review.vocabulary.associated.with.graphs,.such.as.x-axis.or.horizontal.axis,.y-axis.or.vertical.axis.and.consistent.intervals.
.Assign.each.group.one.of.these.graph.types.to.make.on.large.poster.paper:.bar.graph,.line.graph,.picture.graph.and.circle.graph.
Display.the.graphs.on.the.board..Discuss.their.correctness..Are.the.axes.labeled?.Are.consistent.intervals.used?.Is.there.a.title?.Ask.the.students.to.write.one.paragraph.explaining.why.it.was.important.to.make.a.graph.to.find.the.answer.to.the.questions,.and.which.graph.was.easiest.to.read.and.understand.
6.
7.
8.
9.
EvaluationRubric for Paragraph Evaluation
Category 4 3 2 1
Use of Terms/Examples
Every.major.point.was.well-supported.with.several.relevant.facts.and/or.examples.
Most.major.point.were.well-supported.with.relevant.facts.and/or.examples.
Some.major.points.were.well-supported.with.facts.and/or.examples,.but.some.of.the.relevance.was.questionable.
None.of.the.major.points.were.supported.
Understanding of Graphs
Information.was.clearly.presented.using.appropriate.vocabulary.
Most.information.was.well-presented.using.appropriate.vocabulary.
Some.information.was.well-presented.but.with.flaws.in.vocabulary.usage.
Information.was.not.adequately.presented.
��
Grades: Making a Histogram
OverviewStudents.make.a.
histogram.using.data.from.a.class.test.
ObjectiveStudents.will.be.able.to.create.and.interpret.a.histogram.
Standards AddressedMathematics — Data Analysis
Grade 6
Data Collection, Benchmark A
01.. Read,.construct.and.interpret.line.graphs,.circle.graphs.and.histograms.
Statistical Methods, Benchmark B
05.. Describe.the.frequency.distribution.of.a.set.of.data,.as.shown.in.a.histogram.or.frequency.table,.by.general.appearance.or.shape;.e.g.,.number.of.modes,.middle.of.data,.level.of.symmetry,.outliers.
Data Collection, Benchmark E
02.. Select,.create.and.use.graphical.representations.that.are.appropriate.for.the.type.of.data.collected.
Grade 7
Data Collection, Benchmark E
02.. Analyze.how.decisions.about.graphing.affect.the.graphical.representation;.e.g.,.scale,.size.of.classes.in.a.histogram,.number.of.categories.in.a.circle.graph.
Data Collection, Benchmark G
02.. Analyze.how.decisions.about.graphing.affect.the.graphical.representation;.e.g.,.scale,.size.of.classes.in.a.histogram,.number.of.categories.in.a.circle.graph.
MaterialsGraph.paper
Protractor
Compass
•
•
•
��
ProcedureReview.different.types.of.graphs:.line.plot,.circle.or.pie.graphs,.bar.graphs.and.histograms.
Remind.the.students.that.a.histogram.shows.an.interval.of.values.while.a.bar.graph.shows.a.single.value.or.item.
Have.the.scores.of.a.test.that.was.given.to.the.class.written.on.the.board.for.the.students.to.copy.or.have.them.written.horizontally.on.a.handout.to.distribute.to.the.class.
Tell.the.students.that.they.are.to.organize.this.data.using.a.circle.graph.and.a.histogram..Do.not.tell.them.what.the.intervals.for.the.data.should.be..(Most.students.will.use.tens,.e.g.,.100-90,.89-80,.etc..Some.will.use.fives.).
1.
2.
3.
4.
Remind.the.students.to.label.the.histogram’s.axes,.create.a.title.and.label.the.parts.of.the.pie.chart.or.make.a.legend.
After.these.charts.have.been.created,.put.some.on.the.board.or.use.an.overhead.to.show.the.graphs..Compare.the.graphs.that.have.different.intervals.and.ask.the.class.to.determine.which.is.easiest.to.read,.which.represents.the.data.in.the.clearest.manner,.etc.
If.the.students.need.more.practice,.histograms.can.be.created.using.student.heights,.time.it.takes.to.get.to.school,.hours.spent.playing.video.games.or.watching.television.
5.
6.
7.
Evaluation
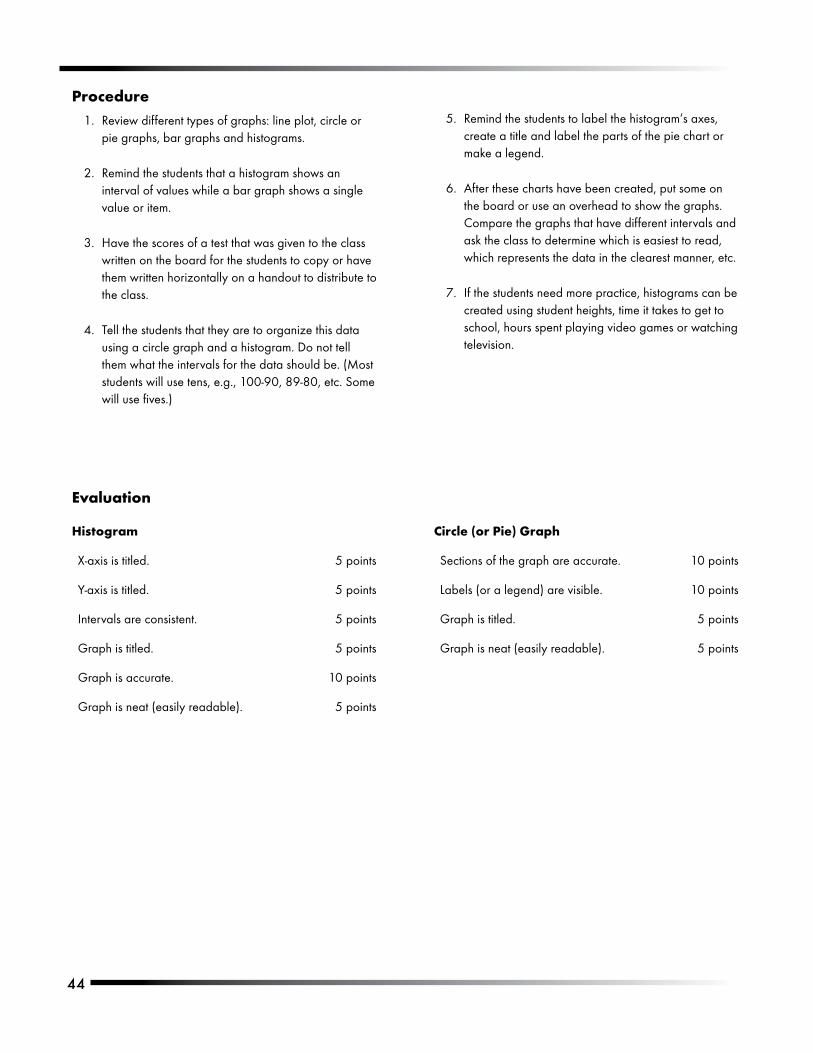
Histogram
X-axis.is.titled.. 5.points
Y-axis.is.titled.. 5.points
Intervals.are.consistent.. 5.points
Graph.is.titled.. 5.points
Graph.is.accurate.. 10.points
Graph.is.neat.(easily.readable).. 5.points
Circle (or Pie) Graph
Sections.of.the.graph.are.accurate.. 10.points
Labels.(or.a.legend).are.visible.. 10.points
Graph.is.titled.. 5.points
Graph.is.neat.(easily.readable).. 5.points
��
Zodiac Circle Graphs
Overview Students.manually.
create.a.frequency.chart.and.circle.graph.using.
the.zodiac.signs.of.their.classmates.
ObjectiveStudents.will.be.able.to.accurately.calculate.fractions,.percentages.and.central.angles;.measure.and.construct.angles.using.a.protractor;.and.construct.a.circle.graph.by.hand.
Standards AddressedMathematics — Data Analysis
Grade 5
Data Collection, Benchmark A
01.. Read,.construct.and.interpret.frequency.tables,.circle.graphs.and.line.graphs.
Grade 6
Data Collection, Benchmark A
01.. Read,.construct.and.interpret.line.graphs,.circle.graphs.and.histograms.
Statistical Methods, Benchmark B
05.. Describe.the.frequency.distribution.of.a.set.of.data,.as.shown.in.a.histogram.or.frequency.table,.by.general.appearance.or.shape;.e.g.,.number.of.modes,.middle.of.data,.level.of.symmetry,.outliers.
Data Collection, Benchmark E
02.. Analyze.how.decisions.about.graphing.affect.the.graphical.representation;.e.g.,.scale,.size.of.classes.in.a.histogram,.number.of.categories.in.a.circle.graph..
Grade 7
Data Collection, Benchmark E
02.. Analyze.how.decisions.about.graphing.affect.the.graphical.representation;.e.g..scale,.size.of.classes.in.a.histogram,.number.of.categories.in.a.circle.graph.
MaterialsProtractors
Calculators
Compasses
Overheads.or.pictures.of.circle.graphs.from.magazines,.newspapers,.etc.
Zodiac.table
•
•
•
•
•
��
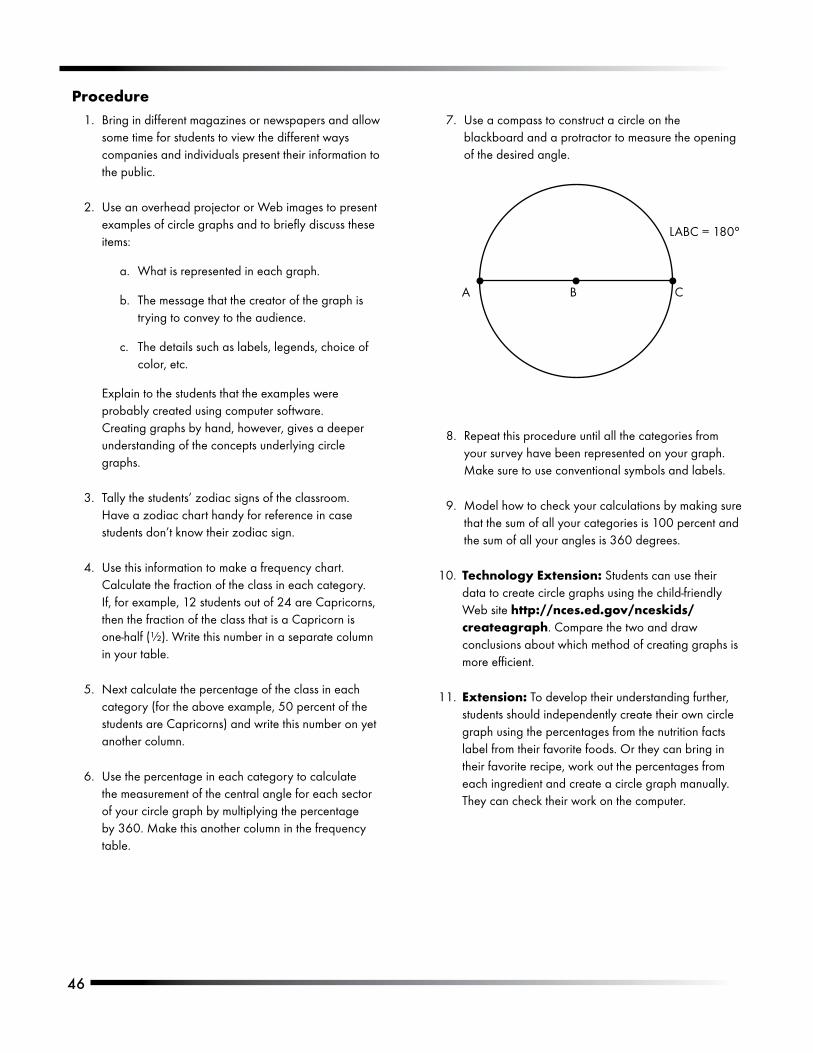
ProcedureUse.a.compass.to.construct.a.circle.on.the.blackboard.and.a.protractor.to.measure.the.opening.of.the.desired.angle..
7.
A B C
LABC.=.180°
Bring.in.different.magazines.or.newspapers.and.allow.some.time.for.students.to.view.the.different.ways.companies.and.individuals.present.their.information.to.the.public.
Use.an.overhead.projector.or.Web.images.to.present.examples.of.circle.graphs.and.to.briefly.discuss.these.items:
What.is.represented.in.each.graph.
The.message.that.the.creator.of.the.graph.is.trying.to.convey.to.the.audience.
The.details.such.as.labels,.legends,.choice.of.color,.etc..
Explain.to.the.students.that.the.examples.were.probably.created.using.computer.software..Creating.graphs.by.hand,.however,.gives.a.deeper.understanding.of.the.concepts.underlying.circle.graphs.
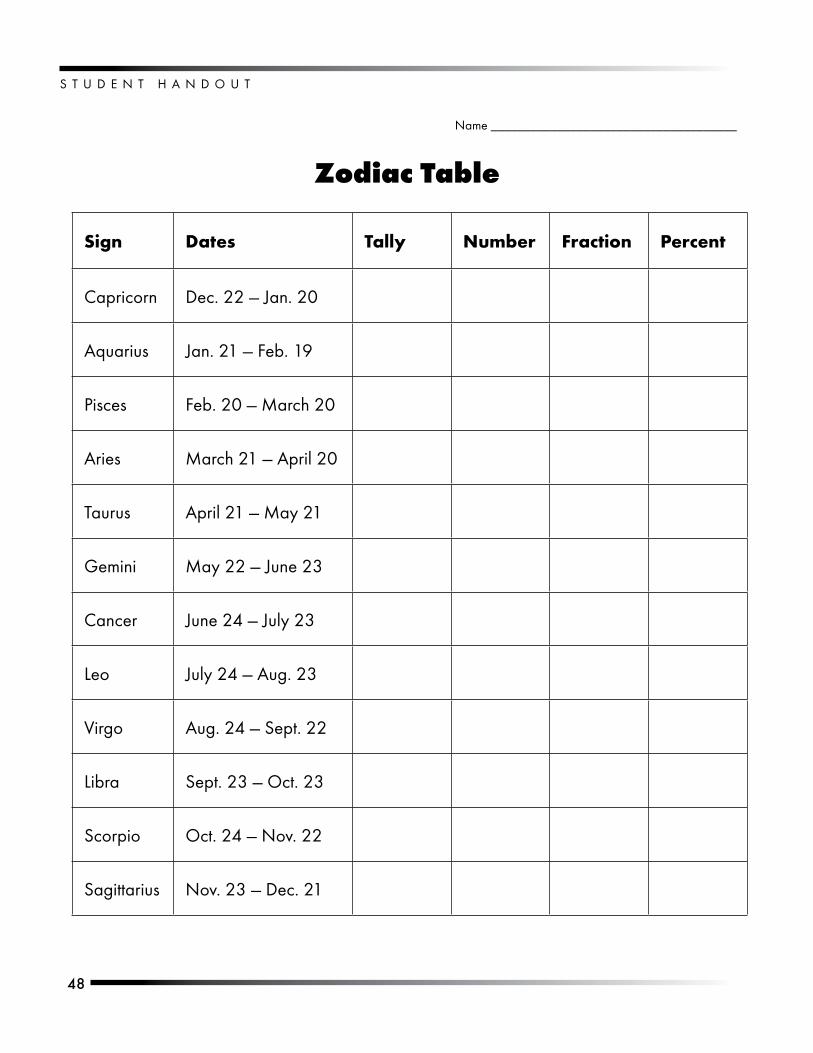
Tally.the.students’.zodiac.signs.of.the.classroom..Have.a.zodiac.chart.handy.for.reference.in.case.students.don’t.know.their.zodiac.sign..
Use.this.information.to.make.a.frequency.chart..Calculate.the.fraction.of.the.class.in.each.category..If,.for.example,.12.students.out.of.24.are.Capricorns,.then.the.fraction.of.the.class.that.is.a.Capricorn.is.one-half.(½)..Write.this.number.in.a.separate.column.in.your.table.
Next.calculate.the.percentage.of.the.class.in.each.category.(for.the.above.example,.50.percent.of.the.students.are.Capricorns).and.write.this.number.on.yet.another.column.
Use.the.percentage.in.each.category.to.calculate.the.measurement.of.the.central.angle.for.each.sector.of.your.circle.graph.by.multiplying.the.percentage.by.360..Make.this.another.column.in.the.frequency.table.
1.
2.
a.
b.
c.
3.
4.
5.
6.
Repeat.this.procedure.until.all.the.categories.from.your.survey.have.been.represented.on.your.graph..Make.sure.to.use.conventional.symbols.and.labels..
Model.how.to.check.your.calculations.by.making.sure.that.the.sum.of.all.your.categories.is.100.percent.and.the.sum.of.all.your.angles.is.360.degrees.
Technology Extension:.Students.can.use.their.data.to.create.circle.graphs.using.the.child-friendly.Web.site.http://nces.ed.gov/nceskids/createagraph..Compare.the.two.and.draw.conclusions.about.which.method.of.creating.graphs.is.more.efficient.
Extension: To.develop.their.understanding.further,.students.should.independently.create.their.own.circle.graph.using.the.percentages.from.the.nutrition.facts.label.from.their.favorite.foods..Or.they.can.bring.in.their.favorite.recipe,.work.out.the.percentages.from.each.ingredient.and.create.a.circle.graph.manually..They.can.check.their.work.on.the.computer..
8.
9.
10.
11.
�7
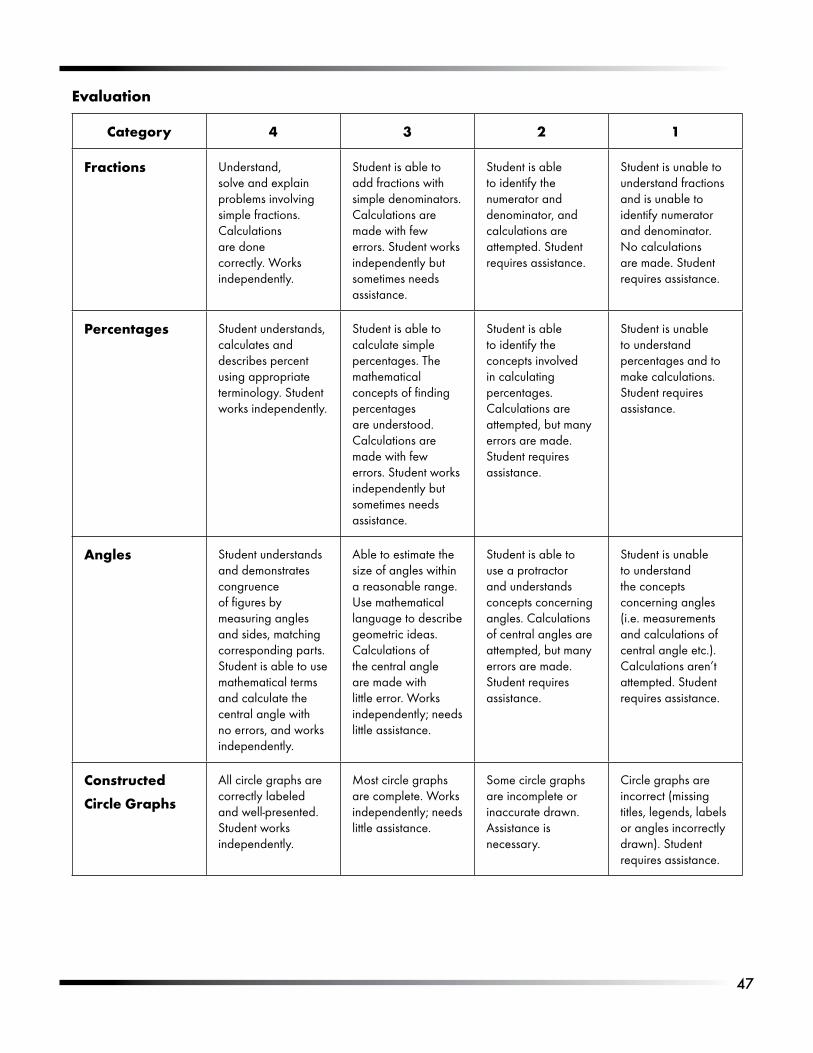
Evaluation
Category 4 3 2 1
Fractions Understand,.solve.and.explain.problems.involving.simple.fractions..Calculations.are.done.correctly..Works.independently.
Student.is.able.to.add.fractions.with.simple.denominators..Calculations.are.made.with.few.errors..Student.works.independently.but.sometimes.needs.assistance.
Student.is.able.to.identify.the.numerator.and.denominator,.and.calculations.are.attempted..Student.requires.assistance.
Student.is.unable.to.understand.fractions.and.is.unable.to.identify.numerator.and.denominator..No.calculations.are.made..Student.requires.assistance.
Percentages Student.understands,.calculates.and.describes.percent.using.appropriate.terminology..Student.works.independently.
Student.is.able.to.calculate.simple.percentages..The.mathematical.concepts.of.finding.percentages.are.understood..Calculations.are.made.with.few.errors..Student.works.independently.but.sometimes.needs.assistance.
Student.is.able.to.identify.the.concepts.involved.in.calculating.percentages..Calculations.are.attempted,.but.many.errors.are.made..Student.requires.assistance.
Student.is.unable.to.understand.percentages.and.to.make.calculations..Student.requires.assistance.
Angles Student.understands.and.demonstrates.congruence.of.figures.by.measuring.angles.and.sides,.matching.corresponding.parts..Student.is.able.to.use.mathematical.terms.and.calculate.the.central.angle.with.no.errors,.and.works.independently.
Able.to.estimate.the.size.of.angles.within.a.reasonable.range..Use.mathematical.language.to.describe.geometric.ideas..Calculations.of.the.central.angle.are.made.with.little.error..Works.independently;.needs.little.assistance.
Student.is.able.to.use.a.protractor.and.understands.concepts.concerning.angles..Calculations.of.central.angles.are.attempted,.but.many.errors.are.made..Student.requires.assistance.
Student.is.unable.to.understand.the.concepts.concerning.angles.(i.e..measurements.and.calculations.of.central.angle.etc.)..Calculations.aren’t.attempted..Student.requires.assistance.
Constructed
Circle Graphs
All.circle.graphs.are.correctly.labeled.and.well-presented..Student.works.independently.
Most.circle.graphs.are.complete..Works.independently;.needs.little.assistance.
Some.circle.graphs.are.incomplete.or.inaccurate.drawn..Assistance.is.necessary.
Circle.graphs.are.incorrect.(missing.titles,.legends,.labels.or.angles.incorrectly.drawn)..Student.requires.assistance.
S T U D E N T . H A N D O U T
�8
Name._____________________________________
Zodiac Table
Sign Dates Tally Number Fraction Percent
Capricorn Dec..22.—.Jan..20
Aquarius Jan..21.—.Feb..19
Pisces Feb..20.—.March.20
Aries March.21.—.April.20
Taurus April.21.—.May.21
Gemini May.22.—.June.23
Cancer June.24.—.July.23
Leo July.24.—.Aug..23
Virgo Aug..24.—.Sept..22
Libra Sept..23.—.Oct..23
Scorpio Oct..24.—.Nov..22
Sagittarius Nov..23.—.Dec..21

��
A Variety of Graphs
OverviewThe.students.use.a.
computer.to.make.a.variety.of.graphs.using.the.same.
data..They.then.make.some.comparisons.and.answer.questions.about.the.graphs.
ObjectiveStudents.will.be.able.to.interpret.data.using.line,.circle.and.bar.graphs..
Standards AddressedMathematics — Data Analysis
Grade 5
Data Collection, Benchmark D
03.. Read.and.interpret.increasingly.complex.displays.of.data,.such.as.double.bar.graphs..
Data Collection, Benchmark E
02.. Select.and.use.a.graph.that.is.appropriate.for.the.type.of.data.to.be.displayed;.e.g.,.numerical.vs..categorical.data,.discrete.vs..continuous.data..
04.. Determine.appropriate.data.to.be.collected.to.answer.questions.posed.by.students.or.teacher,.collect.and.display.data,.and.clearly.communicate.findings..
Grade 6
Data Collection, Benchmark A
01.. Read,.construct.and.interpret.line.graphs,.circle.graphs.and.histograms..
Data Collection, Benchmark D
03.. Compare.representations.of.the.same.data.in.different.types.of.graphs,.such.as.a.bar.graph.and.circle.graph...
Data Collection, Benchmark E
02.. Select,.create.and.use.graphical.representations.that.are.appropriate.for.the.type.of.data.collected..
Grade 7
Data Collection, Benchmark A
01.. Read,.create.and.interpret.box-and-whisker.plots,.stem-and-leaf.plots,.and.other.types.of.graphs,.when.appropriate..
ProcedureDiscussion.with.the.class.whether.they.know.what.is.meant.by.the.sentence,.“We.are.living.in.the.Information.Age.”.(This.refers.to.the.current.historical.time.period..It.is.called.the.Information.Age.because.technology,.especially.computer.technology,.has.enabled.us.to.transcend.barriers.of.communication.that.used.to.exist.)
1.
�0
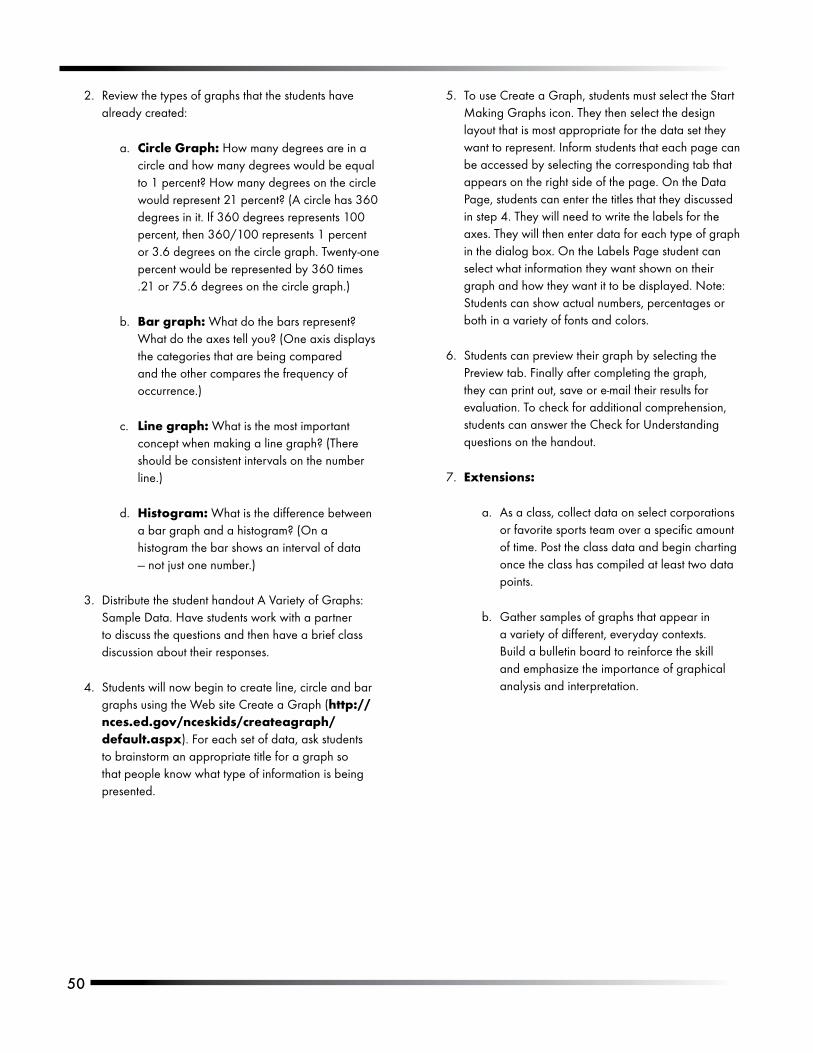
Review.the.types.of.graphs.that.the.students.have.already.created:
Circle Graph:.How.many.degrees.are.in.a.circle.and.how.many.degrees.would.be.equal.to.1.percent?.How.many.degrees.on.the.circle.would.represent.21.percent?.(A.circle.has.360.degrees.in.it..If.360.degrees.represents.100.percent,.then.360/100.represents.1.percent.or.3.6.degrees.on.the.circle.graph..Twenty-one.percent.would.be.represented.by.360.times..21.or.75.6.degrees.on.the.circle.graph.)
Bar graph:.What.do.the.bars.represent?.What.do.the.axes.tell.you?.(One.axis.displays.the.categories.that.are.being.compared.and.the.other.compares.the.frequency.of.occurrence.)
Line graph:.What.is.the.most.important.concept.when.making.a.line.graph?.(There.should.be.consistent.intervals.on.the.number.line.)
Histogram:.What.is.the.difference.between.a.bar.graph.and.a.histogram?.(On.a.histogram.the.bar.shows.an.interval.of.data.—.not.just.one.number.)
Distribute.the.student.handout.A.Variety.of.Graphs:.Sample.Data..Have.students.work.with.a.partner.to.discuss.the.questions.and.then.have.a.brief.class.discussion.about.their.responses..
Students.will.now.begin.to.create.line,.circle.and.bar.graphs.using.the.Web.site.Create.a.Graph.(http://nces.ed.gov/nceskids/createagraph/default.aspx)..For.each.set.of.data,.ask.students.to.brainstorm.an.appropriate.title.for.a.graph.so.that.people.know.what.type.of.information.is.being.presented..
2.
a.
b.
c.
d.
3.
4.
To.use.Create.a.Graph,.students.must.select.the.Start.Making.Graphs.icon..They.then.select.the.design.layout.that.is.most.appropriate.for.the.data.set.they.want.to.represent..Inform.students.that.each.page.can.be.accessed.by.selecting.the.corresponding.tab.that.appears.on.the.right.side.of.the.page..On.the.Data.Page,.students.can.enter.the.titles.that.they.discussed.in.step.4..They.will.need.to.write.the.labels.for.the.axes..They.will.then.enter.data.for.each.type.of.graph.in.the.dialog.box..On.the.Labels.Page.student.can.select.what.information.they.want.shown.on.their.graph.and.how.they.want.it.to.be.displayed..Note:.Students.can.show.actual.numbers,.percentages.or.both.in.a.variety.of.fonts.and.colors.
Students.can.preview.their.graph.by.selecting.the.Preview.tab..Finally.after.completing.the.graph,.they.can.print.out,.save.or.e-mail.their.results.for.evaluation..To.check.for.additional.comprehension,.students.can.answer.the.Check.for.Understanding.questions.on.the.handout.
Extensions:.
As.a.class,.collect.data.on.select.corporations.or.favorite.sports.team.over.a.specific.amount.of.time..Post.the.class.data.and.begin.charting.once.the.class.has.compiled.at.least.two.data.points.
Gather.samples.of.graphs.that.appear.in.a.variety.of.different,.everyday.contexts..Build.a.bulletin.board.to.reinforce.the.skill.and.emphasize.the.importance.of.graphical.analysis.and.interpretation.
5.
6.
7.
a.
b.
�1
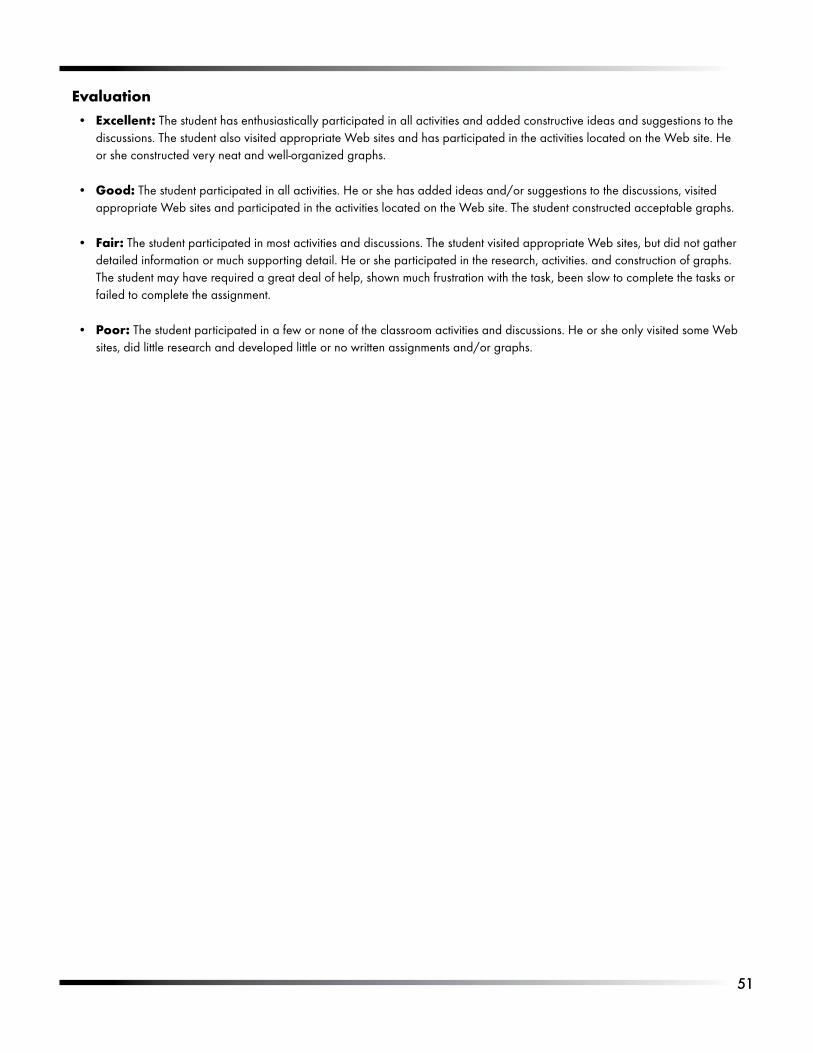
EvaluationExcellent: The.student.has.enthusiastically.participated.in.all.activities.and.added.constructive.ideas.and.suggestions.to.the.discussions..The.student.also.visited.appropriate.Web.sites.and.has.participated.in.the.activities.located.on.the.Web.site..He.or.she.constructed.very.neat.and.well-organized.graphs.
Good:.The.student.participated.in.all.activities..He.or.she.has.added.ideas.and/or.suggestions.to.the.discussions,.visited.appropriate.Web.sites.and.participated.in.the.activities.located.on.the.Web.site..The.student.constructed.acceptable.graphs.
Fair: The.student.participated.in.most.activities.and.discussions..The.student.visited.appropriate.Web.sites,.but.did.not.gather.detailed.information.or.much.supporting.detail..He.or.she.participated.in.the.research,.activities..and.construction.of.graphs..The.student.may.have.required.a.great.deal.of.help,.shown.much.frustration.with.the.task,.been.slow.to.complete.the.tasks.or.failed.to.complete.the.assignment.
Poor: The.student.participated.in.a.few.or.none.of.the.classroom.activities.and.discussions..He.or.she.only.visited.some.Web.sites,.did.little.research.and.developed.little.or.no.written.assignments.and/or.graphs.
•
•
•
•
S T U D E N T . H A N D O U T
�2
Name._____________________________________
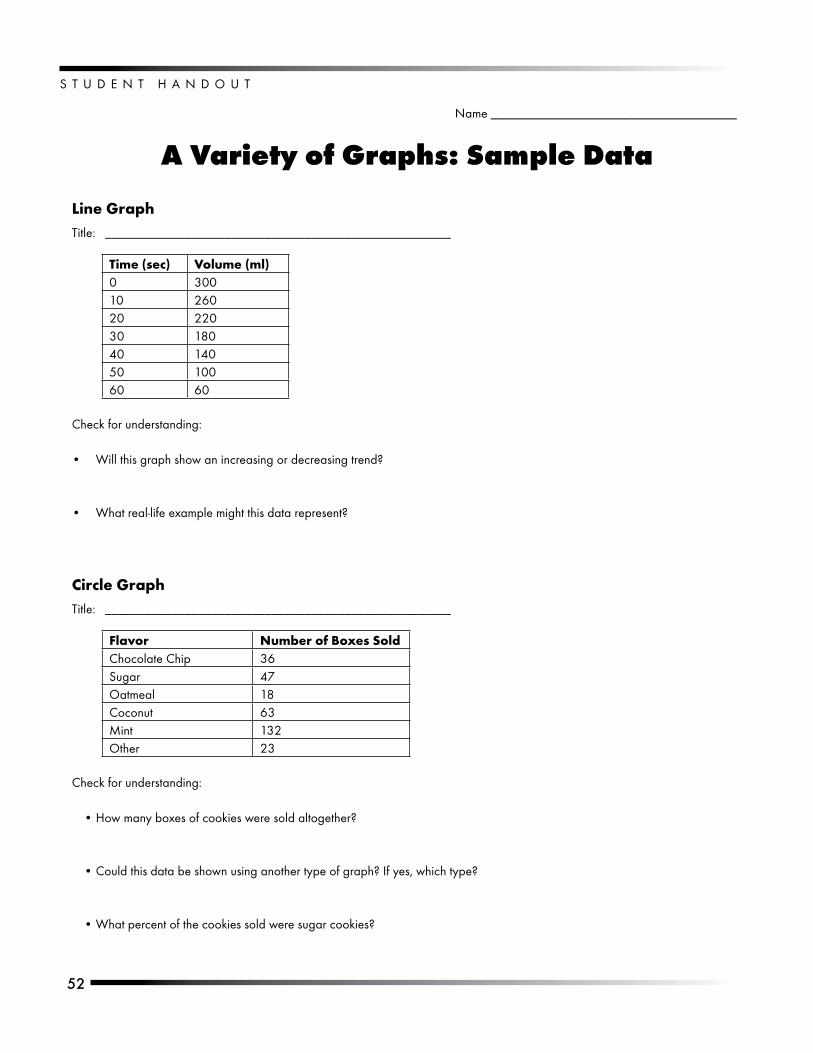
A Variety of Graphs: Sample Data
Line GraphTitle:.. ____________________________________________________
Time (sec) Volume (ml)0 30010 26020 22030 18040 14050 10060 60
Check.for.understanding:
Will.this.graph.show.an.increasing.or.decreasing.trend?
What.real-life.example.might.this.data.represent?
Circle GraphTitle:.. ____________________________________________________
Flavor Number of Boxes SoldChocolate.Chip 36Sugar 47Oatmeal 18Coconut 63Mint 132Other 23
Check.for.understanding:
How.many.boxes.of.cookies.were.sold.altogether?
Could.this.data.be.shown.using.another.type.of.graph?.If.yes,.which.type?
What.percent.of.the.cookies.sold.were.sugar.cookies?
•
•
•
•
•
��
S T U D E N T . H A N D O U T
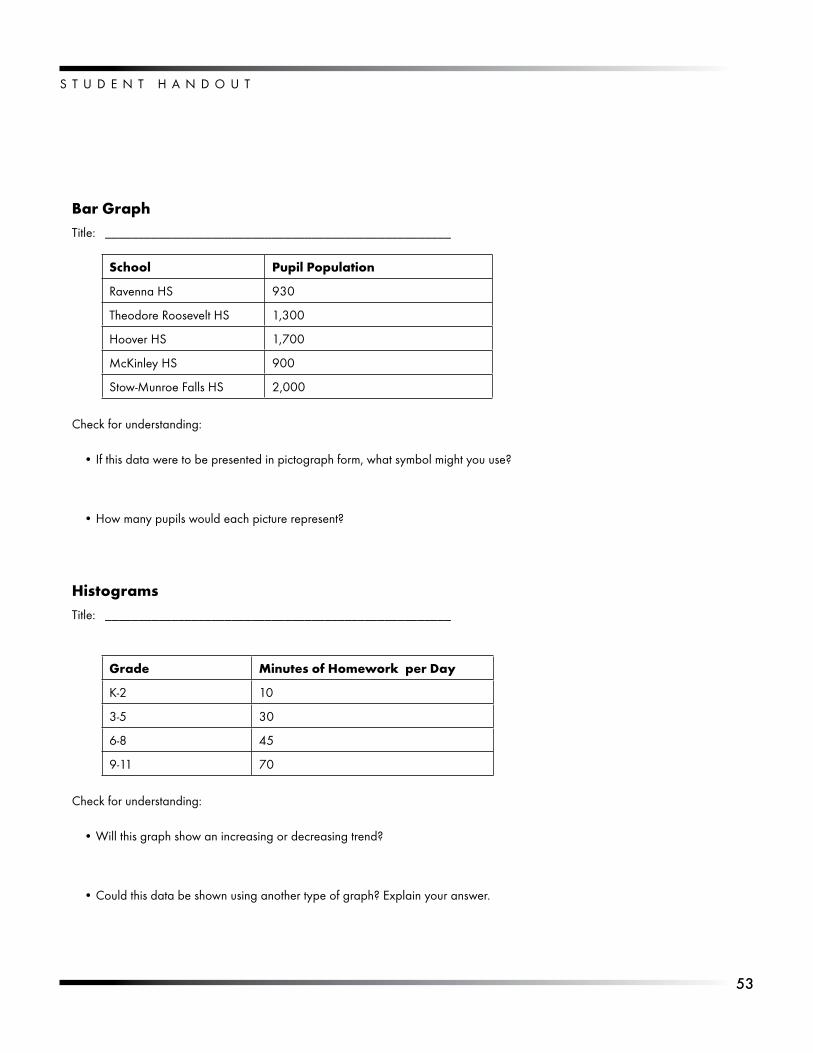
Bar GraphTitle:.. ____________________________________________________
School Pupil Population
Ravenna.HS 930
Theodore.Roosevelt.HS 1,300
Hoover.HS 1,700
McKinley.HS 900
Stow-Munroe.Falls.HS 2,000
Check.for.understanding:
If.this.data.were.to.be.presented.in.pictograph.form,.what.symbol.might.you.use?
How.many.pupils.would.each.picture.represent?
HistogramsTitle:.. ____________________________________________________
Grade Minutes of Homework per Day
K-2 10
3-5 30
6-8 45
9-11 70
Check.for.understanding:
Will.this.graph.show.an.increasing.or.decreasing.trend?
Could.this.data.be.shown.using.another.type.of.graph?.Explain.your.answer.
•
•
•
•
��
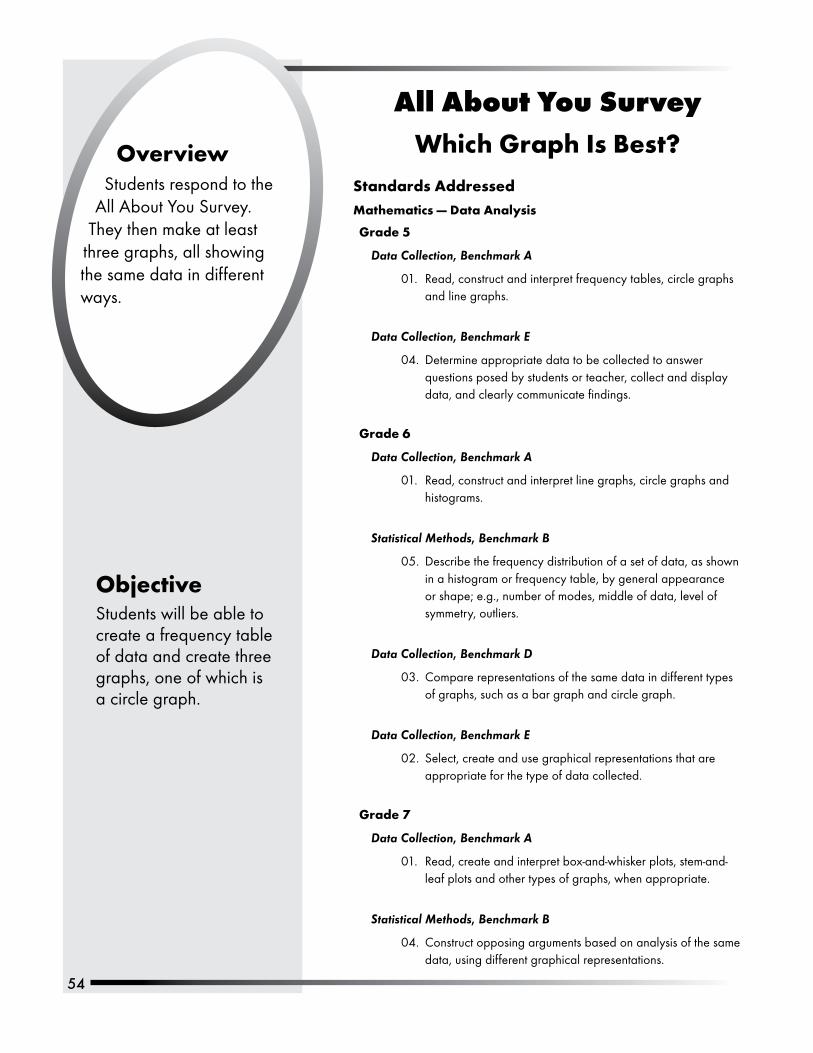
All About You SurveyWhich Graph Is Best?Overview
Students.respond.to.the.All.About.You.Survey..
They.then.make.at.least.three.graphs,.all.showing.the.same.data.in.different.ways..
ObjectiveStudents.will.be.able.to.create.a.frequency.table.of.data.and.create.three.graphs,.one.of.which.is.a.circle.graph.
Standards AddressedMathematics — Data Analysis
Grade 5
Data Collection, Benchmark A
01.. Read,.construct.and.interpret.frequency.tables,.circle.graphs.and.line.graphs.
Data Collection, Benchmark E
04.. Determine.appropriate.data.to.be.collected.to.answer.questions.posed.by.students.or.teacher,.collect.and.display.data,.and.clearly.communicate.findings.
Grade 6
Data Collection, Benchmark A
01.. Read,.construct.and.interpret.line.graphs,.circle.graphs.and.histograms.
Statistical Methods, Benchmark B
05.. Describe.the.frequency.distribution.of.a.set.of.data,.as.shown.in.a.histogram.or.frequency.table,.by.general.appearance.or.shape;.e.g.,.number.of.modes,.middle.of.data,.level.of.symmetry,.outliers.
Data Collection, Benchmark D
03.. Compare.representations.of.the.same.data.in.different.types.of.graphs,.such.as.a.bar.graph.and.circle.graph.
Data Collection, Benchmark E
02.. Select,.create.and.use.graphical.representations.that.are.appropriate.for.the.type.of.data.collected.
Grade 7
Data Collection, Benchmark A
01.. Read,.create.and.interpret.box-and-whisker.plots,.stem-and-leaf.plots.and.other.types.of.graphs,.when.appropriate..
.Statistical Methods, Benchmark B
04.. Construct.opposing.arguments.based.on.analysis.of.the.same.data,.using.different.graphical.representations.
��
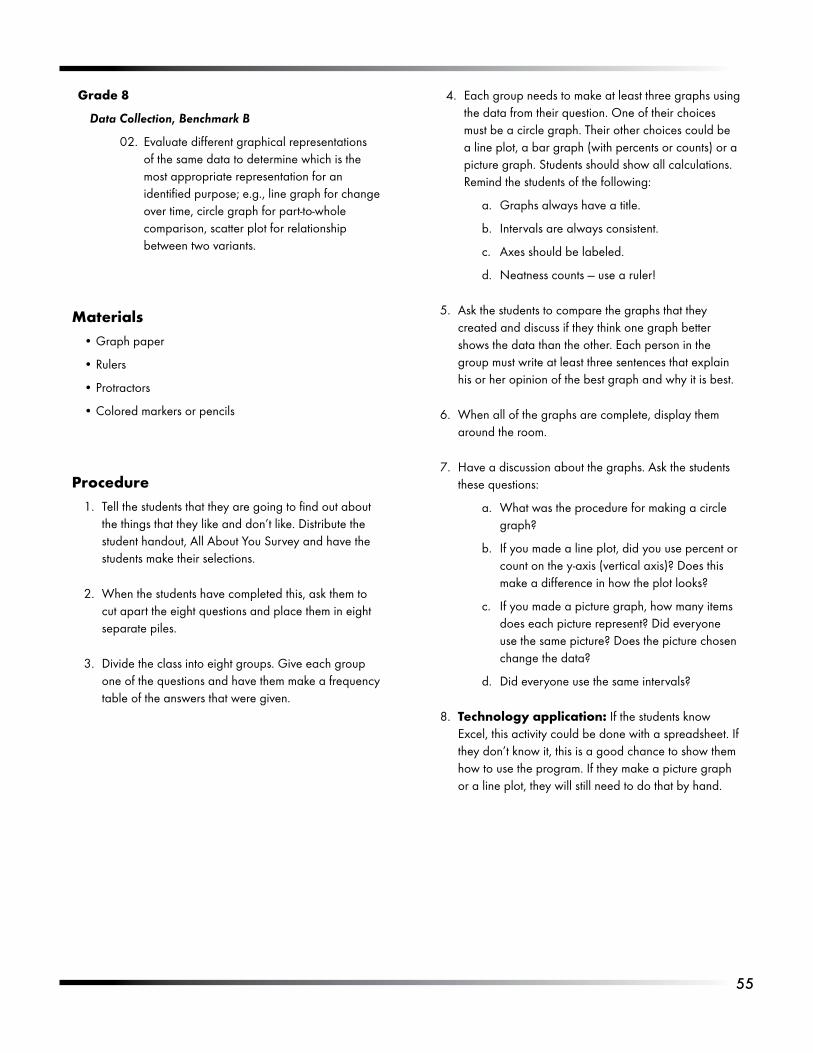
Grade 8
Data Collection, Benchmark B
02.. Evaluate.different.graphical.representations.of.the.same.data.to.determine.which.is.the.most.appropriate.representation.for.an.identified.purpose;.e.g.,.line.graph.for.change.over.time,.circle.graph.for.part-to-whole.comparison,.scatter.plot.for.relationship.between.two.variants..
MaterialsGraph.paper
Rulers
Protractors
Colored.markers.or.pencils
ProcedureTell.the.students.that.they.are.going.to.find.out.about.the.things.that.they.like.and.don’t.like..Distribute.the.student.handout,.All.About.You.Survey.and.have.the.students.make.their.selections.
When.the.students.have.completed.this,.ask.them.to.cut.apart.the.eight.questions.and.place.them.in.eight.separate.piles.
Divide.the.class.into.eight.groups..Give.each.group.one.of.the.questions.and.have.them.make.a.frequency.table.of.the.answers.that.were.given.
•
•
•
•
1.
2.
3.
Each.group.needs.to.make.at.least.three.graphs.using.the.data.from.their.question..One.of.their.choices.must.be.a.circle.graph..Their.other.choices.could.be.a.line.plot,.a.bar.graph.(with.percents.or.counts).or.a.picture.graph..Students.should.show.all.calculations..Remind.the.students.of.the.following:
Graphs.always.have.a.title.
Intervals.are.always.consistent.
Axes.should.be.labeled.
Neatness.counts.—.use.a.ruler!
Ask.the.students.to.compare.the.graphs.that.they.created.and.discuss.if.they.think.one.graph.better.shows.the.data.than.the.other..Each.person.in.the.group.must.write.at.least.three.sentences.that.explain.his.or.her.opinion.of.the.best.graph.and.why.it.is.best.
When.all.of.the.graphs.are.complete,.display.them.around.the.room.
Have.a.discussion.about.the.graphs..Ask.the.students.these.questions:.
What.was.the.procedure.for.making.a.circle.graph?
If.you.made.a.line.plot,.did.you.use.percent.or.count.on.the.y-axis.(vertical.axis)?.Does.this.make.a.difference.in.how.the.plot.looks?
If.you.made.a.picture.graph,.how.many.items.does.each.picture.represent?.Did.everyone.use.the.same.picture?.Does.the.picture.chosen.change.the.data?
Did.everyone.use.the.same.intervals?
Technology application: If.the.students.know.Excel,.this.activity.could.be.done.with.a.spreadsheet..If.they.don’t.know.it,.this.is.a.good.chance.to.show.them.how.to.use.the.program..If.they.make.a.picture.graph.or.a.line.plot,.they.will.still.need.to.do.that.by.hand..
4.
a.
b.
c.
d.
5.
6.
7.
a.
b.
c.
d.
8.
��
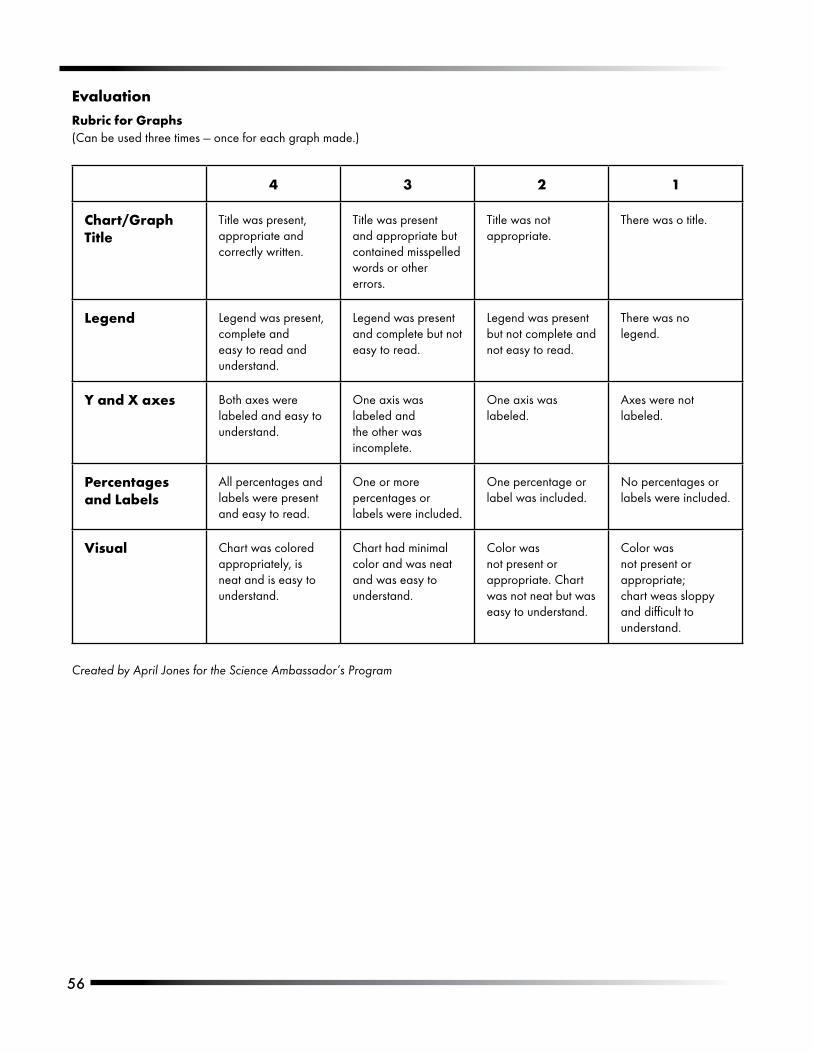
EvaluationRubric for Graphs (Can.be.used.three.times.—.once.for.each.graph.made.)
4 3 2 1
Chart/Graph Title
Title.was.present,.appropriate.and.correctly.written.
Title.was.present.and.appropriate.but.contained.misspelled.words.or.other.errors.
Title.was.not.appropriate.
There.was.o.title.
Legend Legend.was.present,.complete.and.easy.to.read.and.understand.
Legend.was.present.and.complete.but.not.easy.to.read.
Legend.was.present.but.not.complete.and.not.easy.to.read.
There.was.no.legend.
Y and X axes Both.axes.were.labeled.and.easy.to.understand.
One.axis.was.labeled.and.the.other.was.incomplete.
One.axis.was.labeled.
Axes.were.not.labeled.
Percentages and Labels
All.percentages.and.labels.were.present.and.easy.to.read.
One.or.more.percentages.or.labels.were.included.
One.percentage.or.label.was.included.
No.percentages.or.labels.were.included.
Visual Chart.was.colored.appropriately,.is.neat.and.is.easy.to.understand.
Chart.had.minimal.color.and.was.neat.and.was.easy.to.understand.
Color.was.not.present.or.appropriate..Chart.was.not.neat.but.was.easy.to.understand.
Color.was.not.present.or.appropriate;.chart.weas.sloppy.and.difficult.to.understand.
Created by April Jones for the Science Ambassador’s Program
�7
S T U D E N T . H A N D O U T
Name._____________________________________
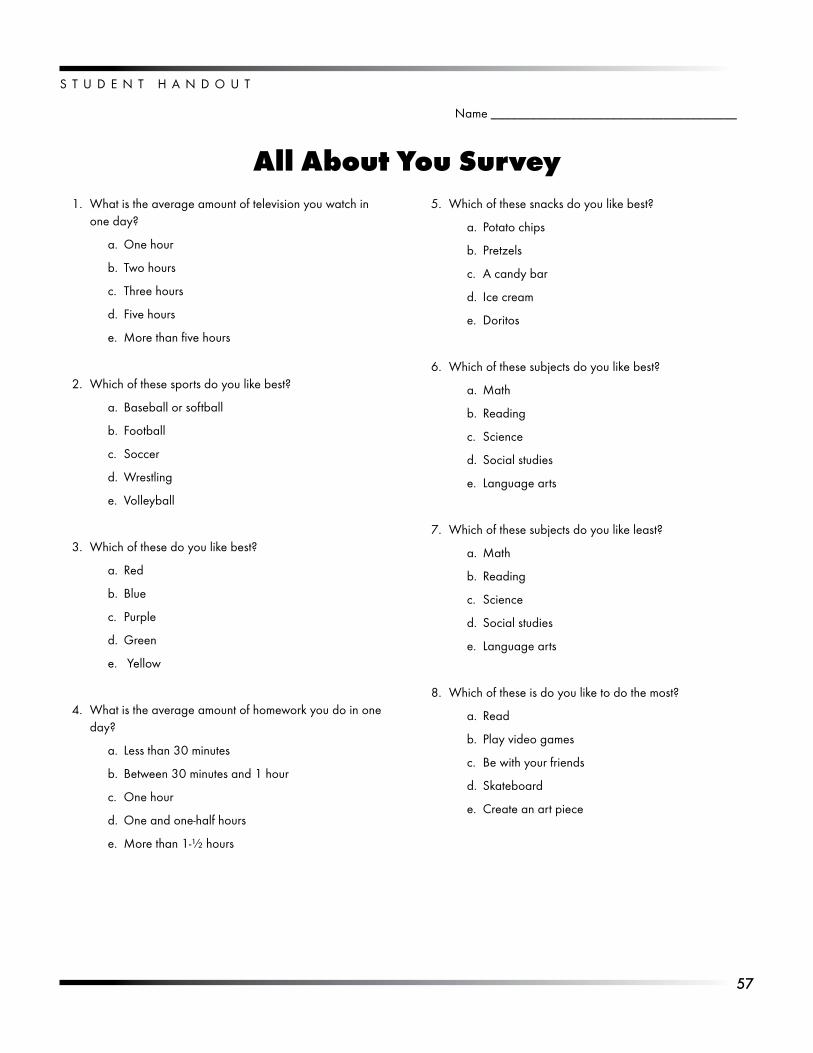
All About You SurveyWhat.is.the.average.amount.of.television.you.watch.in.one.day?
a.. One.hour
b.. Two.hours
c.. Three.hours
d.. Five.hours
e.. More.than.five.hours
Which.of.these.sports.do.you.like.best?
a.. Baseball.or.softball
b.. Football
c.. Soccer
d.. Wrestling
e.. Volleyball
Which.of.these.do.you.like.best?
a.. Red
b.. Blue
c.. Purple
d.. Green
e.. .Yellow
What.is.the.average.amount.of.homework.you.do.in.one.day?
a.. Less.than.30.minutes
b.. Between.30.minutes.and.1.hour
c.. One.hour
d.. One.and.one-half.hours
e.. More.than.1-½.hours
1.
2.
3.
4.
Which.of.these.snacks.do.you.like.best?
a.. Potato.chips
b.. Pretzels
c.. A.candy.bar
d.. Ice.cream
e.. Doritos
Which.of.these.subjects.do.you.like.best?
a.. Math
b.. Reading
c.. Science
d.. Social.studies
e.. Language.arts
Which.of.these.subjects.do.you.like.least?
a.. Math
b.. Reading
c.. Science
d.. Social.studies
e.. Language.arts
Which.of.these.is.do.you.like.to.do.the.most?
a.. Read
b.. Play.video.games
c.. Be.with.your.friends
d.. Skateboard
e.. Create.an.art.piece
5.
6.
7.
8.
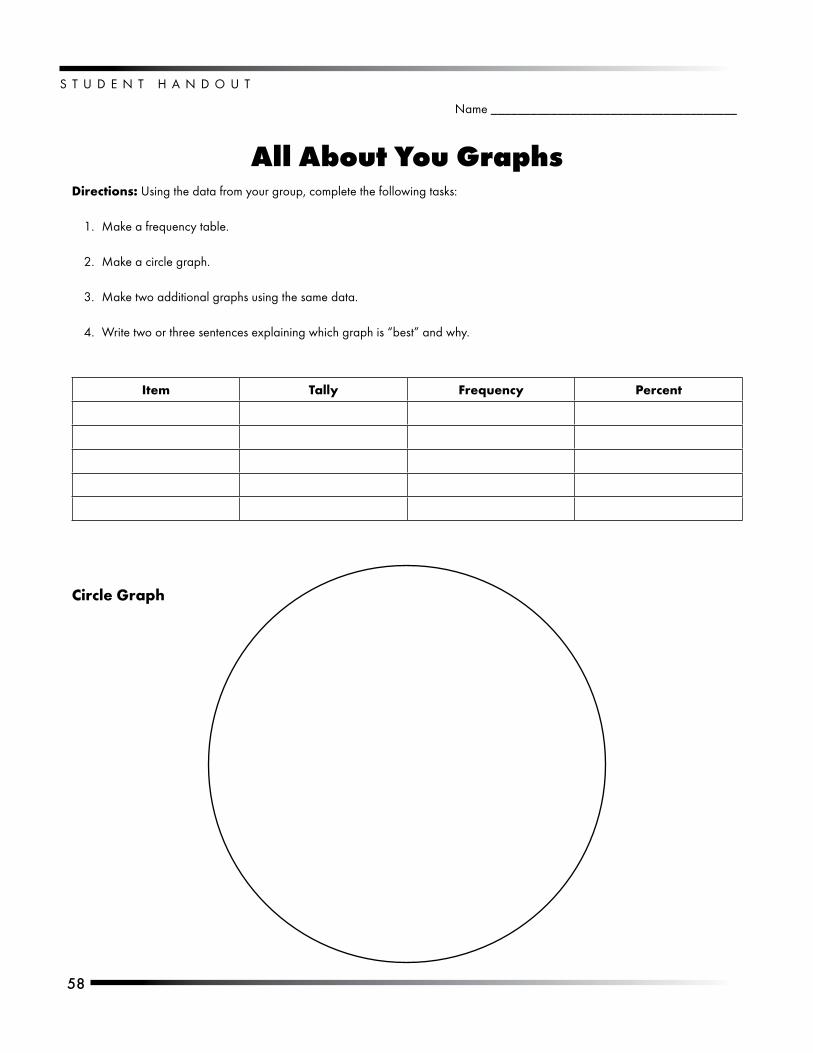
S T U D E N T . H A N D O U T
�8
Name._____________________________________
All About You GraphsDirections: Using.the.data.from.your.group,.complete.the.following.tasks:
Make.a.frequency.table.
Make.a.circle.graph.
Make.two.additional.graphs.using.the.same.data.
Write.two.or.three.sentences.explaining.which.graph.is.“best”.and.why.
Item Tally Frequency Percent
Circle Graph
1.
2.
3.
4.
��
S T U D E N T . H A N D O U T
Graph 2 Graph 3

�0
http://www.WesternReservePublicMedia.org/quizbus
Video 3Stem-and-Leaf Plots,
Box-and-Whisker Plots and Scatter Plots

��
Stem-and-Leaf Plots
OverviewStudents.create.a.stem-and-
leaf.plot.using.the.number.of.calories.in.fast-food.breakfasts.
ObjectiveStudents.will.understand.stem-and-leaf.plots,.with.stems.in.the.hundredths.place.
Standards AddressMathematics — Data Analysis
Grade 7
Data Collection, Benchmark A
01.. Read,.create.and.interpret.box-and-whisker.plots,.stem-and-leaf.plots,.and.other.types.of.graphs,.when.appropriate.
MaterialsRulers
ProcedureTo.start.this.lesson,.show.the.class.an.example.of.what.a.stem-and-leaf.plot.looks.like..One.example.might.be.test.scores.
Ask.a.few.willing.students.to.find.their.grades.and.explain.how.they.found.it.to.the.class..Students.will.learn.very.quickly.how.to.read.this.plot.
Explain.a.little.about.the.plot:
The.stem.can.be.whatever.you.determine.it.to.be.and.the.leaves.are.the.remainder.of.the.numbers.
There.is.a.legend.to.explain.the.plot.
Generally.the.plot.is.written.twice,.once.with.the.leaves.in.any.order.and.secondly.with.the.leaves.in.order.from.smallest.to.largest.
Distribute.the.student.handout.and.ask.students.to.make.a.stem-and-leaf.plot.using.the.data.given.
Remind.the.students.of.the.need.to.make.a.legend.explaining.the.data.and.to.include.a.title.
•
1.
2.
3.
a.
b.
c.
4.
5.
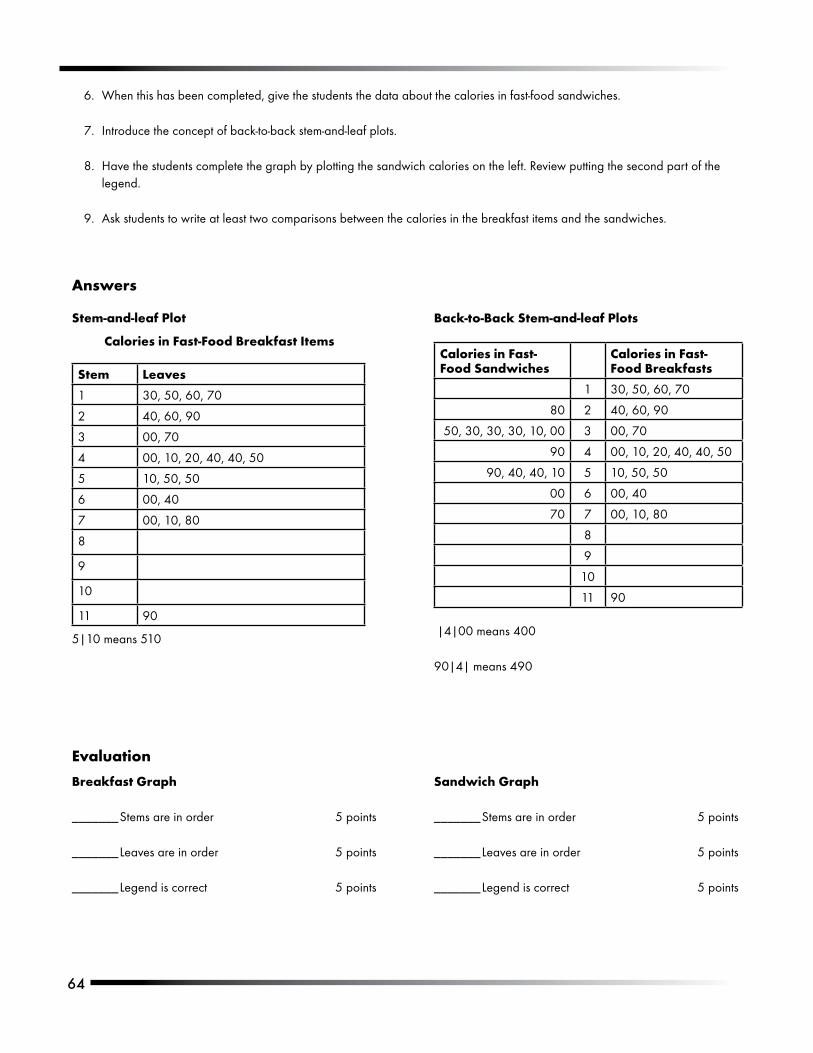
��
Answers
When.this.has.been.completed,.give.the.students.the.data.about.the.calories.in.fast-food.sandwiches.
Introduce.the.concept.of.back-to-back.stem-and-leaf.plots.
Have.the.students.complete.the.graph.by.plotting.the.sandwich.calories.on.the.left..Review.putting.the.second.part.of.the.legend.
Ask.students.to.write.at.least.two.comparisons.between.the.calories.in.the.breakfast.items.and.the.sandwiches..
6.
7.
8.
9.
5|10.means.510
Stem Leaves
1 30,.50,.60,.70
2 40,.60,.90
3 00,.70
4 00,.10,.20,.40,.40,.50
5 10,.50,.50
6 00,.40
7 00,.10,.80
8
9
10
11 90
Stem-and-leaf Plot
Calories in Fast-Food Breakfast Items
Evaluation
Back-to-Back Stem-and-leaf Plots
Calories in Fast-Food Sandwiches
Calories in Fast-Food Breakfasts
1 30,.50,.60,.70
80 2 40,.60,.90
50,.30,.30,.30,.10,.00 3 00,.70
90 4 00,.10,.20,.40,.40,.50
90,.40,.40,.10 5 10,.50,.50
00 6 00,.40
70 7 00,.10,.80
8
9
10
11 90
.|4|00.means.400
90|4|.means.490
Breakfast Graph
_______Stems.are.in.order. 5.points
_______Leaves.are.in.order. 5.points
_______Legend.is.correct. 5.points
Sandwich Graph
_______Stems.are.in.order. 5.points
_______Leaves.are.in.order. 5.points
_______Legend.is.correct. 5.points
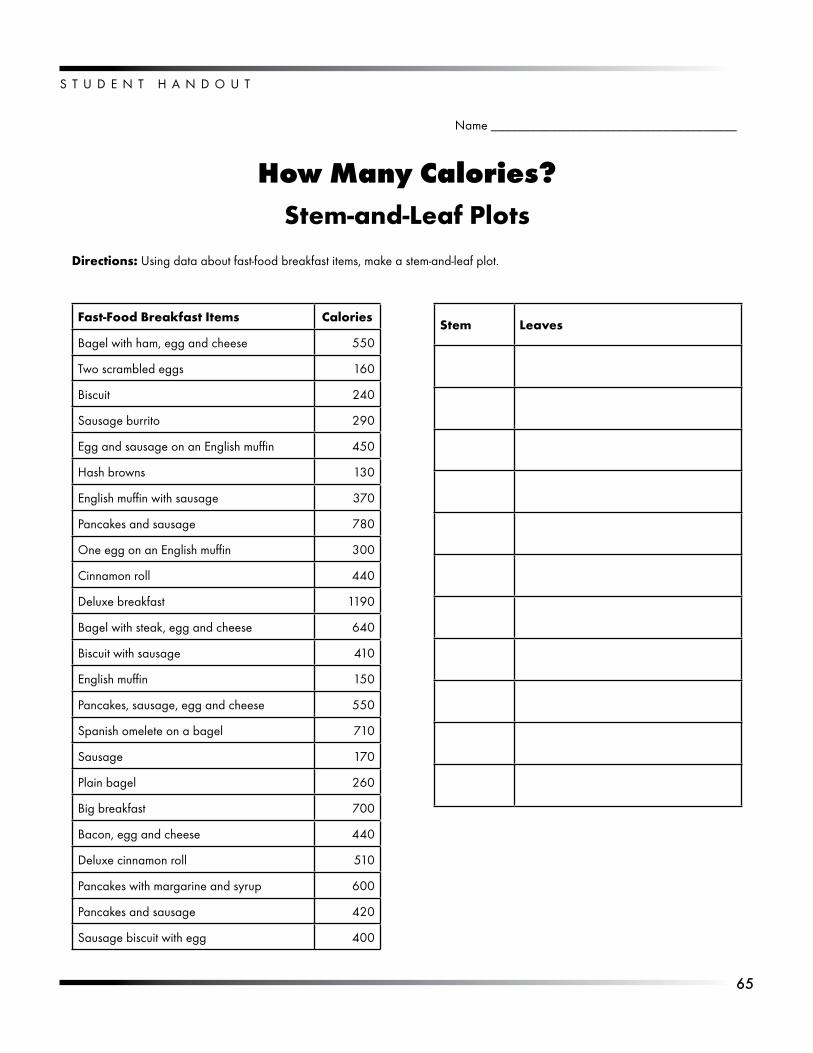
��
S T U D E N T . H A N D O U T
Fast-Food Breakfast Items Calories
Bagel.with.ham,.egg.and.cheese. 550
Two.scrambled.eggs 160
Biscuit 240
Sausage.burrito 290
Egg.and.sausage.on.an.English.muffin 450
Hash.browns 130
English.muffin.with.sausage 370
Pancakes.and.sausage 780
One.egg.on.an.English.muffin 300
Cinnamon.roll 440
Deluxe.breakfast 1190
Bagel.with.steak,.egg.and.cheese 640
Biscuit.with.sausage 410
English.muffin 150
Pancakes,.sausage,.egg.and.cheese 550
Spanish.omelete.on.a.bagel 710
Sausage 170
Plain.bagel 260
Big.breakfast 700
Bacon,.egg.and.cheese 440
Deluxe.cinnamon.roll 510
Pancakes.with.margarine.and.syrup 600
Pancakes.and.sausage 420
Sausage.biscuit.with.egg 400
Stem Leaves
Name._____________________________________
How Many Calories?Stem-and-Leaf Plots
Directions:.Using.data.about.fast-food.breakfast.items,.make.a.stem-and-leaf.plot.
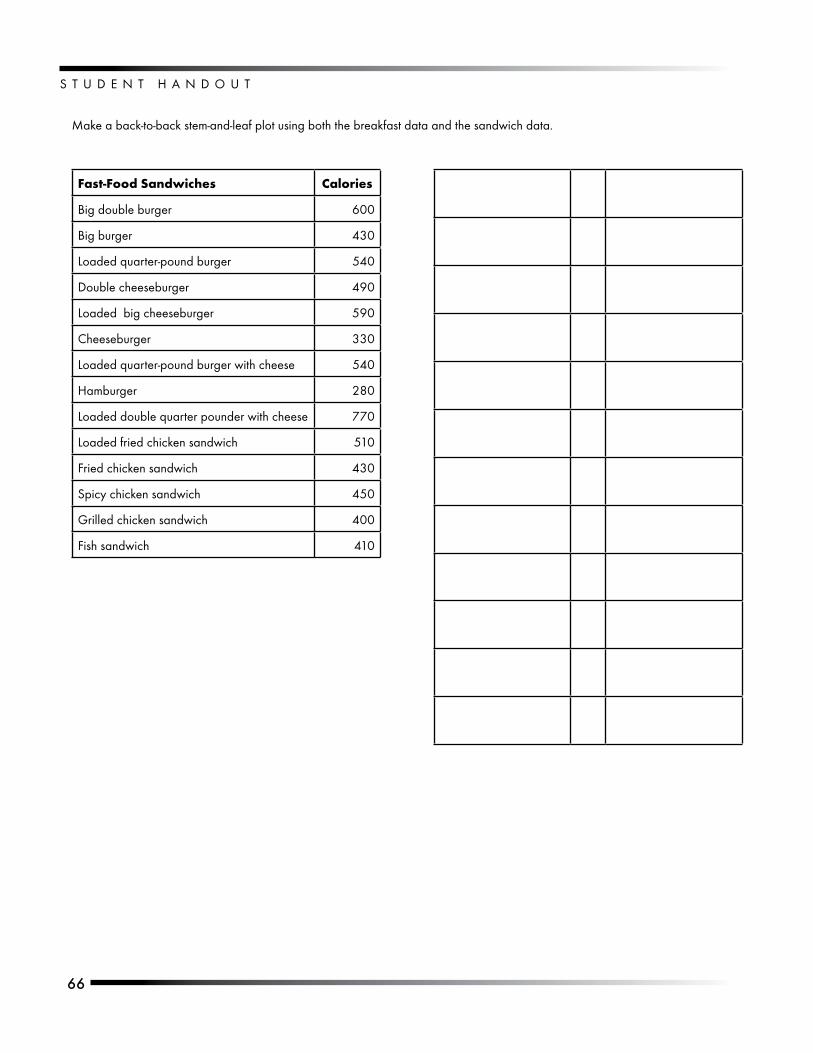
S T U D E N T . H A N D O U T
��
Make.a.back-to-back.stem-and-leaf.plot.using.both.the.breakfast.data.and.the.sandwich.data.
Fast-Food Sandwiches Calories
Big.double.burger 600
Big.burger 430
Loaded.quarter-pound.burger 540
Double.cheeseburger 490
Loaded..big.cheeseburger 590
Cheeseburger 330
Loaded.quarter-pound.burger.with.cheese 540
Hamburger 280
Loaded.double.quarter.pounder.with.cheese 770
Loaded.fried.chicken.sandwich 510
Fried.chicken.sandwich 430
Spicy.chicken.sandwich 450
Grilled.chicken.sandwich 400
Fish.sandwich 410
�7
Human Box-and Whisker-PlotsOverview
Students.learn.about.box-and-whisker.plots.
through.a.class.activity.that.compares.their.heights..As.an.extension.of.this.activity,.they.learn.how.to.use.two.different.forms.of.technology.to.check.their.answers.
ObjectiveStudents.will.be.able.to.design.and.construct.a.box-and-whisker.plot.
Standards AddressedMathematics — Data Analysis
Grade 5
Statistical Methods, Benchmark F
06.. Determine.and.use.the.range,.mean,.median.and.mode,.and.explain.what.each.does.and.does.not.indicate.about.the.set.of.data.
Grade 6
Data Collection, Benchmark E
02.. Select,.create.and.use.graphical.representations.that.are.appropriate.for.the.type.of.data.collected.
Statistical Methods, Benchmark F
04.. Understand.the.different.information.provided.by.measures.of.center.(mean,.mode.and.median).and.measures.of.spread.(range).
Grade 7
Data Collection, Benchmark A
01.. Read,.create.and.interpret.box-and-whisker.plots,.stem-and-leaf.plots,.and.other.types.of.graphs,.when.appropriate.
Statistical Methods, Benchmark F
03.. Analyze.a.set.of.data.by.using.and.comparing.combinations.of.measures.of.center.(mean,.mode,.median).and.measures.of.spread.(range,.quartile,.interquartile.range),.and.describe.how.the.inclusion.of.exclusion.of.outliers.affects.those.measures.
�8
MaterialsIndex.cards.
Meter.sticks
Construction.paper
Cash.register.tape.or.string
Long.strip.of.bulletin.board.paper
Three.flags.—.two.red.and.one.blue.(can.be.handmade.out.of.rulers.or.straws.and.construction.paper).
ProcedureMake.three.flags.—.one.blue.and.two.red.—.with.“median”.written.on.them.
Explain.that.the.class.is.going.to.learn.how.to.make.an.interesting.graph.with.an.interesting.name.—.a.box-and-whisker.plot..The.students.are.going.to.do.this.based.on.their.heights..
Group.students.in.pairs.and.pass.out.one.meter.stick.to.each.pair..Give.instructions.to.have.each.person.measure.the.other.in.centimeters.and.write.the.height.on.an.index.card..
Instruct.students.to.order.themselves.from.shortest.to.tallest.(shoulder.to.shoulder).across.the.front.of.the.room..
Explain.that.the.class.needs.to.find.the.median.student.(the.student.in.the.middle)..To.find.the.median,.or.middle.number,.have.students.at.each.end.of.the.line.say.“1”.at.the.same.time.and.sit.on.the.floor..Ask.students.next.to.them.to.say.“2.”.Have.students.count.off.in.this.fashion.until.only.one.or.two.students.are.standing..If.there.is.an.odd.number.of.students,.there.will.be.one.student;.if.there.is.an.even.number,.there.will.be.two.students..
Give.the.remaining.student.the.blue.flag.with.“median”.written.on.it..If.by.chance.you.have.an.even.number.of.students.in.your.class,.then.have.the.class.find.the.mean.of.these.two.heights..These.two.students.must.hold.the.flag.between.them..
•
•
•
•
•
•
1.
2.
3.
4.
5.
6.
At.this.point,.explain.to.the.students.that.we.have.divided.the.class.into.two.groups.or.halves.—.the.short.half.and.the.tall.half..
Explain.that.the.class.is.now.going.to.find.the.quartiles.of.our.data.set..Ask.the.class.what.quartile.means,.for.example:.What.does.it.sound.like?.A.quarter?.What.is.a.quarter.—.25.cents?.One.fourth?.What.is.the.relationship.between.one.fourth.and.one.half?.
The.quartiles.of.a.data.set.are.the.middle.(half).of.each.half..Who.is.in.the.middle.of.the.short.half?.This.person.is.the.lower.quartile..Give.him.or.her.a.red.flag..Who.is.in.the.middle.of.the.tall.half?.This.person.is.the.upper.quartile.and.gets.a.red.flag.as.well..Once.again,.if.there.are.two.students.in.the.middle,.the.mean.of.the.two.would.be.used..
At.this.point,.students.of.the.same.height.need.to.stand.behind.one.another..
Explain.that.there.are.two.other.important.data.points/people.in.the.making.of.our.graph.—.the.endpoints.or.the.maximum.and.the.minimum.—.in.this.case.the.shortest.person.and.the.tallest.person.in.our.class..These.people.are.the.lower.and.upper.endpoints,.respectively..
Use.a.piece.of.yarn.or.register.tape.to.make.a.box.around.the.students.in.the.lower.to.upper.quartile..Have.students.locate.the.median.student.in.relationship.to.the.box..Discuss.that.the.median.student.should.be.in.the.box.but.not.necessarily.in.the.middle.of.the.box..
Now.for.the.whiskers..Explain.that.the.whiskers.run.from.quartile.to.endpoint..Unroll.each.roll.of.register.tape.or.string.so.that.it.goes.from.lower.quartile.to.lower.endpoint.and.upper.quartile.to.upper.endpoint..Students.should.assist.in.holding.paper..
Review.the.process.with.students,.answering.any.questions.they.have..Record.the.steps.on.the.board/overhead.for.reference.
7.
8.
9.
10.
11.
12.
13.
14.
��
.Technology Extension:.Students.can.check.their.box-and-whisker.plot.in.two.different.ways..First,.they.can.go.to.the.following.Web.site.and.follow.the.directions.for.putting.in.their.own.data.and.drawing.the.box.plotter..This.site.also.lets.you.print.out.the.box.plot.....http://illuminations.nctm.org/ActivityDetail.aspx?ID=77.
Second,.if.computers.are.not.readily.available,.students.can.use.a.graphing.calculator.to.check.their.work..If.the.classroom.is.equipped.with.a.white.board.use.the.graphing.calculator.software.installed.and.show.the.students.exactly.how.to.make.the.box.plot.on.the.white.board.
Extensions:.
To.develop.their.understanding.further,.ask.students.how.the.box-and-whisker.plot.would.change.if.the.teacher’s.height.was.included.in.the.data.set..
Suppose.a.new.student.came.into.the.class..How.would.that.change.the.plot.we.made?
Suppose.(student.name).moved.away..How.would.that.change.the.plot?.(Repeat.with.other.names.).
15.
16.
a.
b.
c.
EvaluationIn.order.to.assess.students’.comprehension.of.the.activity,.give.them.a.similar.data.set.(you.might.want.to.use.another.class’s.heights).and.have.them.go.through.the.process.on.paper..They.should.identify.the.median,.upper.and.lower.quartiles.and.upper.and.lower.endpoints,.then.draw.the.graph.on.a.number.line..
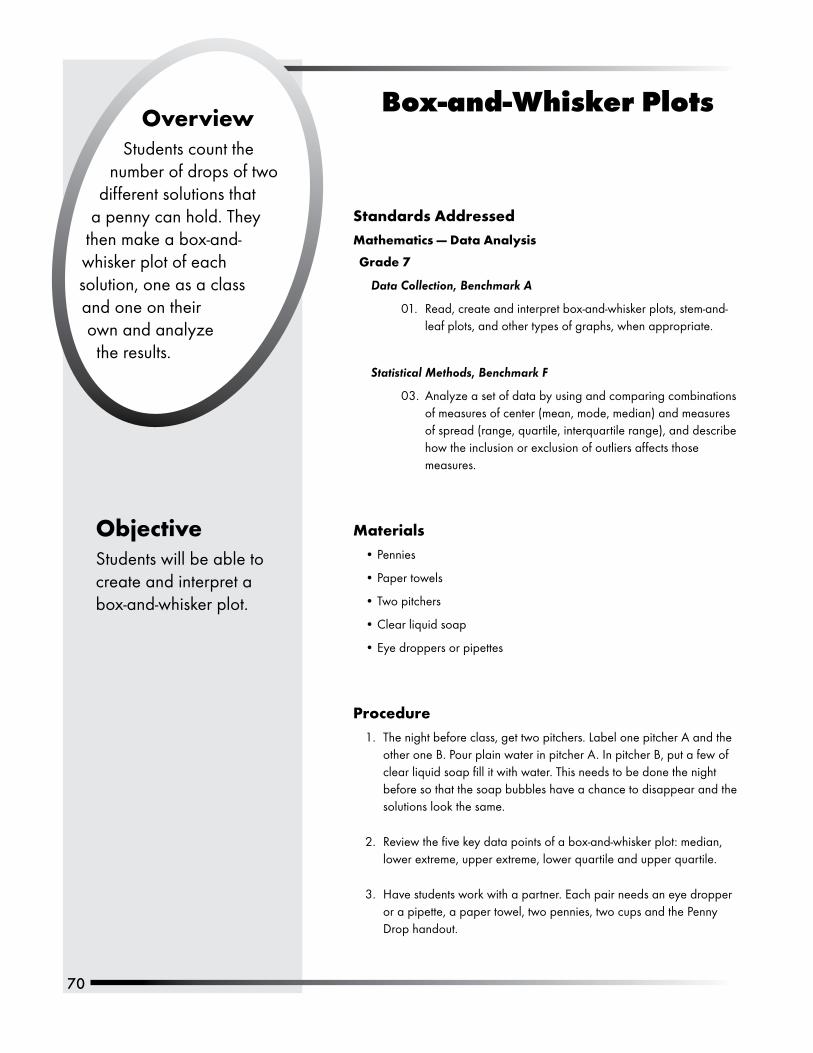
70
Box-and-Whisker PlotsOverview
Students.count.the.number.of.drops.of.two.
different.solutions.that..a.penny.can.hold..They.
then.make.a.box-and-whisker.plot.of.each.solution,.one.as.a.class.and.one.on.their..own.and.analyze..the.results.
ObjectiveStudents.will.be.able.to.create.and.interpret.a.box-and-whisker.plot..
Standards AddressedMathematics — Data Analysis
Grade 7
Data Collection, Benchmark A
01.. Read,.create.and.interpret.box-and-whisker.plots,.stem-and-leaf.plots,.and.other.types.of.graphs,.when.appropriate.
Statistical Methods, Benchmark F
03.. Analyze.a.set.of.data.by.using.and.comparing.combinations.of.measures.of.center.(mean,.mode,.median).and.measures.of.spread.(range,.quartile,.interquartile.range),.and.describe.how.the.inclusion.or.exclusion.of.outliers.affects.those.measures.
MaterialsPennies
Paper.towels
Two.pitchers
Clear.liquid.soap
Eye.droppers.or.pipettes
ProcedureThe.night.before.class,.get.two.pitchers..Label.one.pitcher.A.and.the.other.one.B..Pour.plain.water.in.pitcher.A..In.pitcher.B,.put.a.few.of.clear.liquid.soap.fill.it.with.water..This.needs.to.be.done.the.night.before.so.that.the.soap.bubbles.have.a.chance.to.disappear.and.the.solutions.look.the.same.
Review.the.five.key.data.points.of.a.box-and-whisker.plot:.median,.lower.extreme,.upper.extreme,.lower.quartile.and upper.quartile.
Have.students.work.with.a.partner..Each.pair.needs.an.eye.dropper.or.a.pipette,.a.paper.towel,.two.pennies,.two.cups.and.the.Penny.Drop.handout.
•
•
•
•
•
1.
2.
3.
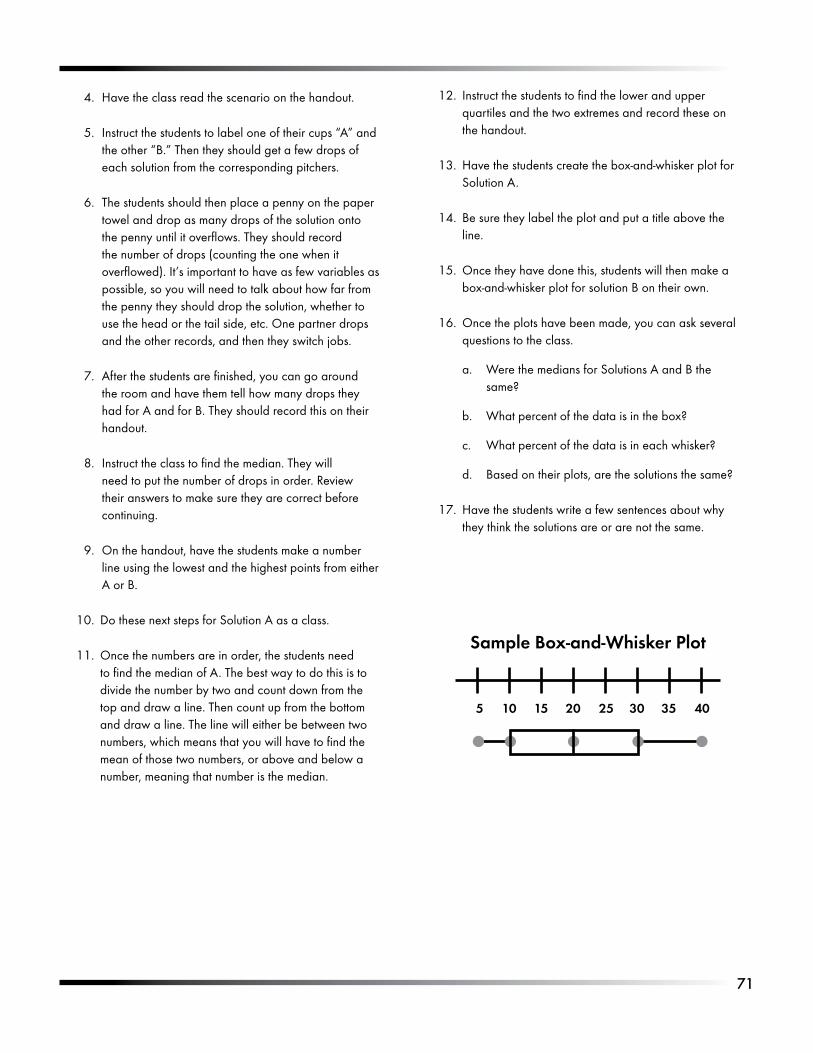
71
Have.the.class.read.the.scenario.on.the.handout.
Instruct.the.students.to.label.one.of.their.cups.“A”.and.the.other.“B.”.Then.they.should.get.a.few.drops.of.each.solution.from.the.corresponding.pitchers.
The.students.should.then.place.a.penny.on.the.paper.towel.and.drop.as.many.drops.of.the.solution.onto.the.penny.until.it.overflows..They.should.record.the.number.of.drops.(counting.the.one.when.it.overflowed)..It’s.important.to.have.as.few.variables.as.possible,.so.you.will.need.to.talk.about.how.far.from.the.penny.they.should.drop.the.solution,.whether.to.use.the.head.or.the.tail.side,.etc..One.partner.drops.and.the.other.records,.and.then.they.switch.jobs.
After.the.students.are.finished,.you.can.go.around.the.room.and.have.them.tell.how.many.drops.they.had.for.A.and.for.B..They.should.record.this.on.their.handout..
Instruct.the.class.to.find.the.median..They.will.need.to.put.the.number.of.drops.in.order..Review.their.answers.to.make.sure.they.are.correct.before.continuing.
On.the.handout,.have.the.students.make.a.number.line.using.the.lowest.and.the.highest.points.from.either.A.or.B.
Do.these.next.steps.for.Solution.A.as.a.class.
Once.the.numbers.are.in.order,.the.students.need.to.find.the.median.of.A..The.best.way.to.do.this.is.to.divide.the.number.by.two.and.count.down.from.the.top.and.draw.a.line..Then.count.up.from.the.bottom.and.draw.a.line..The.line.will.either.be.between.two.numbers,.which.means.that.you.will.have.to.find.the.mean.of.those.two.numbers,.or.above.and.below.a.number,.meaning.that.number.is.the.median.
4.
5.
6.
7.
8.
9.
10.
11.
Instruct.the.students.to.find.the.lower.and.upper.quartiles.and.the.two.extremes.and.record.these.on.the.handout.
Have.the.students.create.the.box-and-whisker.plot.for.Solution.A.
Be.sure.they.label.the.plot.and.put.a.title.above.the.line.
Once.they.have.done.this,.students.will.then.make.a.box-and-whisker.plot.for.solution.B.on.their.own.
Once.the.plots.have.been.made,.you.can.ask.several.questions.to.the.class.
Were.the.medians.for.Solutions.A.and.B.the.same?
What.percent.of.the.data.is.in.the.box?
What.percent.of.the.data.is.in.each.whisker?
Based.on.their.plots,.are.the.solutions.the.same?
Have.the.students.write.a.few.sentences.about.why.they.think.the.solutions.are.or.are.not.the.same.
12.
13.
14.
15.
16.
a.
b.
c.
d.
17.
Sample Box-and-Whisker Plot
5 10 15 20 25 30 35 40
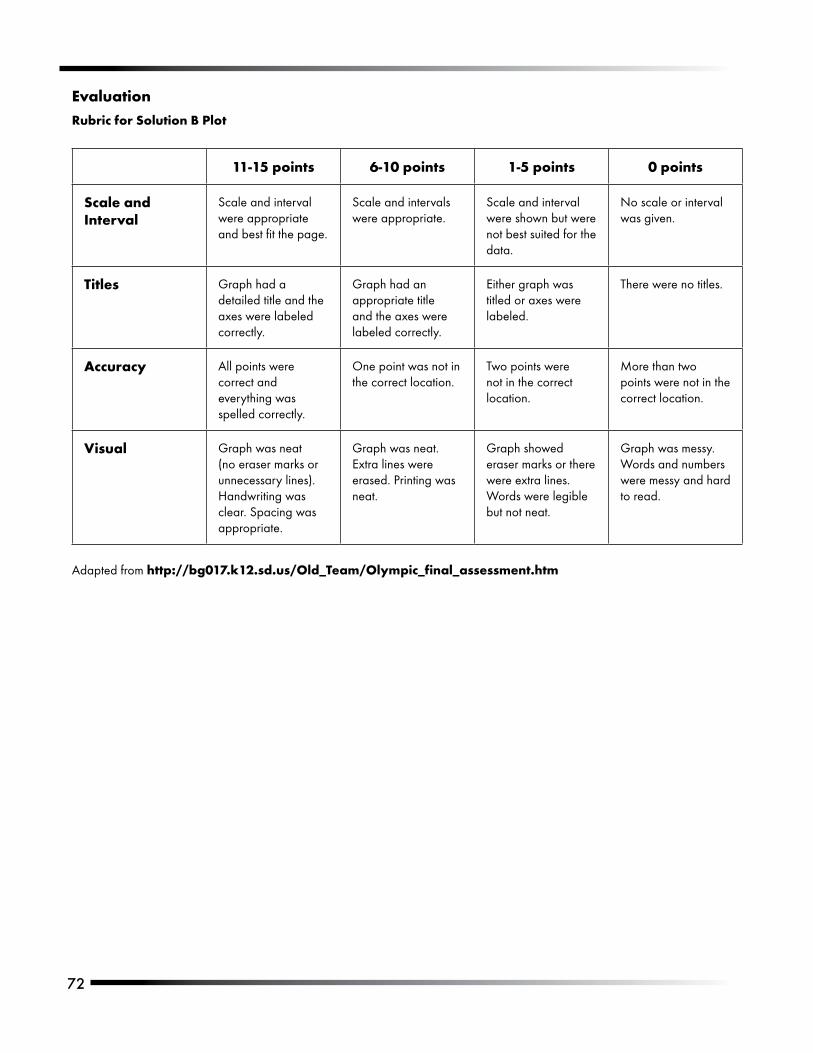
72
EvaluationRubric for Solution B Plot
11-15 points 6-10 points 1-5 points 0 points
Scale and Interval
Scale.and.interval.were.appropriate.and.best.fit.the.page.
Scale.and.intervals.were.appropriate.
Scale.and.interval.were.shown.but.were.not.best.suited.for.the.data.
No.scale.or.interval.was.given.
Titles Graph.had.a.detailed.title.and.the.axes.were.labeled.correctly.
Graph.had.an.appropriate.title.and.the.axes.were.labeled.correctly.
Either.graph.was.titled.or.axes.were.labeled.
There.were.no.titles.
Accuracy All.points.were.correct.and.everything.was.spelled.correctly.
One.point.was.not.in.the.correct.location.
Two.points.were.not.in.the.correct.location.
More.than.two.points.were.not.in.the.correct.location.
Visual Graph.was.neat.(no.eraser.marks.or.unnecessary.lines)..Handwriting.was.clear..Spacing.was.appropriate.
Graph.was.neat..Extra.lines.were.erased..Printing.was.neat.
Graph.showed.eraser.marks.or.there.were.extra.lines..Words.were.legible.but.not.neat.
Graph.was.messy..Words.and.numbers.were.messy.and.hard.to.read.
Adapted.from.http://bg017.k12.sd.us/Old_Team/Olympic_final_assessment.htm.
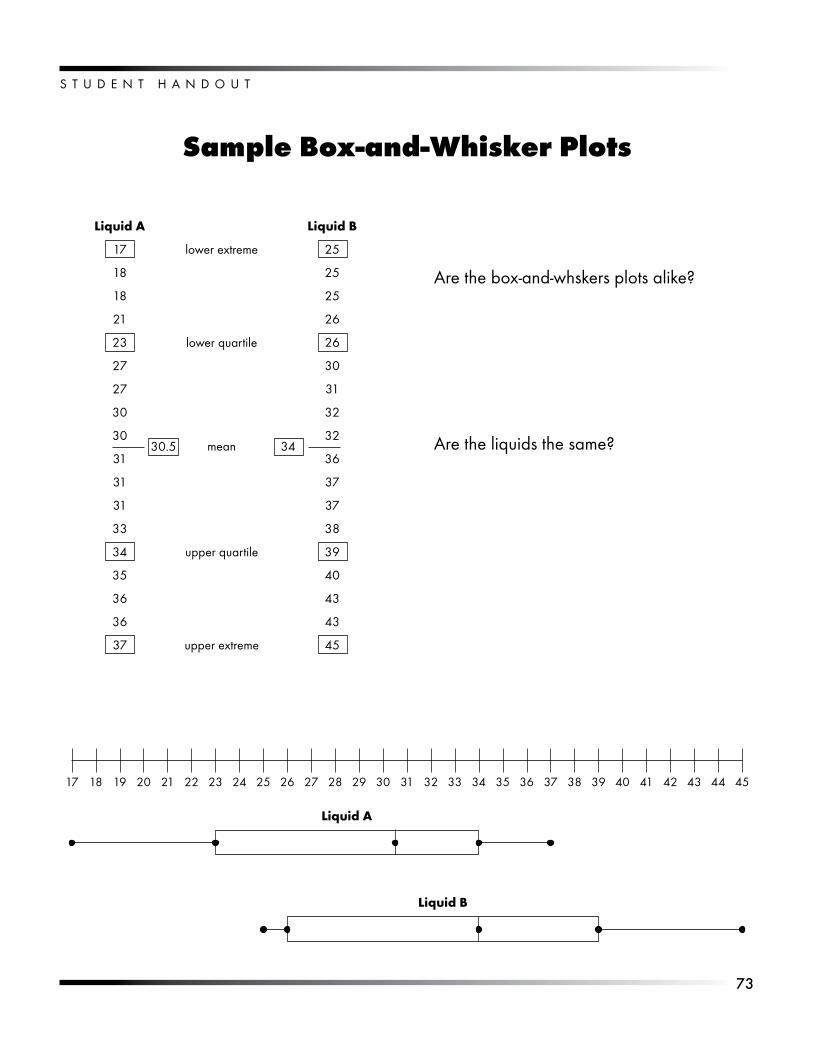
7�
S T U D E N T . H A N D O U T
Sample Box-and-Whisker Plots
. Liquid A Liquid B
. 17. lower.extreme. 25
. 18. . 25
. 18. . 25
. 21. . 26
. 23. lower.quartile. 26
. 27. . 30
. 27. . 31
. 30. . 32
. 30.mean
. 32
. 31. . 36
. 31. . 37
. 31. . 37
. 33. . 38
. 34. upper.quartile. 39
. 35. . 40
. 36. . 43
. 36. . 43
. 37. upper.extreme. 45
30.5 34
Are.the.box-and-whskers.plots.alike?
Are.the.liquids.the.same?
. 17. 18. 19. 20. 21. 22. 23. 24. 25. 26. 27. 28. 29. 30. 31. 32. 33. 34. 35. 36. 37. 38. 39. 40. 41. 42. 43. 44. 45
Liquid A
Liquid B
S T U D E N T . H A N D O U T
7�
Name._____________________________________
Penny DropWhile.cleaning.my.room,.I.found.two.pitchers.of.water..One.was.labeled.A.and.the.other.B..Are.they.the.same?.Can.I.combine.them?.Let’s.experiment.to.find.if.there.is.a.difference.in.the.number.of.drops.of.Solution.A.and.the.number.of.drops.of.Solution.B.that.can.be.placed.on.a.penny?
Directions:Place.a.paper.towel.on.a.level.surface..Place.two.pennies.heads-up.on.the.towel.
You.or.your.partner.should.label.one.cup.“A”.and.the.other.“B.”.Pour.some.of.Solution.A.into.Cup.A.and.some.of.Solution.B.into.Cup.B.
Fill.the.dropper.with.solution.from.Cup.A.
Hold.the.dropper.straight.up.over.the.center.of.one.of.the.pennies.
Keep.the.end.of.the.dropper.one.penny.diameter.from.the.surface.of.the.penny.
Drop.the.solution.onto.the.penny,.one.drop.at.a.time..Count.the.drops.needed.to.cause.the.solution.to.run.over.the.edge.of.the.penny..The.drop.that.makes.the.solution.run.off.the.penny.should.be.counted..
Record.the.number.
Rinse.and.clear.the.dropper..Run.a.second.trial.with.solution.from.Cup.B..Record.the.number.
Solution A trial: Number of drops ________
Solution B trial: Number of drops ________
1.
2.
3.
4.
5.
6.
7.
8.
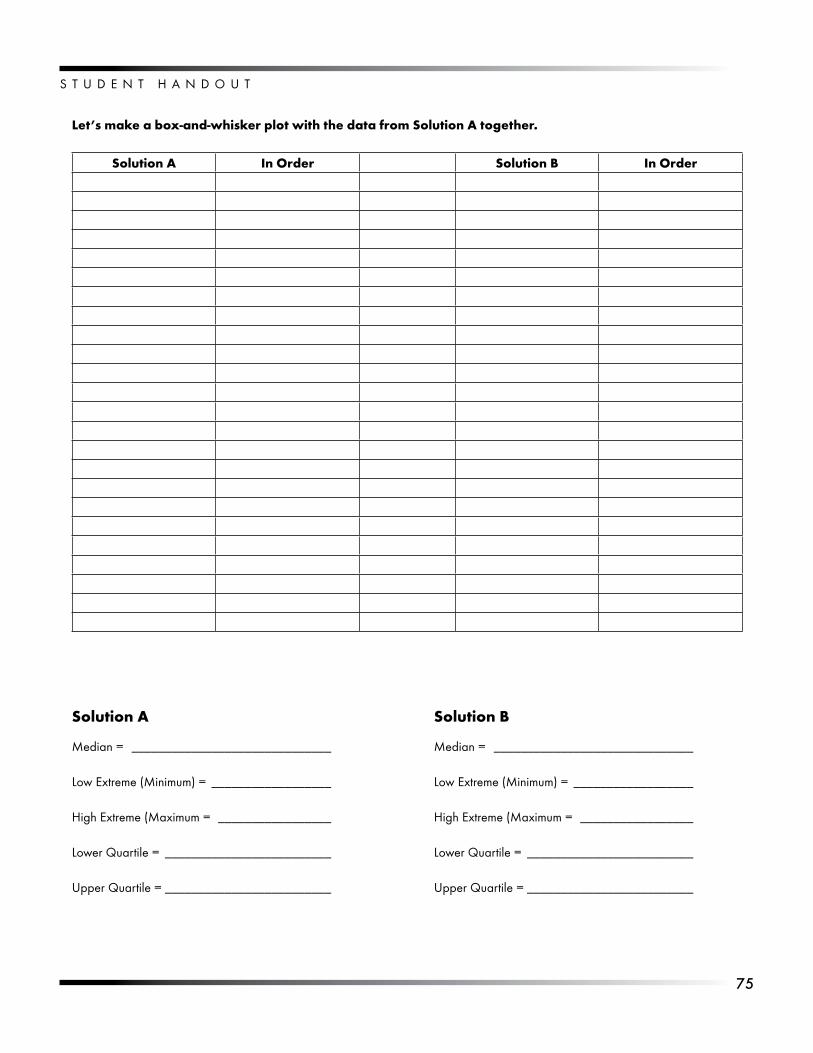
7�
S T U D E N T . H A N D O U T
Let’s make a box-and-whisker plot with the data from Solution A together.
Solution A In Order Solution B In Order
Solution A
Median.=..______________________________
Low.Extreme.(Minimum).=..__________________
High.Extreme.(Maximum.=.._________________
Lower.Quartile.=.._________________________
Upper.Quartile.=._________________________
Solution B
Median.=..______________________________
Low.Extreme.(Minimum).=..__________________
High.Extreme.(Maximum.=.._________________
Lower.Quartile.=.._________________________
Upper.Quartile.=._________________________
S T U D E N T . H A N D O U T
7�
Make box-and-whisker plot here:
Are the solutions alike? Why or why not?
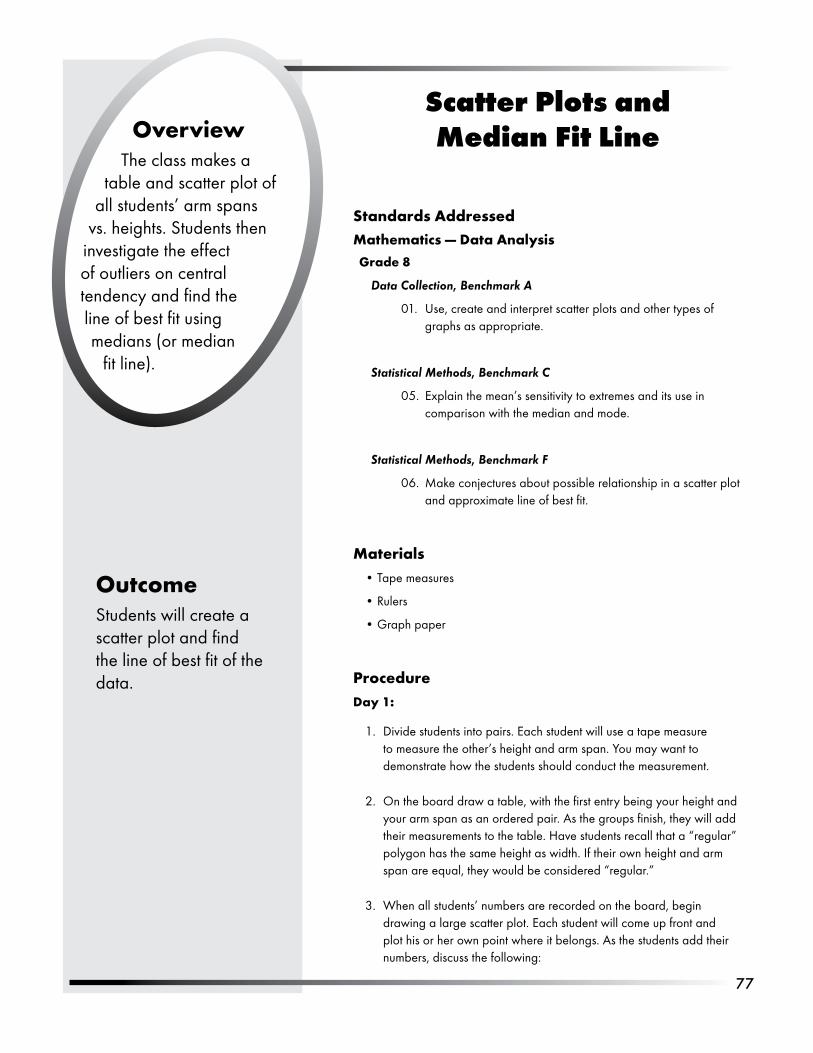
77
Scatter Plots and Median Fit LineOverview
.The.class.makes.a.table.and.scatter.plot.of.
all.students’.arm.spans.vs..heights..Students.then.
investigate.the.effect.of.outliers.on.central.tendency.and.find.the.line.of.best.fit.using.medians.(or.median.
fit.line).
Outcome Students.will.create.a.scatter.plot.and.find.the.line.of.best.fit.of.the.data.
Standards AddressedMathematics — Data Analysis
Grade 8
Data Collection, Benchmark A
01.. Use,.create.and.interpret.scatter.plots.and.other.types.of.graphs.as.appropriate.
Statistical Methods, Benchmark C
05.. Explain.the.mean’s.sensitivity.to.extremes.and.its.use.in.comparison.with.the.median.and.mode.
Statistical Methods, Benchmark F
06.. Make.conjectures.about.possible.relationship.in.a.scatter.plot.and.approximate.line.of.best.fit.
MaterialsTape.measures
Rulers
Graph.paper
ProcedureDay 1:
Divide.students.into.pairs..Each.student.will.use.a.tape.measure.to.measure.the.other’s.height.and.arm.span..You.may.want.to.demonstrate.how.the.students.should.conduct.the.measurement.
On.the.board.draw.a.table,.with.the.first.entry.being.your.height.and.your.arm.span.as.an.ordered.pair..As.the.groups.finish,.they.will.add.their.measurements.to.the.table..Have.students.recall.that.a.“regular”.polygon.has.the.same.height.as.width..If.their.own.height.and.arm.span.are.equal,.they.would.be.considered.“regular.”
When.all.students’.numbers.are.recorded.on.the.board,.begin.drawing.a.large.scatter.plot..Each.student.will.come.up.front.and.plot.his.or.her.own.point.where.it.belongs..As.the.students.add.their.numbers,.discuss.the.following:
•
•
•
1.
2.
3.
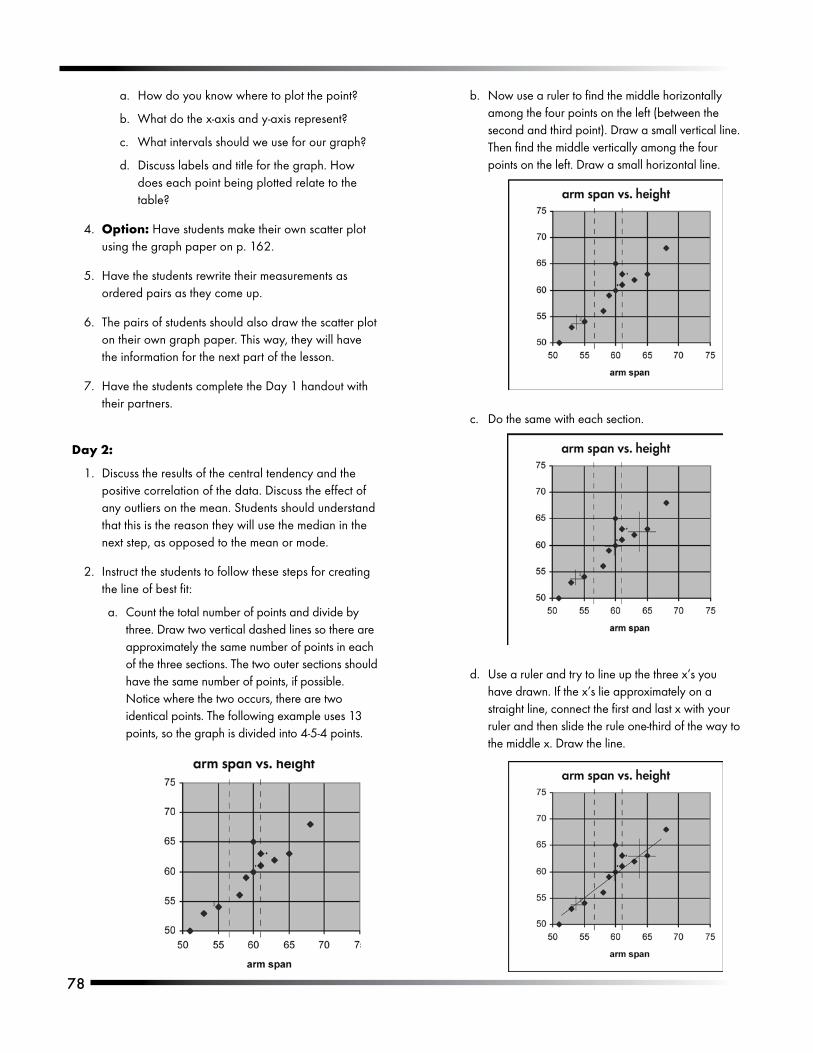
78
How.do.you.know.where.to.plot.the.point?.
What.do.the.x-axis.and.y-axis.represent?.
What.intervals.should.we.use.for.our.graph?.
Discuss.labels.and.title.for.the.graph..How.does.each.point.being.plotted.relate.to.the.table?.
Option: Have.students.make.their.own.scatter.plot.using.the.graph.paper.on.p..162.
Have.the.students.rewrite.their.measurements.as.ordered.pairs.as.they.come.up.
The.pairs.of.students.should.also.draw.the.scatter.plot.on.their.own.graph.paper..This.way,.they.will.have.the.information.for.the.next.part.of.the.lesson.
Have.the.students.complete.the.Day.1.handout.with.their.partners.
Day 2:
Discuss.the.results.of.the.central.tendency.and.the.positive.correlation.of.the.data..Discuss.the.effect.of.any.outliers.on.the.mean..Students.should.understand.that.this.is.the.reason.they.will.use.the.median.in.the.next.step,.as.opposed.to.the.mean.or.mode.
Instruct.the.students.to.follow.these.steps.for.creating.the.line.of.best.fit:
Count.the.total.number.of.points.and.divide.by.three..Draw.two.vertical.dashed.lines.so.there.are.approximately.the.same.number.of.points.in.each.of.the.three.sections..The.two.outer.sections.should.have.the.same.number.of.points,.if.possible..Notice.where.the.two.occurs,.there.are.two.identical.points..The.following.example.uses.13.points,.so.the.graph.is.divided.into.4-5-4.points.
a.
b.
c.
d.
4.
5.
6.
7.
1.
2.
a.
Now.use.a.ruler.to.find.the.middle.horizontally.among.the.four.points.on.the.left.(between.the.second.and.third.point)..Draw.a.small.vertical.line..Then.find.the.middle.vertically.among.the.four.points.on.the.left..Draw.a.small.horizontal.line.
b.
Do.the.same.with.each.section.c.
Use.a.ruler.and.try.to.line.up.the.three.x’s.you.have.drawn..If.the.x’s.lie.approximately.on.a.straight.line,.connect.the.first.and.last.x.with.your.ruler.and.then.slide.the.rule.one-third.of.the.way.to.the.middle.x..Draw.the.line.
d.
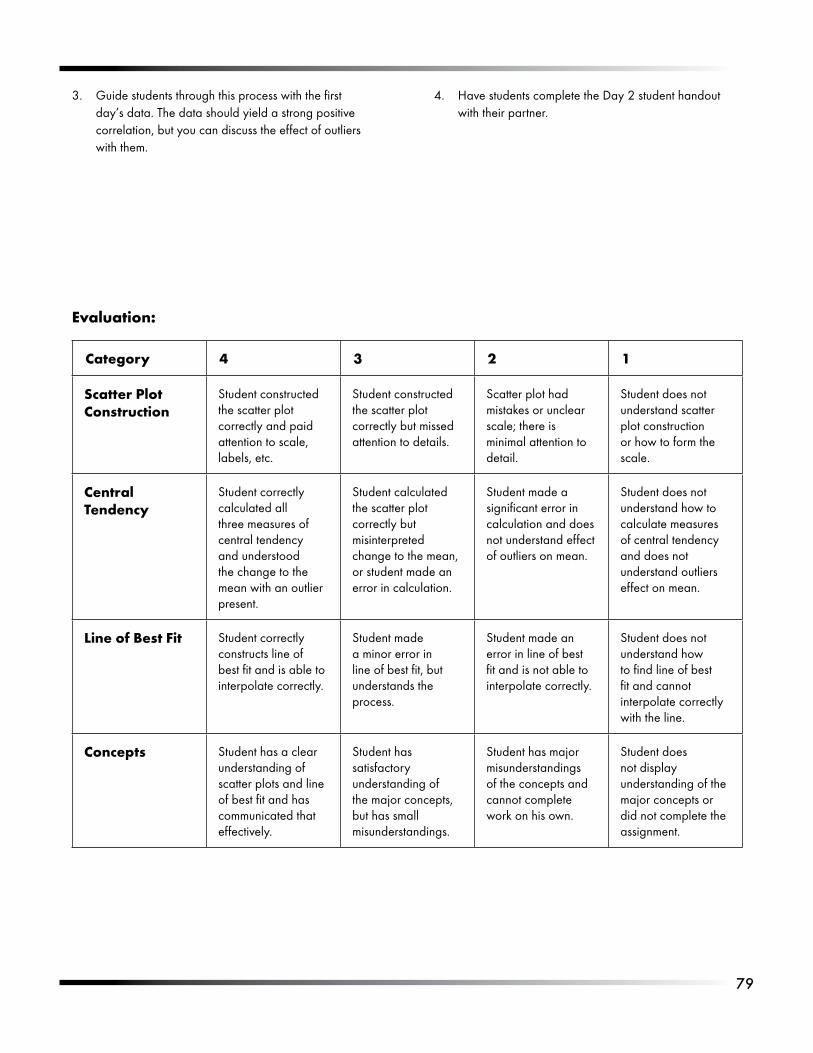
7�
Have.students.complete.the.Day.2.student.handout.with.their.partner.
4.
Evaluation:
Category 4 3 2 1
Scatter Plot Construction
Student.constructed.the.scatter.plot.correctly.and.paid.attention.to.scale,.labels,.etc.
Student.constructed.the.scatter.plot.correctly.but.missed.attention.to.details.
Scatter.plot.had.mistakes.or.unclear.scale;.there.is.minimal.attention.to.detail.
Student.does.not.understand.scatter.plot.construction.or.how.to.form.the.scale.
Central Tendency
Student.correctly.calculated.all.three.measures.of.central.tendency.and.understood.the.change.to.the.mean.with.an.outlier.present.
Student.calculated.the.scatter.plot.correctly.but.misinterpreted.change.to.the.mean,.or.student.made.an.error.in.calculation.
Student.made.a.significant.error.in.calculation.and.does.not.understand.effect.of.outliers.on.mean.
Student.does.not.understand.how.to.calculate.measures.of.central.tendency.and.does.not.understand.outliers.effect.on.mean.
Line of Best Fit Student.correctly.constructs.line.of.best.fit.and.is.able.to.interpolate.correctly.
Student.made.a.minor.error.in.line.of.best.fit,.but.understands.the.process.
Student.made.an.error.in.line.of.best.fit.and.is.not.able.to.interpolate.correctly.
Student.does.not.understand.how.to.find.line.of.best.fit.and.cannot.interpolate.correctly.with.the.line.
Concepts Student.has.a.clear.understanding.of.scatter.plots.and.line.of.best.fit.and.has.communicated.that.effectively.
Student.has.satisfactory.understanding.of.the.major.concepts,.but.has.small.misunderstandings.
Student.has.major.misunderstandings.of.the.concepts.and.cannot.complete.work.on.his.own.
Student.does.not.display.understanding.of.the.major.concepts.or.did.not.complete.the.assignment.
Guide.students.through.this.process.with.the.first.day’s.data..The.data.should.yield.a.strong.positive.correlation,.but.you.can.discuss.the.effect.of.outliers.with.them.
3.
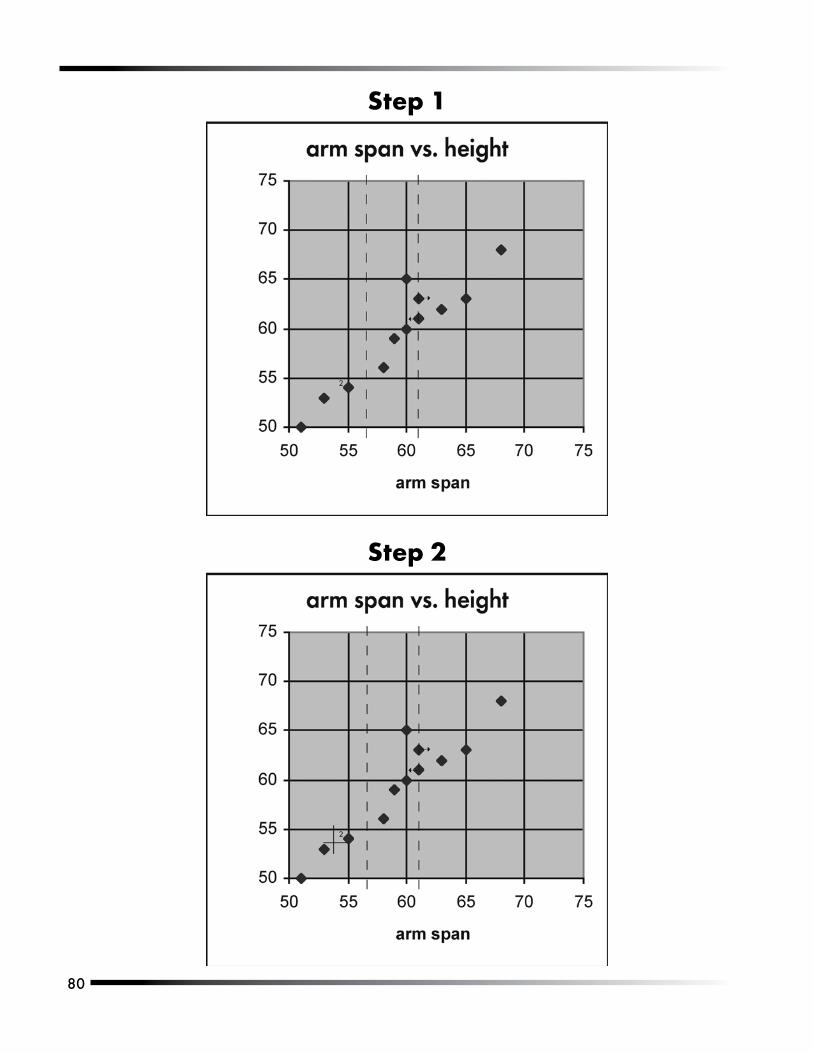
80
Step 1
Step 2
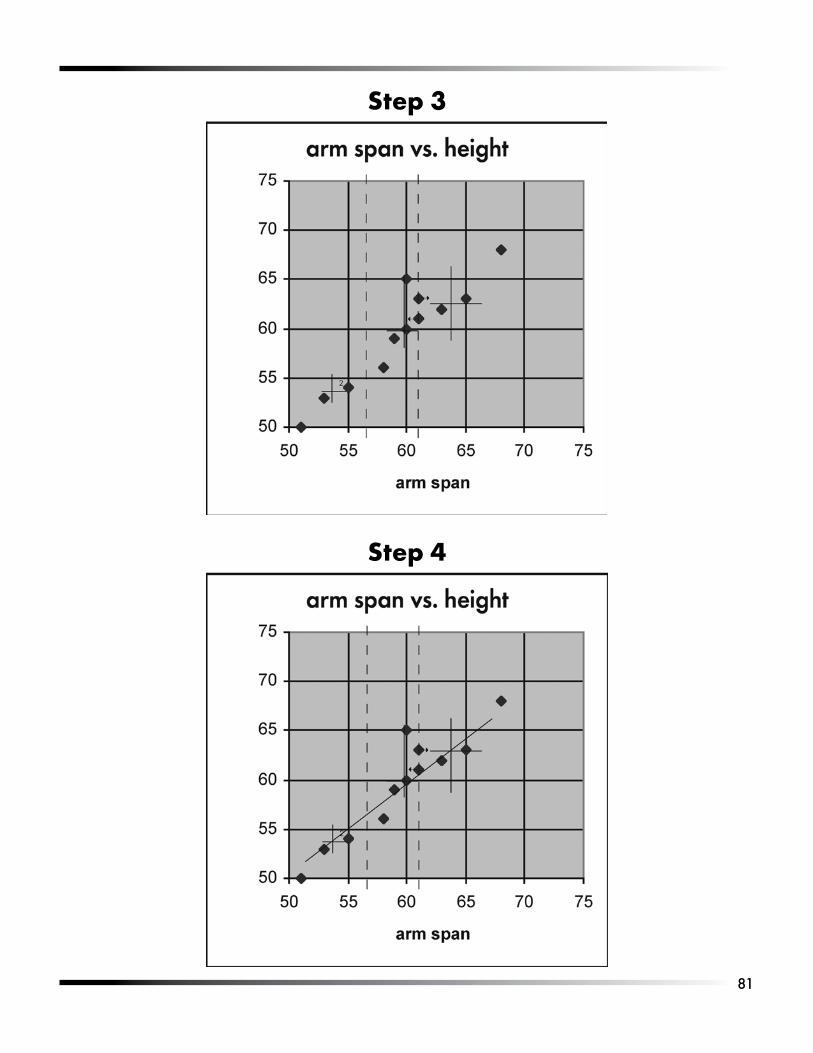
81
Step 3
Step 4
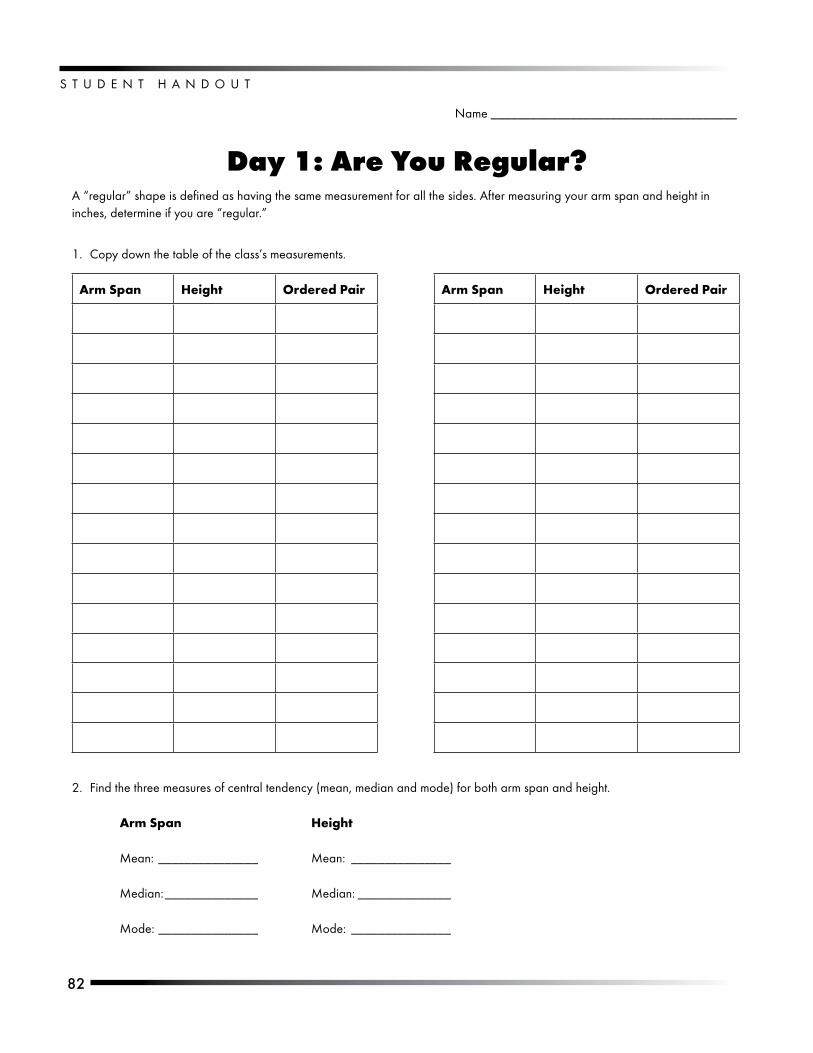
S T U D E N T . H A N D O U T
82
Name._____________________________________
Day 1: Are You Regular? A.“regular”.shape.is.defined.as.having.the.same.measurement.for.all.the.sides..After.measuring.your.arm.span.and.height.in.inches,.determine.if.you.are.“regular.”
Copy.down.the.table.of.the.class’s.measurements.1.
Arm Span Height Ordered Pair Arm Span Height Ordered Pair
Find.the.three.measures.of.central.tendency.(mean,.median.and.mode).for.both.arm.span.and.height.
Arm Span Height
Mean:._______________ . Mean:. _______________
Median:.______________ . Median:.______________
Mode:._______________ . Mode:. _______________
2.
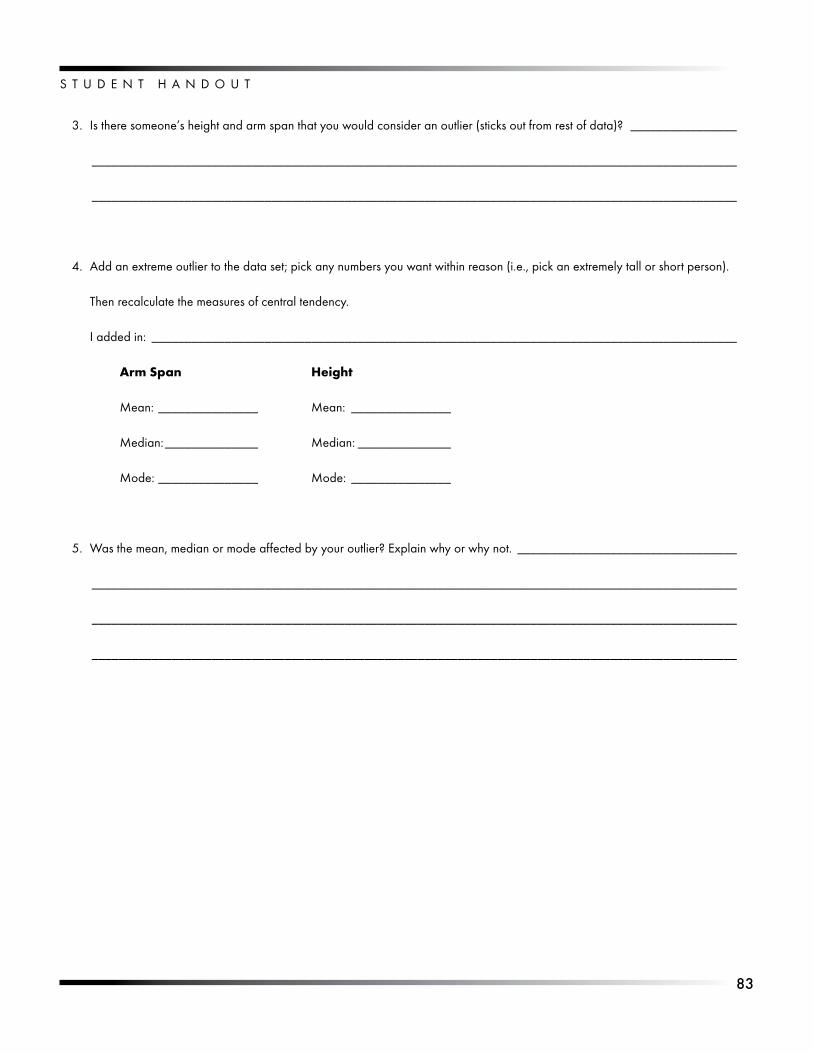
8�
S T U D E N T . H A N D O U T
Is.there.someone’s.height.and.arm.span.that.you.would.consider.an.outlier.(sticks.out.from.rest.of.data)?..________________
._________________________________________________________________________________________________
._________________________________________________________________________________________________
Add.an.extreme.outlier.to.the.data.set;.pick.any.numbers.you.want.within.reason.(i.e.,.pick.an.extremely.tall.or.short.person).
Then.recalculate.the.measures.of.central.tendency..
I.added.in:. ________________________________________________________________________________________
Arm Span Height
Mean:._______________ . Mean:. _______________
Median:.______________ . Median:.______________
Mode:._______________ . Mode:. _______________
Was.the.mean,.median.or.mode.affected.by.your.outlier?.Explain.why.or.why.not.. _________________________________
._________________________________________________________________________________________________
._________________________________________________________________________________________________
._________________________________________________________________________________________________
3.
4.
5.
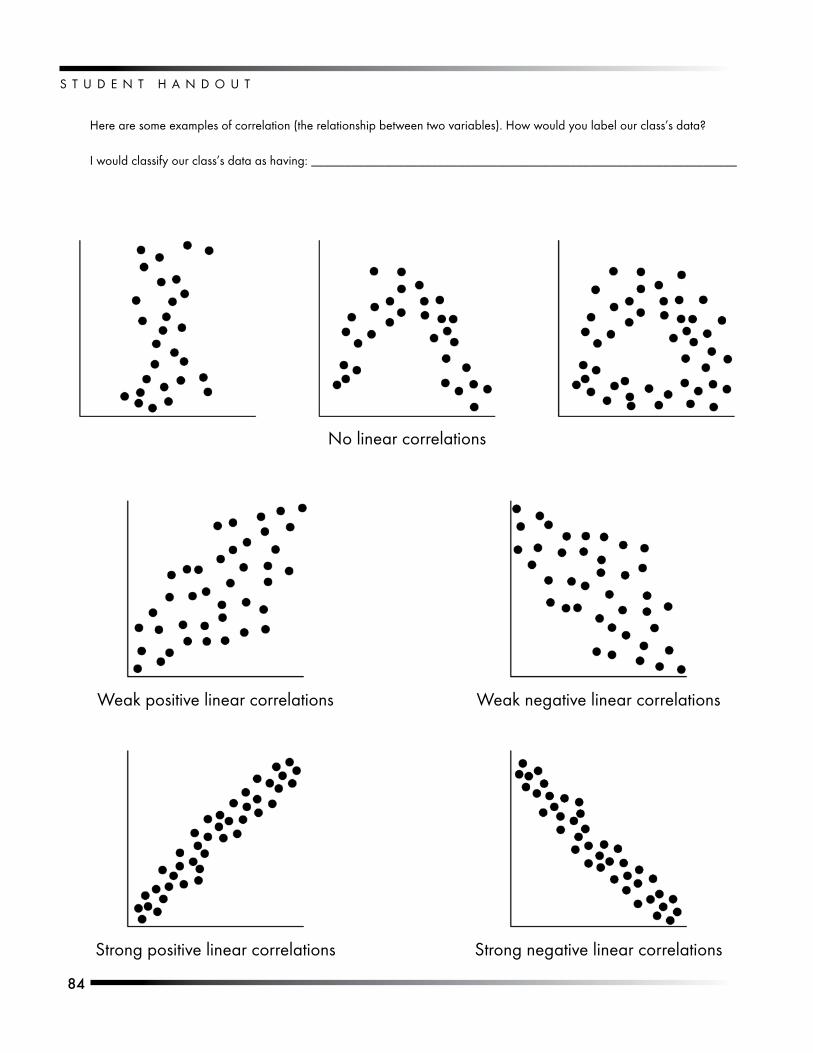
S T U D E N T . H A N D O U T
8�
Here.are.some.examples.of.correlation.(the.relationship.between.two.variables)..How.would.you.label.our.class’s.data?
I.would.classify.our.class’s.data.as.having:..________________________________________________________________ .
No.linear.correlations
Weak.positive.linear.correlations Weak.negative.linear.correlations
Strong.positive.linear.correlations Strong.negative.linear.correlations
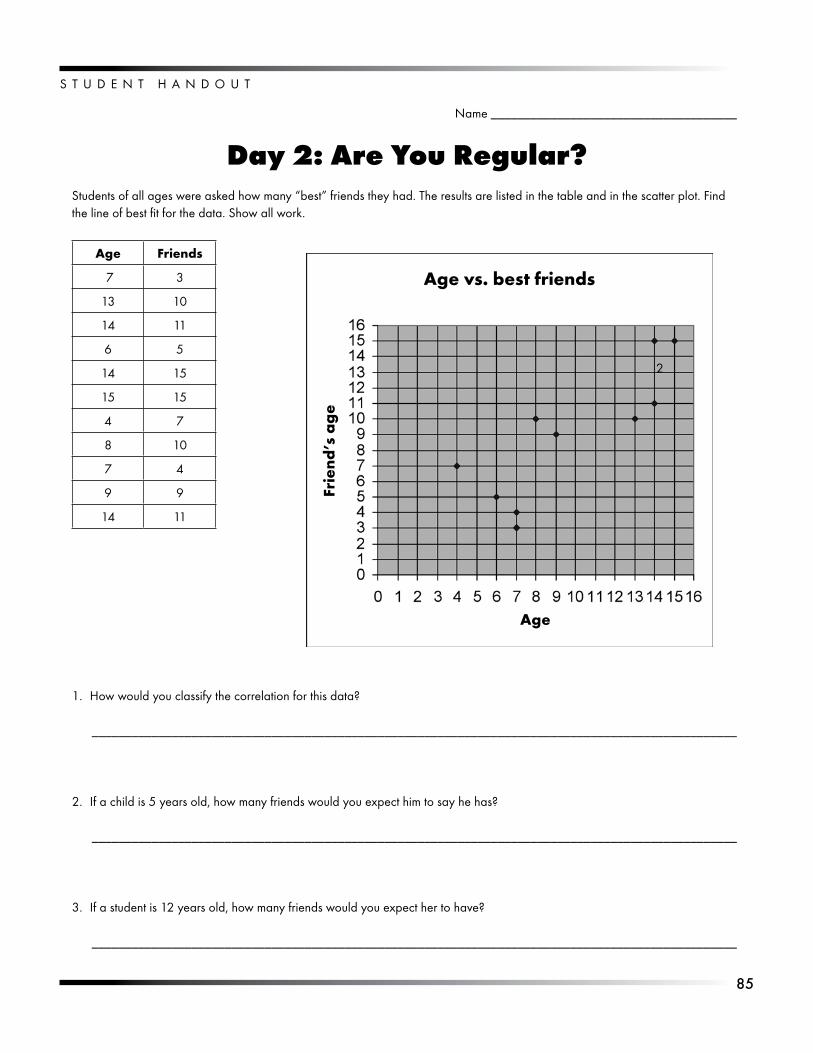
8�
S T U D E N T . H A N D O U T
Name._____________________________________
Day 2: Are You Regular?Students.of.all.ages.were.asked.how.many.“best”.friends.they.had..The.results.are.listed.in.the.table.and.in.the.scatter.plot..Find.the.line.of.best.fit.for.the.data..Show.all.work.
Age Friends
.7 3
13 10
14 11
6 5
14 15
15 15
4 7
8 10
7 4
9 9
14 11
How.would.you.classify.the.correlation.for.this.data?
._________________________________________________________________________________________________
If.a.child.is.5.years.old,.how.many.friends.would.you.expect.him.to.say.he.has?
._________________________________________________________________________________________________
If.a.student.is.12.years.old,.how.many.friends.would.you.expect.her.to.have?
._________________________________________________________________________________________________
1.
2.
3.
2
Frie
nd’s
ag
e
Age
Age vs. best friends
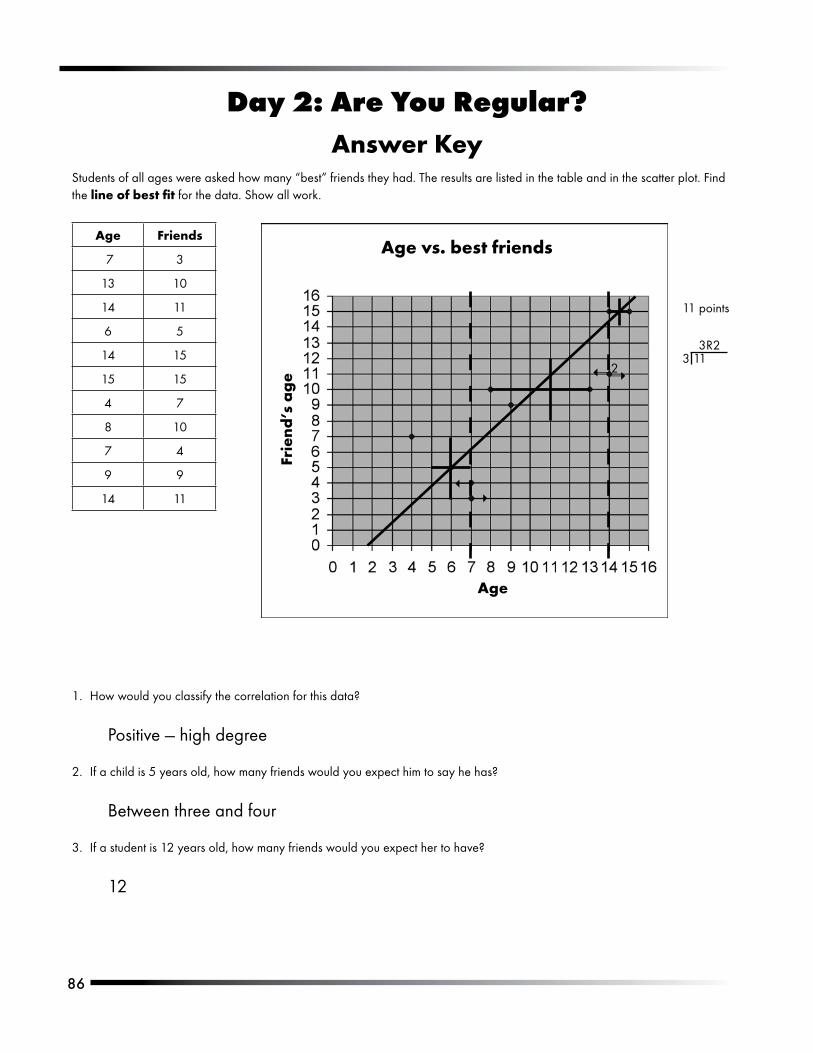
8�
Day 2: Are You Regular? Answer Key
Students.of.all.ages.were.asked.how.many.“best”.friends.they.had..The.results.are.listed.in.the.table.and.in.the.scatter.plot..Find.the.line of best fit for.the.data..Show.all.work.
Age Friends
.7 3
13 10
14 11
6 5
14 15
15 15
4 7
8 10
7 4
9 9
14 11
How.would.you.classify.the.correlation.for.this.data?
Positive.—.high.degree
If.a.child.is.5.years.old,.how.many.friends.would.you.expect.him.to.say.he.has?
Between.three.and.four
If.a.student.is.12.years.old,.how.many.friends.would.you.expect.her.to.have?
12
1.
2.
3.
2
11.points.
3R23.11
➝
➝
➝
➝
Frie
nd’s
ag
e
Age
Age vs. best friends
87
Monopoly MadnessOverviewUsing.information.from.
the.game.Monopoly,.students.compare.the.
distance.from.“Go”.and.the.cost.of.the.property.using.a.
scatter.plot,.make.a.median.fit.line.and.determine.why.certain.points.are.away.from.the.line..Students.can.also.determine.if.this.line.could.be.used.for.prediction..
ObjectiveStudents.will.show.that.they.can.create.a.scatter.plot.and.make.a.median.fit.line.
Standards AddressedMathematics — Data Analysis
Grade 7
Data Collection, Benchmark A
01.. .Read,.create.and.interpret.box-and-whisker.plots,.stem-and-leaf.plots,.and.other.types.of.graphs,.when.appropriate..
Grade 8
Data Collection, Benchmark A
01.. Use,.create.and.interpret.scatter.plots.and.other.types.of.graphs.as.appropriate..
Statistical Methods, Benchmark F
06.. Make.conjectures.about.possible.relationship.in.a.scatter.plot.and.approximate.line.of.best.fit.
09.. Construct.convincing.arguments.based.on.analysis.of.data.and.interpretation.of.graphs..
MaterialsGraph.paper
Rulers
ProcedureAsk.how.many.students.have.played.Monopoly.and.what.they.know.about.the.game.board.
Allow.the.students.to.work.with.a.partner.or.in.groups.of.three,.but.make.sure.each.student.makes.his.or.her.own.graph.
Distribute.the.Monopoly.Madness.handout.and.ask.the.students.to.make.scatter.plots.that.compare.the.distance.of.a.property.from.“Go”.and.the.cost.of.the.property..(Distance.is.the.independent.variable.because.cost.is.determined.by.distance;.therefore,.distance.will.be.on.the.x-axis.)
Once.graphs.are.completed,.share.them.with.the.class..Find.out.if.everyone.used.the.same.intervals.and.how.the.graphs.with.different.intervals.might.look.different.even.though.the.same.data.are.
•
•
1.
2.
3.
4.
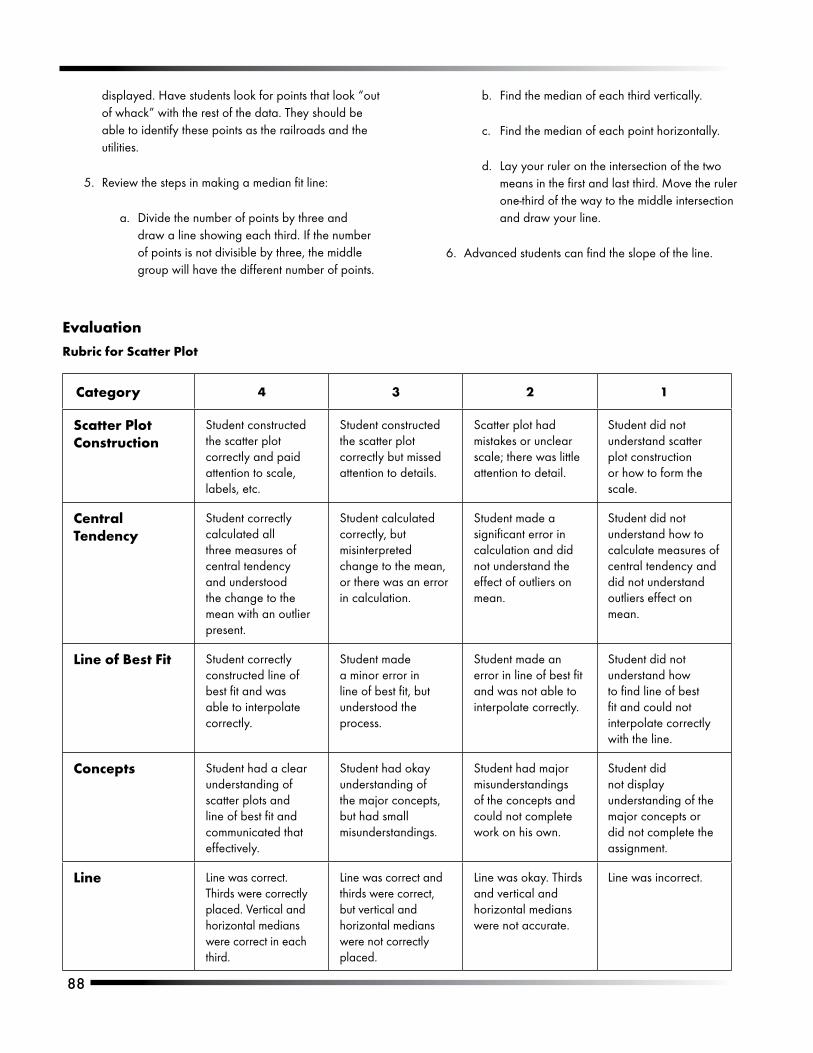
88
displayed..Have.students.look.for.points.that.look.“out.of.whack”.with.the.rest.of.the.data..They.should.be.able.to.identify.these.points.as.the.railroads.and.the.utilities.
Review.the.steps.in.making.a.median.fit.line:
Divide.the.number.of.points.by.three.and.draw.a.line.showing.each.third..If.the.number.of.points.is.not.divisible.by.three,.the.middle.group.will.have.the.different.number.of.points.
5.
a.
Find.the.median.of.each.third.vertically.
Find.the.median.of.each.point.horizontally.
Lay.your.ruler.on.the.intersection.of.the.two.means.in.the.first.and.last.third..Move.the.ruler.one-third.of.the.way.to.the.middle.intersection.and.draw.your.line.
Advanced.students.can.find.the.slope.of.the.line.
b.
c.
d.
6.
EvaluationRubric for Scatter Plot
Category 4 3 2 1
Scatter Plot Construction
Student.constructed.the.scatter.plot.correctly.and.paid.attention.to.scale,.labels,.etc.
Student.constructed.the.scatter.plot.correctly.but.missed.attention.to.details.
Scatter.plot.had.mistakes.or.unclear.scale;.there.was.little.attention.to.detail.
Student.did.not.understand.scatter.plot.construction.or.how.to.form.the.scale.
Central Tendency
Student.correctly.calculated.all.three.measures.of.central.tendency.and.understood.the.change.to.the.mean.with.an.outlier.present.
Student.calculated.correctly,.but.misinterpreted.change.to.the.mean,.or.there.was.an.error.in.calculation.
Student.made.a.significant.error.in.calculation.and.did.not.understand.the.effect.of.outliers.on.mean.
Student.did.not.understand.how.to.calculate.measures.of.central.tendency.and.did.not.understand.outliers.effect.on.mean.
Line of Best Fit Student.correctly.constructed.line.of.best.fit.and.was.able.to.interpolate.correctly.
Student.made.a.minor.error.in.line.of.best.fit,.but.understood.the.process.
Student.made.an.error.in.line.of.best.fit.and.was.not.able.to.interpolate.correctly.
Student.did.not.understand.how.to.find.line.of.best.fit.and.could.not.interpolate.correctly.with.the.line.
Concepts Student.had.a.clear.understanding.of.scatter.plots.and.line.of.best.fit.and.communicated.that.effectively.
Student.had.okay.understanding.of.the.major.concepts,.but.had.small.misunderstandings.
Student.had.major.misunderstandings.of.the.concepts.and.could.not.complete.work.on.his.own.
Student.did.not.display.understanding.of.the.major.concepts.or.did.not.complete.the.assignment.
Line Line.was.correct..Thirds.were.correctly.placed..Vertical.and.horizontal.medians.were.correct.in.each.third.
Line.was.correct.and.thirds.were.correct,.but.vertical.and.horizontal.medians.were.not.correctly.placed.
Line.was.okay..Thirds.and.vertical.and.horizontal.medians.were.not.accurate.
Line.was.incorrect.
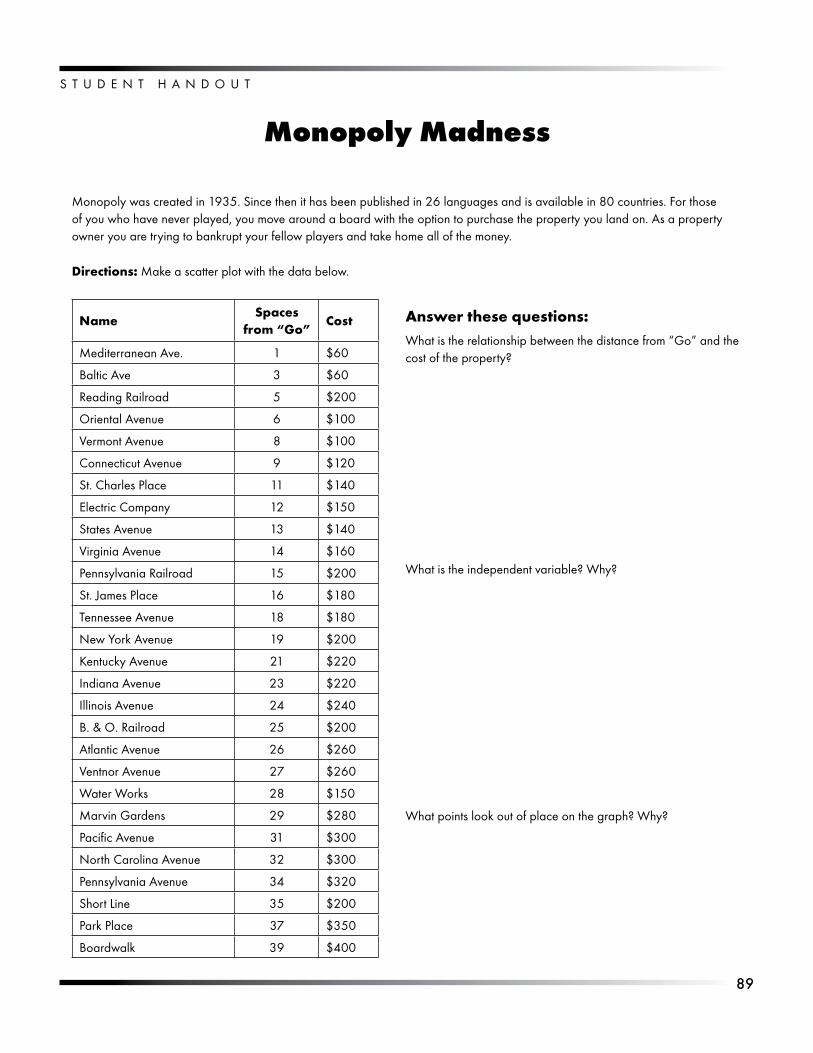
8�
S T U D E N T . H A N D O U T
Monopoly Madness
Monopoly.was.created.in.1935..Since.then.it.has.been.published.in.26.languages.and.is.available.in.80.countries..For.those.of.you.who.have.never.played,.you.move.around.a.board.with.the.option.to.purchase.the.property.you.land.on..As.a.property.owner.you.are.trying.to.bankrupt.your.fellow.players.and.take.home.all.of.the.money.
Directions: Make.a.scatter.plot.with.the.data.below..
NameSpaces
from “Go”Cost
Mediterranean.Ave. 1 $60
Baltic.Ave 3 $60
Reading.Railroad 5 $200
Oriental.Avenue 6 $100
Vermont.Avenue 8 $100
Connecticut.Avenue 9 $120
St..Charles.Place 11 $140
Electric.Company 12 $150
States.Avenue 13 $140
Virginia.Avenue 14 $160
Pennsylvania.Railroad 15 $200
St..James.Place 16 $180
Tennessee.Avenue 18 $180
New.York.Avenue 19 $200
Kentucky.Avenue 21 $220
Indiana.Avenue 23 $220
Illinois.Avenue 24 $240
B..&.O..Railroad 25 $200
Atlantic.Avenue 26 $260
Ventnor.Avenue 27 $260
Water.Works 28 $150
Marvin.Gardens 29 $280
Pacific.Avenue 31 $300
North.Carolina.Avenue 32 $300
Pennsylvania.Avenue 34 $320
Short.Line 35 $200
Park.Place 37 $350
Boardwalk 39 $400
Answer these questions:What.is.the.relationship.between.the.distance.from.“Go”.and.the.cost.of.the.property?
What.is.the.independent.variable?.Why?
What.points.look.out.of.place.on.the.graph?.Why?

�0
http://www.WesternReservePublicMedia.org/quizbus
Video 4Doing Data Projects

��
Data Projects — Basic Information
What Is a Data Project?A.data.project.is.an.exercise.in.carrying.out.a.statistical.investigation..It.includes.the.formation.of.a.question,.the.collection.of.data,.the.analysis.of.data.and.a.conclusion.that.answers.the.original.question..Sounds.kind.of.like.the.scientific.method,.doesn’t.it?
Why Do a Data Project?Data.projects.allow.students.to.see.and.do.all.phases.of.a.statistical.investigation..It.integrates.information.the.students.have.learned.with.real-life.problems.that.they.are.trying.to.solve..The.concept.should.help.them.understand.that.they.can.use.information.from.data.projects.to.make.life.decisions.
What Types of Projects Are There?Projects.can.either.be.formed.around.a.survey.or.around.an.experiment..A survey.asks.participants.questions.that.will.help.the.surveyor.to.solve.the.problem..If.a.survey.asks.every.member.of.a.population,.that.survey.becomes.a census..We’re.all.familiar.with.the.U.S..Census,.which.is.supposed.to.get.data.from.every.person.in.the.United.States..Another.example.of.a.census.is.if.you.want.to.know.what.the.favorite.food.is.of.the.people.in.your.class,.and.you.ask.everyone.in.your.class,.your.class.becomes.the.population. If.you.only.ask.some.of.the.people.in.the.population,.or.a.sample.of.the.population,.that.is.called.a.sample.survey..The.wording.of.the.questions.is.very.important..An.experiment.is.an.“event”.that.is.designed.to.get.information.about.the.question.you.have.posed.
What Are the Essential Concerns of a Data Project?When.creating.a.data.project,.these.concepts.should.be.considered:
What.is.the.question.to.be.answered?
How.will.you.select.your sample (from.the.target.population).and.how.many.will.you.ask?
How.will.you.collect.your.data?.How.will.you.assure.randomness?
What.graphs and charts.will.you.make.to.show.your.data?
What.does.each.graph.say?
What.conclusions.can.you.draw.from.your.data?
Are.there.things.you.would.do.differently.or.are.there.future.topics.that.should.be.studied?
What Are Some Key Concepts in Doing Data Projects?
Collect.your.own.data.
Remember.the.difference.between.measurement.data.(quantitative).and.categorical.data.(qualitative)..Use.measurement.data.as.much.as.possible.
Projects.are.best.done.in.groups,.with.everyone.sharing.both.the.original.idea.and.the.work.in.finding.the.conclusion.
Make.sure.the.following.basic.elements.of.graphs.are.complete:
The.type.of.graph.you.make.fits.the.data.you.gathered
The.axes.are.labeled
The.graph.has.a.title
The.intervals.on.the.axes.are.consistent
The.data.collected.really.supports.the.conclusion.you.reach.
An.oral.presentation.of.the.project.gives.the.experience.of.speaking.mathematically.about.project.ideas.
1.
2.
3.
4.
5.
6.
7.
1.
2.
3.
4.
•
•
•
•
5.
6.
��
The Need to Use a Random SampleOverview
Students.attempt.to.find.the.mean.area.of.a.set.of.
100.rectangles,.first.as.an.estimate,.second.by.making.a.judgment.and.last.by.using.a.random.sample.
ObjectiveStudents.will.learn.how.to.find.the.mean.of.a.rectangle.using.three.different.methods:.guess,.judgment.sample.and.random.sample.
Standards AddressedMathematics — Data Analysis
Grade 4
Data Collection, Benchmark C
02.. Represent.and.interpret.data.using.tables,.bar.graphs,.line.plots.and.line.graphs.
Data Collection, Benchmark C
04.. Compare.different.representations.of.the.same.data.to.evaluate.how.well.each.representation.shows.important.aspects.of.the.data,.and.identify.appropriate.ways.to.display.the.data.
Statistical Methods, Benchmark E
07.. Identify.the.median.of.a.set.of.data.and.describe.what.it.indicates.about.the.data.
Grade 6
Statistical Methods, Benchmark G
06.. Make.logical.inferences.from.statistical.data.
Grade 8
Statistical Methods, Benchmark D
08.. Describe.how.the.relative.size.of.a.sample.compared.to.the.target.population.affects.the.validity.of.predictions.
Statistical Methods, Benchmark F
09.. Construct.convincing.arguments.based.on.analysis.of.data.and.interpretation.of.graphs.
MaterialsGraphing.calculator.(optional)•
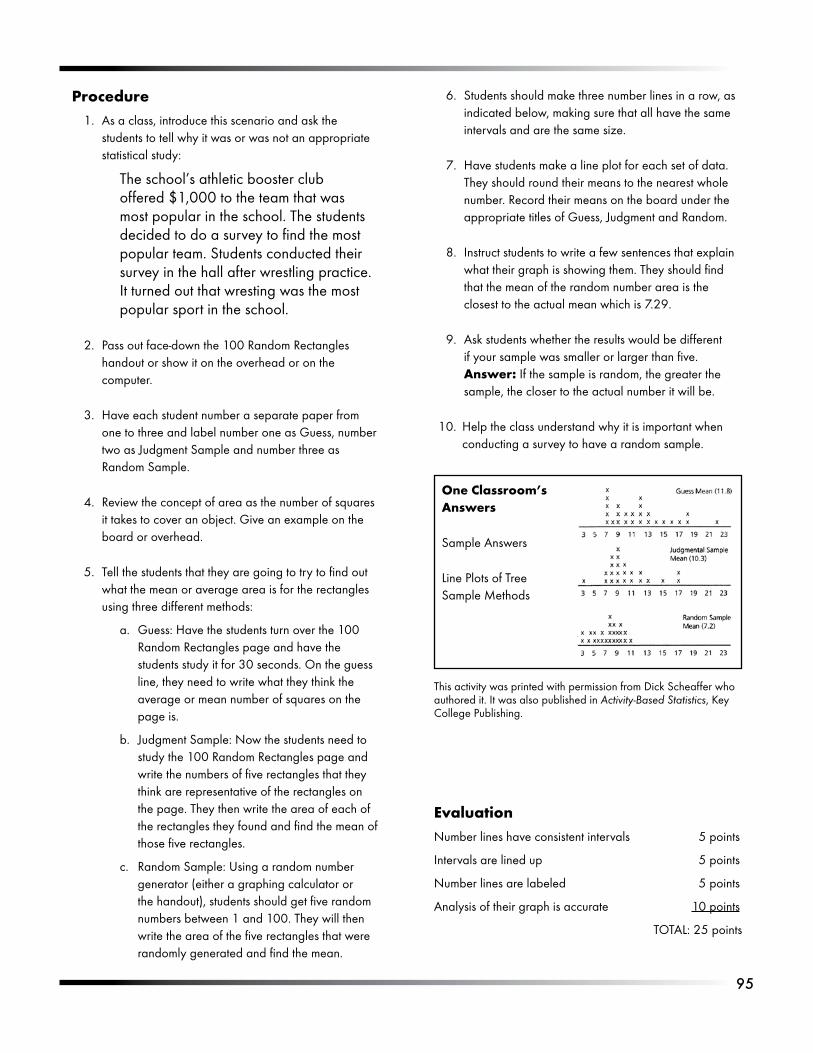
��
ProcedureAs.a.class,.introduce.this.scenario.and.ask.the.students.to.tell.why.it.was.or.was.not.an.appropriate.statistical.study:
The.school’s.athletic.booster.club.offered.$1,000.to.the.team.that.was.most.popular.in.the.school..The.students.decided.to.do.a.survey.to.find.the.most.popular.team..Students.conducted.their.survey.in.the.hall.after.wrestling.practice..It.turned.out.that.wresting.was.the.most.popular.sport.in.the.school.
Pass.out.face-down.the.100.Random.Rectangles.handout.or.show.it.on.the.overhead.or.on.the.computer.
Have.each.student.number.a.separate.paper.from.one.to.three.and.label.number.one.as.Guess,.number.two.as.Judgment.Sample.and.number.three.as.Random.Sample.
Review.the.concept.of.area.as.the.number.of.squares.it.takes.to.cover.an.object..Give.an.example.on.the.board.or.overhead.
Tell.the.students.that.they.are.going.to.try.to.find.out.what.the.mean.or.average.area.is.for.the.rectangles.using.three.different.methods:
Guess:.Have.the.students.turn.over.the.100.Random.Rectangles.page.and.have.the.students.study.it.for.30.seconds..On.the.guess.line,.they.need.to.write.what.they.think.the.average.or.mean.number.of.squares.on.the.page.is.
Judgment.Sample:.Now.the.students.need.to.study.the.100.Random.Rectangles.page.and.write.the.numbers.of.five.rectangles.that.they.think.are.representative.of.the.rectangles.on.the.page..They.then.write.the.area.of.each.of.the.rectangles.they.found.and.find.the.mean.of.those.five.rectangles.
Random.Sample:.Using.a.random.number.generator.(either.a.graphing.calculator.or.the.handout),.students.should.get.five.random.numbers.between.1.and.100..They.will.then.write.the.area.of.the.five.rectangles.that.were.randomly.generated.and.find.the.mean.
1.
2.
3.
4.
5.
a.
b.
c.
Students.should.make.three.number.lines.in.a.row,.as.indicated.below,.making.sure.that.all.have.the.same.intervals.and.are.the.same.size..
Have.students.make.a.line.plot.for.each.set.of.data..They.should.round.their.means.to.the.nearest.whole.number..Record.their.means.on.the.board.under.the.appropriate.titles.of.Guess,.Judgment.and.Random..
Instruct.students.to.write.a.few.sentences.that.explain.what.their.graph.is.showing.them..They.should.find.that.the.mean.of.the.random.number.area.is.the.closest.to.the.actual.mean.which.is.7.29.
Ask.students.whether.the.results.would.be.different.if.your.sample.was.smaller.or.larger.than.five..Answer: If.the.sample.is.random,.the.greater.the.sample,.the.closer.to.the.actual.number.it.will.be..
Help.the.class.understand.why.it.is.important.when.conducting.a.survey.to.have.a.random.sample.
6.
7.
8.
9.
10.
This.activity.was.printed.with.permission.from.Dick.Scheaffer.who.authored.it..It.was.also.published.in.Activity-Based Statistics,.Key.College.Publishing.
One Classroom’s Answers
Sample.Answers
Line.Plots.of.Tree.Sample.Methods
EvaluationNumber.lines.have.consistent.intervals. 5.points
Intervals.are.lined.up.. 5.points
Number.lines.are.labeled. 5.points
Analysis.of.their.graph.is.accurate. 10.points
TOTAL:.25.points
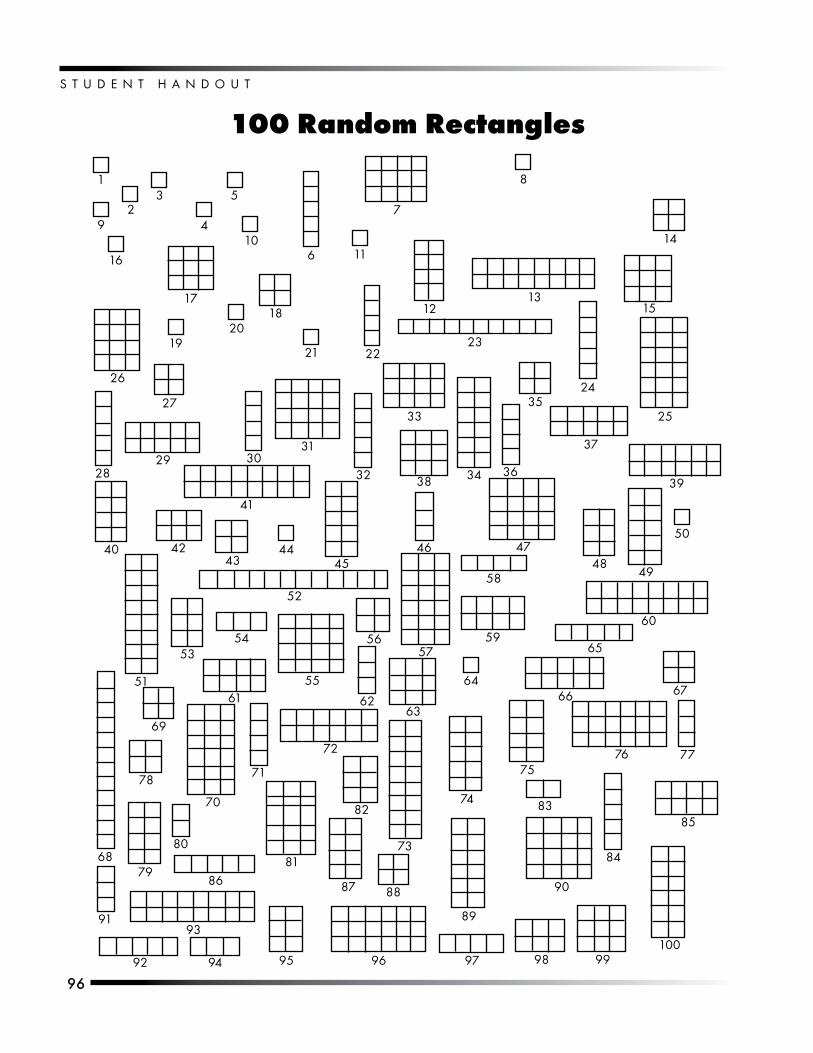
S T U D E N T . H A N D O U T
��
1
92
3
16
4
5
106 11
1820
17
19
26
27
21 22
7
8
1213
23
33
14
15
2435
25
28
40
29 3031
32
4243
4445
52
51
5354
6155
56
62
41
69
70
71
72
78
6879
86
8081
82
87
9193
92 94 95 96 97 98 99
88
73
74
89
63
90
83
75
38 34 36
37
39
48
50
60
4746
58 49
5957
64
65
66 67
76 77
84
85
100
100 Random Rectangles
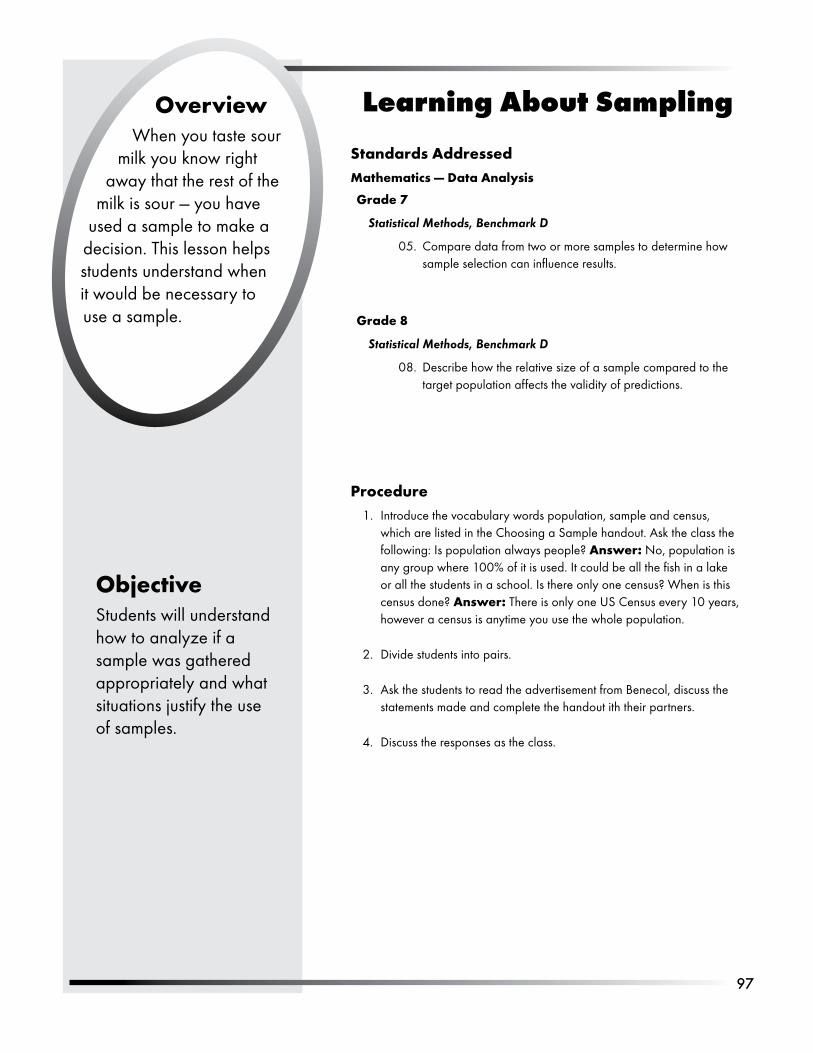
�7
Learning About SamplingOverviewWhen.you.taste.sour.
milk.you.know.right.away.that.the.rest.of.the.
milk.is.sour.—.you.have.used.a.sample.to.make.a.
decision..This.lesson.helps.students.understand.when.it.would.be.necessary.to.use.a.sample.
ObjectiveStudents.will.understand.how.to.analyze.if.a.sample.was.gathered.appropriately.and.what.situations.justify.the.use.of.samples.
Standards AddressedMathematics — Data Analysis
Grade 7
Statistical Methods, Benchmark D
05.. Compare.data.from.two.or.more.samples.to.determine.how.sample.selection.can.influence.results..
Grade 8
Statistical Methods, Benchmark D
08.. Describe.how.the.relative.size.of.a.sample.compared.to.the.target.population.affects.the.validity.of.predictions..
ProcedureIntroduce.the.vocabulary.words.population,.sample.and.census,.which.are.listed.in.the.Choosing.a.Sample.handout..Ask.the.class.the.following:.Is.population.always.people?.Answer:.No,.population.is.any.group.where.100%.of.it.is.used..It.could.be.all.the.fish.in.a.lake.or.all.the.students.in.a.school..Is.there.only.one.census?.When.is.this.census.done?.Answer: There.is.only.one.US.Census.every.10.years,.however.a.census.is.anytime.you.use.the.whole.population.
Divide.students.into.pairs.
Ask.the.students.to.read.the.advertisement.from.Benecol,.discuss.the.statements.made.and.complete.the.handout.ith.their.partners.
Discuss.the.responses.as.the.class.
1.
2.
3.
4.
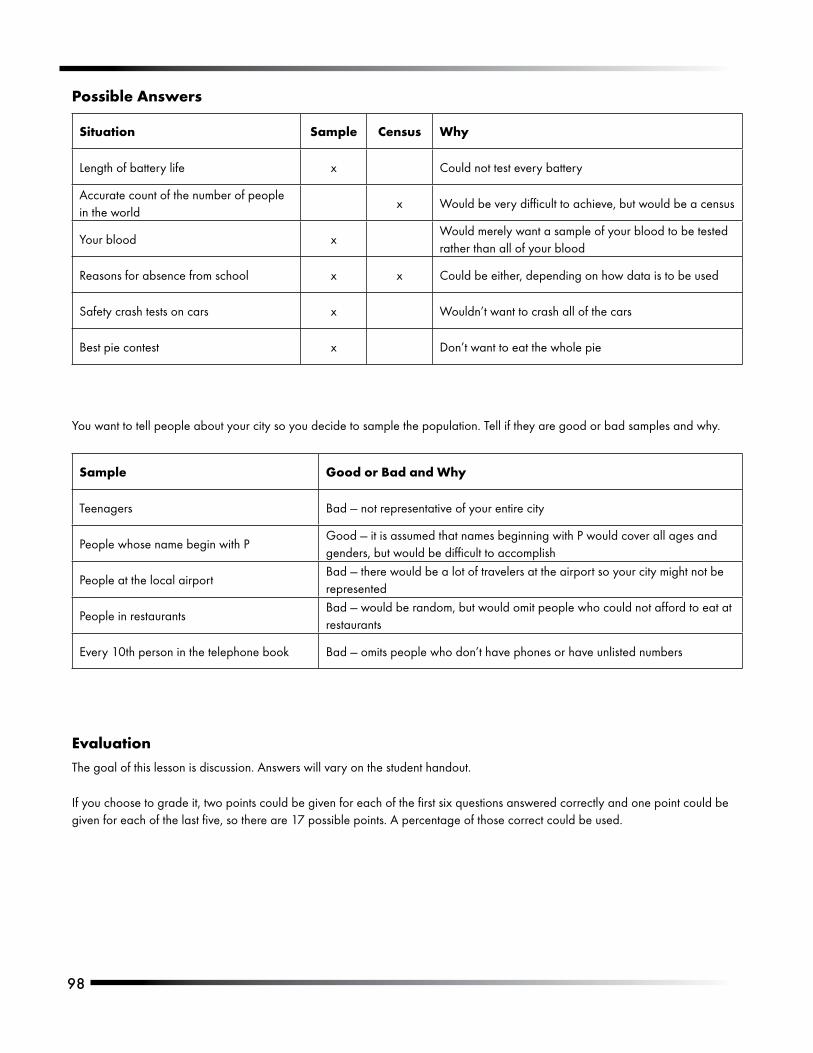
�8
Possible Answers
Situation Sample Census Why
Length.of.battery.life x Could.not.test.every.battery
Accurate.count.of.the.number.of.people.in.the.world
x Would.be.very.difficult.to.achieve,.but.would.be.a.census
Your.blood xWould.merely.want.a.sample.of.your.blood.to.be.tested.rather.than.all.of.your.blood
Reasons.for.absence.from.school x x Could.be.either,.depending.on.how.data.is.to.be.used
Safety.crash.tests.on.cars x Wouldn’t.want.to.crash.all.of.the.cars
Best.pie.contest x Don’t.want.to.eat.the.whole.pie
You.want.to.tell.people.about.your.city.so.you.decide.to.sample.the.population..Tell.if.they.are.good.or.bad.samples.and.why.
Sample Good or Bad and Why
Teenagers Bad.—.not.representative.of.your.entire.city
People.whose.name.begin.with.PGood.—.it.is.assumed.that.names.beginning.with.P.would.cover.all.ages.and.genders,.but.would.be.difficult.to.accomplish
People.at.the.local.airportBad.—.there.would.be.a.lot.of.travelers.at.the.airport.so.your.city.might.not.be.represented
People.in.restaurantsBad.—.would.be.random,.but.would.omit.people.who.could.not.afford.to.eat.at.restaurants
Every.10th.person.in.the.telephone.book Bad.—.omits.people.who.don’t.have.phones.or.have.unlisted.numbers
EvaluationThe.goal.of.this.lesson.is.discussion..Answers.will.vary.on.the.student.handout.
If.you.choose.to.grade.it,.two.points.could.be.given.for.each.of.the.first.six.questions.answered.correctly.and.one.point.could.be.given.for.each.of.the.last.five,.so.there.are.17.possible.points..A.percentage.of.those.correct.could.be.used.
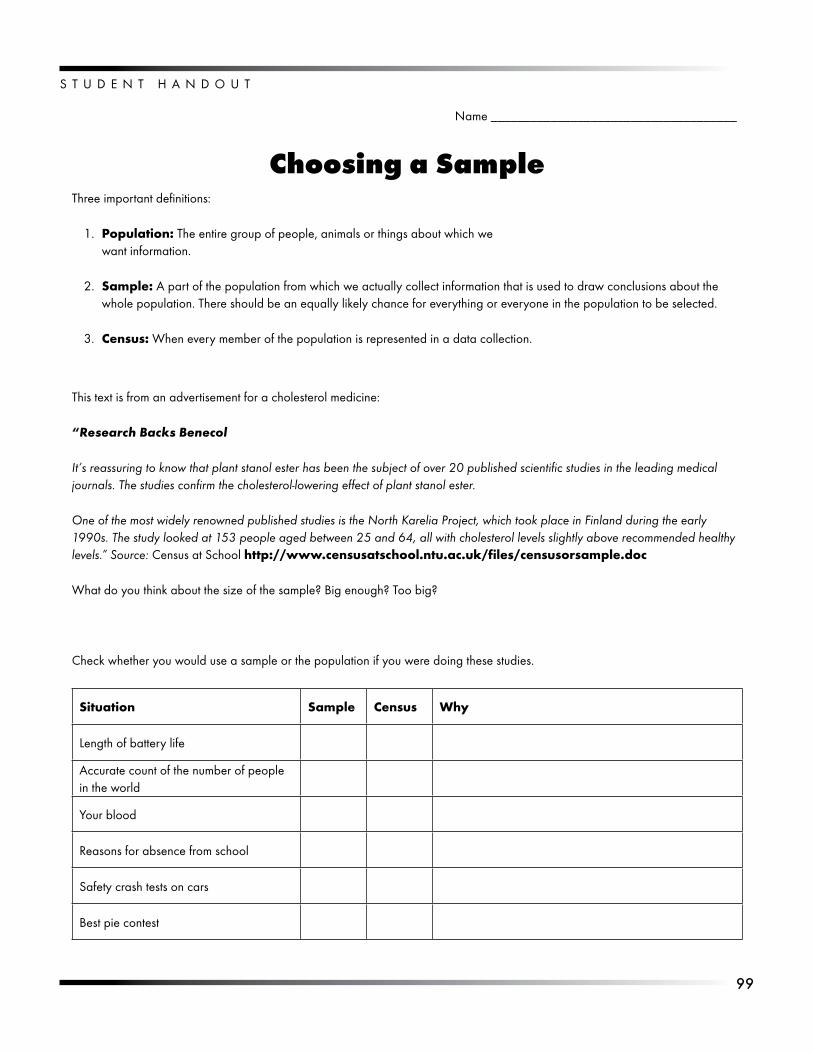
��
S T U D E N T . H A N D O U T
Name._____________________________________
Choosing a SampleThree.important.definitions:
Population: The.entire.group.of.people,.animals.or.things.about.which.we..want.information.
Sample:.A.part.of.the.population.from.which.we.actually.collect.information.that.is.used.to.draw.conclusions.about.the.whole.population..There.should.be.an.equally.likely.chance.for.everything.or.everyone.in.the.population.to.be.selected.
Census:.When.every.member.of.the.population.is.represented.in.a.data.collection.
This.text.is.from.an.advertisement.for.a.cholesterol.medicine:.
“Research Backs Benecol
It’s reassuring to know that plant stanol ester has been the subject of over 20 published scientific studies in the leading medical journals. The studies confirm the cholesterol-lowering effect of plant stanol ester.
One of the most widely renowned published studies is the North Karelia Project, which took place in Finland during the early 1990s. The study looked at 153 people aged between 25 and 64, all with cholesterol levels slightly above recommended healthy levels.” Source: Census.at.School.http://www.censusatschool.ntu.ac.uk/files/censusorsample.doc.
What.do.you.think.about.the.size.of.the.sample?.Big.enough?.Too.big?.
Check.whether.you.would.use.a.sample.or.the.population.if.you.were.doing.these.studies.
Situation Sample Census Why
Length.of.battery.life
Accurate.count.of.the.number.of.people.in.the.world
Your.blood
Reasons.for.absence.from.school
Safety.crash.tests.on.cars
Best.pie.contest
1.
2.
3.
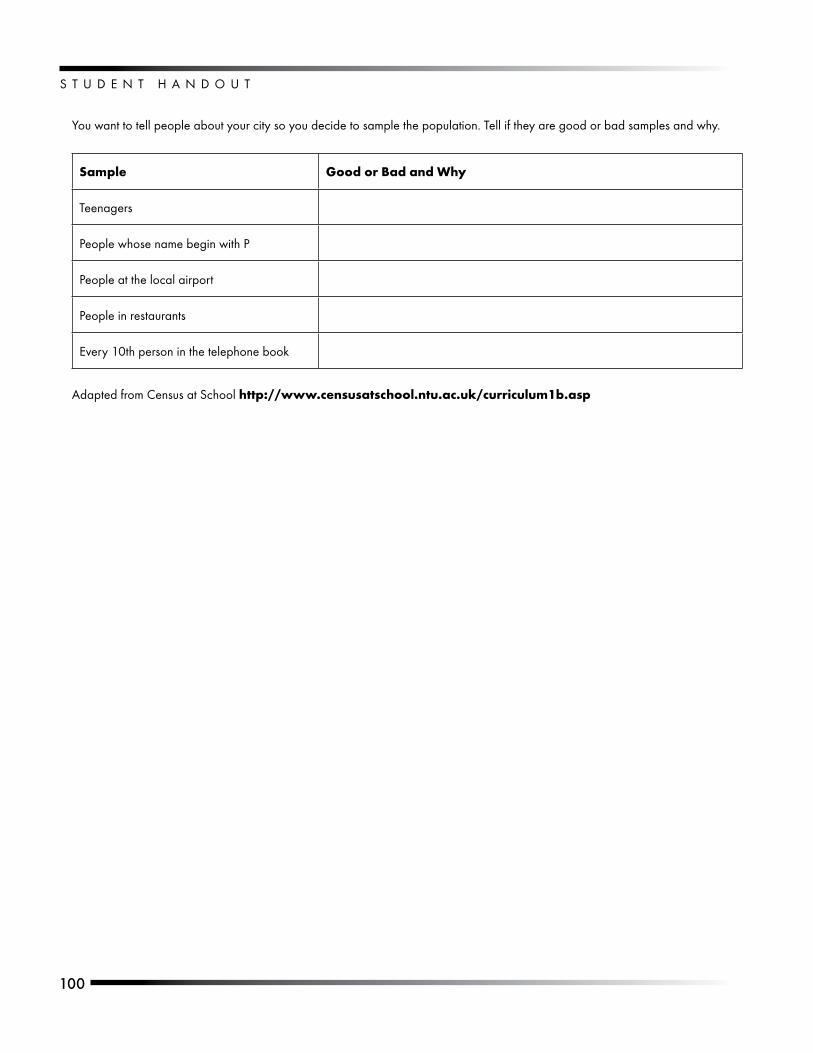
S T U D E N T . H A N D O U T
100
You.want.to.tell.people.about.your.city.so.you.decide.to.sample.the.population..Tell.if.they.are.good.or.bad.samples.and.why.
Sample Good or Bad and Why
Teenagers
People.whose.name.begin.with.P
People.at.the.local.airport
People.in.restaurants
Every.10th.person.in.the.telephone.book
Adapted.from.Census.at.School.http://www.censusatschool.ntu.ac.uk/curriculum1b.asp.
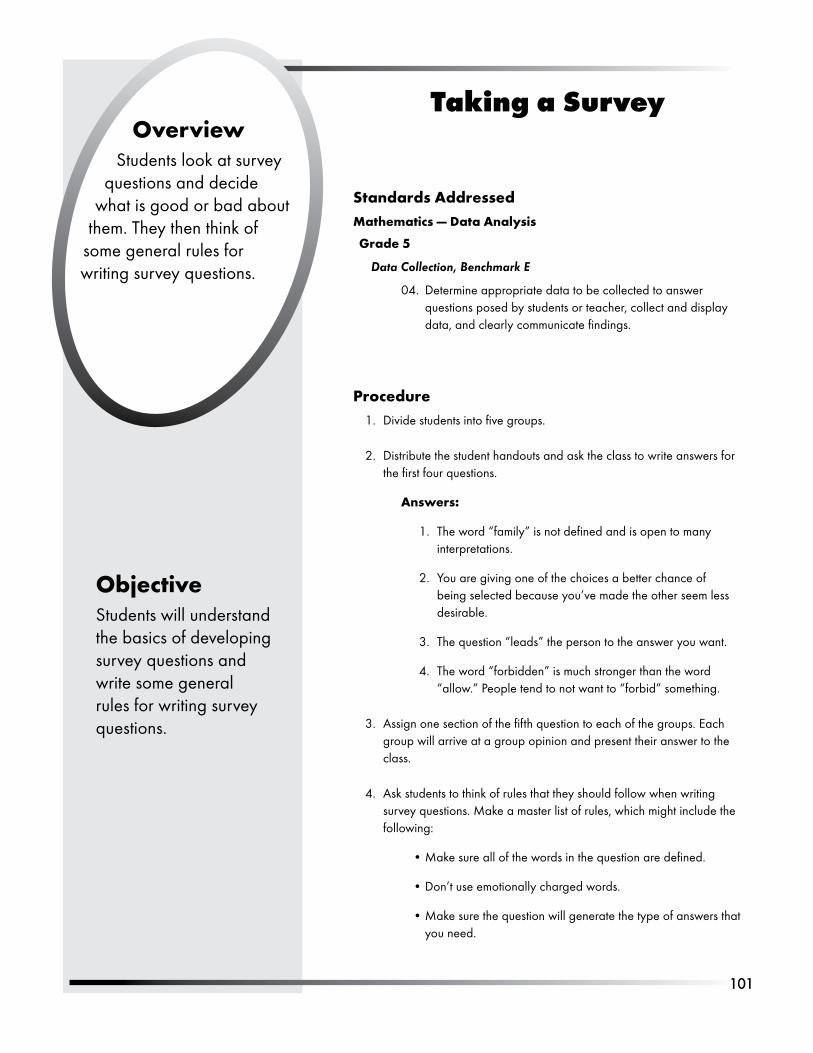
101
Taking a SurveyOverview
Students.look.at.survey.questions.and.decide.
what.is.good.or.bad.about.them..They.then.think.of.
some.general.rules.for.writing.survey.questions.
ObjectiveStudents.will.understand.the.basics.of.developing.survey.questions.and.write.some.general.rules.for.writing.survey.questions.
Standards AddressedMathematics — Data Analysis
Grade 5
Data Collection, Benchmark E
04.. Determine.appropriate.data.to.be.collected.to.answer.questions.posed.by.students.or.teacher,.collect.and.display.data,.and.clearly.communicate.findings.
ProcedureDivide.students.into.five.groups.
Distribute.the.student.handouts.and.ask.the.class.to.write.answers.for.the.first.four.questions.
Answers:
The.word.“family”.is.not.defined.and.is.open.to.many.interpretations.
You.are.giving.one.of.the.choices.a.better.chance.of.being.selected.because.you’ve.made.the.other.seem.less.desirable.
The.question.“leads”.the.person.to.the.answer.you.want.
The.word.“forbidden”.is.much.stronger.than.the.word.“allow.”.People.tend.to.not.want.to.“forbid”.something.
Assign.one.section.of.the.fifth.question.to.each.of.the.groups..Each.group.will.arrive.at.a.group.opinion.and.present.their.answer.to.the.class.
Ask.students.to.think.of.rules.that.they.should.follow.when.writing.survey.questions..Make.a.master.list.of.rules,.which.might.include.the.following:.
Make.sure.all.of.the.words.in.the.question.are.defined.
Don’t.use.emotionally.charged.words.
Make.sure.the.question.will.generate.the.type.of.answers.that.you.need.
1.
2.
1.
2.
3.
4.
3.
4.
•
•
•
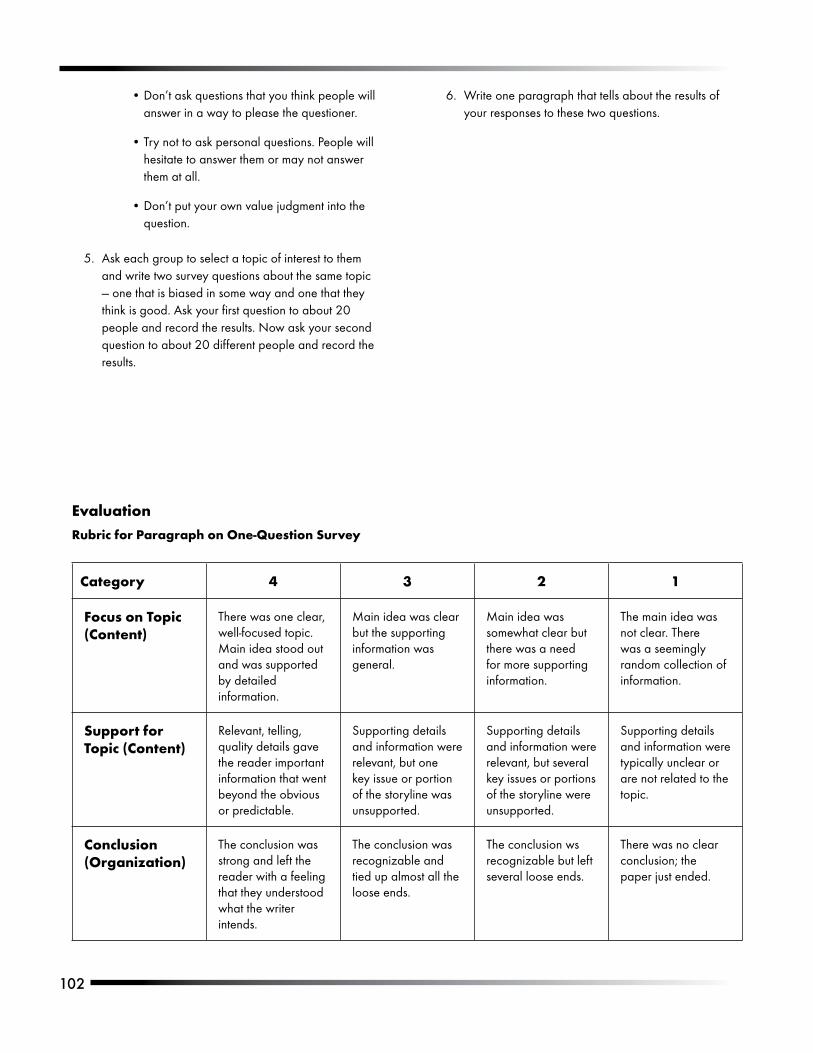
102
Don’t.ask.questions.that.you.think.people.will.answer.in.a.way.to.please.the.questioner.
Try.not.to.ask.personal.questions..People.will.hesitate.to.answer.them.or.may.not.answer.them.at.all.
Don’t.put.your.own.value.judgment.into.the.question.
Ask.each.group.to.select.a.topic.of.interest.to.them.and.write.two.survey.questions.about.the.same.topic.—.one.that.is.biased.in.some.way.and.one.that.they.think.is.good..Ask.your.first.question.to.about.20.people.and.record.the.results..Now.ask.your.second.question.to.about.20.different.people.and.record.the.results.
•
•
•
5.
Write.one.paragraph.that.tells.about.the.results.of.your.responses.to.these.two.questions.
6.
EvaluationRubric for Paragraph on One-Question Survey
Category 4 3 2 1
Focus on Topic (Content)
There.was.one.clear,.well-focused.topic..Main.idea.stood.out.and.was.supported.by.detailed.information..
Main.idea.was.clear.but.the.supporting.information.was.general..
Main.idea.was.somewhat.clear.but.there.was.a.need.for.more.supporting.information..
The.main.idea.was.not.clear..There.was.a.seemingly.random.collection.of.information..
Support for Topic (Content)
Relevant,.telling,.quality.details.gave.the.reader.important.information.that.went.beyond.the.obvious.or.predictable..
Supporting.details.and.information.were.relevant,.but.one.key.issue.or.portion.of.the.storyline.was.unsupported..
Supporting.details.and.information.were.relevant,.but.several.key.issues.or.portions.of.the.storyline.were.unsupported..
Supporting.details.and.information.were.typically.unclear.or.are.not.related.to.the.topic..
Conclusion (Organization)
The.conclusion.was.strong.and.left.the.reader.with.a.feeling.that.they.understood.what.the.writer.intends..
The.conclusion.was.recognizable.and.tied.up.almost.all.the.loose.ends..
The.conclusion.ws.recognizable.but.left.several.loose.ends..
There.was.no.clear.conclusion;.the.paper.just.ended..
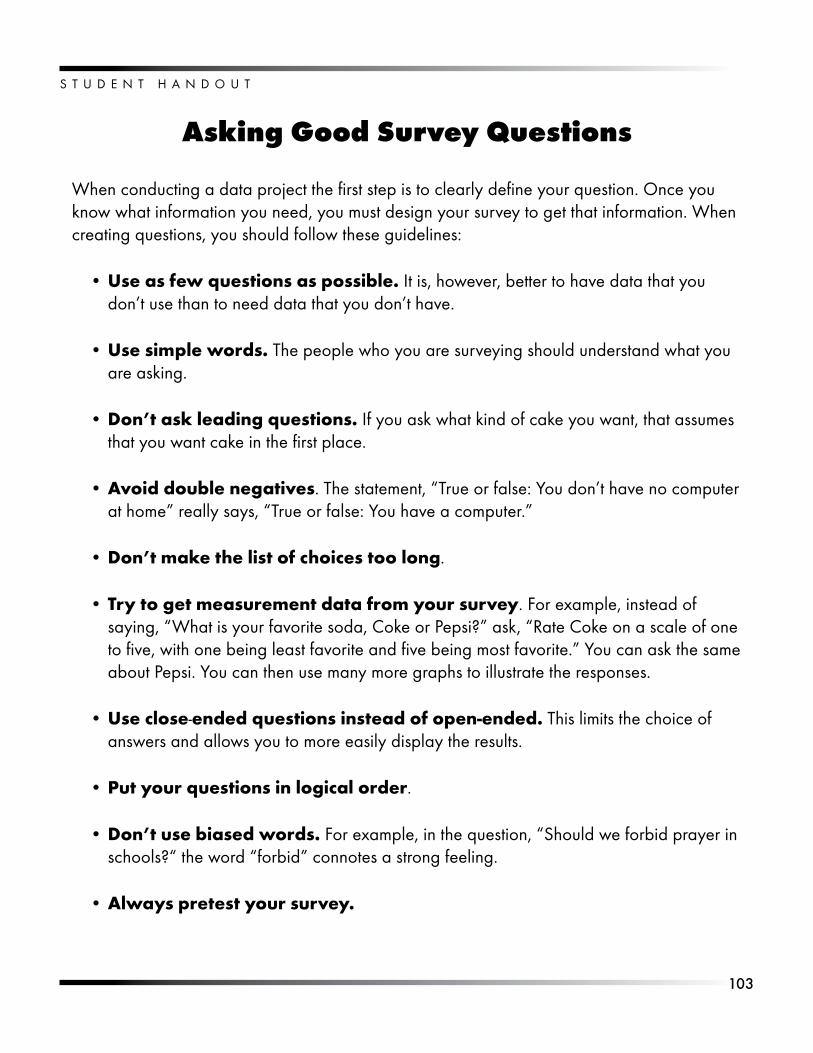
10�
S T U D E N T . H A N D O U T
Asking Good Survey Questions
When.conducting.a.data.project.the.first.step.is.to.clearly.define.your.question..Once.you.know.what.information.you.need,.you.must.design.your.survey.to.get.that.information..When.creating.questions,.you.should.follow.these.guidelines:
Use as few questions as possible. It.is,.however,.better.to.have.data.that.you.don’t.use.than.to.need.data.that.you.don’t.have.
Use simple words..The.people.who.you.are.surveying.should.understand.what.you.are.asking.
Don’t ask leading questions..If.you.ask.what.kind.of.cake.you.want,.that.assumes.that.you.want.cake.in.the.first.place.
Avoid double negatives..The.statement,.“True.or.false:.You.don’t.have.no.computer.at.home”.really.says,.“True.or.false:.You.have.a.computer.”
Don’t make the list of choices too long.
Try to get measurement data from your survey..For.example,.instead.of.saying,.“What.is.your.favorite.soda,.Coke.or.Pepsi?”.ask,.“Rate.Coke.on.a.scale.of.one.to.five,.with.one.being.least.favorite.and.five.being.most.favorite.”.You.can.ask.the.same.about.Pepsi..You.can.then.use.many.more.graphs.to.illustrate.the.responses.
Use close-ended questions instead of open-ended. This.limits.the.choice.of.answers.and.allows.you.to.more.easily.display.the.results.
Put your questions in logical order.
Don’t use biased words..For.example,.in.the.question,.“Should.we.forbid.prayer.in.schools?“.the.word.“forbid”.connotes.a.strong.feeling.
Always pretest your survey.
•
•
•
•
•
•
•
•
•
•
S T U D E N T . H A N D O U T
10�
Name._____________________________________
SurveysAsking the Questions
One.of.the.most.important.concepts.of.getting.the.answer.to.the.question.you.are.asking.is.the.way.you.word.your.question..You.want.to.make.sure.you.get.the.exact.data.you.need.to.answer.your.question..“How.many.people.are.in.your.family?”.Good.question?.Why.or.why.not?
“Would.you.like.the.newest.edition.of.the.MacIntosh.computer,.or.would.you.rather.have.the.older,.less.robust.version?”.Good.question?.Why.or.why.not.
“You.don’t.eat.carbohydrates,.do.you?”.Good.question?.Why.or.why.not?
Choose.which.of.these.questions.is.better:.“Do.you.think.that.free.speech.in.school.should.be.forbidden?”.or.“Do.you.think.free.speech.in.school.should.not.be.allowed?”.Why?
1.
2.
3.
4.
10�
S T U D E N T . H A N D O U T
Could.these.situations.cause.you.difficulties.when.conducting.a.survey?
Your.school.wants.to.know.if.alcohol.use.is.common.at.your.school..They.ask.the.DARE.officer.to.ask.each.student.individually.if.he.or.she.uses.alcohol.
The.school.district.wants.to.put.a.levy.on.the.ballot,.so.they.want.to.know.the.mean.income.of.the.people.in.the.district..The.send.someone.door.to.door.and.ask.for.the.income.of.each.household.
You’re.running.against.Bob.for.president.of.your.class..You.ask.your.friends.to.do.a.survey..They.go.to.students.and.say,.“Bob.is.really.a.creep..You’re.voting.for.Mary,.aren’t.you?”
You.want.to.get.a.DJ.to.work.your.school.dance..He.wants.to.know.what.kind.of.music.you.want,.so.you.send.out.representatives.to.ask.other.students.if.they.want.rock,.hard.rock,.country.or.rap.to.be.played.at.the.dance.
You.want.students.to.tell.you.which.of.two.magazines.they.like..You.tell.them.to.peruse.the.issues.and.elucidate.their.responses.
Write some general rules about writing survey questions.
5.
a.
b.
c.
d.
e.
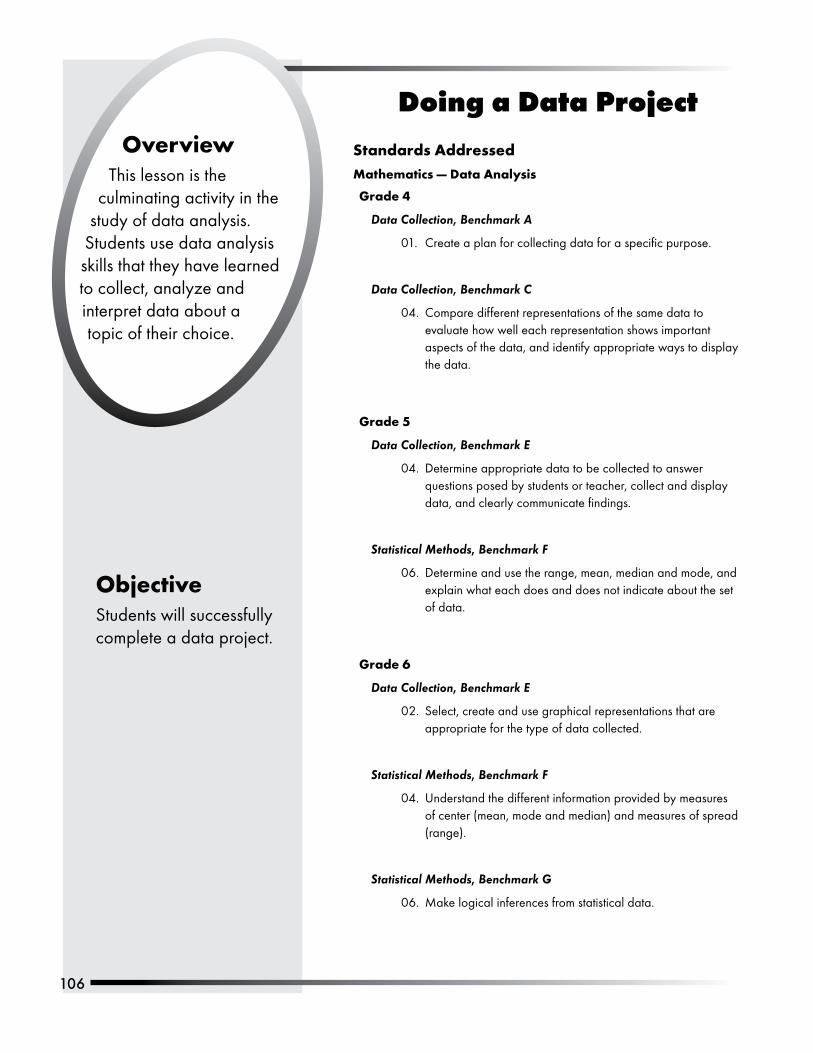
10�
Doing a Data ProjectOverview
This.lesson.is.the.culminating.activity.in.the.
study.of.data.analysis..Students.use.data.analysis.skills.that.they.have.learned.to.collect,.analyze.and.interpret.data.about.a.topic.of.their.choice.
Standards AddressedMathematics — Data Analysis
Grade 4
Data Collection, Benchmark A
01.. Create.a.plan.for.collecting.data.for.a.specific.purpose.
Data Collection, Benchmark C
04.. Compare.different.representations.of.the.same.data.to.evaluate.how.well.each.representation.shows.important.aspects.of.the.data,.and.identify.appropriate.ways.to.display.the.data.
Grade 5
Data Collection, Benchmark E
04.. Determine.appropriate.data.to.be.collected.to.answer.questions.posed.by.students.or.teacher,.collect.and.display.data,.and.clearly.communicate.findings..
Statistical Methods, Benchmark F
06.. Determine.and.use.the.range,.mean,.median.and.mode,.and.explain.what.each.does.and.does.not.indicate.about.the.set.of.data..
Grade 6
Data Collection, Benchmark E
02.. Select,.create.and.use.graphical.representations.that.are.appropriate.for.the.type.of.data.collected..
Statistical Methods, Benchmark F
04.. Understand.the.different.information.provided.by.measures.of.center.(mean,.mode.and.median).and.measures.of.spread.(range)..
Statistical Methods, Benchmark G
06.. Make.logical.inferences.from.statistical.data.
ObjectiveStudents.will.successfully.complete.a.data.project.
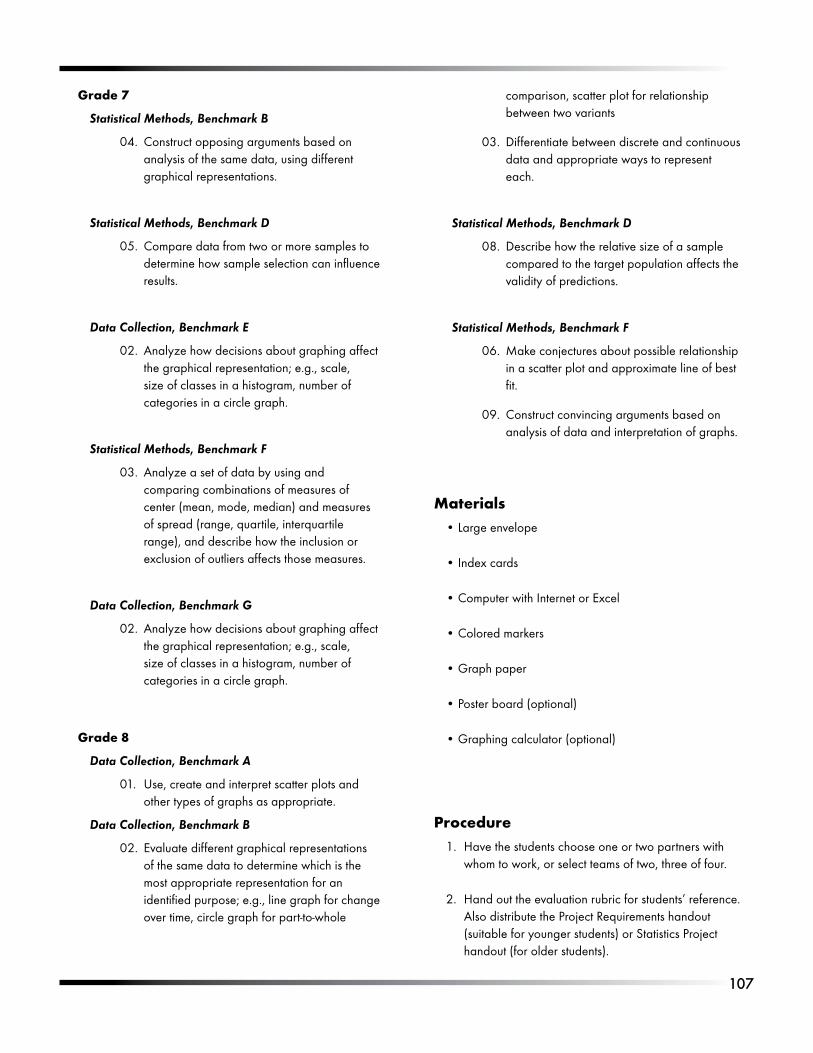
107
Grade 7
Statistical Methods, Benchmark B
04.. Construct.opposing.arguments.based.on.analysis.of.the.same.data,.using.different.graphical.representations.
Statistical Methods, Benchmark D
05.. Compare.data.from.two.or.more.samples.to.determine.how.sample.selection.can.influence.results..
Data Collection, Benchmark E
02.. Analyze.how.decisions.about.graphing.affect.the.graphical.representation;.e.g.,.scale,.size.of.classes.in.a.histogram,.number.of.categories.in.a.circle.graph.
Statistical Methods, Benchmark F
03.. Analyze.a.set.of.data.by.using.and.comparing.combinations.of.measures.of.center.(mean,.mode,.median).and.measures.of.spread.(range,.quartile,.interquartile.range),.and.describe.how.the.inclusion.or.exclusion.of.outliers.affects.those.measures.
Data Collection, Benchmark G
02.. Analyze.how.decisions.about.graphing.affect.the.graphical.representation;.e.g.,.scale,.size.of.classes.in.a.histogram,.number.of.categories.in.a.circle.graph.
Grade 8
Data Collection, Benchmark A
01.. Use,.create.and.interpret.scatter.plots.and.other.types.of.graphs.as.appropriate..
Data Collection, Benchmark B
02.. Evaluate.different.graphical.representations.of.the.same.data.to.determine.which.is.the.most.appropriate.representation.for.an.identified.purpose;.e.g.,.line.graph.for.change.over.time,.circle.graph.for.part-to-whole.
comparison,.scatter.plot.for.relationship.between.two.variants
03.. Differentiate.between.discrete.and.continuous.data.and.appropriate.ways.to.represent.each..
Statistical Methods, Benchmark D
08.. Describe.how.the.relative.size.of.a.sample.compared.to.the.target.population.affects.the.validity.of.predictions..
Statistical Methods, Benchmark F
06.. Make.conjectures.about.possible.relationship.in.a.scatter.plot.and.approximate.line.of.best.fit.
09.. Construct.convincing.arguments.based.on.analysis.of.data.and.interpretation.of.graphs..
MaterialsLarge.envelope
Index.cards
Computer.with.Internet.or.Excel
Colored.markers
Graph.paper
Poster.board.(optional)
Graphing.calculator.(optional)
ProcedureHave.the.students.choose.one.or.two.partners.with.whom.to.work,.or.select.teams.of.two,.three.of.four.
Hand.out.the.evaluation.rubric.for.students’.reference..Also.distribute.the.Project.Requirements.handout.(suitable.for.younger.students).or.Statistics.Project.handout.(for.older.students).
•
•
•
•
•
•
•
1.
2.
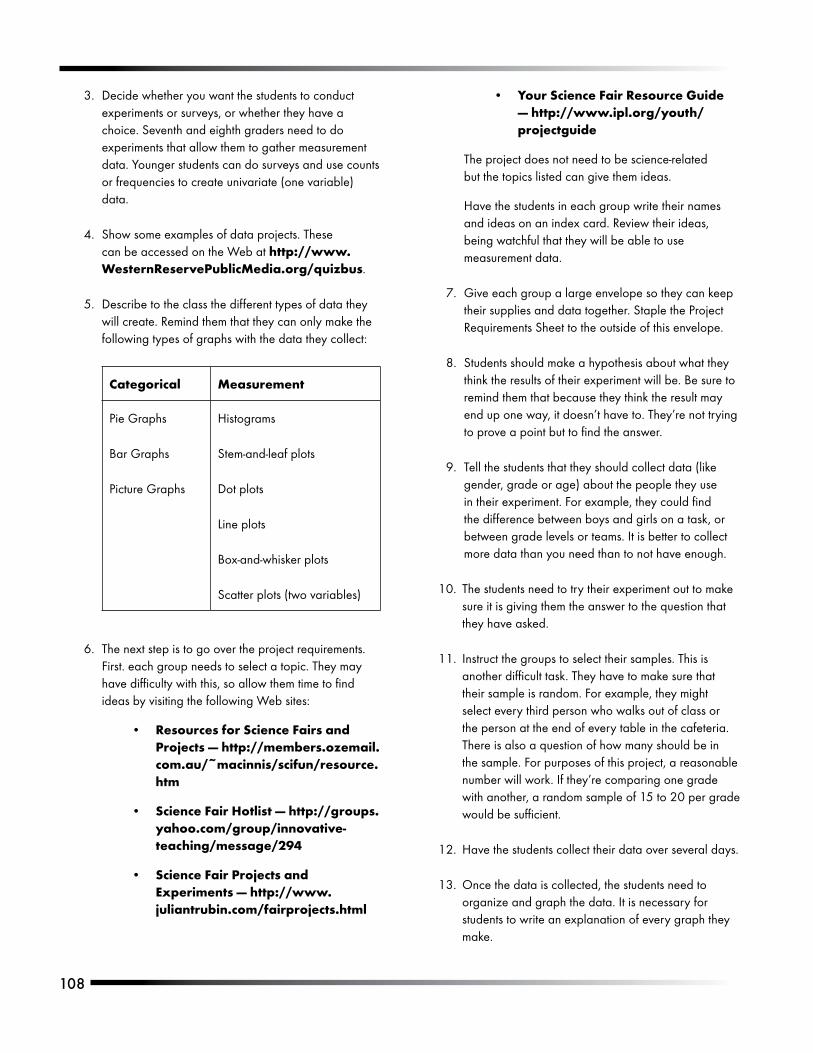
108
Decide.whether.you.want.the.students.to.conduct.experiments.or.surveys,.or.whether.they.have.a.choice..Seventh.and.eighth.graders.need.to.do.experiments.that.allow.them.to.gather.measurement.data..Younger.students.can.do.surveys.and.use.counts.or.frequencies.to.create.univariate.(one.variable).data..
Show.some.examples.of.data.projects..These.can.be.accessed.on.the.Web.at.http://www.WesternReservePublicMedia.org/quizbus.
Describe.to.the.class.the.different.types.of.data.they.will.create..Remind.them.that.they.can.only.make.the.following.types.of.graphs.with.the.data.they.collect:
Categorical Measurement
Pie.Graphs
Bar.Graphs
Picture.Graphs
Histograms
Stem-and-leaf.plots
Dot.plots
Line.plots
Box-and-whisker.plots
Scatter.plots.(two.variables)
The.next.step.is.to.go.over.the.project.requirements..First..each.group.needs.to.select.a.topic..They.may.have.difficulty.with.this,.so.allow.them.time.to.find.ideas.by.visiting.the.following.Web.sites:
Resources for Science Fairs and Projects — http://members.ozemail.com.au/~macinnis/scifun/resource.htm.
Science Fair Hotlist — http://groups.yahoo.com/group/innovative-teaching/message/294.
Science Fair Projects and Experiments — http://www.juliantrubin.com/fairprojects.html.
3.
4.
5.
6.
•
•
•
Your Science Fair Resource Guide. — http://www.ipl.org/youth/projectguide.
The.project.does.not.need.to.be.science-related..but.the.topics.listed.can.give.them.ideas..
Have.the.students.in.each.group.write.their.names.and.ideas.on.an.index.card..Review.their.ideas,..being.watchful.that.they.will.be.able.to.use.measurement.data.
Give.each.group.a.large.envelope.so.they.can.keep.their.supplies.and.data.together..Staple.the.Project.Requirements.Sheet.to.the.outside.of.this.envelope.
Students.should.make.a.hypothesis.about.what.they.think.the.results.of.their.experiment.will.be..Be.sure.to.remind.them.that.because.they.think.the.result.may.end.up.one.way,.it.doesn’t.have.to..They’re.not.trying.to.prove.a.point.but.to.find.the.answer.
Tell.the.students.that.they.should.collect.data.(like.gender,.grade.or.age).about.the.people.they.use.in.their.experiment..For.example,.they.could.find.the.difference.between.boys.and.girls.on.a.task,.or.between.grade.levels.or.teams..It.is.better.to.collect.more.data.than.you.need.than.to.not.have.enough.
The.students.need.to.try.their.experiment.out.to.make.sure.it.is.giving.them.the.answer.to.the.question.that.they.have.asked.
Instruct.the.groups.to.select.their.samples..This.is.another.difficult.task..They.have.to.make.sure.that.their.sample.is.random..For.example,.they.might.select.every.third.person.who.walks.out.of.class.or.the.person.at.the.end.of.every.table.in.the.cafeteria..There.is.also.a.question.of.how.many.should.be.in.the.sample..For.purposes.of.this.project,.a.reasonable.number.will.work..If.they’re.comparing.one.grade.with.another,.a.random.sample.of.15.to.20.per.grade.would.be.sufficient.
Have.the.students.collect.their.data.over.several.days.
Once.the.data.is.collected,.the.students.need.to.organize.and.graph.the.data..It.is.necessary.for.students.to.write.an.explanation.of.every.graph.they.make.
•
7.
8.
9.
10.
11.
12.
13.
10�
They.need.to.find.and.report.the.significant.numbers:.mean,.median,.mode.and.range.
Using.their.graphs,.they.need.to.answer.the.question.that.they.originally.proposed..Further,.they.need.to.tell.what.they.would.have.done.differently.if.they.were.doing.it.over.and.they.need.to.tell.what.else.they.could.do.to.get.more.or.better.information.
Teams.will.then.show.their.graphs.and.present.their.data.to.the.class.
NOTE: This.is.a.great.time.to.have.the.students.use.technology..Excel.can.be.used.to.keep.data.and.create.graphs..Create.a.Graph.is.a.government.site.that.is.very.child-friendly.and.allows.students.to.create.their.graphs.online:.http://nces.ed.gov/nceskids/createagraph/default.aspx.
14.
15.
16.
17.
NOTE: Instead.of.doing.a.project,.students.could.create.a.poster.of.their.graphs..There.are.some.examples.of.posters.at.http://www.WesternReservePublicMedia.org/quizbus.
NOTE: If.you.have.excellent.projects.or.posters,.you.can.enter.them.into.a.national.contest.put.on.annually.by.the.American.Statistical.Association..For.information,.go.to.http://www.amstat.org/education/index.cfm?fuseaction=poster1..
NOTE:.If.the.students.have.graphing.calculators,.graphs.can.be.made.on.the.calculator.and.sent.to.the.computer.or.shown.during.the.presentation.
18.
19.
20.
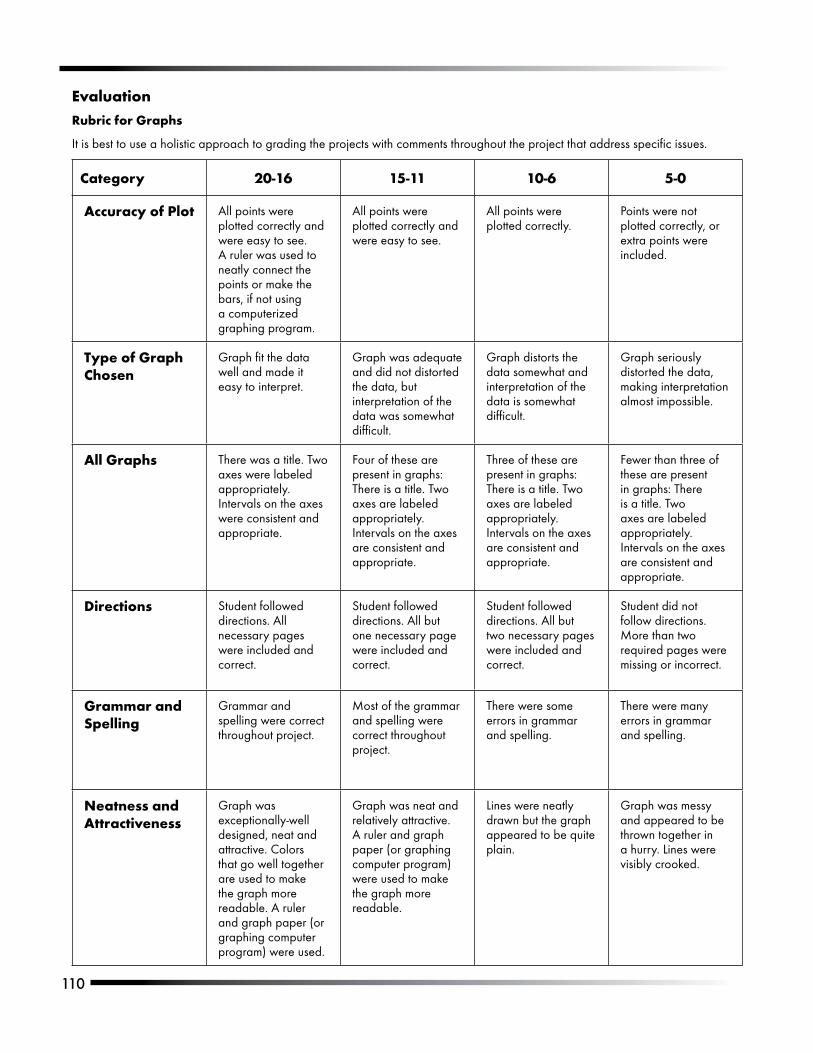
110
EvaluationRubric for Graphs
It.is.best.to.use.a.holistic.approach.to.grading.the.projects.with.comments.throughout.the.project.that.address.specific.issues.
Category 20-16 15-11 10-6 5-0
Accuracy of Plot All.points.were.plotted.correctly.and.were.easy.to.see..A.ruler.was.used.to.neatly.connect.the.points.or.make.the.bars,.if.not.using.a.computerized.graphing.program..
All.points.were.plotted.correctly.and.were.easy.to.see..
All.points.were.plotted.correctly..
Points.were.not.plotted.correctly,.or.extra.points.were.included..
Type of Graph Chosen
Graph.fit.the.data.well.and.made.it.easy.to.interpret..
Graph.was.adequate.and.did.not.distorted.the.data,.but.interpretation.of.the.data.was.somewhat.difficult..
Graph.distorts.the.data.somewhat.and.interpretation.of.the.data.is.somewhat.difficult..
Graph.seriously.distorted.the.data,.making.interpretation.almost.impossible..
All Graphs There.was.a.title..Two.axes.were.labeled.appropriately..Intervals.on.the.axes.were.consistent.and.appropriate..
Four.of.these.are.present.in.graphs:.There.is.a.title..Two.axes.are.labeled.appropriately..Intervals.on.the.axes.are.consistent.and.appropriate..
Three.of.these.are.present.in.graphs:.There.is.a.title..Two.axes.are.labeled.appropriately..Intervals.on.the.axes.are.consistent.and.appropriate..
Fewer.than.three.of.these.are.present.in.graphs:.There.is.a.title..Two.axes.are.labeled.appropriately..Intervals.on.the.axes.are.consistent.and.appropriate..
Directions Student.followed.directions..All.necessary.pages.were.included.and.correct..
Student.followed.directions..All.but.one.necessary.page.were.included.and.correct..
Student.followed.directions..All.but.two.necessary.pages.were.included.and.correct..
Student.did.not.follow.directions..More.than.two.required.pages.were.missing.or.incorrect..
Grammar and Spelling
Grammar.and.spelling.were.correct.throughout.project..
Most.of.the.grammar.and.spelling.were.correct.throughout.project..
There.were.some.errors.in.grammar.and.spelling..
There.were.many.errors.in.grammar.and.spelling..
Neatness and Attractiveness
Graph.was.exceptionally-well.designed,.neat.and.attractive..Colors.that.go.well.together.are.used.to.make.the.graph.more.readable..A.ruler.and.graph.paper.(or.graphing.computer.program).were.used..
Graph.was.neat.and.relatively.attractive..A.ruler.and.graph.paper.(or.graphing.computer.program).were.used.to.make.the.graph.more.readable..
Lines.were.neatly.drawn.but.the.graph.appeared.to.be.quite.plain..
Graph.was.messy.and.appeared.to.be..thrown.together.in.a.hurry..Lines.were.visibly.crooked..
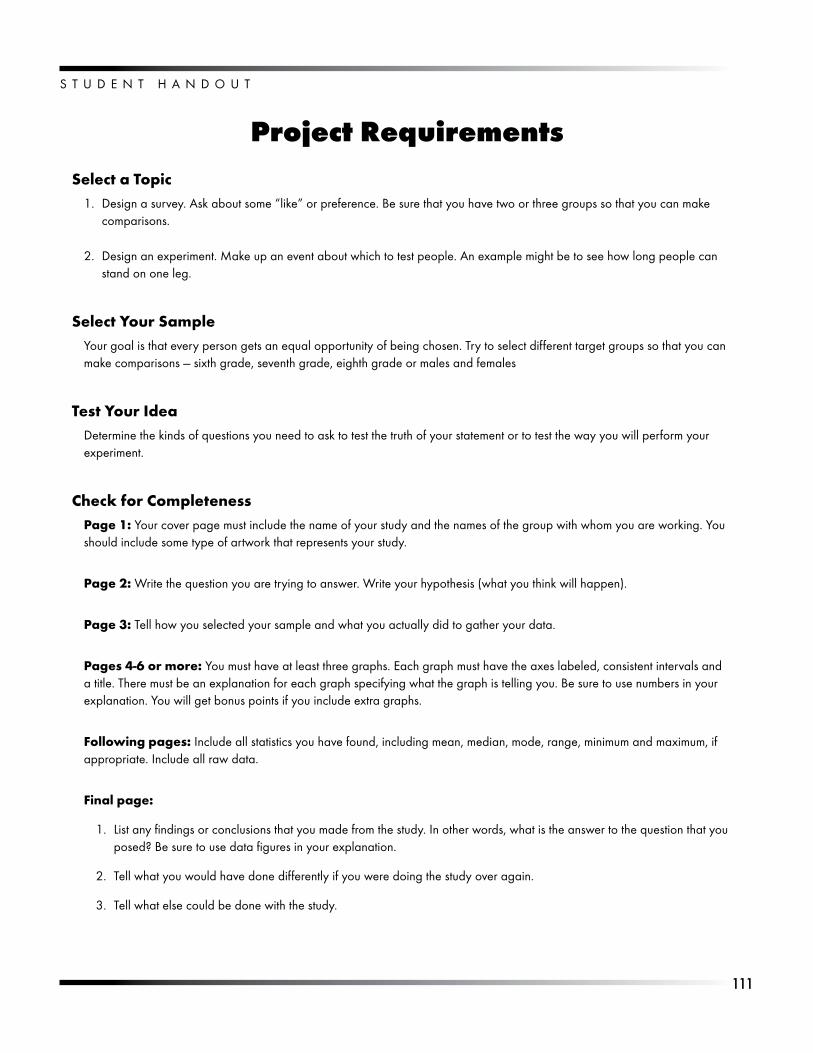
111
S T U D E N T . H A N D O U T
Project RequirementsSelect a Topic
Design.a.survey..Ask.about.some.“like”.or.preference..Be.sure.that.you.have.two.or.three.groups.so.that.you.can.make.comparisons.
Design.an.experiment..Make.up.an.event.about.which.to.test.people..An.example.might.be.to.see.how.long.people.can.stand.on.one.leg.
Select Your SampleYour.goal.is.that.every.person.gets.an.equal.opportunity.of.being.chosen..Try.to.select.different.target.groups.so.that.you.can.make.comparisons.—.sixth.grade,.seventh.grade,.eighth.grade.or.males.and.females
Test Your IdeaDetermine.the.kinds.of.questions.you.need.to.ask.to.test.the.truth.of.your.statement.or.to.test.the.way.you.will.perform.your.experiment..
Check for CompletenessPage 1: Your.cover.page.must.include.the.name.of.your.study.and.the.names.of.the.group.with.whom.you.are.working..You.should.include.some.type.of.artwork.that.represents.your.study.
Page 2: Write.the.question.you.are.trying.to.answer..Write.your.hypothesis.(what.you.think.will.happen).
Page 3: Tell.how.you.selected.your.sample.and.what.you.actually.did.to.gather.your.data.
Pages 4-6 or more: You.must.have.at.least.three.graphs..Each.graph.must.have.the.axes.labeled,.consistent.intervals.and.a.title..There.must.be.an.explanation.for.each.graph.specifying.what.the.graph.is.telling.you..Be.sure.to.use.numbers.in.your.explanation..You.will.get.bonus.points.if.you.include.extra.graphs.
Following pages: Include.all.statistics.you.have.found,.including.mean,.median,.mode,.range,.minimum.and.maximum,.if.appropriate..Include.all.raw.data.
Final page:
List.any.findings.or.conclusions.that.you.made.from.the.study..In.other.words,.what.is.the.answer.to.the.question.that.you.posed?.Be.sure.to.use.data.figures.in.your.explanation.
Tell.what.you.would.have.done.differently.if.you.were.doing.the.study.over.again.
Tell.what.else.could.be.done.with.the.study.
1.
2.
1.
2.
3.
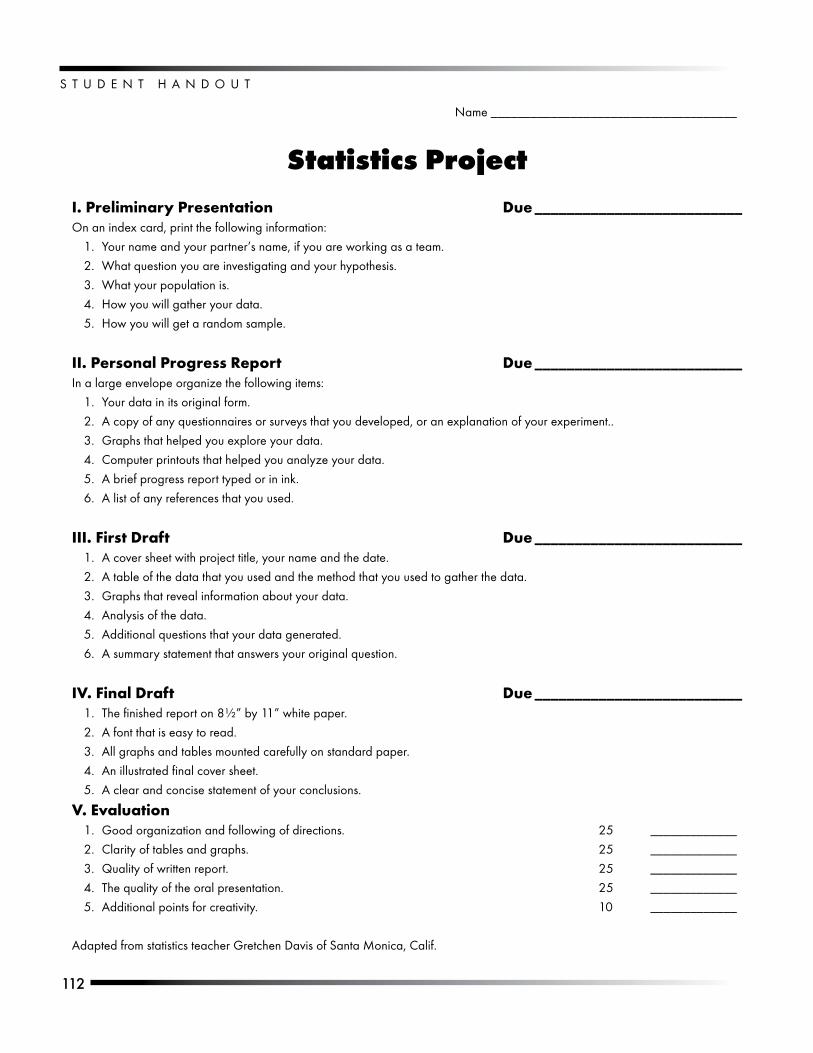
S T U D E N T . H A N D O U T
112
Name._____________________________________
Statistics ProjectI. Preliminary Presentation Due __________________________On.an.index.card,.print.the.following.information:
Your.name.and.your.partner’s.name,.if.you.are.working.as.a.team.
What.question.you.are.investigating.and.your.hypothesis.
What.your.population.is.
How.you.will.gather.your.data.
How.you.will.get.a.random.sample.
II. Personal Progress Report Due __________________________In.a.large.envelope.organize.the.following.items:
Your.data.in.its.original.form.
A.copy.of.any.questionnaires.or.surveys.that.you.developed,.or.an.explanation.of.your.experiment..
Graphs.that.helped.you.explore.your.data.
Computer.printouts.that.helped.you.analyze.your.data.
A.brief.progress.report.typed.or.in.ink.
A.list.of.any.references.that.you.used.
III. First Draft Due __________________________A.cover.sheet.with.project.title,.your.name.and.the.date.
A.table.of.the.data.that.you.used.and.the.method.that.you.used.to.gather.the.data.
Graphs.that.reveal.information.about.your.data.
Analysis.of.the.data.
Additional.questions.that.your.data.generated.
A.summary.statement.that.answers.your.original.question.
IV. Final Draft Due __________________________The.finished.report.on.8½”.by.11”.white.paper..
A.font.that.is.easy.to.read.
All.graphs.and.tables.mounted.carefully.on.standard.paper.
An.illustrated.final.cover.sheet.
A.clear.and.concise.statement.of.your.conclusions.
V. EvaluationGood.organization.and.following.of.directions.. 25. ._____________
Clarity.of.tables.and.graphs.. 25. ._____________
Quality.of.written.report.. 25. ._____________
The.quality.of.the.oral.presentation.. 25. ._____________
Additional.points.for.creativity.. 10. ._____________
Adapted.from.statistics.teacher.Gretchen.Davis.of.Santa.Monica,.Calif.
1.
2.
3.
4.
5.
1.
2.
3.
4.
5.
6.
1.
2.
3.
4.
5.
6.
1.
2.
3.
4.
5.
1.
2.
3.
4.
5.
http://www.WesternReservePublicMedia.org/quizbus
Video 5Probability

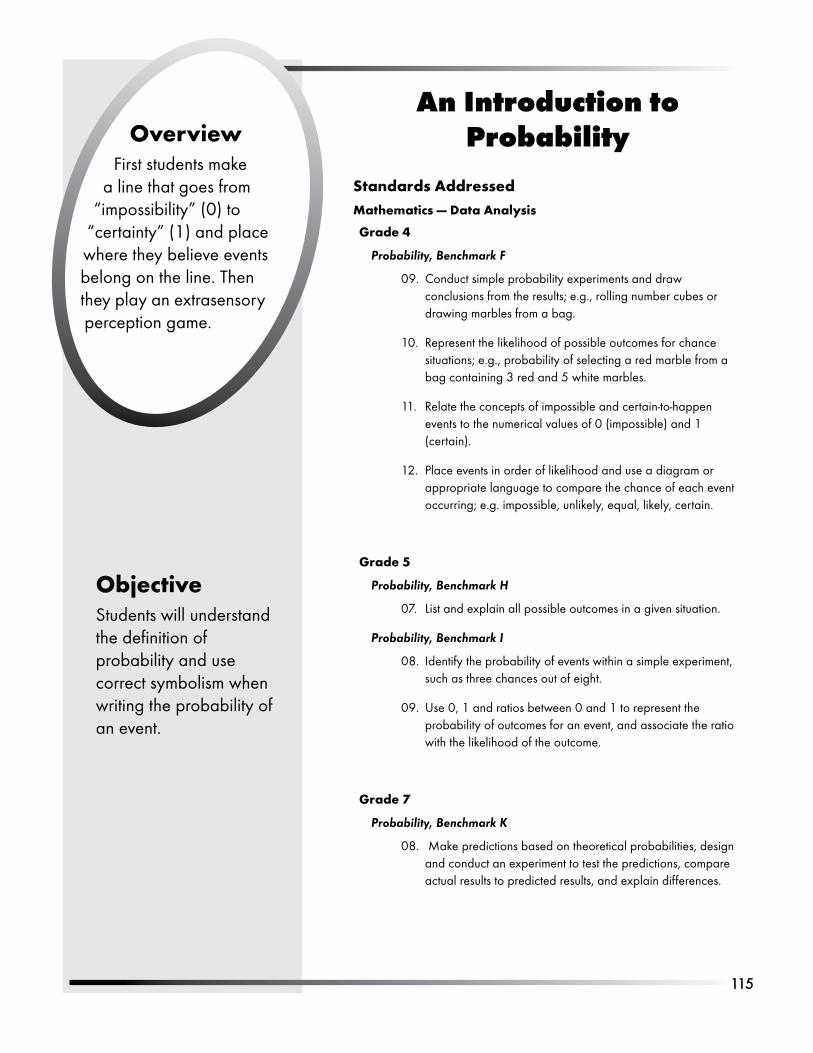
11�
An Introduction to ProbabilityOverview
First.students.make.a.line.that.goes.from.
“impossibility”.(0).to.“certainty”.(1).and.place.where.they.believe.events.belong.on.the.line..Then.they.play.an.extrasensory.perception.game.
ObjectiveStudents.will.understand.the.definition.of.probability.and.use.correct.symbolism.when.writing.the.probability.of.an.event.
Standards AddressedMathematics — Data Analysis
Grade 4
Probability, Benchmark F
09.. Conduct.simple.probability.experiments.and.draw.conclusions.from.the.results;.e.g.,.rolling.number.cubes.or.drawing.marbles.from.a.bag.
10.. Represent.the.likelihood.of.possible.outcomes.for.chance.situations;.e.g.,.probability.of.selecting.a.red.marble.from.a.bag.containing.3.red.and.5.white.marbles.
11.. Relate.the.concepts.of.impossible.and.certain-to-happen.events.to.the.numerical.values.of.0.(impossible).and.1.(certain).
12.. Place.events.in.order.of.likelihood.and.use.a.diagram.or.appropriate.language.to.compare.the.chance.of.each.event.occurring;.e.g..impossible,.unlikely,.equal,.likely,.certain.
Grade 5
Probability, Benchmark H
07.. List.and.explain.all.possible.outcomes.in.a.given.situation.
Probability, Benchmark I
08.. Identify.the.probability.of.events.within.a.simple.experiment,.such.as.three.chances.out.of.eight.
09.. Use.0,.1.and.ratios.between.0.and.1.to.represent.the.probability.of.outcomes.for.an.event,.and.associate.the.ratio.with.the.likelihood.of.the.outcome.
Grade 7
Probability, Benchmark K
08.. .Make.predictions.based.on.theoretical.probabilities,.design.and.conduct.an.experiment.to.test.the.predictions,.compare.actual.results.to.predicted.results,.and.explain.differences.

11�
MaterialsMultiple.red,.white.and.blue.game.tokens
Paper.bag
Index.cards
ProcedureAsk.students.to.take.out.a.piece.of.paper.and.draw.a.line.about.half-way.down..Ask.them.to.label.the.left.side.of.the.line.as.“Impossible”.and.the.right.side.of.the.line.as.“Certain.”
Read.each.of.the.sentences.below.and.ask.them.to.put.the.letter.of.the.sentence.where.they.think.it.goes.on.the.line.
You.will.grow.another.head.
You.will.take.at.least.one.more.breath.
You.will.toss.a.penny.and.it.will.land.heads-up.
You.will.go.on.a.vacation.next.summer.
You.will.go.to.the.moon.sometime.during.your.lifetime.
Have.a.discussion.about.the.students’.placements..“A”.should.be.considered.impossible;.“b”.would.be.certain.(although.they.sometimes.argue.that.it’s.not.absolutely.certain);.“c”.should.be.in.the.center.because.there’s.an.equally.likely.chance.of.getting.either;.and.“d”.and.“e”.are.variable.
After.this.has.been.discussed,.ask.the.students.what.percent.of.the.time.they.could.expect.to.toss.a.head.on.a.penny..They.should.say.50.percent..Write.50.percent.as.a.decimal.and.as.a.fraction.and.put.½.on.the.line.above.the.letter.“c.”
If.this.is.one-half.of.the.line,.they.should.draw.the.conclusion.that.½.is.halfway.between.0.and.1;.therefore,.an.impossible.event.has.a.value.of.0.and.a.certain.event.has.a.value.of.1..All.other.events.will.have.a.value.somewhere.between.0.and.1.and.
•
•
•
1.
2.
a.
b.
c.
d.
e.
3.
4.
5.
can.be.written.as.a.decimal,.a.fraction.(ratio).or.a.percent.
Place.five.red,.one.white.and.three.blue.game.tokens.in.a.paper.bag.and.record.the.quantities.on.the.board.
Ask.a.student.to.choose.a.token.and.tell.what.he.or.she.thinks.the.probability.is.for.getting.one.of.that.color..Do.this.several.times.(replacing.the.token.each.time).
Ask.the.class.to.build.a.definition.of.probability.from.this.activity..Record.their.ideas..Following.is.the.correct.definition:
P(Event).=.#.of.observations.favorable.to.the.eventTotal.possible.observations
Point.out.that.the.following.equation.is.the.correct.way.to.write.the.probability.of.tossing.a.coin.heads-up:.
P(heads).=.1.or.P(heads).=..5.or.P(heads).=.50%2
Go.back.to.you.bag.of.tokens..This.time,.have.the.first.student.pull.out.a.token.and.record.the.probability.of.the.color.drawn..Do.not.replace.the.token..Have.a.second.student.pull.out.a.token.and.record.the.probability..Repeat.this.several.more.times..The.students.should.see.immediately.that.the.total.will.change.with.each.draw.
If.the.students.need.further.help,.use.the.following.simulation:.Put.a.number.of.tokens.of.different.colors.into.the.bag,.only.make.each.color.equal.to.a.letter.grade..For.example,.red.equals.an.A,.blue.equals.a.B,.etc..Make.sure.you.have.the.same.number.of.tokens.in.the.bag.as.there.are.number.of.people.in.the.class..Tell.the.class.that.they.are.going.to.choose.their.report.card.grade.by.picking.a.token..Do.this.once.with.replacement.and.once.without.replacement..You.don’t.have.to.repeat.the.exercise.many.times.—.they.catch.on.quickly.
6.
7.
8.
9.
10.
11.
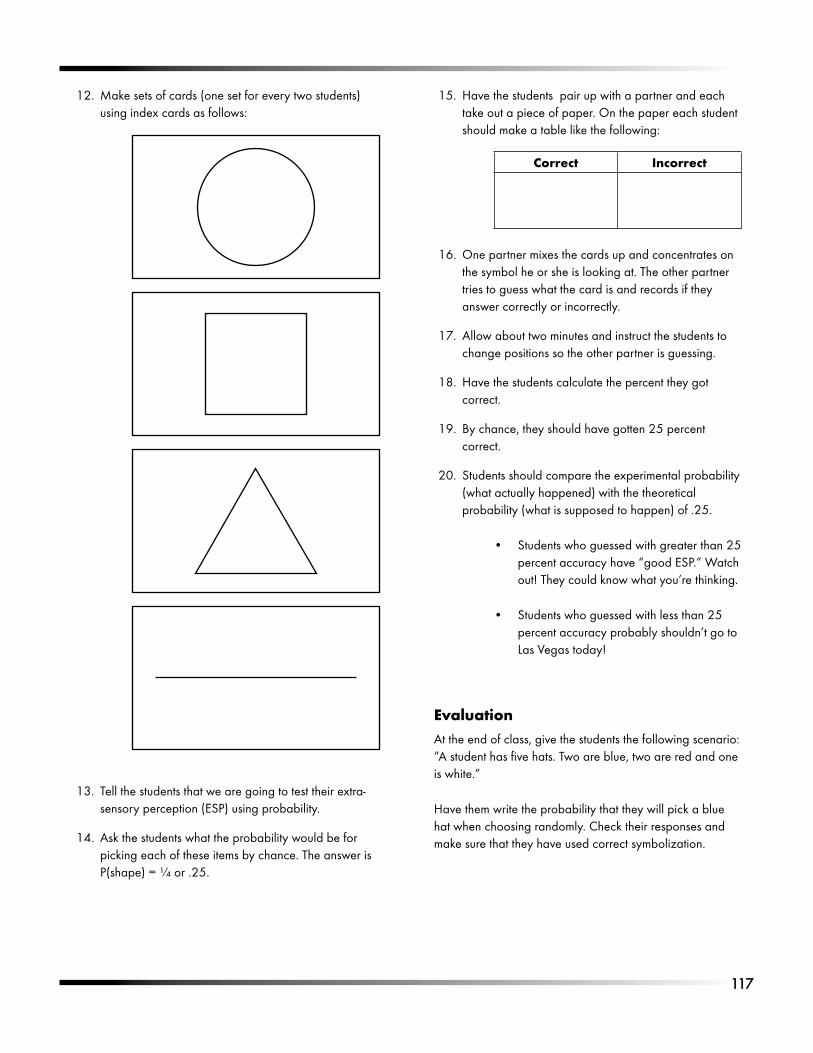
117
Have.the.students..pair.up.with.a.partner.and.each.take.out.a.piece.of.paper..On.the.paper.each.student.should.make.a.table.like.the.following:
Correct Incorrect
One.partner.mixes.the.cards.up.and.concentrates.on.the.symbol.he.or.she.is.looking.at..The.other.partner.tries.to.guess.what.the.card.is.and.records.if.they.answer.correctly.or.incorrectly.
Allow.about.two.minutes.and.instruct.the.students.to.change.positions.so.the.other.partner.is.guessing.
Have.the.students.calculate.the.percent.they.got.correct.
By.chance,.they.should.have.gotten.25.percent.correct..
Students.should.compare.the.experimental.probability.(what.actually.happened).with.the.theoretical.probability.(what.is.supposed.to.happen).of..25.
Students.who.guessed.with.greater.than.25.percent.accuracy.have.“good.ESP.”.Watch.out!.They.could.know.what.you’re.thinking.
Students.who.guessed.with.less.than.25.percent.accuracy.probably.shouldn’t.go.to.Las.Vegas.today!
EvaluationAt.the.end.of.class,.give.the.students.the.following.scenario:.“A.student.has.five.hats..Two.are.blue,.two.are.red.and.one.is.white.”
Have.them.write.the.probability.that.they.will.pick.a.blue.hat.when.choosing.randomly..Check.their.responses.and..make.sure.that.they.have.used.correct.symbolization.
15.
16.
17.
18.
19.
20.
•
•
Tell.the.students.that.we.are.going.to.test.their.extra-sensory.perception.(ESP).using.probability.
Ask.the.students.what.the.probability.would.be.for.picking.each.of.these.items.by.chance..The.answer.is.P(shape).=.¼.or..25..
13.
14.
Make.sets.of.cards.(one.set.for.every.two.students).using.index.cards.as.follows:.
12.
118
Tree DiagramsOverview
Students.review.the.basic.concepts.of.probability.and.
move.on.to.complementary.events,.independent.and.
dependent.events.and.compound.events..They.then.create.tree.diagrams.showing.the.sample.space.or.the.number.of.possible.outcomes.
ObjectiveStudents.will.be.able.to.write.the.probability.and.complement.of.an.event..They.will.be.able.to.tell.if.the.event.is.dependent.or.independent.
Standards AddressedMathematics — Data Analysis
Grade 4
Probability, Benchmark G
13.. List.and.count.all.possible.combinations.using.one.member.from.each.of.several.sets,.each.containing.two.or.three.members;.e.g.,.the.number.of.possible.outfits.from.three.shirts,.two.pairs.of.shorts.and.two.pairs.of.shoes.
Grade 5
Probability, Benchmark H
07.. List.and.explain.all.possible.outcomes.in.a.given.situation.
Probability, Benchmark I
08.. Identify.the.probability.of.events.within.a.simple.experiment,.such.as.three.chances.out.of.eight.
09.. Use.0,1.and.ratios.between.0.and.1.to.represent.the.probability.of.outcomes.for.an.event,.and.associate.the.ratio.with.the.likelihood.of.the.outcome.
Grade 7
Probability, Benchmark I
07.. Compute.probabilities.of.compound.events;.e.g.,.multiple.coin.tosses.or.multiple.rolls.of.number.cubes,.using.such.methods.as.organized.lists,.tree.diagrams.and.area.models.
Grade 8
Probability, Benchmark J
11.. Demonstrate.an.understanding.that.the.probability.of.either.of.two.disjoint.events.occurring.can.be.found.by.adding.the.probabilities.for.each.and.that.the.probability.of.one.independent.event.following.another.can.be.found.by.multiplying.the.probabilities.
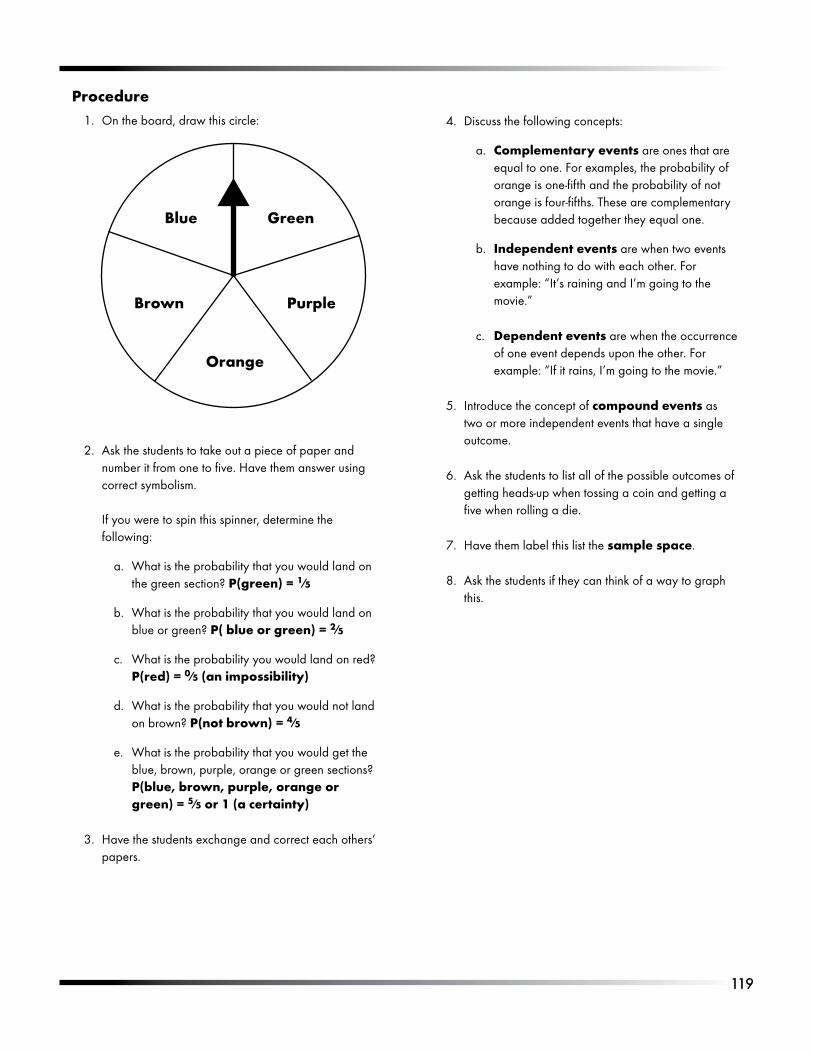
11�
ProcedureOn.the.board,.draw.this.circle:1. Discuss.the.following.concepts:
Complementary events.are.ones.that.are.equal.to.one..For.examples,.the.probability.of.orange.is.one-fifth.and.the.probability.of.not.orange.is.four-fifths..These.are.complementary.because.added.together.they.equal.one.
Independent events.are.when.two.events.have.nothing.to.do.with.each.other..For.example:.“It’s.raining.and.I’m.going.to.the.movie.”.
Dependent events.are.when.the.occurrence.of.one.event.depends.upon.the.other..For.example:.“If.it.rains,.I’m.going.to.the.movie.”
Introduce.the.concept.of.compound events.as.two.or.more.independent.events.that.have.a.single.outcome.
Ask.the.students.to.list.all.of.the.possible.outcomes.of.getting.heads-up.when.tossing.a.coin.and.getting.a.five.when.rolling.a.die.
Have.them.label.this.list.the.sample space.
Ask.the.students.if.they.can.think.of.a.way.to.graph.this..
4.
a.
b.
c.
5.
6.
7.
8.
Ask.the.students.to.take.out.a.piece.of.paper.and.number.it.from.one.to.five..Have.them.answer.using.correct.symbolism....If.you.were.to.spin.this.spinner,.determine.the.following:
What.is.the.probability.that.you.would.land.on.the.green.section?.P(green) = 1⁄5
What.is.the.probability.that.you.would.land.on.blue.or.green?.P( blue or green) = 2⁄5
What.is.the.probability.you.would.land.on.red?.P(red) = 0⁄5 (an impossibility)
What.is.the.probability.that.you.would.not.land.on.brown?.P(not brown) = 4⁄5
What.is.the.probability.that.you.would.get.the.blue,.brown,.purple,.orange.or.green.sections?.P(blue, brown, purple, orange or green) = 5⁄5 or 1 (a certainty)
Have.the.students.exchange.and.correct.each.others’.papers.
2.
a.
b.
c.
d.
e.
3.
Blue Green
Brown
Orange
Purple
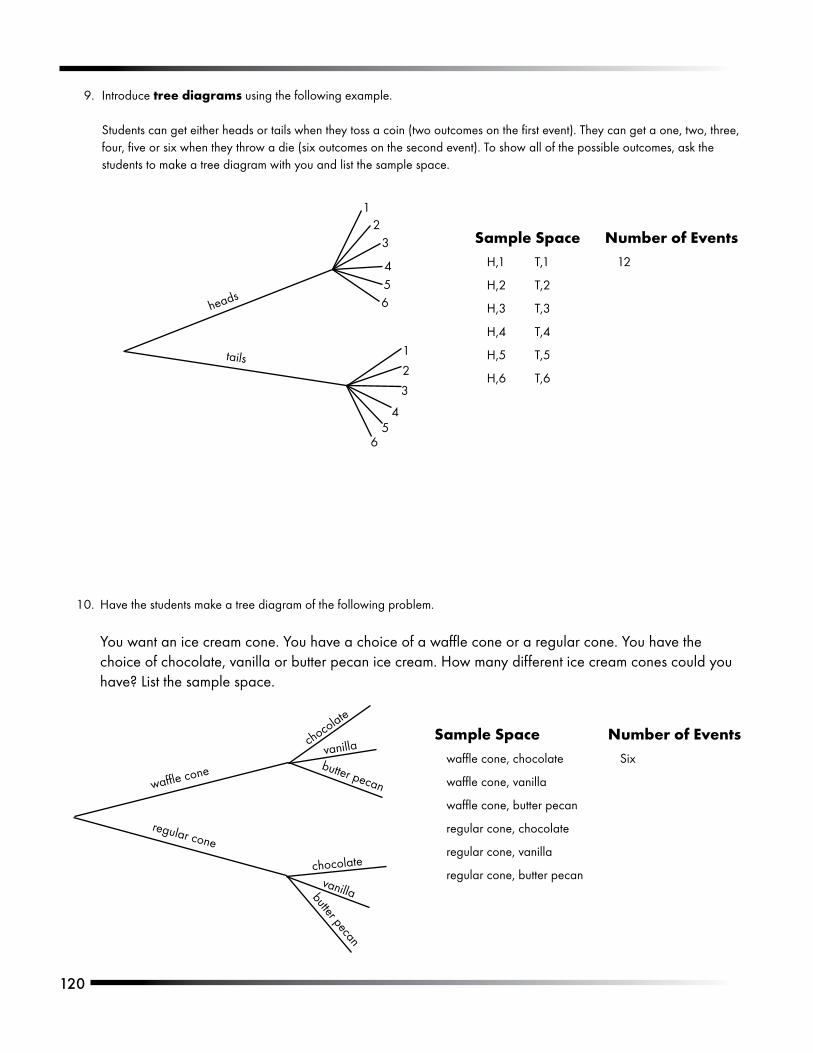
120
Introduce.tree diagrams using.the.following.example....Students.can.get.either.heads.or.tails.when.they.toss.a.coin.(two.outcomes.on.the.first.event)..They.can.get.a.one,.two,.three,.four,.five.or.six.when.they.throw.a.die.(six.outcomes.on.the.second.event)..To.show.all.of.the.possible.outcomes,.ask.the.students.to.make.a.tree.diagram.with.you.and.list.the.sample.space.
9.
Have.the.students.make.a.tree.diagram.of.the.following.problem..
You.want.an.ice.cream.cone..You.have.a.choice.of.a.waffle.cone.or.a.regular.cone..You.have.the.choice.of.chocolate,.vanilla.or.butter.pecan.ice.cream..How.many.different.ice.cream.cones.could.you.have?.List.the.sample.space.
10.
heads
12
3
456
tails 1
2
3
45
6
Sample SpaceH,1. T,1
H,2. T,2
H,3. T,3
H,4. T,4
H,5. T,5
H,6. T,6
Number of Events12
Sample Spacewaffle.cone,.chocolate
waffle.cone,.vanilla
waffle.cone,.butter.pecan
regular.cone,.chocolate
regular.cone,.vanilla
regular.cone,.butter.pecan
Number of EventsSix
waffle.cone
chocolate
vanillabutter.pecan
regular.cone
chocolate
vanillabutter.pecan
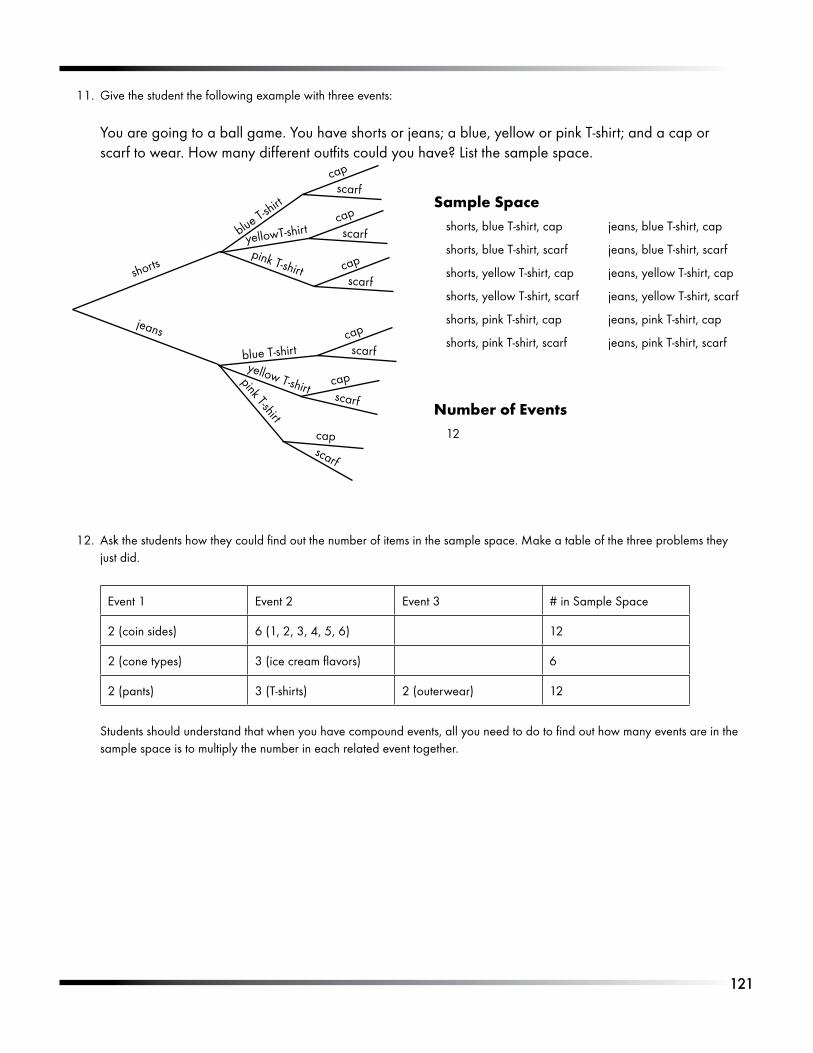
121
Give.the.student.the.following.example.with.three.events:
You.are.going.to.a.ball.game..You.have.shorts.or.jeans;.a.blue,.yellow.or.pink.T-shirt;.and.a.cap.or.scarf.to.wear..How.many.different.outfits.could.you.have?.List.the.sample.space.
11.
Ask.the.students.how.they.could.find.out.the.number.of.items.in.the.sample.space..Make.a.table.of.the.three.problems.they.just.did.
Event.1 Event.2 Event.3 #.in.Sample.Space
2.(coin.sides) 6.(1,.2,.3,.4,.5,.6) 12
2.(cone.types) 3.(ice.cream.flavors) 6
2.(pants) 3.(T-shirts) 2.(outerwear) 12
Students.should.understand.that.when.you.have.compound.events,.all.you.need.to.do.to.find.out.how.many.events.are.in.the.sample.space.is.to.multiply.the.number.in.each.related.event.together.
12.
Sample Spaceshorts,.blue.T-shirt,.cap. jeans,.blue.T-shirt,.cap
shorts,.blue.T-shirt,.scarf. jeans,.blue.T-shirt,.scarf
shorts,.yellow.T-shirt,.cap. jeans,.yellow.T-shirt,.cap
shorts,.yellow.T-shirt,.scarf. jeans,.yellow.T-shirt,.scarf
shorts,.pink.T-shirt,.cap. jeans,.pink.T-shirt,.cap
shorts,.pink.T-shirt,.scarf. jeans,.pink.T-shirt,.scarf
Number of Events12
shorts
blue.T-shirt
yellowT-shirt
pink.T-shirt
jeans
blue.T-shirtyellow.T-shirt
pink.T-shirt
capscarf
capscarf
capscarf
capscarf
capscarf
capscarf
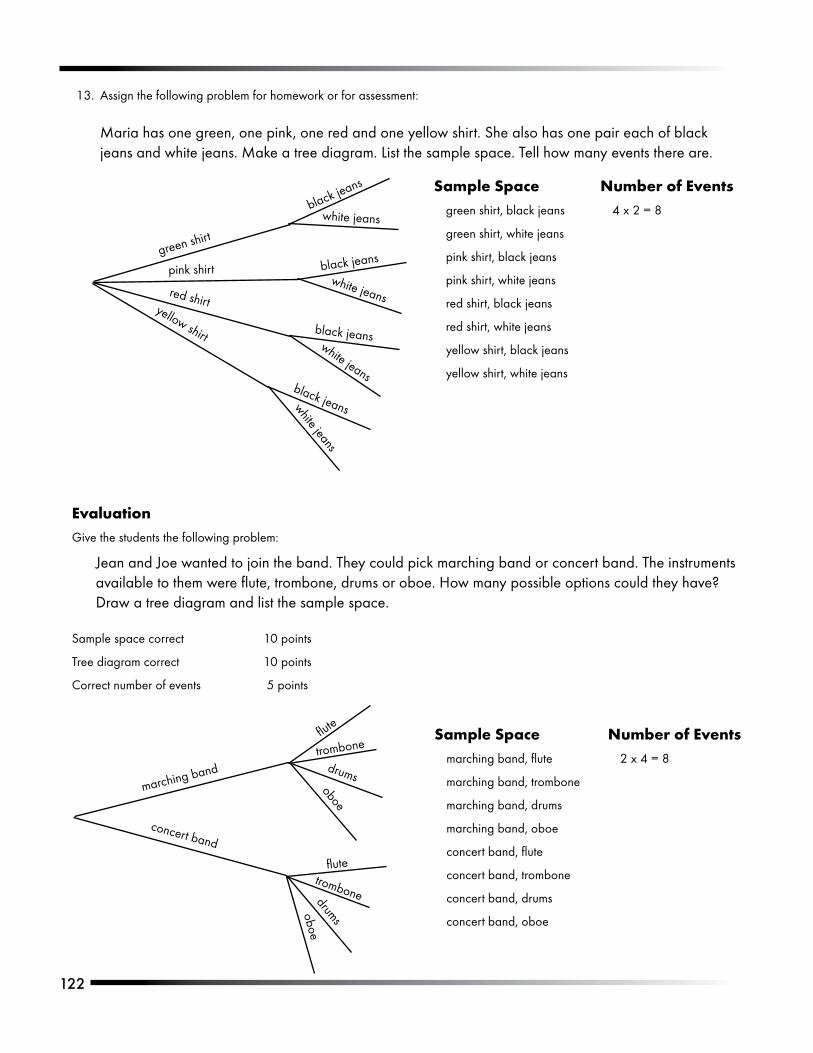
122
Assign.the.following.problem.for.homework.or.for.assessment:
Maria.has.one.green,.one.pink,.one.red.and.one.yellow.shirt..She.also.has.one.pair.each.of.black.jeans.and.white.jeans..Make.a.tree.diagram..List.the.sample.space..Tell.how.many.events.there.are.
13.
EvaluationGive.the.students.the.following.problem:
Jean.and.Joe.wanted.to.join.the.band..They.could.pick.marching.band.or.concert.band..The.instruments.available.to.them.were.flute,.trombone,.drums.or.oboe..How.many.possible.options.could.they.have?.Draw.a.tree.diagram.and.list.the.sample.space.
Sample.space.correct.. 10.points
Tree.diagram.correct. 10.points
Correct.number.of.events. .5.points
green.shirt
black.jeans
white.jeans
pink.shirt black.jeans
white.jeansred.shirt
black.jeanswhite.jeans
yellow.shirt
black.jeanswhite.jeans
Sample Spacegreen.shirt,.black.jeans
green.shirt,.white.jeans
pink.shirt,.black.jeans
pink.shirt,.white.jeans
red.shirt,.black.jeans
red.shirt,.white.jeans
yellow.shirt,.black.jeans
yellow.shirt,.white.jeans
Number of Events4.x.2.=.8
Sample Spacemarching.band,.flute
marching.band,.trombone
marching.band,.drums
marching.band,.oboe
concert.band,.flute
concert.band,.trombone
concert.band,.drums
concert.band,.oboe
Number of Events2.x.4.=.8
marching.band
flute
trombone
drums
concert.band
flutetrombonedrums
oboe
oboe
12�
Multiplying the Probability
OverviewStudents.create.
a.table.to.determine.the.probability.of.two.
events.happening.together.(compound.probability)..
They.learn.the.definitions.of.complementary.events,.independent.events,.dependent.events.and.compound.events..
Standards AddressedMathematics — Data Analysis
Grade 7
Probability, Benchmark I
07.. Compute.probabilities.of.compound.events;.e.g.,.multiple.coin.tosses.or.multiple.rolls.of.number.cubes,.using.such.methods.as.organized.lists,.tree.diagrams.and.area.models.
Grade 8
Probability, Benchmark J
11.. Demonstrate.an.understanding.that.the.probability.of.either.of.two.disjoint.events.occurring.can.be.found.by.adding.the.probabilities.for.each.and.that.the.probability.of.one.independent.event.following.another.can.be.found.by.multiplying.the.probabilities.
MaterialsLarge.model.of.a.die
Coin
ProcedureReview.the.following.definition.of.probability:
P(event).=.possibility.of.event
total.possible.outcomes
Review.tree.diagrams,.experimental.vs..theoretical.probability,.the.concept.of.certainty.vs..impossibility.and.the.fact.that.probability.is.shown.as.a.fraction.or.decimal.between.0.and.1.
•
•
1.
2.
Objective
Students.will.be.able.to.demonstrate.an.understanding.of.compound.events..
12�
Have.a.large.die.that.the.students.can.see.as.they.answer.the.following.questions..
Write.the.sample.space.for.tossing.this.die..Answer:.1,.2,.3,.4,.5.and.6..
The.probability.of.rolling.each.number.on.the.die.is.P(1).=.1⁄6;.P(2).=.1⁄6,.etc..Ask.the.students.if.the.probability.of.rolling.a.one.is.one.in.six,.then.what.would.be.the.probability.of.not.getting.a.one?.Answer: P(not.1).=.5⁄6. This.is.called.the.complement.of.the.event..When.two.complementary.events.are.added.together,.they.must.equal.one.
Ask.what.the.probability.would.be.of.rolling.a.seven.on.this.die..Answer: P(7).=.0⁄6.or.0..This.would.be.called.an.impossibility.
Ask.the.students.to.tell.what.the.words.dependent.and.independent.mean..Answer: Dependent.means.conditioned.or.determined.by.something.else.or.contingent.upon..Independent.means.not.influenced.or.controlled.by.others.or.standing.alone.
Give.the.student.theses.two.scenarios:
I’m.going.to.the.movies.if.it.rains.on.Tuesday.
I’m.going.to.the.movies.on.Tuesday.whether.it.rains.or.not.
Ask.which.is.dependent.and.which.is.independent..Answer: A.is.dependent.because.attending.the.movie.depends.on.whether.or.not.it.rains..B.is.independent.because.both.going.to.the.movies.and.whether.it.rains.or.not.are.stand-alone.events.
Review.compound.events.—.when.two.or.more.independent.events.are.thought.of.as.a.single.unit.Have.the.students.figure.out.the.probability.of.throwing.a.one.on.the.die.along.with.tossing..heads.with.a.coin..Give.them.about.five.minutes.to.figure.it.out.and.then.ask.someone.to.explain.how.they.got.the.answer..Answer: Students.can.use.a.variety.of.ways.to.solve.this.problem..A.tree.diagram.is.one.way..P.=.1⁄6.x.1⁄2.=.1⁄12..So.theoretically,.you.should.roll.a.one.on.a.die.plus.get.heads.when.a.coin.is.tossed.once.in.every.12.times..This.is.a.compound.event..
3.
a.
b.
c.
4.
5.
a.
b.
6.
Have.the.students.compute.one.more.example..A.girl.has.three.sweaters:.red,.blue.and.yellow..She.has.two.pairs.of.pants:.jeans.and.shorts..What.is.the.probability.that.she.will.choose.a.red.sweater.and.jeans?.Answer: P(red.sweater.and.jeans).=.1⁄3.x.½.=.1⁄6..
Remind.the.students.that.to.find.the.compound.probability,.you.would.multiply.the.probability.of.the.two.independent.events.
Review.the.concept.of.using.a.geometric.shape.to.help.you.solve.the.problem.(area.models).
Have.the.students.work.with.a.partner.on.the.Compound.Probability.student.sheet..If.you.think.they.will.have.difficulty.with.this.concept,.you.could.do.Box.A.with.them.
EvaluationThere.are.16.possible.answers.that.the.student.could.get.right.or.wrong.on.this.sheet..A.percentage.of.the.number.correct.would.be.one.way.of.giving.a.grade.for.this.worksheet.
7.
8.
9.
10.
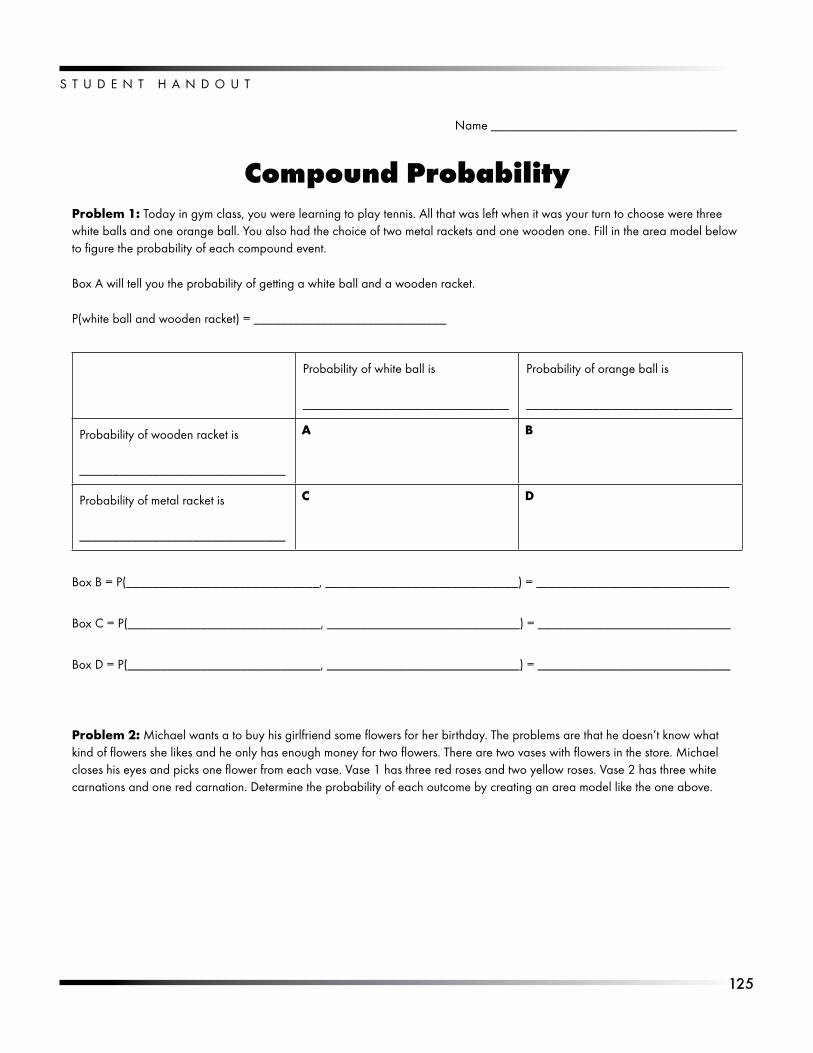
12�
S T U D E N T . H A N D O U T
Name._____________________________________
Compound ProbabilityProblem 1: Today.in.gym.class,.you.were.learning.to.play.tennis..All.that.was.left.when.it.was.your.turn.to.choose.were.three.white.balls.and.one.orange.ball..You.also.had.the.choice.of.two.metal.rackets.and.one.wooden.one..Fill.in.the.area.model.below.to.figure.the.probability.of.each.compound.event..
Box.A.will.tell.you.the.probability.of.getting.a.white.ball.and.a.wooden.racket..
P(white.ball.and.wooden.racket).=._____________________________
Probability.of.white.ball.is
_______________________________
Probability.of.orange.ball.is.
_______________________________
Probability.of.wooden.racket.is
_______________________________
A B
Probability.of.metal.racket.is
_______________________________
C D
Box.B.=.P(_____________________________,._____________________________).=._____________________________.
Box.C.=.P(_____________________________,._____________________________).=._____________________________.
Box.D.=.P(_____________________________,._____________________________).=._____________________________.
Problem 2: Michael.wants.a.to.buy.his.girlfriend.some.flowers.for.her.birthday..The.problems.are.that.he.doesn’t.know.what.kind.of.flowers.she.likes.and.he.only.has.enough.money.for.two.flowers..There.are.two.vases.with.flowers.in.the.store..Michael.closes.his.eyes.and.picks.one.flower.from.each.vase..Vase.1.has.three.red.roses.and.two.yellow.roses..Vase.2.has.three.white.carnations.and.one.red.carnation..Determine.the.probability.of.each.outcome.by.creating.an.area.model.like.the.one.above.
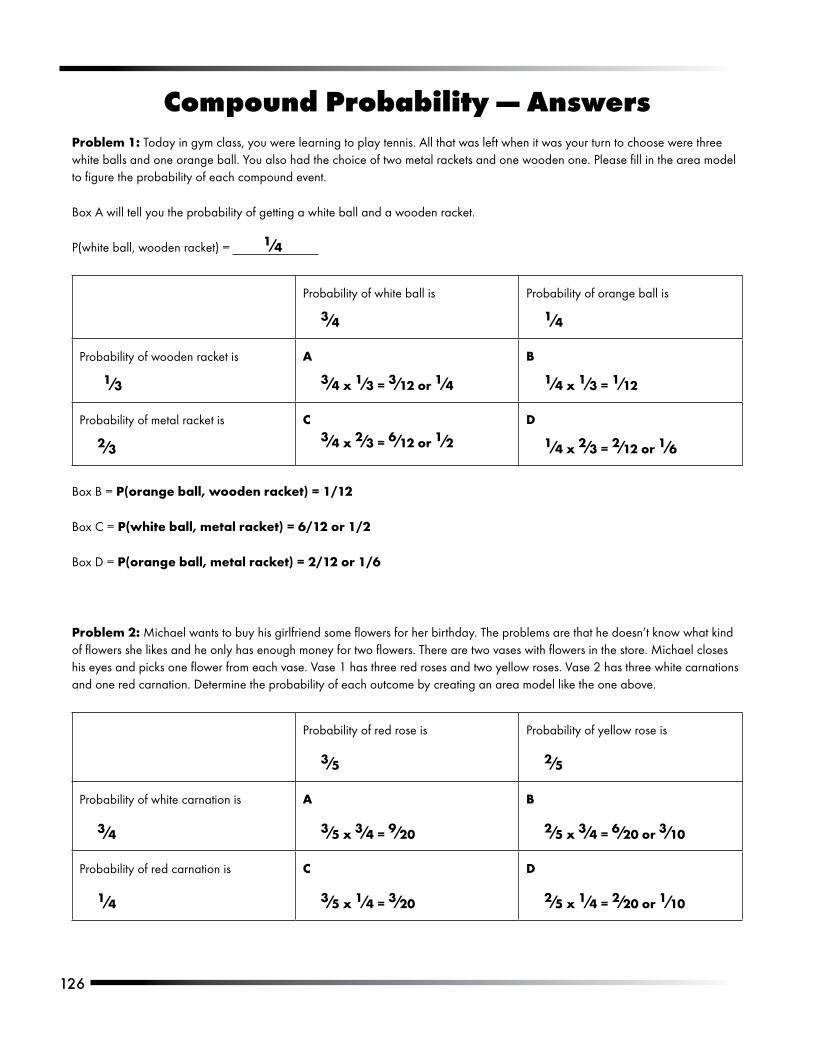
12�
Compound Probability — AnswersProblem 1: Today.in.gym.class,.you.were.learning.to.play.tennis..All.that.was.left.when.it.was.your.turn.to.choose.were.three.white.balls.and.one.orange.ball..You.also.had.the.choice.of.two.metal.rackets.and.one.wooden.one..Please.fill.in.the.area.model.to.figure.the.probability.of.each.compound.event..
Box.A.will.tell.you.the.probability.of.getting.a.white.ball.and.a.wooden.racket..
P(white.ball,.wooden.racket).=. 1⁄4
Probability.of.white.ball.is
3⁄4
Probability.of.orange.ball.is.
1⁄4
Probability.of.wooden.racket.is
1⁄3
A
3⁄4 x 1⁄3 = 3⁄12 or 1⁄4
B
1⁄4 x 1⁄3 = 1⁄12
Probability.of.metal.racket.is
2⁄3
C3⁄4 x 2⁄3 = 6⁄12 or 1⁄2
D
1⁄4 x 2⁄3 = 2⁄12 or 1⁄6
Box.B.=.P(orange ball, wooden racket) = 1/12
Box.C.=.P(white ball, metal racket) = 6/12 or 1/2
Box.D.=.P(orange ball, metal racket) = 2/12 or 1/6
Problem 2: Michael.wants.to.buy.his.girlfriend.some.flowers.for.her.birthday..The.problems.are.that.he.doesn’t.know.what.kind.of.flowers.she.likes.and.he.only.has.enough.money.for.two.flowers..There.are.two.vases.with.flowers.in.the.store..Michael.closes.his.eyes.and.picks.one.flower.from.each.vase..Vase.1.has.three.red.roses.and.two.yellow.roses..Vase.2.has.three.white.carnations.and.one.red.carnation..Determine.the.probability.of.each.outcome.by.creating.an.area.model.like.the.one.above..
Probability.of.red.rose.is
3⁄5
Probability.of.yellow.rose.is.
2⁄5
Probability.of.white.carnation.is
3⁄4
A
3⁄5 x 3⁄4 = 9⁄20
B
2⁄5 x 3⁄4 = 6⁄20 or 3⁄10
Probability.of.red.carnation.is
1⁄4
C
3⁄5 x 1⁄4 = 3⁄20
D
2⁄5 x 1⁄4 = 2⁄20 or 1⁄10
127
ProbabilityNative American Stick GameOverview
This.game.is.based.on.a.Native.American.game.of.
chance..Students.compare.what.happened.in.their.game.(experimental.probability).with.what.is.supposed.to.happen.(theoretical.
probability)..
ObjectiveStudents.will.be.able.to.explain.theoretical.and.experimental.probability..
Standards AddressedMathematics — Data Analysis
Grade 4
Probability, Benchmark G
13.. List.and.count.all.possible.combinations.using.one.member.from.each.of.several.sets,.each.containing.2.or.3.members;.e.g.,.the.number.of.possible.outfits.from.3.shirts,.2.shorts.and.2.pair.of.shoes.
Grade 5
Probability, Benchmark J
10.. Compare.what.should.happen.(theoretical/expected.results).with.what.did.happen.(experimental/actual.results).in.a.simple.experiment.
Probability, Benchmark K
11.. Make.predictions.based.on.experimental.and.theoretical.probabilities.
Grade 7
Probability, Benchmark I
07.. Compute.probabilities.of.compound.events;.e.g.,.multiple.coin.tosses.or.multiple.rolls.of.number.cubes,.using.such.methods.as.organized.lists,.tree.diagrams.and.area.models..
MaterialsFour.sticks.(tongue.depressors.or.Popsicle.sticks).per.player
12.game.tokens.per.group.of.three.or.four.students..
Colored.markers.or.paint
•
•
•
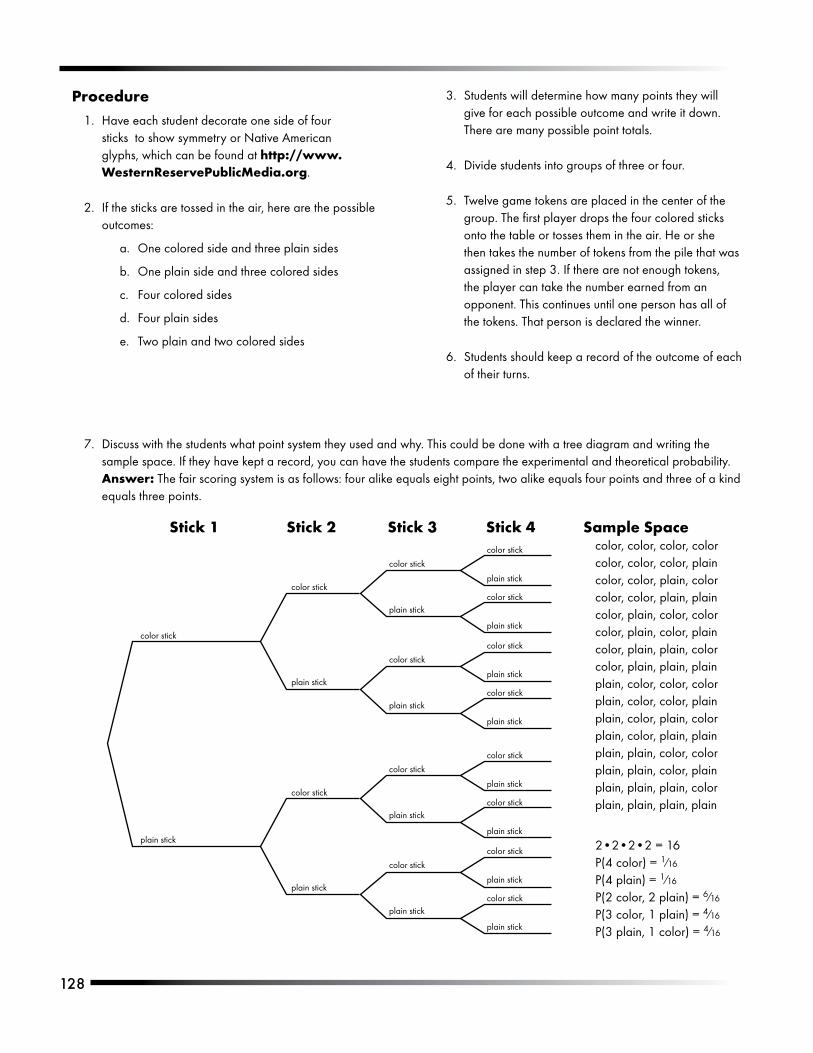
128
ProcedureHave.each.student.decorate.one.side.of.four.sticks..to.show.symmetry.or.Native.American.glyphs,.which.can.be.found.at.http://www.WesternReservePublicMedia.org..
If.the.sticks.are.tossed.in.the.air,.here.are.the.possible.outcomes:
One.colored.side.and.three.plain.sides
One.plain.side.and.three.colored.sides
Four.colored.sides
Four.plain.sides
Two.plain.and.two.colored.sides
1.
2.
a.
b.
c.
d.
e.
color.stick
color.stick
plain.stick
color.stick
plain.stick
color.stick
plain.stick
color.stick
plain.stick
color.stick
plain.stick
color.stick
plain.stick
color.stick
plain.stick
color.stick
plain.stick
color.stick
plain.stick
color.stick
plain.stick
color.stick
plain.stick
color.stick
plain.stick
color.stick
plain.stick
color.stick
plain.stick
plain.stick
Sample Spacecolor,.color,.color,.colorcolor,.color,.color,.plaincolor,.color,.plain,.colorcolor,.color,.plain,.plaincolor,.plain,.color,.colorcolor,.plain,.color,.plaincolor,.plain,.plain,.colorcolor,.plain,.plain,.plainplain,.color,.color,.colorplain,.color,.color,.plainplain,.color,.plain,.colorplain,.color,.plain,.plainplain,.plain,.color,.colorplain,.plain,.color,.plainplain,.plain,.plain,.colorplain,.plain,.plain,.plain
2•2•2•2.=.16P(4.color).=.1⁄16
P(4.plain).=.1⁄16
P(2.color,.2.plain).=.6⁄16
P(3.color,.1.plain).=.4⁄16
P(3.plain,.1.color).=.4⁄16
Stick 1 Stick 2 Stick 3 Stick 4
Students.will.determine.how.many.points.they.will.give.for.each.possible.outcome.and.write.it.down..There.are.many.possible.point.totals.
Divide.students.into.groups.of.three.or.four.
Twelve.game.tokens.are.placed.in.the.center.of.the.group..The.first.player.drops.the.four.colored.sticks.onto.the.table.or.tosses.them.in.the.air..He.or.she.then.takes.the.number.of.tokens.from.the.pile.that.was.assigned.in.step.3..If.there.are.not.enough.tokens,.the.player.can.take.the.number.earned.from.an.opponent..This.continues.until.one.person.has.all.of.the.tokens..That.person.is.declared.the.winner..
Students.should.keep.a.record.of.the.outcome.of.each.of.their.turns.
3.
4.
5.
6.
Discuss.with.the.students.what.point.system.they.used.and.why..This.could.be.done.with.a.tree.diagram.and.writing.the.sample.space..If.they.have.kept.a.record,.you.can.have.the.students.compare.the.experimental.and.theoretical.probability..Answer: The.fair.scoring.system.is.as.follows:.four.alike.equals.eight.points,.two.alike.equals.four.points.and.three.of.a.kind.equals.three.points.
7.
12�
NOTE:.There.are.many.variations.of.this.game..One.variation.is.to.use.six.sticks.and.10.game.tokens..The.scoring.is.as.follows:
If.all.six.sticks.land.on.the.colored.side,.the.player.takes.three.tokens.
If.all.six.sticks.land.on.the.plain.side,.the.player.takes.three.tokens.
If.three.are.plain.and.three.are.colored,.the.player.takes.one.token.
If.any.other.combination.comes.up,.the.player.gets.no.tokens.
Players.can.take.tokens.from.each.other.when.none.are.in.the.middle..The.winner.is.the.person.who.collects.all.the.tokens..The.probability.for.this.game.is.more.difficult.to.determine.
1.
2.
3.
4.
EvaluationMade.a.frequency.table.showing.their.tosses.. 5.points
Made.a.tree.diagram.. 5.points
Wrote.the.sample.space.. 5.points
Calculated.the.theoretical.probability.. 5.points
Made.a.fair.scoring.system.. 5.points
There.are.many.versions.of.this.game.online..One.version.can.be.found.at.http://educ.queensu.ca/~fmc/april2003/NativeAmericanGame.html.
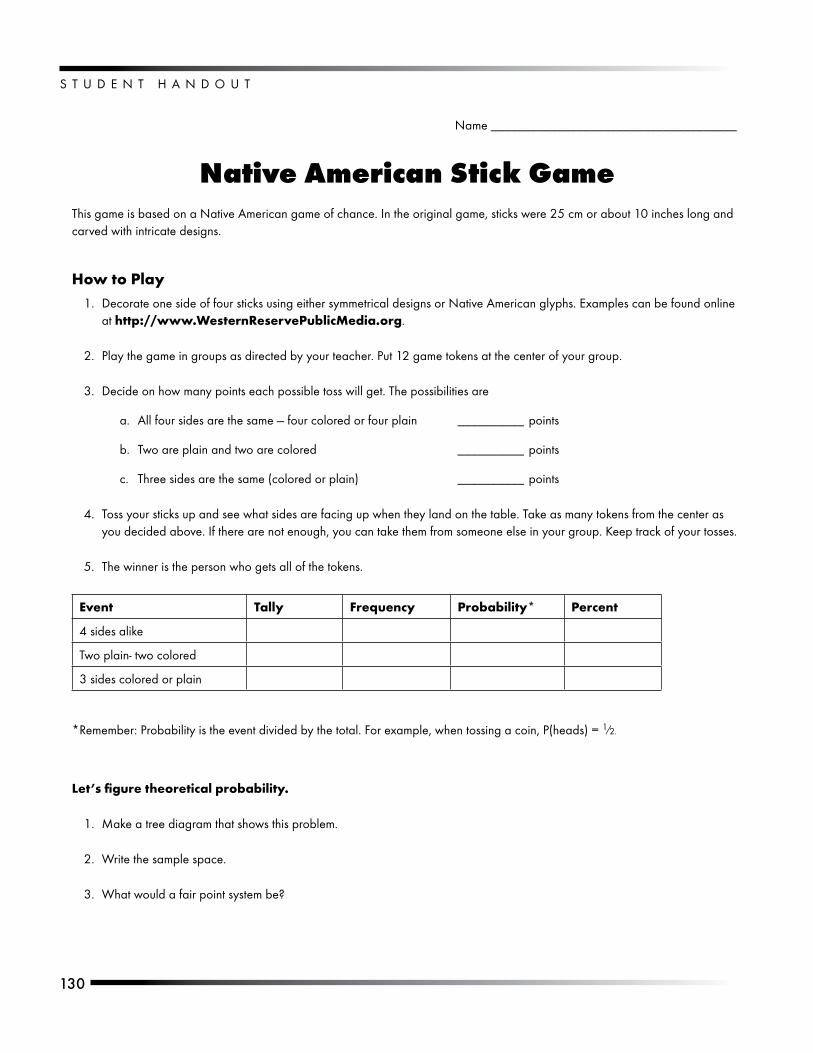
S T U D E N T . H A N D O U T
1�0
Name._____________________________________
Native American Stick GameThis.game.is.based.on.a.Native.American.game.of.chance..In.the.original.game,.sticks.were.25.cm.or.about.10.inches.long.and.carved.with.intricate.designs.
How to PlayDecorate.one.side.of.four.sticks.using.either.symmetrical.designs.or.Native.American.glyphs..Examples.can.be.found.online.at.http://www.WesternReservePublicMedia.org...
Play.the.game.in.groups.as.directed.by.your.teacher..Put.12.game.tokens.at.the.center.of.your.group..
Decide.on.how.many.points.each.possible.toss.will.get..The.possibilities.are
All.four.sides.are.the.same.—.four.colored.or.four.plain. . __________.points
Two.are.plain.and.two.are.colored. . __________.points
Three.sides.are.the.same.(colored.or.plain). . __________.points
Toss.your.sticks.up.and.see.what.sides.are.facing.up.when.they.land.on.the.table..Take.as.many.tokens.from.the.center.as.you.decided.above..If.there.are.not.enough,.you.can.take.them.from.someone.else.in.your.group..Keep.track.of.your.tosses.
The.winner.is.the.person.who.gets.all.of.the.tokens..
Event Tally Frequency Probability* Percent
4.sides.alike
Two.plain-.two.colored
3.sides.colored.or.plain
*Remember:.Probability.is.the.event.divided.by.the.total..For.example,.when.tossing.a.coin,.P(heads).=.1⁄2.
Let’s figure theoretical probability.
Make.a.tree.diagram.that.shows.this.problem.
Write.the.sample.space.
What.would.a.fair.point.system.be?
1.
2.
3.
a.
b.
c.
4.
5.
1.
2.
3.
1�1
Experimental vs. Theoretical Probability
The Checkout Game
OverviewStudents.learn.
about.the.difference.and.relationship.
between.theoretical.and.experimental.probability.through.several.activities,..including.a.game.and.an.area.model.
ObjectiveStudents.will.be.able.to.compute.and.describe.theoretical.probabilities.for.an.event..
Standards Addressed
Mathematics — Data Analysis
Grade 5
Probability, Benchmark J
10.. Compare.what.should.happen.(theoretical/expected.results).with.what.did.happen.(experimental/actual.results).in.a.simple.experiment.
Probability, Benchmark K
11.. Make.predictions.based.on.experimental.and.theoretical.probabilities..
Grade 6
Probability, Benchmark K
07.. Design.an.experiment.to.test.a.theoretical.probability.and.explain.how.results.may.vary..
.
Grade 7
Probability, Benchmark K
08.. Make.predictions.based.on.theoretical.probabilities,.design.and.conduct.an.experiment.to.test.the.predictions,.compare.actual.results.to.predicted.results,.and.explain.differences..
Grade 8
Probability, Benchmark H
10.. Calculate.the.number.of.possible.outcomes.for.a.situation,.recognizing.and.accounting.for.when.items.may.occur.more.than.once.or.when.order.is.important..
1�2
MaterialsGame.tokens.
ProcedureGive.students.the.Checkout.Game.Directions.handout,.along.with.the.game.board..After.reviewing.the.rules,..divide.the.class.into.teams.of.two.and.hand.out.game.tokens..Have.students.play.the.game.four.times..Discuss.frequency.tables.and.have.them.record.their.data.on.the.Frequency.Table.handout.as.they.play.the.game.
Give.the.students.the.Area.Model.worksheet.to.complete.as.a.class.or.individually..Ask.them.to.use.this.information.and.play.the.checkout.game.two.more.times.with.the.same.partner and.add.the.outcomes.to.their.frequency.tables.
Have.students.figure.experimental.probability.of.various.outcomes.for.their.games..Have.them.compare.with.their.partner.from.previous.rounds..Combine.all.results.to.get.class.experimental.probability.of.at.least.one.outcome..Discuss.how.the.greater.the.number.of.trials,.the.closer.the.experimental.probability.will.be.to.the.theoretical.probability.
•
1.
2.
3.
EvaluationEvaluate.the.student.handouts.
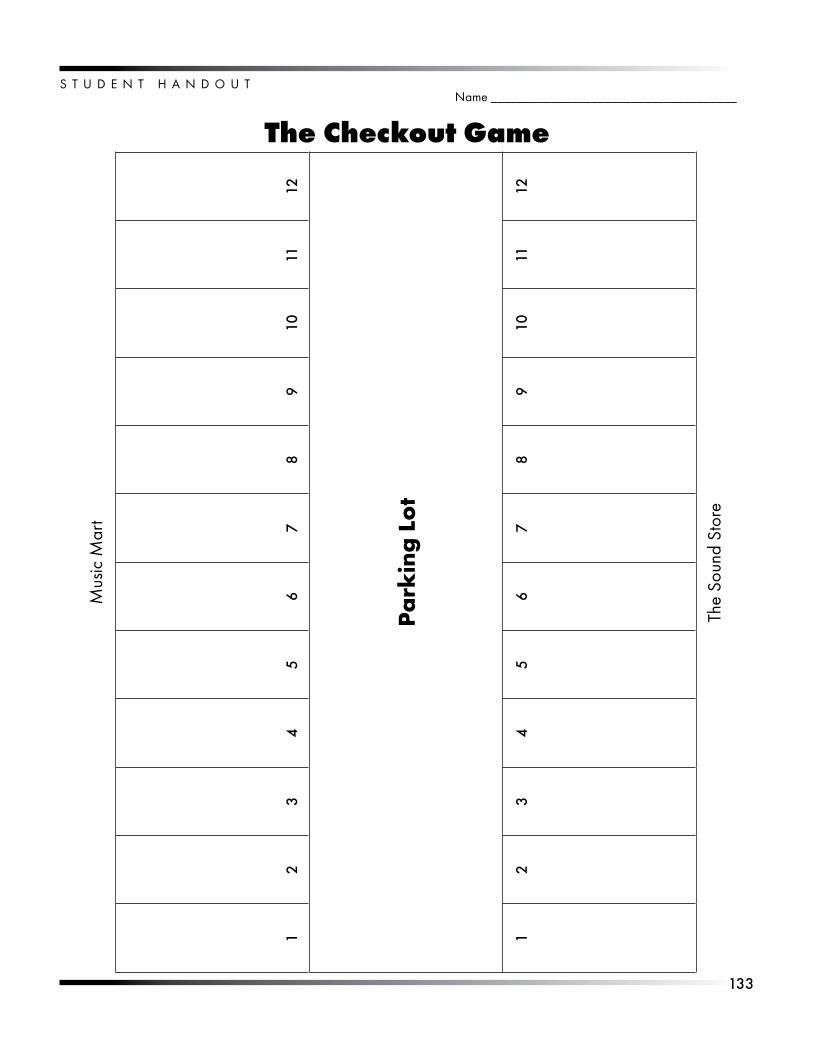
1��
S T U D E N T . H A N D O U T
12
��
��
78
�10
1112
Pa
rkin
g L
ot
12
��
��
78
�10
1112
Mus
ic.M
art
The.
Soun
d.St
ore
Name._____________________________________
The Checkout Game
S T U D E N T . H A N D O U T
1��
The Checkout GameDirections
This.is.a.two-player.game..Each.player.receives.12.game.tokens.representing.music.CDs..Each.player.places.the.tokens.in.any.of.the.checkout.aisles.marked.1-12.in.the.store.on..his/her.side.of.the.board..Choose.any.of.the.aisles.you.desire,.putting.any.number.of.tokens.on.a.space.as.you.would.like.
Take.turns.rolling.two.dice..On.each.roll,.determine.the.sum.of.the.dice..If.you.have.CDs.in.that.numbered.checkout.aisle,.move.one.CD.to.the.parking.lot..The.winner.is.determined.by.the.first.player.to.have.all.of.their.CDs.in.the.parking.lot.
Problem: What is the best arrangement for the CDs?
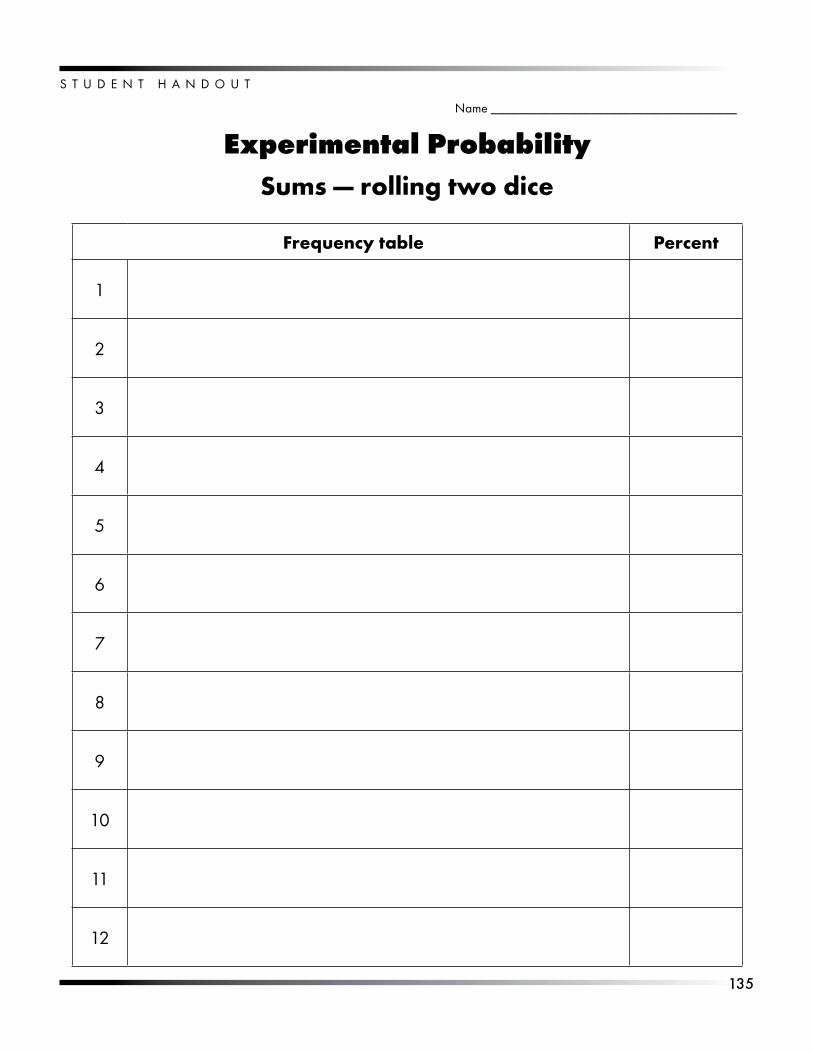
1��
S T U D E N T . H A N D O U T
Name._____________________________________
Experimental ProbabilitySums — rolling two dice
Frequency table Percent
1
2
3
4
5
6
7
8
9
10
11
12
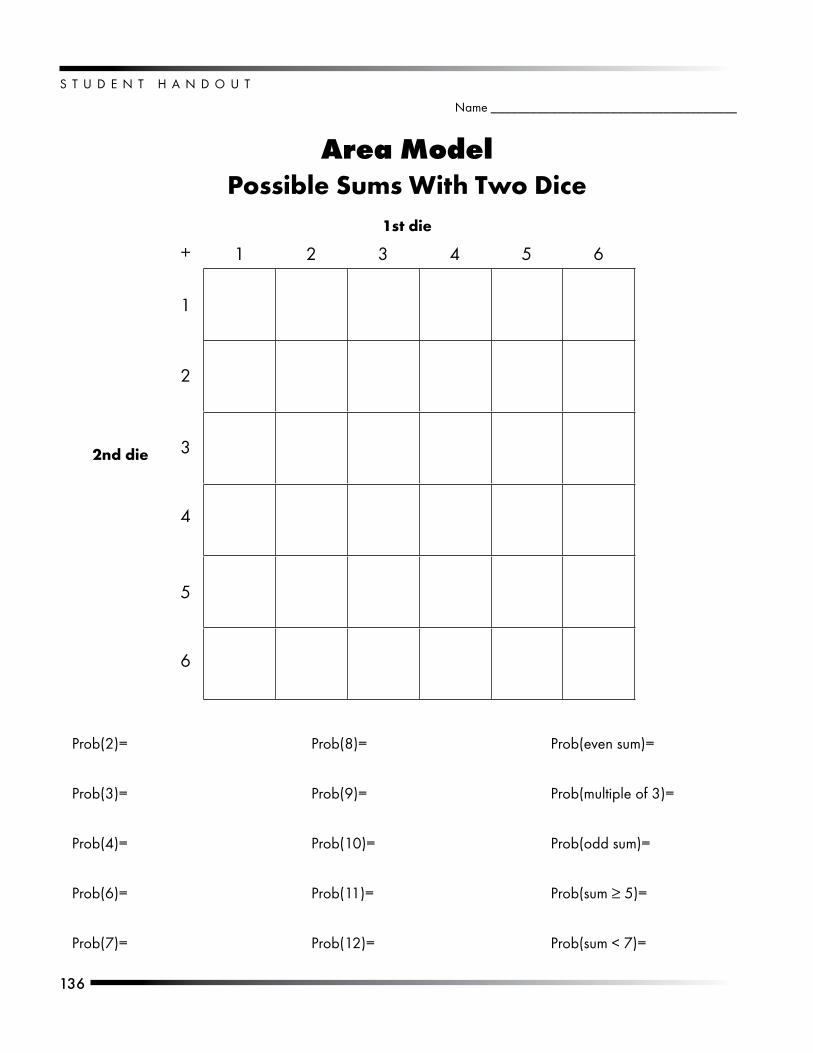
S T U D E N T . H A N D O U T
1��
Name._____________________________________
Area ModelPossible Sums With Two Dice
Prob(2)=
Prob(3)=
Prob(4)=
Prob(6)=
Prob(7)=.
. 1. 2. 3. 4. 5. 6+
1
2
3
4
5
6
1st die
2nd die
Prob(8)=
Prob(9)=
Prob(10)=
Prob(11)=
Prob(12)=
Prob(even.sum)=
Prob(multiple.of.3)=
Prob(odd.sum)=.
Prob(sum.≥.5)=
Prob(sum.<.7)=
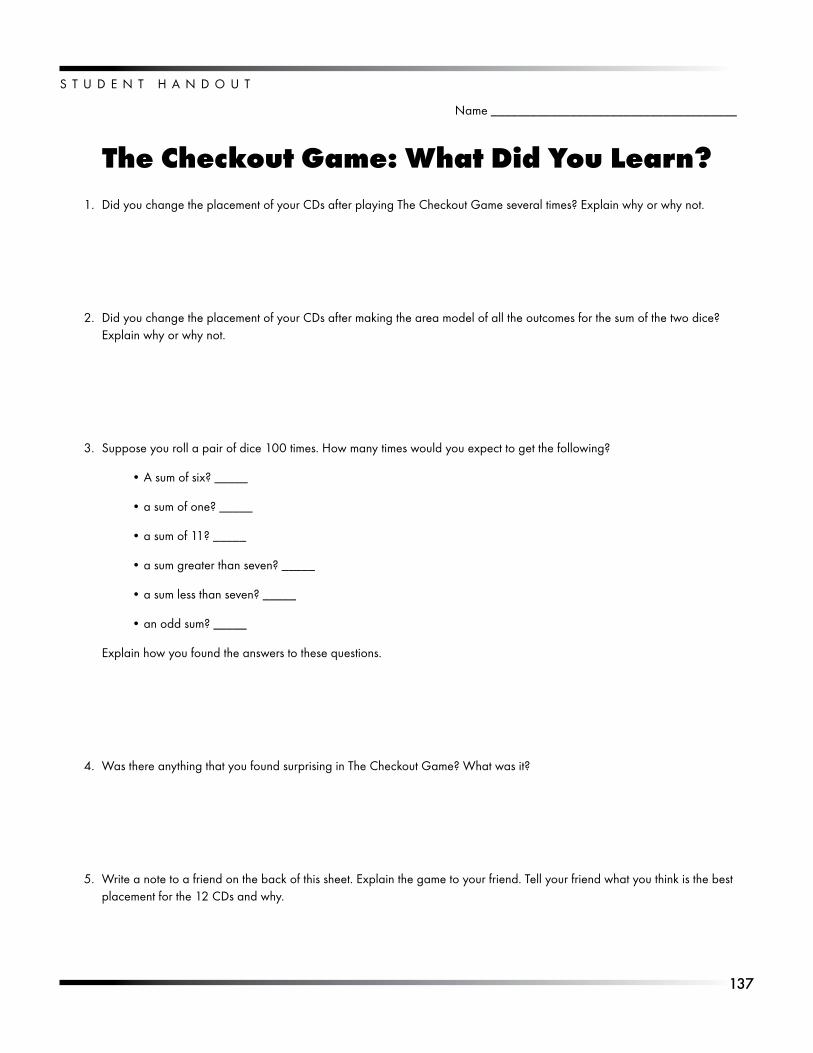
1�7
S T U D E N T . H A N D O U T
Name._____________________________________
The Checkout Game: What Did You Learn?Did.you.change.the.placement.of.your.CDs.after.playing.The.Checkout.Game.several.times?.Explain.why.or.why.not.
Did.you.change.the.placement.of.your.CDs.after.making.the.area.model.of.all.the.outcomes.for.the.sum.of.the.two.dice?.Explain.why.or.why.not.
Suppose.you.roll.a.pair.of.dice.100.times..How.many.times.would.you.expect.to.get.the.following?
A.sum.of.six?._____
a.sum.of.one?._____
a.sum.of.11?._____
a.sum.greater.than.seven?._____
a.sum.less.than.seven?._____
an.odd.sum?._____
Explain.how.you.found.the.answers.to.these.questions.
Was.there.anything.that.you.found.surprising.in.The.Checkout.Game?.What.was.it?
Write.a.note.to.a.friend.on.the.back.of.this.sheet..Explain.the.game.to.your.friend..Tell.your.friend.what.you.think.is.the.best.placement.for.the.12.CDs.and.why..
1.
2.
3.
•
•
•
•
•
•
4.
5.
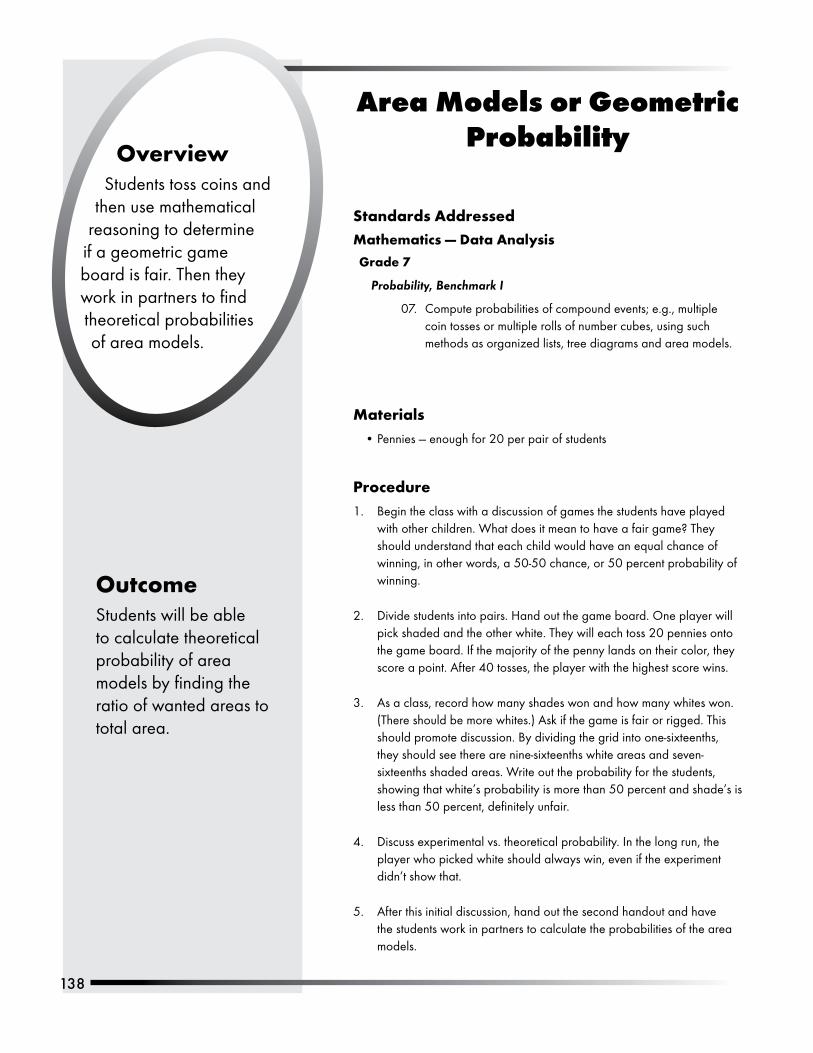
1�8
Area Models or Geometric Probability
OverviewStudents.toss.coins.and.
then.use.mathematical.reasoning.to.determine.
if.a.geometric.game.board.is.fair..Then.they.work.in.partners.to.find.theoretical.probabilities.of.area.models.
OutcomeStudents.will.be.able.to.calculate.theoretical.probability.of.area.models.by.finding.the.ratio.of.wanted.areas.to.total.area.
Standards AddressedMathematics — Data Analysis
Grade 7
Probability, Benchmark I
07.. Compute.probabilities.of.compound.events;.e.g.,.multiple.coin.tosses.or.multiple.rolls.of.number.cubes,.using.such.methods.as.organized.lists,.tree.diagrams.and.area.models.
MaterialsPennies.—.enough.for.20.per.pair.of.students
ProcedureBegin.the.class.with.a.discussion.of.games.the.students.have.played.with.other.children..What.does.it.mean.to.have.a.fair.game?.They.should.understand.that.each.child.would.have.an.equal.chance.of.winning,.in.other.words,.a.50-50.chance,.or.50.percent.probability.of.winning.
Divide.students.into.pairs..Hand.out.the.game.board..One.player.will.pick.shaded.and.the.other.white..They.will.each.toss.20.pennies.onto.the.game.board..If.the.majority.of.the.penny.lands.on.their.color,.they.score.a.point..After.40.tosses,.the.player.with.the.highest.score.wins.
As.a.class,.record.how.many.shades.won.and.how.many.whites.won..(There.should.be.more.whites.).Ask.if.the.game.is.fair.or.rigged..This.should.promote.discussion..By.dividing.the.grid.into.one-sixteenths,.they.should.see.there.are.nine-sixteenths.white.areas.and.seven-sixteenths.shaded.areas..Write.out.the.probability.for.the.students,.showing.that.white’s.probability.is.more.than.50.percent.and.shade’s.is.less.than.50.percent,.definitely.unfair.
Discuss.experimental.vs..theoretical.probability..In.the.long.run,.the.player.who.picked.white.should.always.win,.even.if.the.experiment.didn’t.show.that.
After.this.initial.discussion,.hand.out.the.second.handout.and.have.the.students.work.in.partners.to.calculate.the.probabilities.of.the.area.models.
•
1.
2.
3.
4.
5.
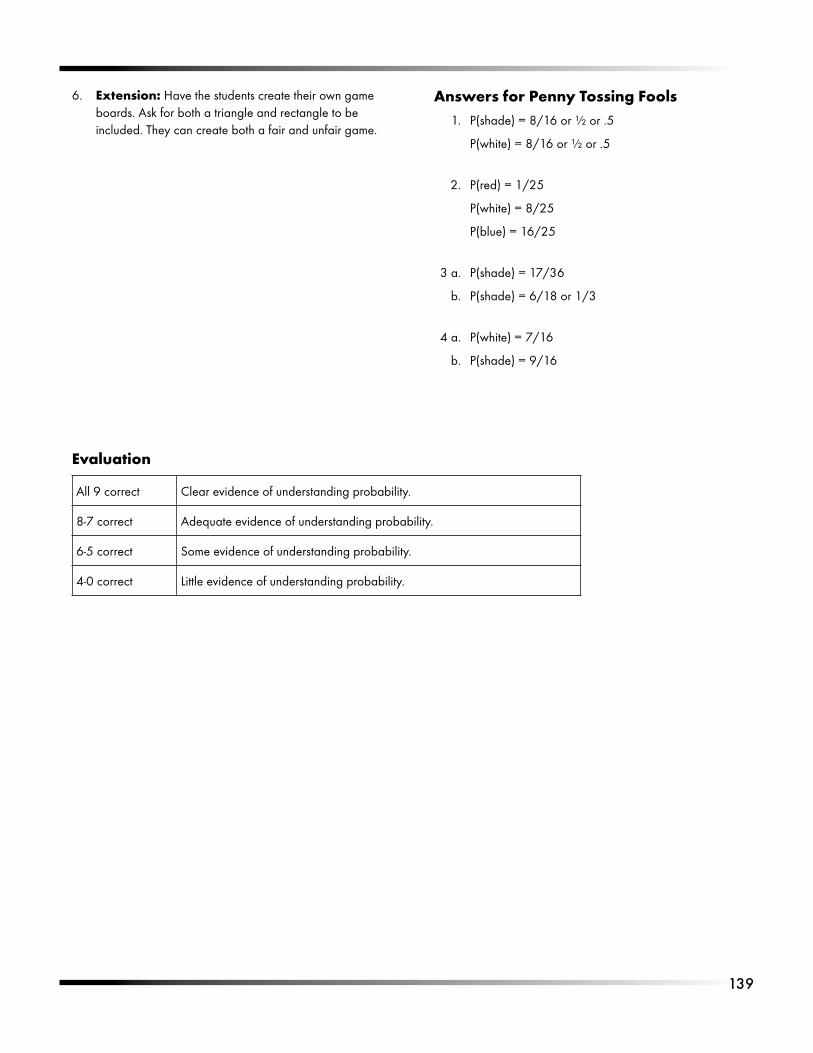
1��
Extension:.Have.the.students.create.their.own.game.boards..Ask.for.both.a.triangle.and.rectangle.to.be.included..They.can.create.both.a.fair.and.unfair.game.
6. Answers for Penny Tossing Fools. 1.. P(shade).=.8/16.or.½.or..5.
. . P(white).=.8/16.or.½.or..5
. 2.. P(red).=.1/25
. . P(white).=.8/25
. . P(blue).=.16/25. .
. 3.a.. P(shade).=.17/36
. b.. P(shade).=.6/18.or.1/3
. 4.a.. P(white).=.7/16
. b.. P(shade).=.9/16
Evaluation
All.9.correct Clear.evidence.of.understanding.probability..
8-7.correct Adequate.evidence.of.understanding.probability..
6-5.correct Some.evidence.of.understanding.probability.
4-0.correct Little.evidence.of.understanding.probability..
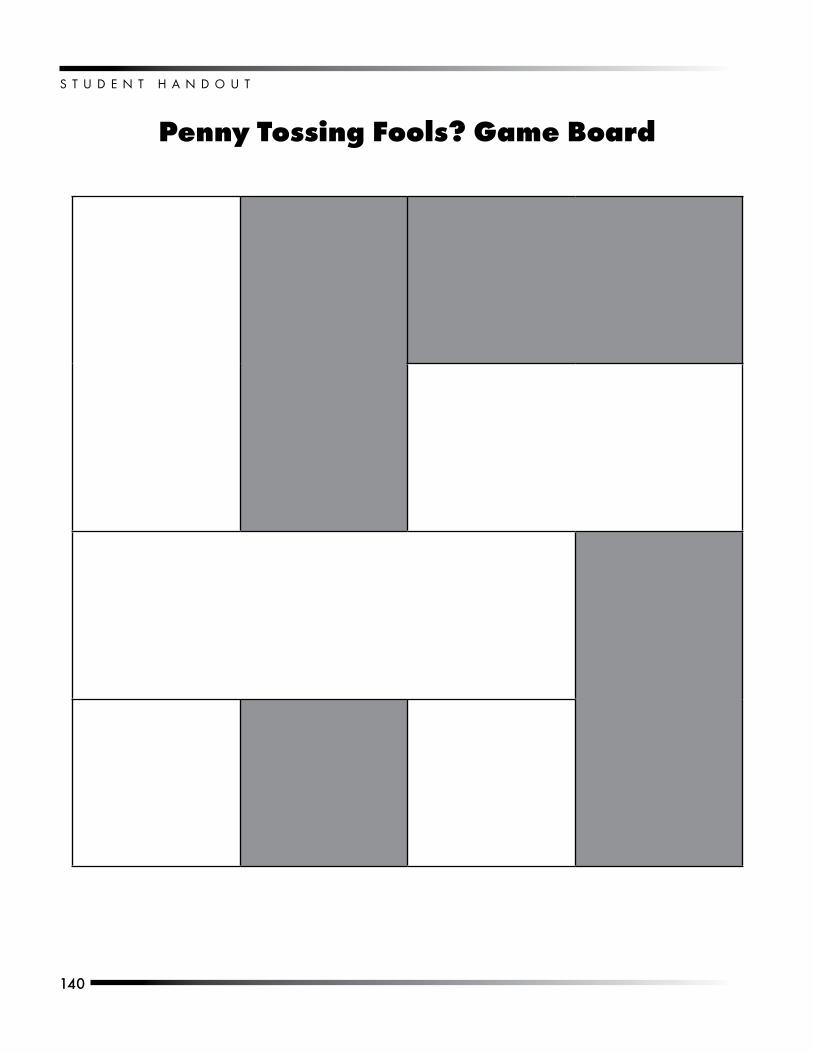
S T U D E N T . H A N D O U T
1�0
Penny Tossing Fools? Game Board
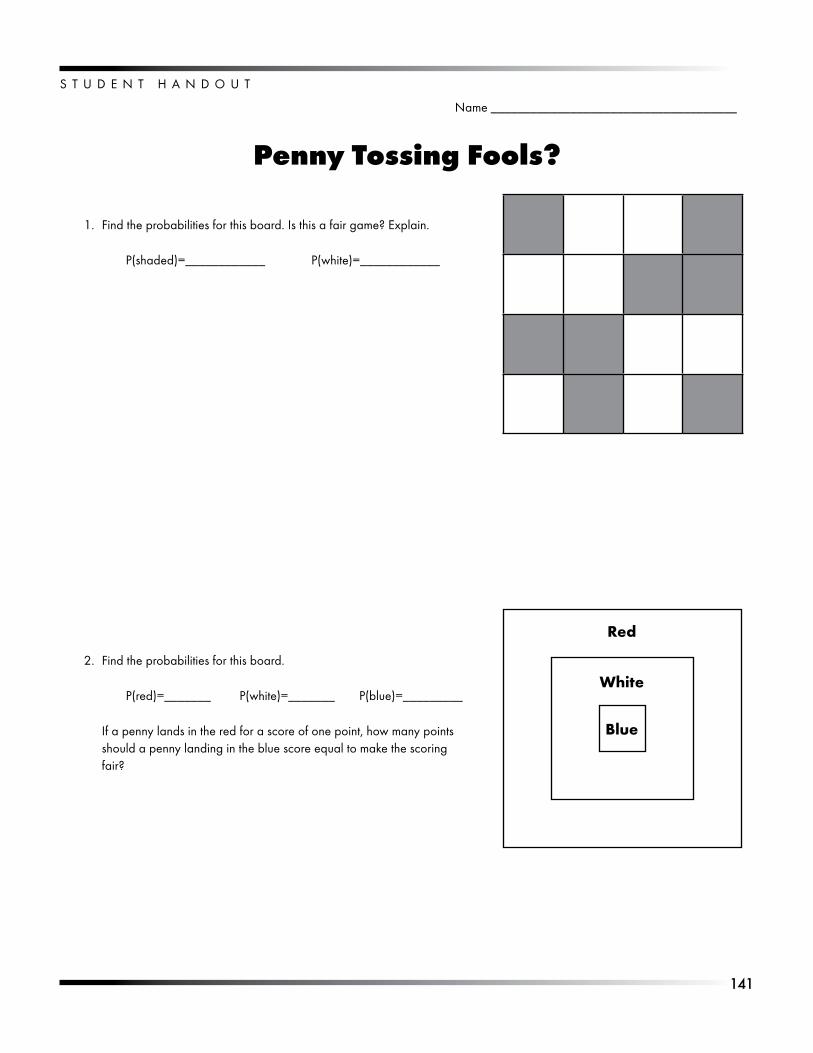
1�1
S T U D E N T . H A N D O U T
Name._____________________________________
Penny Tossing Fools?
Find.the.probabilities.for.this.board..Is.this.a.fair.game?.Explain.
P(shaded)=____________. P(white)=____________..
Find.the.probabilities.for.this.board.
P(red)=_______. P(white)=_______. P(blue)=_________
If.a.penny.lands.in.the.red.for.a.score.of.one.point,.how.many.points.should.a.penny.landing.in.the.blue.score.equal.to.make.the.scoring.fair?
1.
2.
Red
White
Blue
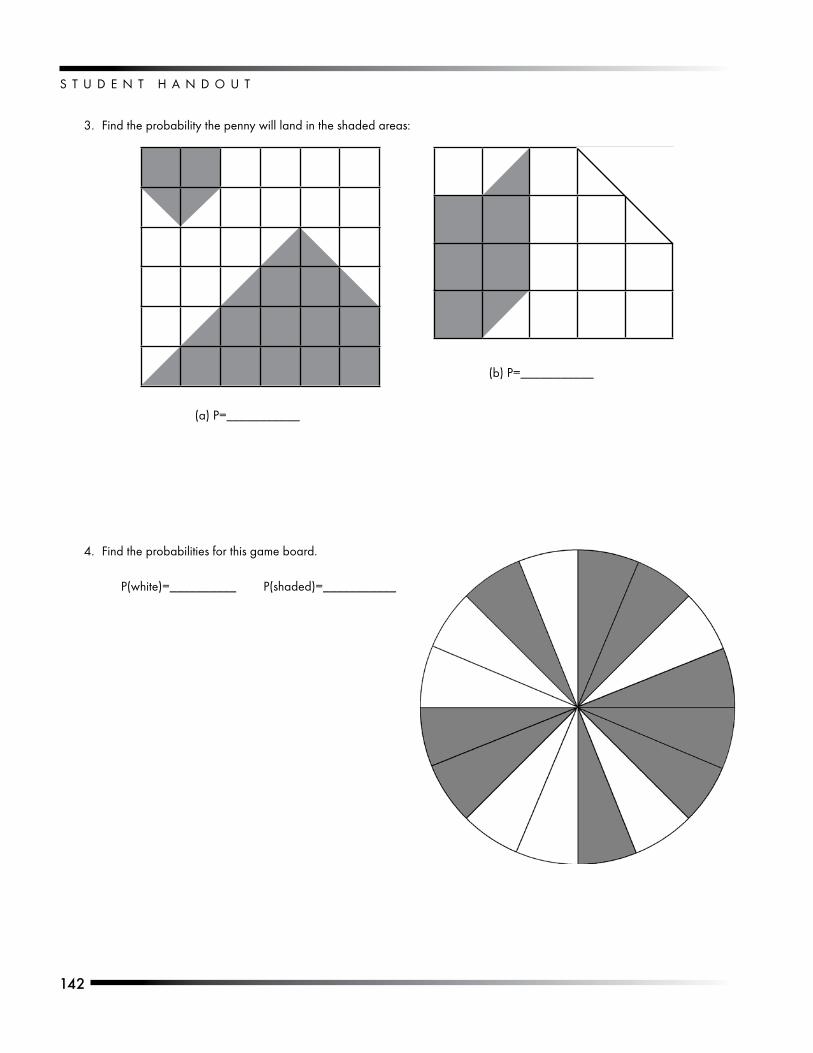
S T U D E N T . H A N D O U T
1�2
Find.the.probability.the.penny.will.land.in.the.shaded.areas:3.
Find.the.probabilities.for.this.game.board.
P(white)=__________. P(shaded)=___________
4.
(a).P=___________
(b).P=___________

http://www.WesternReservePublicMedia.org/quizbus
Resources

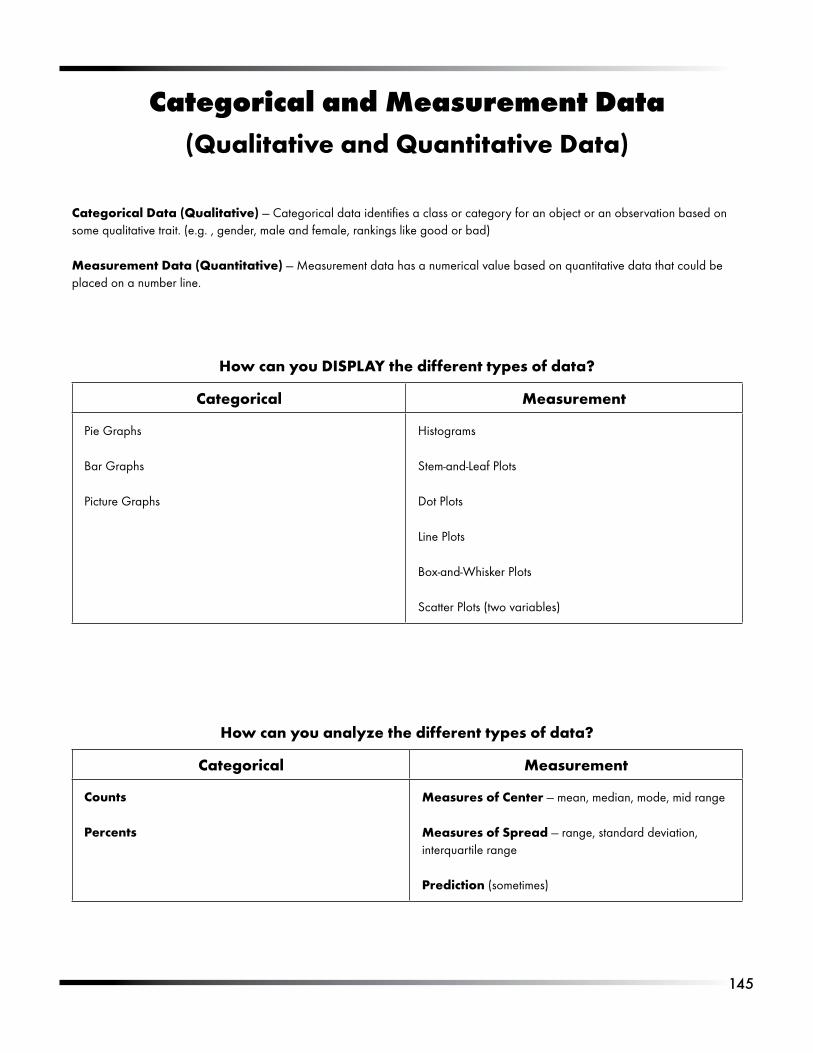
1��
Categorical and Measurement Data(Qualitative and Quantitative Data)
Categorical Data (Qualitative).—.Categorical.data.identifies.a.class.or.category.for.an.object.or.an.observation.based.on.some.qualitative.trait..(e.g..,.gender,.male.and.female,.rankings.like.good.or.bad)
Measurement Data (Quantitative).—.Measurement.data.has.a.numerical.value.based.on.quantitative.data.that.could.be.placed.on.a.number.line.
How can you DISPLAY the different types of data?
Categorical Measurement
Pie.Graphs
Bar.Graphs
Picture.Graphs
Histograms
Stem-and-Leaf.Plots
Dot.Plots
Line.Plots
Box-and-Whisker.Plots
Scatter.Plots.(two.variables)
How can you analyze the different types of data?
Categorical Measurement
Counts
Percents
Measures of Center —.mean,.median,.mode,.mid.range
Measures of Spread —.range,.standard.deviation,.interquartile.range
Prediction.(sometimes).
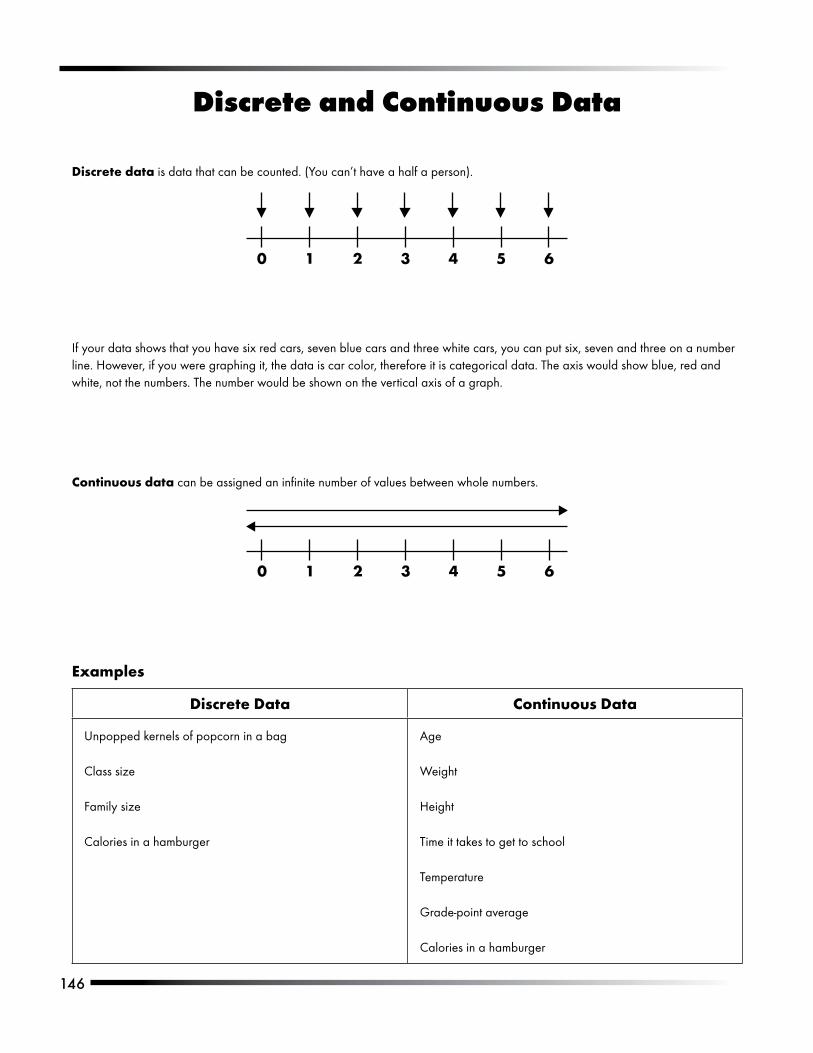
1��
Discrete and Continuous Data
Discrete.data.is.data.that.can.be.counted..(You.can’t.have.a.half.a.person).
.
If.your.data.shows.that.you.have.six.red.cars,.seven.blue.cars.and.three.white.cars,.you.can.put.six,.seven.and.three.on.a.number.line..However,.if.you.were.graphing.it,.the.data.is.car.color,.therefore.it.is.categorical.data..The.axis.would.show.blue,.red.and.white,.not.the.numbers..The.number.would.be.shown.on.the.vertical.axis.of.a.graph.
Continuous data can.be.assigned.an.infinite.number.of.values.between.whole.numbers.
Examples
Discrete Data Continuous Data
Unpopped.kernels.of.popcorn.in.a.bag
Class.size
Family.size
Calories.in.a.hamburger
Age
Weight
Height
Time.it.takes.to.get.to.school
Temperature
Grade-point.average
Calories.in.a.hamburger
0 1 2 3 4 5 6
0 1 2 3 4 5 6
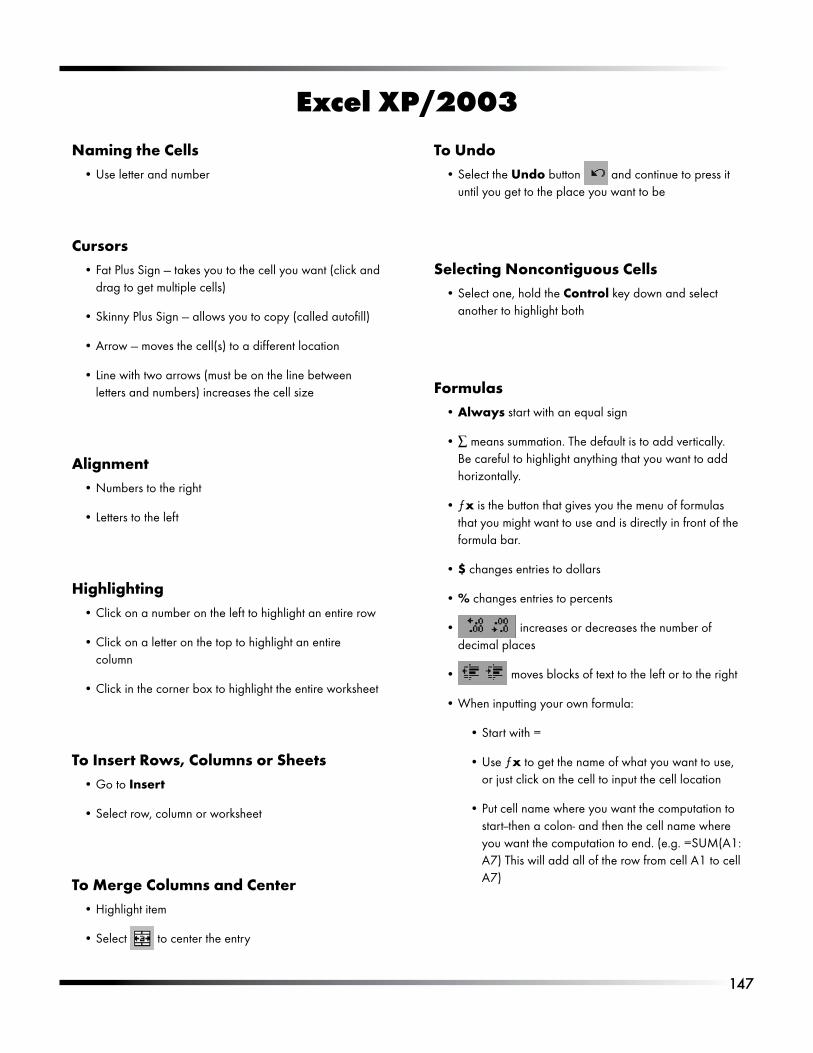
1�7
Excel XP/2003
Naming the CellsUse.letter.and.number
CursorsFat.Plus.Sign.—.takes.you.to.the.cell.you.want.(click.and.drag.to.get.multiple.cells)
Skinny.Plus.Sign.—.allows.you.to.copy.(called.autofill)
Arrow.—.moves.the.cell(s).to.a.different.location
Line.with.two.arrows.(must.be.on.the.line.between.letters.and.numbers).increases.the.cell.size
AlignmentNumbers.to.the.right
Letters.to.the.left
HighlightingClick.on.a.number.on.the.left.to.highlight.an.entire.row
Click.on.a.letter.on.the.top.to.highlight.an.entire.column
Click.in.the.corner.box.to.highlight.the.entire.worksheet
To Insert Rows, Columns or SheetsGo.to.Insert
Select.row,.column.or.worksheet
To Merge Columns and CenterHighlight.item
Select. .to.center.the.entry
•
•
•
•
•
•
•
•
•
•
•
•
•
•
To UndoSelect.the.Undo.button. .and.continue.to.press.it.until.you.get.to.the.place.you.want.to.be
Selecting Noncontiguous CellsSelect.one,.hold.the.Control key.down.and.select.another.to.highlight.both
FormulasAlways start.with.an.equal.sign
∑ means.summation..The.default.is.to.add.vertically..Be.careful.to.highlight.anything.that.you.want.to.add.horizontally.
ƒx is.the.button.that.gives.you.the.menu.of.formulas.that.you.might.want.to.use.and.is.directly.in.front.of.the.formula.bar.
$ changes.entries.to.dollars
%.changes.entries.to.percents
.increases.or.decreases.the.number.of.decimal.places
.moves.blocks.of.text.to.the.left.or.to.the.right
When.inputting.your.own.formula:.
Start.with.=
Use.ƒx to.get.the.name.of.what.you.want.to.use,.or.just.click.on.the.cell.to.input.the.cell.location
Put.cell.name.where.you.want.the.computation.to.start--then.a.colon-.and.then.the.cell.name.where.you.want.the.computation.to.end..(e.g..=SUM(A1:.A7).This.will.add.all.of.the.row.from.cell.A1.to.cell.A7)
•
•
•
•
•
•
•
•
•
•
•
•
•
1�8
To.keep.a.number.in.the.same.place.for.a.formula.(such.as.when.computing.a.percent):
You.need.to.use.an.Absolute Reference,.so.put.a.$.before.both.the.letter.and.the.number.of.the.cell.you.wish.to.keep.(e.g. A5/$A$8).
This.will.divide.the.number.in.cell.A5.by.A8.
It.will.also.divide.other.numbers.by.A8
Spell CheckClick.the.button.that.looks.like.this. .to.check.your.spelling
FormattingSelect.Format
Cells.lets.you.change.the.format.of.individual.cells.or.rows.or.columns.of.cells
Select.Rows,.Columns.or.Sheet.and.then.select.what.you.would.like.to.do
Select.AutoFormat.to.change.the.entire.worksheet.to.the.style.you.would.like
PrintingIf.you.only.want.a.section.of.the.spreadsheet.to.print,.highlight.the.section.
Go.to.File,.Print.Area.and.then.Select.Print.Area
If.you.want.to.center.your.spreadsheet.when.you.print.it,.go.to.File.and.then.Page.Setup
Select.Margins.and.at.the.bottom.of.the.sheet,.select.Vertically.and.Horizontally.and.then.select.OK
If.you.want.your.sheet.to.go.on.the.horizontal.layout,.select.File.and.then.Page.Setup
Select.Page,.and.then.Landscape.
If.you.want.the.gridlines.to.show,.go.to.Page.Setup..Select.Sheet.and.then.select.Gridlines
•
•
•
•
•
•
•
•
•
•
•
•
•
•
•
•
To Insert a PictureGo.to.Insert
Select.Picture
Select.ClipArt.or.From.File,.depending.upon.where.the.picture.you.want.is.located.
Select.the.picture.you.want
Select.the.top.button.and.close.the.ClipArt.page.
To Put in a Border Go.to.the.button.that.looks.like.this..
Select.the.arrow.at.the.right.and.then.select.the.border.you.want.to.use.
Making a ChartSelect.the.Chart.icon.
Follow.the.steps.of.the.wizard
Changing Your ChartSelect.the.part.of.your.chart.you.would.like.to.alter.and.right-click.on.it
Select.Format Chart Area.or.Format.and.make.changes.
Select.Fill Effects.for.many.variations
If.the.legend.reads.Series and.you.want.to.change.it.to.reflect.what.is.on.your.graph,.select Chart,.Source Data.and.then.Series
•
•
•
•
•
•
•
•
•
•
•
•
•
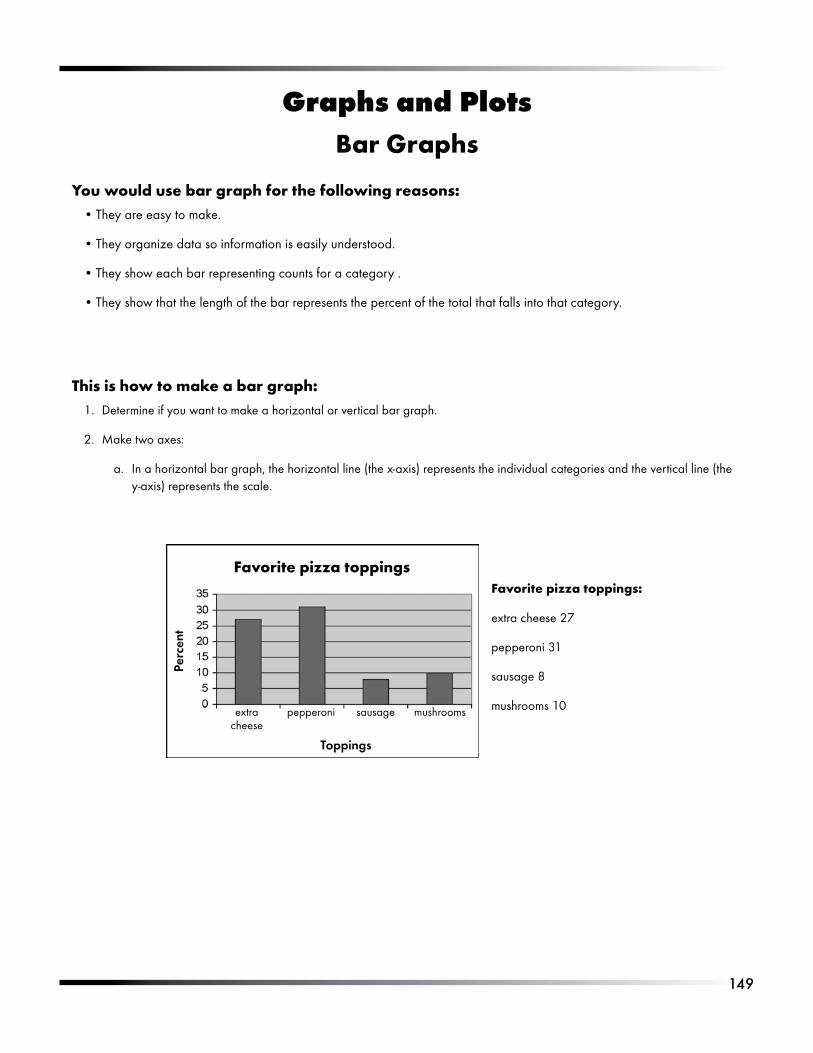
1��
Graphs and PlotsBar Graphs
You would use bar graph for the following reasons:They.are.easy.to.make.
They.organize.data.so.information.is.easily.understood.
They.show.each.bar.representing.counts.for.a.category..
They.show.that.the.length.of.the.bar.represents.the.percent.of.the.total.that.falls.into.that.category.
This is how to make a bar graph:Determine.if.you.want.to.make.a.horizontal.or.vertical.bar.graph.
Make.two.axes:.
In.a.horizontal.bar.graph,.the.horizontal.line.(the.x-axis).represents.the.individual.categories.and.the.vertical.line.(the.y-axis).represents.the.scale.
•
•
•
•
1.
2.
a.
Favorite pizza toppings:
extra.cheese.27
pepperoni.31
sausage.8
mushrooms.10
Favorite pizza toppings
extra.cheese
pepperoni sausage mushrooms
Toppings
Perc
ent
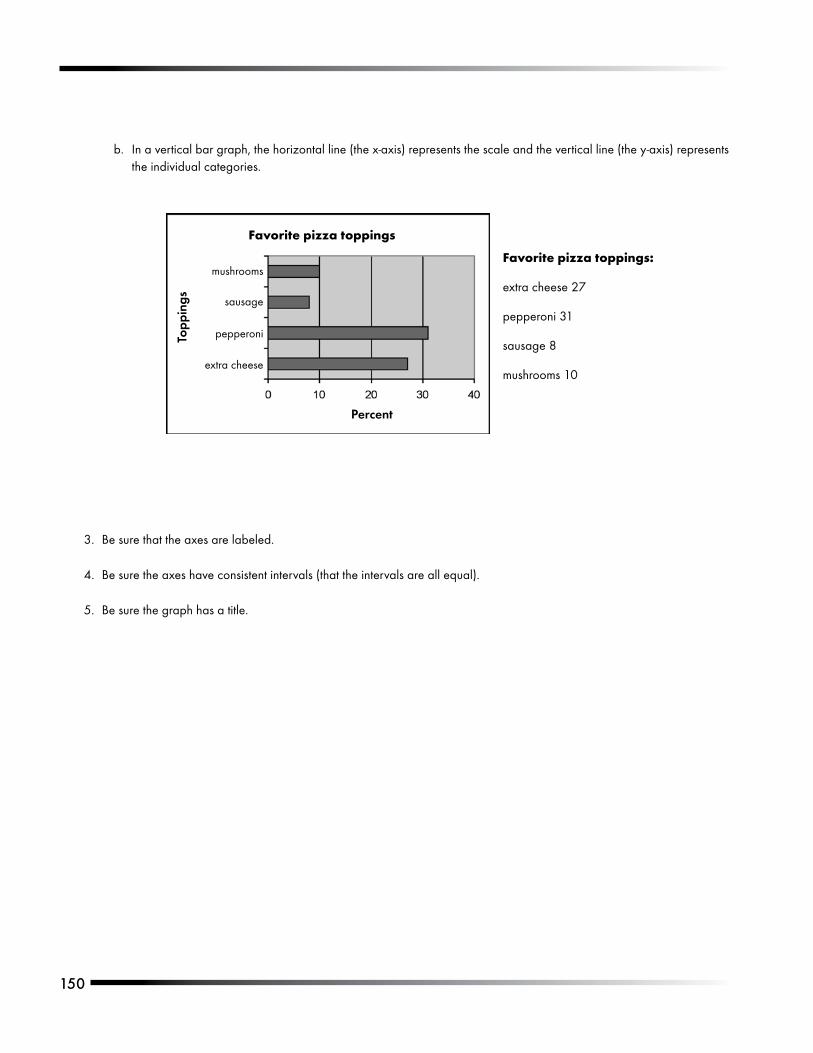
1�0
In.a.vertical.bar.graph,.the.horizontal.line.(the.x-axis).represents.the.scale.and.the.vertical.line.(the.y-axis).represents.the.individual.categories.
b.
Favorite pizza toppings:
extra.cheese.27
pepperoni.31
sausage.8
mushrooms.10
Favorite pizza toppings
extra.cheese
pepperoni
sausage
mushrooms
Percent
Be.sure.that.the.axes.are.labeled.
Be.sure.the.axes.have.consistent.intervals.(that.the.intervals.are.all.equal).
Be.sure.the.graph.has.a.title.
3.
4.
5.
Topp
ings
1�1
Graphs and PlotsBox-and-Whisker Plot
You would use box-and-whisker plots for the following reasons:They.are.good.for.large.data.sets.(values.of.at.least.15).
They.give.the.five.key.data.points:.maximum,.minimum,.median,.upper.quartile.and.lower.quartile.
They.can.compare.two.or.more.data.sets.
They.show.the.similarities.and.differences.among.plots.
They.show.outliers.
They.can.be.used.to.compare.sets.with.different.number.of.data.points.
This is how to make a box-and-whisker plot:Organize.the.data.in.sequential.order..You.can.use.a.stem-and-leaf.plot.or.arrange.data.from.largest.to.smallest.
Determine.the.summary.values.—.maximum,.minimum,.median,.upper.quartile,.and.lower.quartile.
Make.a.number.line.with.consistent.intervals.
Construct.the.box-and-whisker.plot:
Put.in.the.mean.and.the.upper.and.lower.quartile..Make.this.into.your.box.
Determine.if.there.are.outliers.by.subtracting.the.lower.quartile.from.the.upper.quartile..Multiply.this.amount.by.1.5,..subtract.that.amount.from.the.lower.quartile.and.add.it.to.the.upper.quartile..If.there.are.points.that.are.beyond.these.values,.make.stars.at.those.points.to.indicate.outliers.
Make.whiskers.from.the.LQ.and.UQ.to.the.extremes.
Label.your.plot.
If.you.are.comparing.plots,.be.sure.that.you.use.one.number.line.
•
•
•
•
•
•
1.
2.
3.
4.
a.
b.
c.
d.
5.
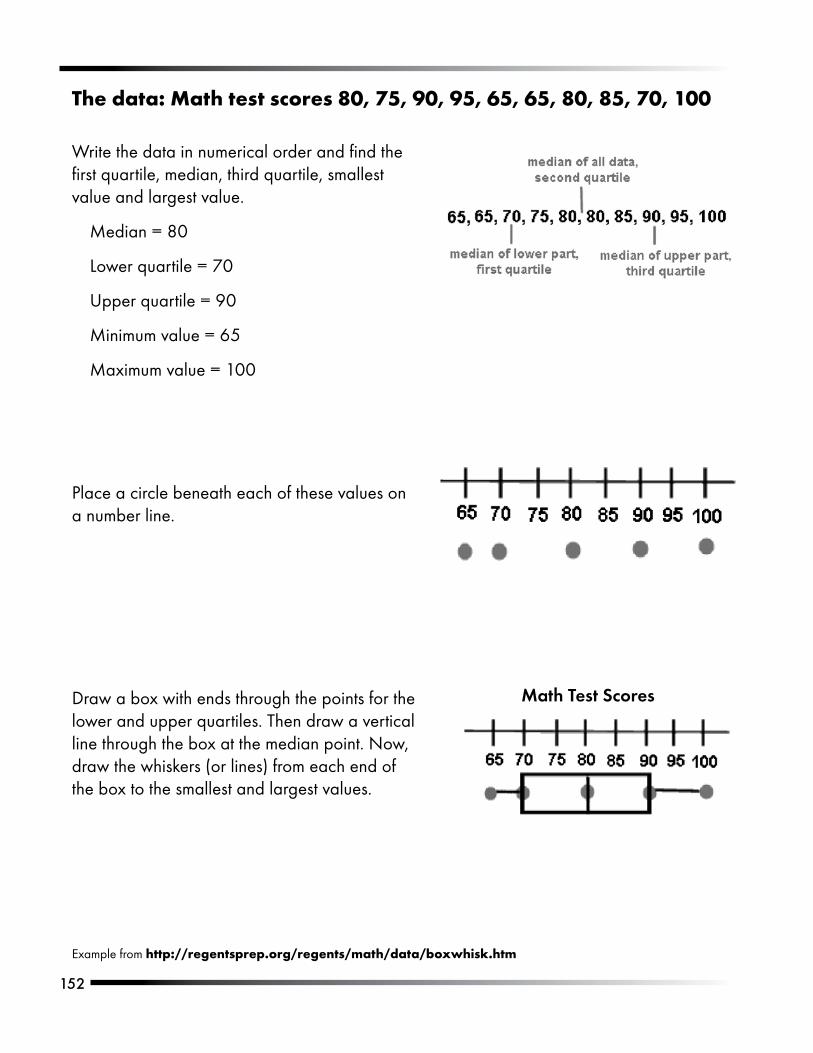
1�2
The data: Math test scores 80, 75, 90, 95, 65, 65, 80, 85, 70, 100
Example.from.http://regentsprep.org/regents/math/data/boxwhisk.htm.
Write.the.data.in.numerical.order.and.find.the.first.quartile,.median,.third.quartile,.smallest.value.and.largest.value.
Median.=.80
Lower.quartile.=.70
Upper.quartile.=.90
Minimum.value.=.65
Maximum.value.=.100
Place.a.circle.beneath.each.of.these.values.on.a.number.line.
Draw.a.box.with.ends.through.the.points.for.the.lower.and.upper.quartiles..Then.draw.a.vertical.line.through.the.box.at.the.median.point..Now,.draw.the.whiskers.(or.lines).from.each.end.of.the.box.to.the.smallest.and.largest.values.
Math Test Scores
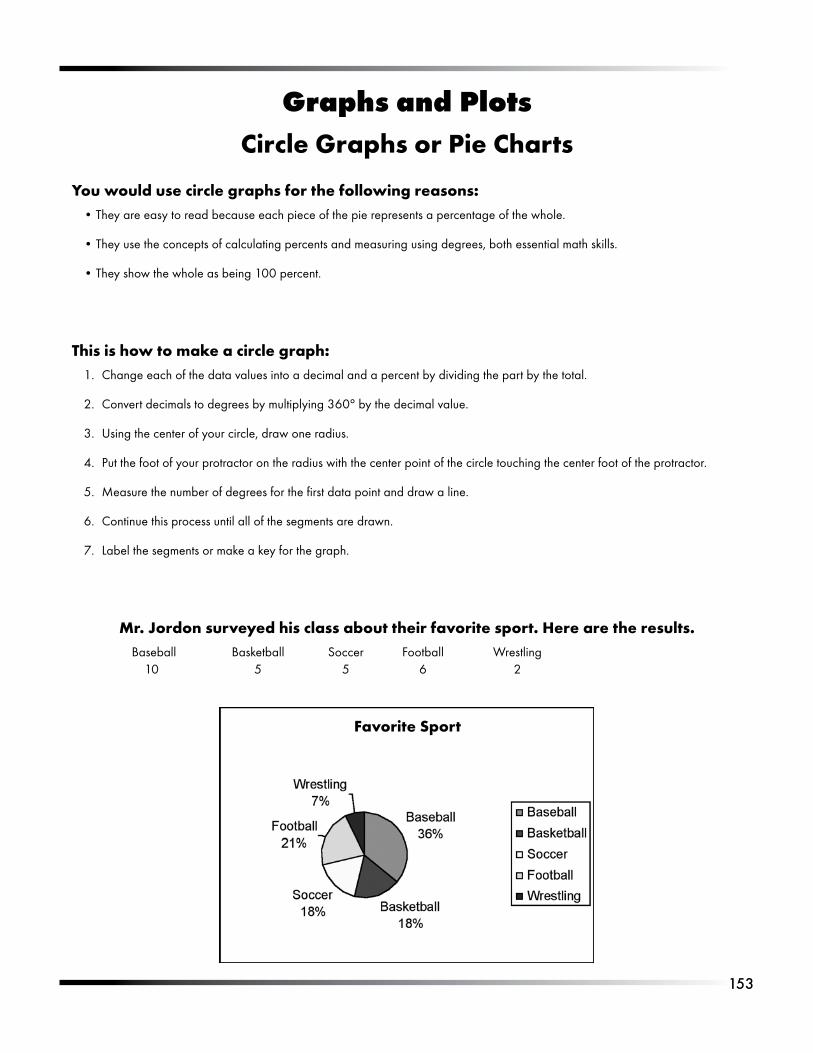
1��
Graphs and PlotsCircle Graphs or Pie Charts
You would use circle graphs for the following reasons:They.are.easy.to.read.because.each.piece.of.the.pie.represents.a.percentage.of.the.whole.
They.use.the.concepts.of.calculating.percents.and.measuring.using.degrees,.both.essential.math.skills.
They.show.the.whole.as.being.100.percent.
This is how to make a circle graph:Change.each.of.the.data.values.into.a.decimal.and.a.percent.by.dividing.the.part.by.the.total.
Convert.decimals.to.degrees.by.multiplying.360°.by.the.decimal.value.
Using.the.center.of.your.circle,.draw.one.radius.
Put.the.foot.of.your.protractor.on.the.radius.with.the.center.point.of.the.circle.touching.the.center.foot.of.the.protractor.
Measure.the.number.of.degrees.for.the.first.data.point.and.draw.a.line.
Continue.this.process.until.all.of.the.segments.are.drawn.
Label.the.segments.or.make.a.key.for.the.graph.
Mr. Jordon surveyed his class about their favorite sport. Here are the results..Baseball. Basketball. Soccer. Football. Wrestling. 10. 5. 5. 6. 2
•
•
•
1.
2.
3.
4.
5.
6.
7.
Favorite Sport
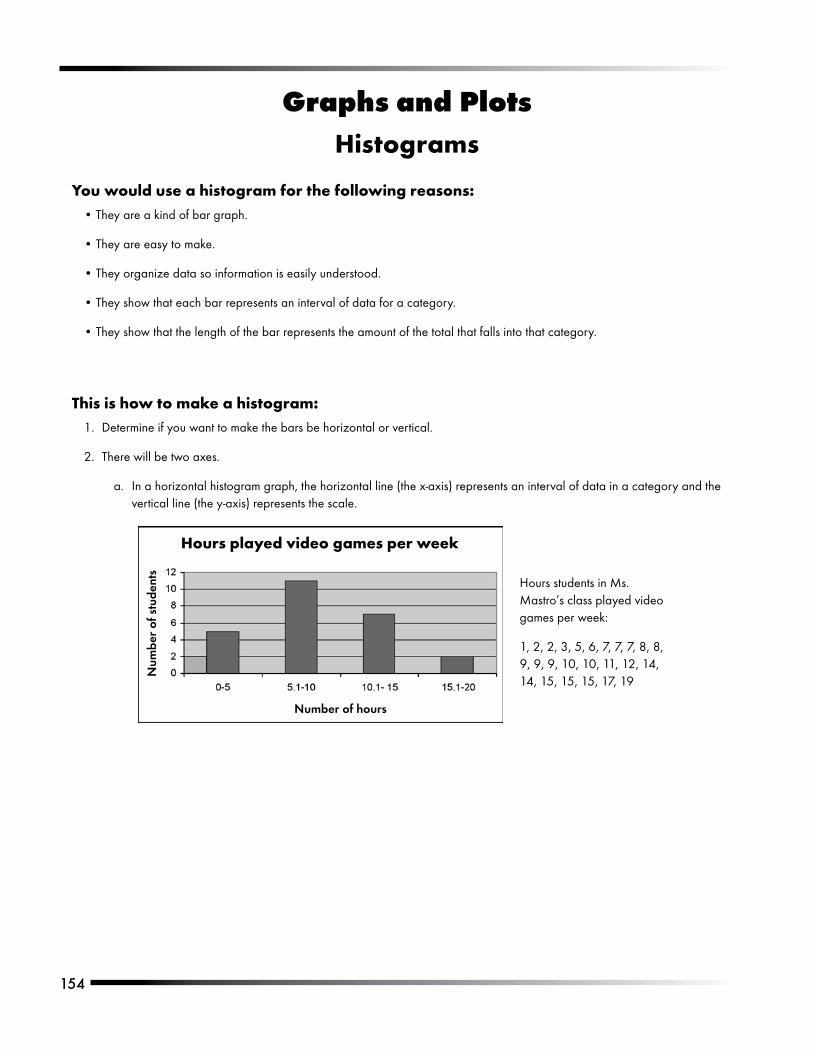
1��
Graphs and PlotsHistograms
You would use a histogram for the following reasons:They.are.a.kind.of.bar.graph.
They.are.easy.to.make.
They.organize.data.so.information.is.easily.understood.
They.show.that.each.bar.represents.an.interval.of.data.for.a.category..
They.show.that.the.length.of.the.bar.represents.the.amount.of.the.total.that.falls.into.that.category.
This is how to make a histogram:Determine.if.you.want.to.make.the.bars.be.horizontal.or.vertical.
There.will.be.two.axes..
In.a.horizontal.histogram.graph,.the.horizontal.line.(the.x-axis).represents.an.interval.of.data.in.a.category.and.the.vertical.line.(the.y-axis).represents.the.scale.
•
•
•
•
•
1.
2.
a.
Hours.students.in.Ms..Mastro’s.class.played.video.games.per.week:.
1,.2,.2,.3,.5,.6,.7,.7,.7,.8,.8,.9,.9,.9,.10,.10,.11,.12,.14,.14,.15,.15,.15,.17,.19
Hours played video games per week
Number of hours
Num
ber
of s
tude
nts
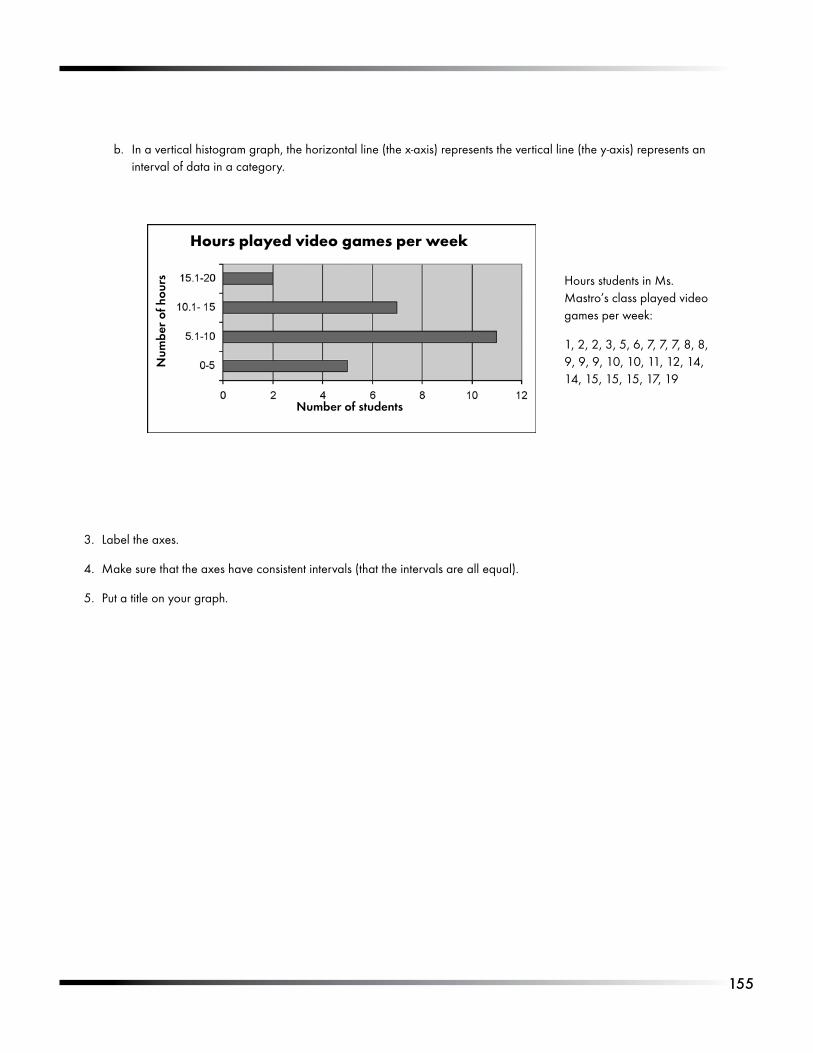
1��
In.a.vertical.histogram.graph,.the.horizontal.line.(the.x-axis).represents.the.vertical.line.(the.y-axis).represents.an.interval.of.data.in.a.category.
b.
Label.the.axes.
Make.sure.that.the.axes.have.consistent.intervals.(that.the.intervals.are.all.equal).
Put.a.title.on.your.graph.
3.
4.
5.
Hours.students.in.Ms..Mastro’s.class.played.video.games.per.week:.
1,.2,.2,.3,.5,.6,.7,.7,.7,.8,.8,.9,.9,.9,.10,.10,.11,.12,.14,.14,.15,.15,.15,.17,.19
Hours played video games per week
Number of students
Num
ber
of h
ours
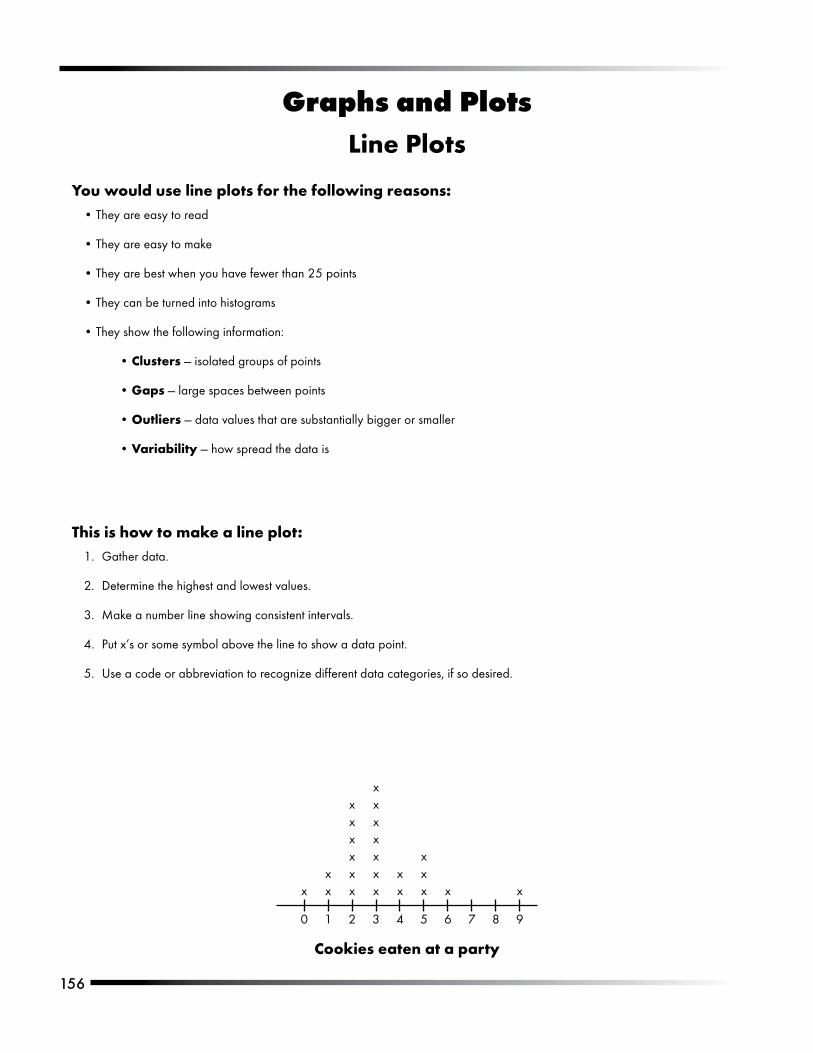
1��
Graphs and PlotsLine Plots
You would use line plots for the following reasons:They.are.easy.to.read
They.are.easy.to.make
They.are.best.when.you.have.fewer.than.25.points
They.can.be.turned.into.histograms
They.show.the.following.information:
Clusters —.isolated.groups.of.points
Gaps —.large.spaces.between.points
Outliers —.data.values.that.are.substantially.bigger.or.smaller.
Variability —.how.spread.the.data.is
This is how to make a line plot:Gather.data.
Determine.the.highest.and.lowest.values.
Make.a.number.line.showing.consistent.intervals.
Put.x’s.or.some.symbol.above.the.line.to.show.a.data.point.
Use.a.code.or.abbreviation.to.recognize.different.data.categories,.if.so.desired.
•
•
•
•
•
•
•
•
•
1.
2.
3.
4.
5.
Cookies eaten at a party
. 0. 1. 2. 3. 4. 5. 6. 7. 8. 9
xxx
xxxxxx
xxxxxxx
xx
xxx x x
1�7
Graphs and PlotsScatter Plots
You would use a scatter plot for the following reasons:They.organize.data.using.bivariate.data.(two.variables).
They.are.similar.to.coordinate.plane.graphing.
They.show.association.between.the.variables.being.graphed:
Positive.association-Points.show.a.trend.of.moving.up.an.to.the.right
Negative.association-Points.show.a.trend.of.moving.down.and.to.the.right
No.association-Points.show.no.trend
Need.to.stress.the.difference.between.association.and.causation.
They.show.clusters.and.outliers.
You.can.use.time.on.either.axis,.but.it.is.generally.the.independent.variable.and.is.on.the.x-axis.
In.time-series.plots,.you.may.connect.points.
You would use lines on a scatter plot for the following reasons:The.line.divides.the.plot.into.two.regions.by.using.a.45°.line.called.the.y.=.x.line.
The.line.distinguishes.characteristics.between.points.on,.above,.or.below.the.line..
The.line.can.be.used.to.make.predictions,.especially.for.algebraic.equations.of.lines,.slopes,.intercepts,.etc.
This is how to make a median fit line:Count.the.total.number.of.points..
Draw.two.vertical.dashed.lines.so.there.are.approximately.the.same.number.of.points.in.each.of.the.three.sections..The.outer.strips.should.have.the.same.number.of.points.if.possible.
Find.the.median.point.both.vertically.and.horizontally.and.put.a.vertical.line.and.a.horizontal.line.at.that.point,.forming.an.x.
Decide.whether.or.not.the.three.x’s.lie.close.to.a.straight.line..Use.your.ruler.to.help.you.decide.
Place.your.ruler.so.that.it.connects.the.two.x’s.in.the.outside.strips..Now.slide.the.ruler.one-third.of.the.way.to.the.middle.x.and.draw.the.line.
•
•
•
•
•
•
•
•
•
•
•
•
•
1.
2.
3.
4.
5.
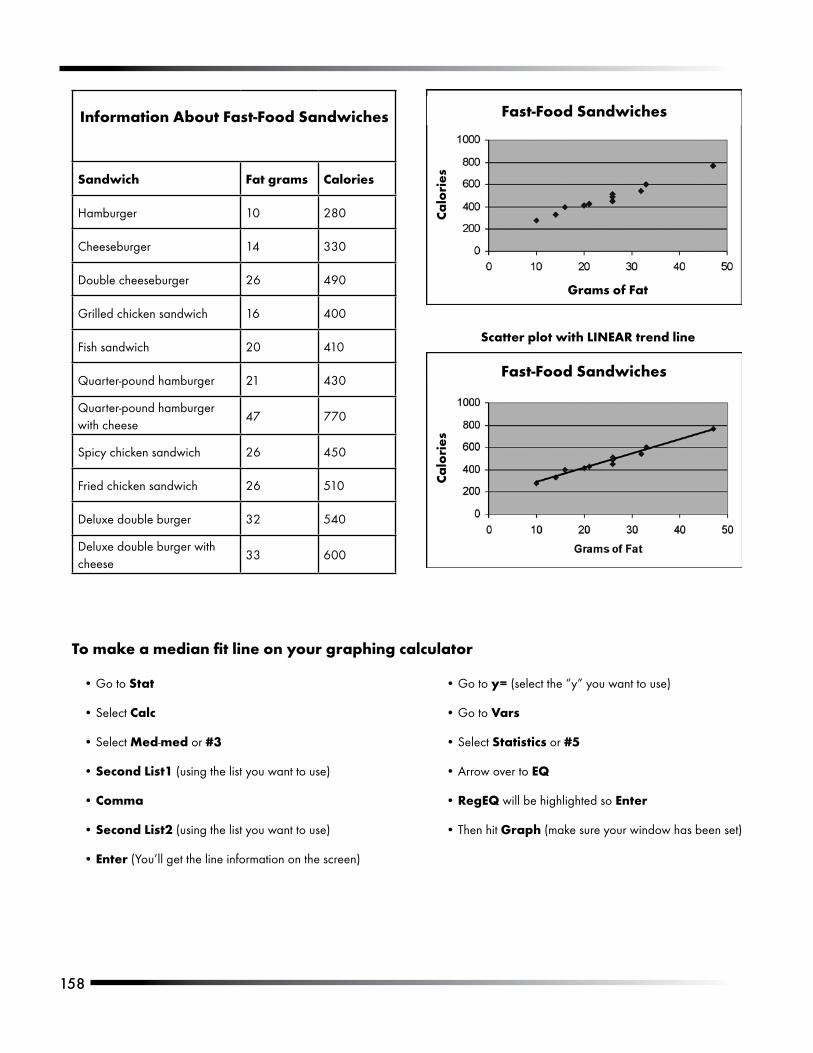
1�8
Scatter plot with LINEAR trend line
Information About Fast-Food Sandwiches
Sandwich Fat grams Calories
Hamburger 10 280
Cheeseburger 14 330
Double.cheeseburger 26 490
Grilled.chicken.sandwich 16 400
Fish.sandwich 20 410
Quarter-pound.hamburger 21 430
Quarter-pound.hamburger.with.cheese
47 770
Spicy.chicken.sandwich 26 450
Fried.chicken.sandwich 26 510
Deluxe.double.burger 32 540
Deluxe.double.burger.with.cheese
33 600
To make a median fit line on your graphing calculator
Go.to.Stat
Select.Calc
Select.Med-med.or.#3
Second.List1.(using.the.list.you.want.to.use)
Comma
Second.List2.(using.the.list.you.want.to.use)
Enter.(You’ll.get.the.line.information.on.the.screen)
•
•
•
•
•
•
•
Go.to.y=.(select.the.“y”.you.want.to.use)
Go.to.Vars
Select.Statistics.or.#5
Arrow.over.to.EQ
RegEQ.will.be.highlighted.so.Enter
Then.hit.Graph.(make.sure.your.window.has.been.set)
•
•
•
•
•
•
Fast-Food Sandwiches
Fast-Food Sandwiches
Grams of Fat
Ca
lori
esC
alo
ries
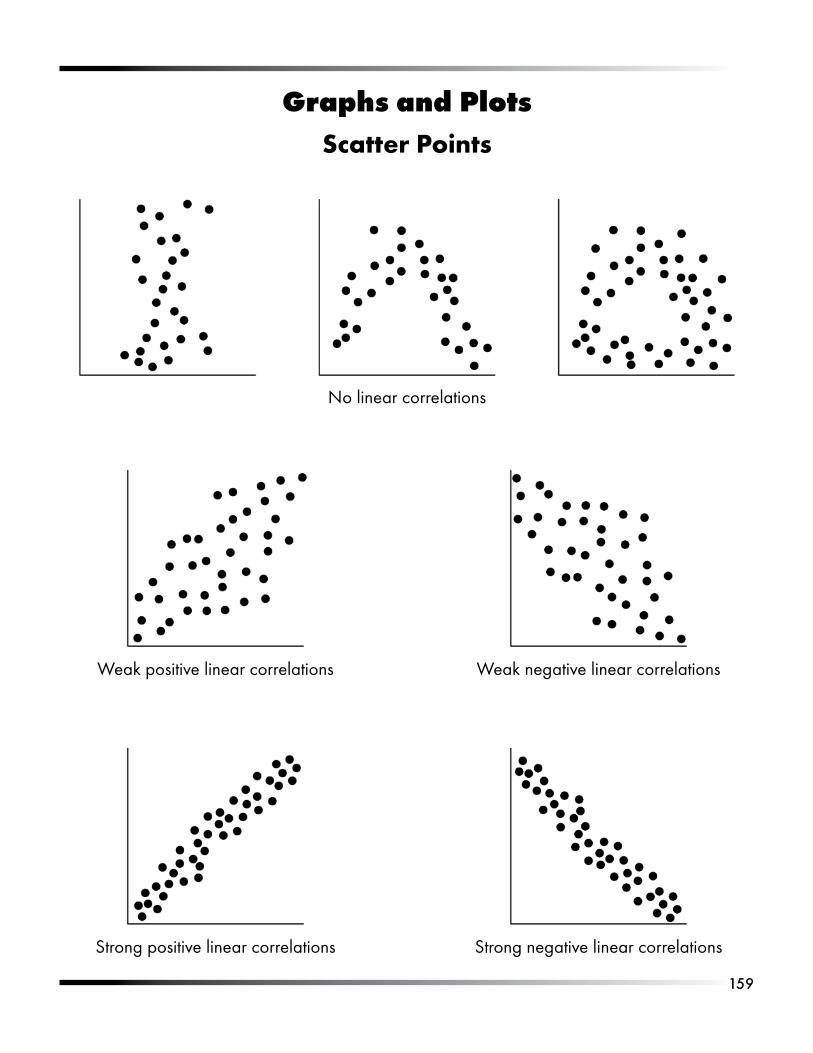
1��
No.linear.correlations
Weak.positive.linear.correlations Weak.negative.linear.correlations
Strong.positive.linear.correlations Strong.negative.linear.correlations
Graphs and PlotsScatter Points
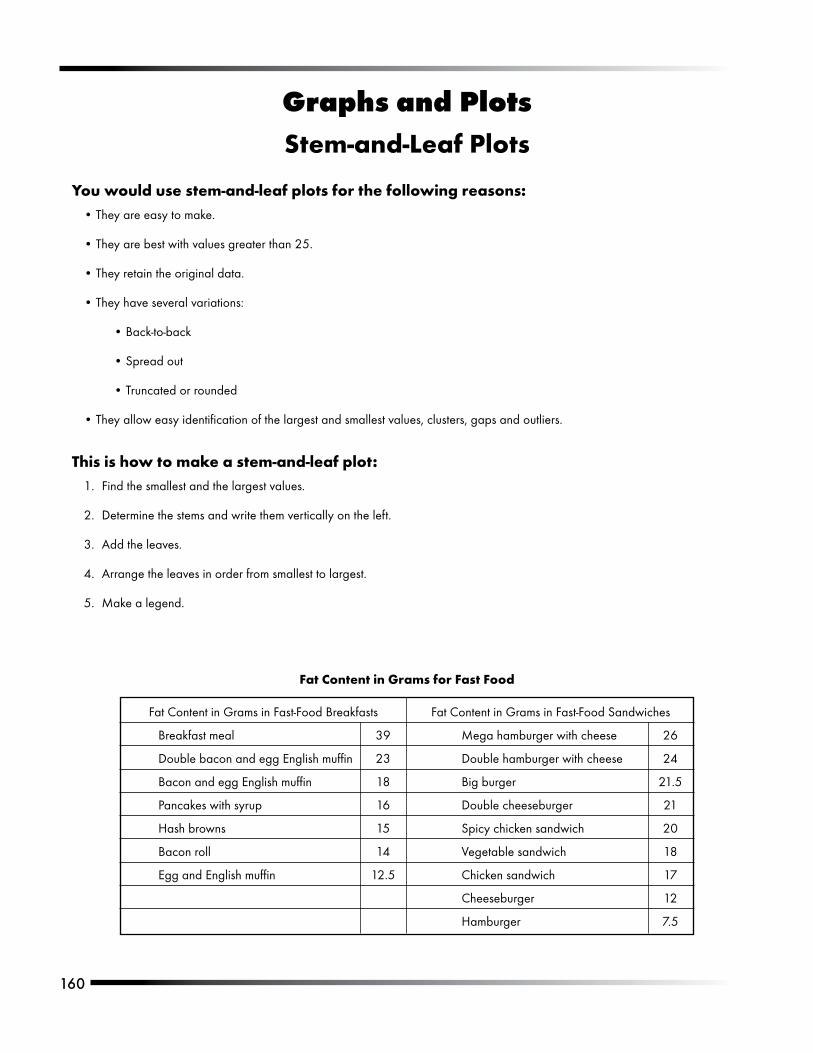
1�0
Graphs and PlotsStem-and-Leaf Plots
You would use stem-and-leaf plots for the following reasons:They.are.easy.to.make.
They.are.best.with.values.greater.than.25..
They.retain.the.original.data.
They.have.several.variations:
Back-to-back
Spread.out
Truncated.or.rounded
They.allow.easy.identification.of.the.largest.and.smallest.values,.clusters,.gaps.and.outliers.
This is how to make a stem-and-leaf plot:Find.the.smallest.and.the.largest.values.
Determine.the.stems.and.write.them.vertically.on.the.left.
Add.the.leaves.
Arrange.the.leaves.in.order.from.smallest.to.largest.
Make.a.legend.
•
•
•
•
•
•
•
•
1.
2.
3.
4.
5.
. Fat.Content.in.Grams.in.Fast-Food.Breakfasts. Fat.Content.in.Grams.in.Fast-Food.Sandwiches
. Breakfast.meal. 39. Mega.hamburger.with.cheese. 26
. Double.bacon.and.egg.English.muffin. 23. Double.hamburger.with.cheese. 24
. Bacon.and.egg.English.muffin. 18. Big.burger. 21.5
. Pancakes.with.syrup. 16. Double.cheeseburger. 21
. Hash.browns. 15. Spicy.chicken.sandwich. 20
. Bacon.roll. 14. Vegetable.sandwich. 18
. Egg.and.English.muffin. 12.5. Chicken.sandwich. 17
. . . Cheeseburger. 12
. . . Hamburger. 7.5
Fat Content in Grams for Fast Food
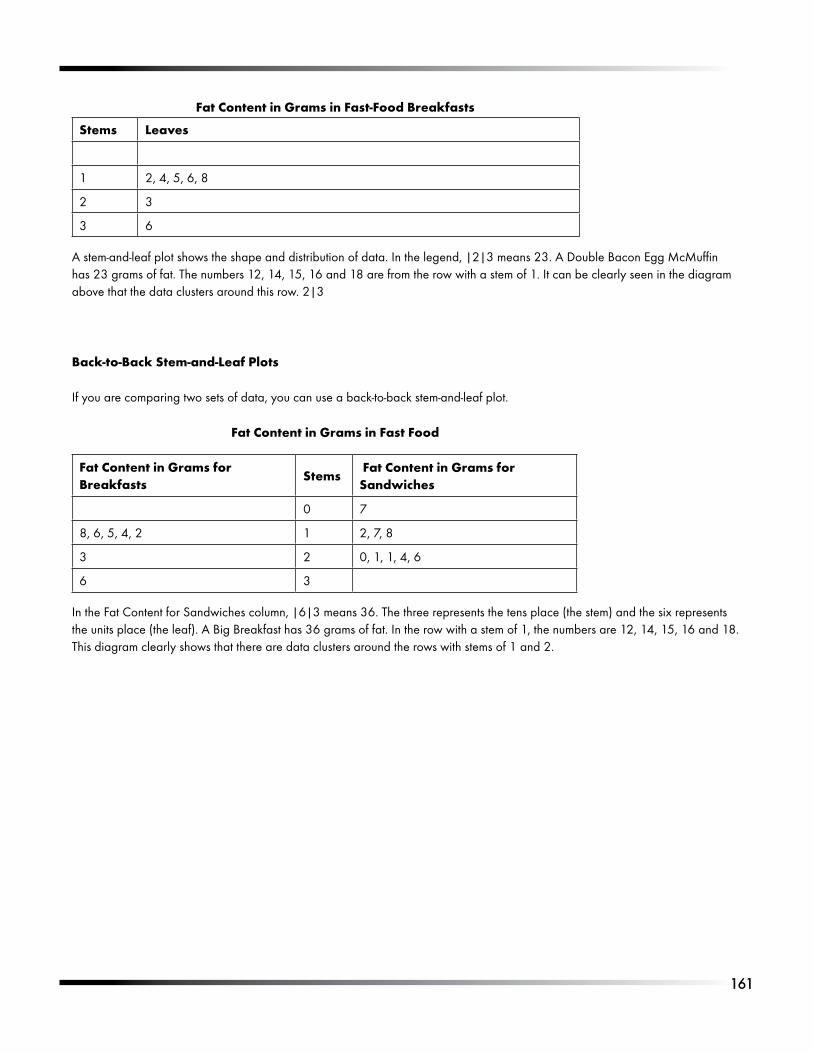
1�1
. Fat Content in Grams in Fast-Food Breakfasts
Stems Leaves
1 2,.4,.5,.6,.8
2 3
3 6
A.stem-and-leaf.plot.shows.the.shape.and.distribution.of.data..In.the.legend,.|2|3.means.23..A.Double.Bacon.Egg.McMuffin.has.23.grams.of.fat..The.numbers.12,.14,.15,.16.and.18.are.from.the.row.with.a.stem.of.1..It.can.be.clearly.seen.in.the.diagram.above.that.the.data.clusters.around.this.row..2|3
Back-to-Back Stem-and-Leaf Plots
If.you.are.comparing.two.sets.of.data,.you.can.use.a.back-to-back.stem-and-leaf.plot.
Fat Content in Grams in Fast Food
Fat Content in Grams for Breakfasts
Stems.Fat Content in Grams for Sandwiches
0 7
8,.6,.5,.4,.2 1 2,.7,.8
3 2 0,.1,.1,.4,.6
6 3
In.the.Fat.Content.for.Sandwiches.column,.|6|3.means.36..The.three.represents.the.tens.place.(the.stem).and.the.six.represents.the.units.place.(the.leaf)..A.Big.Breakfast.has.36.grams.of.fat..In.the.row.with.a.stem.of.1,.the.numbers.are.12,.14,.15,.16.and.18..This.diagram.clearly.shows.that.there.are.data.clusters.around.the.rows.with.stems.of.1.and.2.
S T U D E N T . H A N D O U T
1�2
Graph Paper
1��
Selecting a SampleWhen.you.get.a.blood.test,.does.the.nurse.take.out.all.of.your.blood.and.look.at.it?.(All.of.your.blood.would.be.the.population.of.blood.).Obviously,.they.take.a.sample..Do.you.have.to.drink.all.of.the.milk.in.a.gallon.to.see.if.it.is.spoiled?.Once.again,.it.is.logical.to.just.take.a.small.sample.to.get.the.information.that.you.need.
If.you.are.doing.a.project.and.don’t.want.to.work.with.the.entire.population,.you.too.can.use.a.sample.of.the population..While.it.is.true.that.anyone.who.is.part.of.the.population.can.be.asked.to.participate,.the.only.way.your.project.will.get.accurate.information.is.if.you.randomly.select.people.to.be.involved..If.you.want.to.know.the.favorite.sport.in.school.and.your.sample.all.comes.from.the.wrestling.team,.will.the.answer.to.your.question.really.reflect.the.favorite.sport.of.the.population?
A.random sample.means.that.everyone.in.the.population.has.an.equally.likely.chance.of.being.selected..Let’s.pretend.that.you.want.to.compare.the.number.of.hours.each.grade.works.on.homework..Here.are.some.ways.you.might.get.a.random.sample.
Go.to.the.cafeteria.and.ask.the.person.at.the.left.corner.seat.of.every.table.their.grade.and.the.average.number.of.hours.they.do.homework.each.day.
Give.every.student.a.number..Write.the.numbers.on.a.paper.and.randomly.select.the.numbers.of.students.to.participate..You.could.also.use.a.random.number.table.or.a.graphic.calculator.or.computer.to.generate.a.list.of.random.numbers
What.other.ways.might.you.get.a.random.sample?
The.most.difficult.question.is.how.many.should.be.included.in.the.sample? There.is.a.method.based.on.the.Central.Limit.Theory.that.can.tell.you.about.how.big.your.sample.should.be,.but.for.our.purposes,.we.will.say.that.you.don’t.want.your.sample.to.be.too.small..If.you.have.a.question.about.sample.size,.you.may.want.to.ask.your.teacher.to.help.you.determine.the.number.of.people.you.should.use.in.your.project..
There.is.generally.some.error.if.you.are.conducting.an.experiment.or.a.survey..This.is.called.sampling.error.and.the.amount.of.error.is.generally.told.to.you.when.you.read.about.the.project..The.bigger.your.sample,.the.less.error.you.should.expect..For.example,.a.survey.might.say.that.55.percent.of.the.people.in.the.U.S..have.football.as.their.favorite.sport.(with.a.sampling.error.of.±3.percent..This.means.that.the.real.number.is.between.52.percent.(55.-.3).and.58.percent.(55.+.3).
•
•
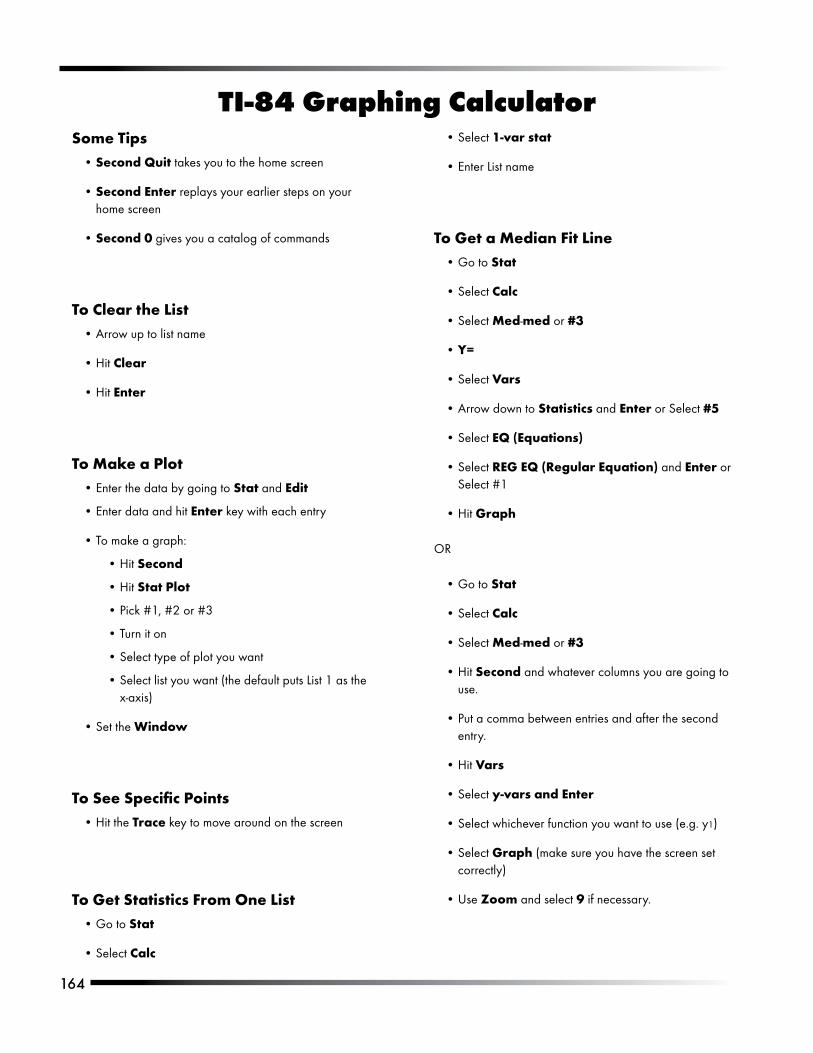
1��
TI-84 Graphing CalculatorSome Tips
Second Quit takes.you.to.the.home.screen
Second Enter.replays.your.earlier.steps.on.your.home.screen
Second 0.gives.you.a.catalog.of.commands
To Clear the ListArrow.up.to.list.name
Hit.Clear.
Hit.Enter
To Make a PlotEnter.the.data.by.going.to.Stat.and.Edit
Enter.data.and.hit.Enter.key.with.each.entry
To.make.a.graph:.
Hit.Second
Hit.Stat.Plot
Pick.#1,.#2.or.#3
Turn.it.on
Select.type.of.plot.you.want
Select.list.you.want.(the.default.puts.List.1.as.the.x-axis)
Set.the.Window
To See Specific PointsHit.the.Trace.key.to.move.around.on.the.screen
To Get Statistics From One ListGo.to.Stat
Select.Calc
•
•
•
•
•
•
•
•
•
•
•
•
•
•
•
•
•
•
•
Select.1-var.stat
Enter.List.name
To Get a Median Fit LineGo.to.Stat
Select.Calc
Select.Med-med.or.#3
Y=
Select.Vars
Arrow.down.to.Statistics.and Enter or.Select #5
Select EQ (Equations)
Select.REG EQ (Regular Equation).and.Enter.or.Select.#1
Hit.Graph
OR
Go.to Stat
Select.Calc
Select.Med-med.or #3
Hit.Second.and.whatever.columns.you.are.going.to.use..
Put.a.comma.between.entries.and.after.the.second.entry.
Hit.Vars
Select.y-vars and Enter
Select.whichever.function.you.want.to.use.(e.g..y1)
Select.Graph.(make.sure.you.have.the.screen.set.correctly)
Use.Zoom and.select 9.if.necessary.
•
•
•
•
•
•
•
•
•
•
•
•
•
•
•
•
•
•
•
•
•
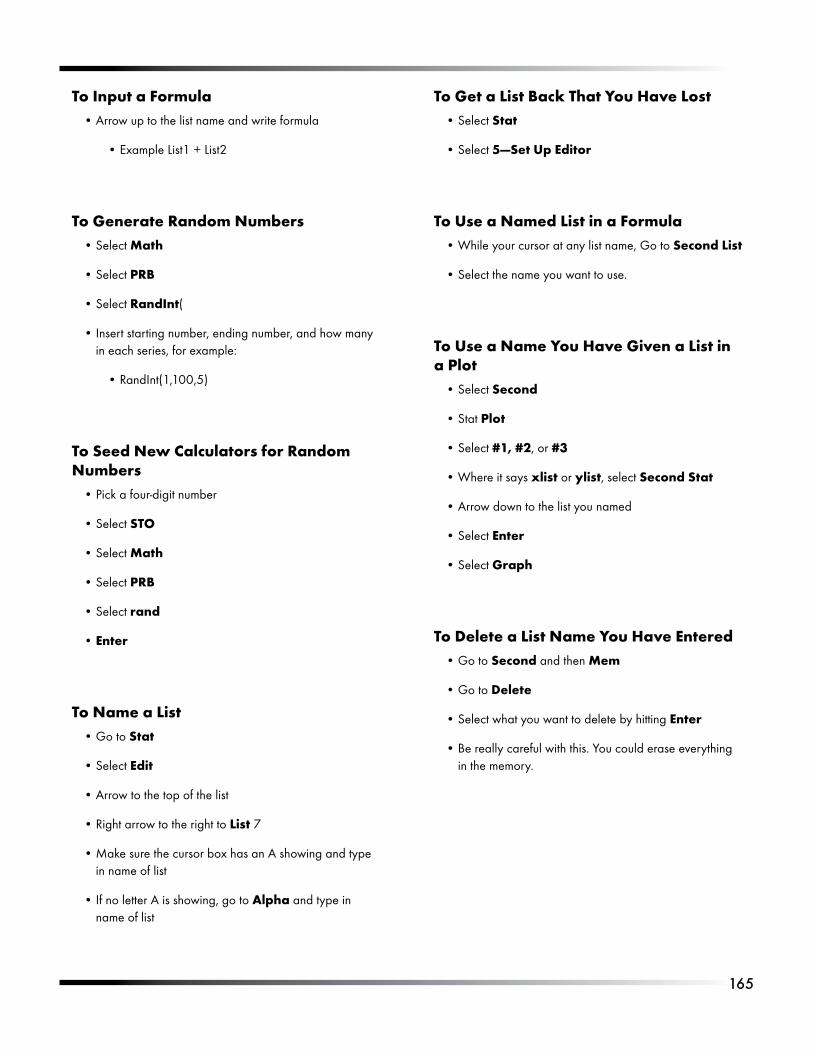
1��
To Input a FormulaArrow.up.to.the.list.name.and.write.formula
Example.List1.+.List2
To Generate Random NumbersSelect.Math
Select.PRB
Select.RandInt(
Insert.starting.number,.ending.number,.and.how.many.in.each.series,.for.example:.
RandInt(1,100,5)
To Seed New Calculators for Random Numbers
Pick.a.four-digit.number
Select.STO
Select.Math
Select.PRB
Select.rand
Enter
To Name a ListGo.to.Stat
Select.Edit
Arrow.to.the.top.of.the.list
Right.arrow.to.the.right.to.List.7
Make.sure.the.cursor.box.has.an.A.showing.and.type.in.name.of.list
If.no.letter.A.is.showing,.go.to.Alpha.and.type.in.name.of.list
•
•
•
•
•
•
•
•
•
•
•
•
•
•
•
•
•
•
•
To Get a List Back That You Have LostSelect.Stat
Select.5—Set Up Editor
To Use a Named List in a FormulaWhile.your.cursor.at.any.list.name,.Go.to.Second List
Select.the.name.you.want.to.use.
To Use a Name You Have Given a List in a Plot
Select.Second
Stat.Plot
Select.#1, #2,.or.#3
Where.it.says.xlist.or.ylist,.select.Second.Stat
Arrow.down.to.the.list.you.named
Select.Enter
Select.Graph
To Delete a List Name You Have EnteredGo.to.Second.and.then.Mem
Go.to.Delete
Select.what.you.want.to.delete.by.hitting.Enter
Be.really.careful.with.this..You.could.erase.everything.in.the.memory.
•
•
•
•
•
•
•
•
•
•
•
•
•
•
•
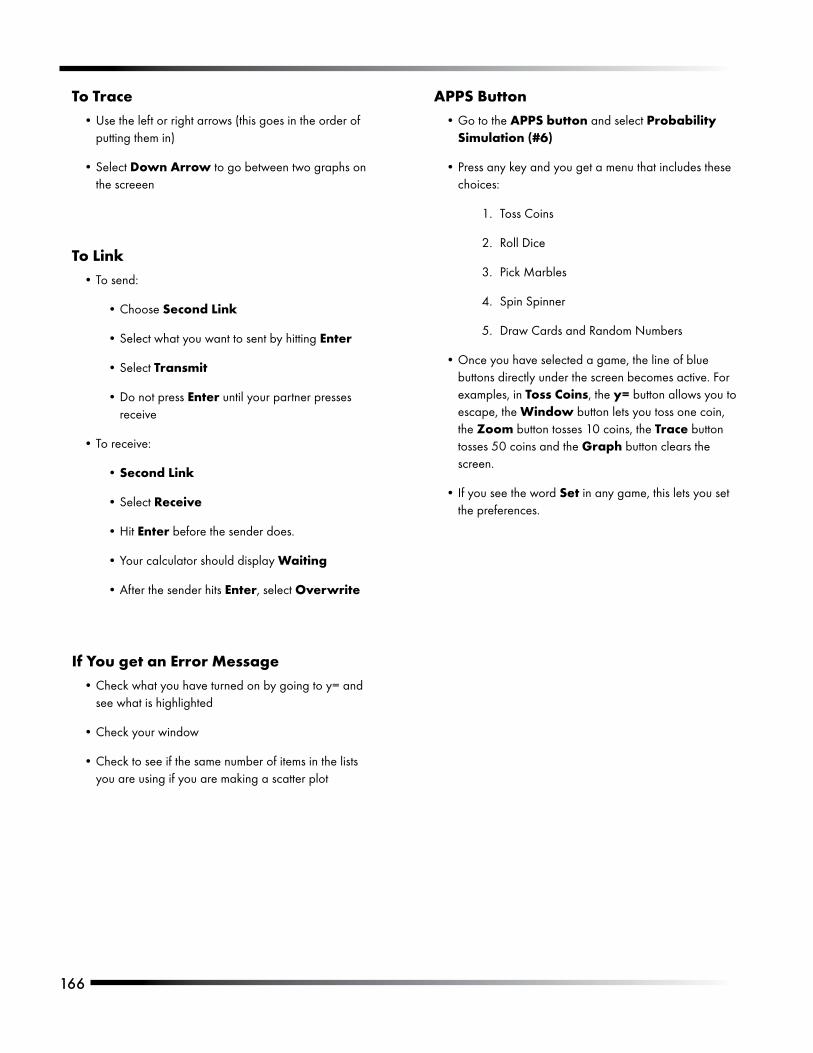
1��
To TraceUse.the.left.or.right.arrows.(this.goes.in.the.order.of.putting.them.in)
Select.Down Arrow.to.go.between.two.graphs.on.the.screeen
To LinkTo.send:
Choose.Second.Link
Select.what.you.want.to.sent.by.hitting.Enter
Select.Transmit
Do.not.press.Enter until.your.partner.presses.receive
To.receive:
Second Link
Select.Receive
Hit.Enter.before.the.sender.does..
Your.calculator.should.display.Waiting
After.the.sender.hits.Enter,.select.Overwrite
If You get an Error MessageCheck.what.you.have.turned.on.by.going.to.y=.and.see.what.is.highlighted
Check.your.window
Check.to.see.if.the.same.number.of.items.in.the.lists.you.are.using.if.you.are.making.a.scatter.plot
•
•
•
•
•
•
•
•
•
•
•
•
•
•
•
•
APPS ButtonGo.to.the.APPS button.and.select.Probability Simulation (#6)
Press.any.key.and.you.get.a.menu.that.includes.these.choices:.
Toss.Coins
Roll.Dice
Pick.Marbles
Spin.Spinner
Draw.Cards.and.Random.Numbers
Once.you.have.selected.a.game,.the.line.of.blue.buttons.directly.under.the.screen.becomes.active..For.examples,.in.Toss Coins,.the.y=.button.allows.you.to.escape,.the.Window.button.lets.you.toss.one.coin,.the.Zoom.button.tosses.10.coins,.the.Trace.button.tosses.50.coins.and.the.Graph.button.clears.the.screen.
If.you.see.the.word.Set.in.any.game,.this.lets.you.set.the.preferences.
•
•
1.
2.
3.
4.
5.
•
•
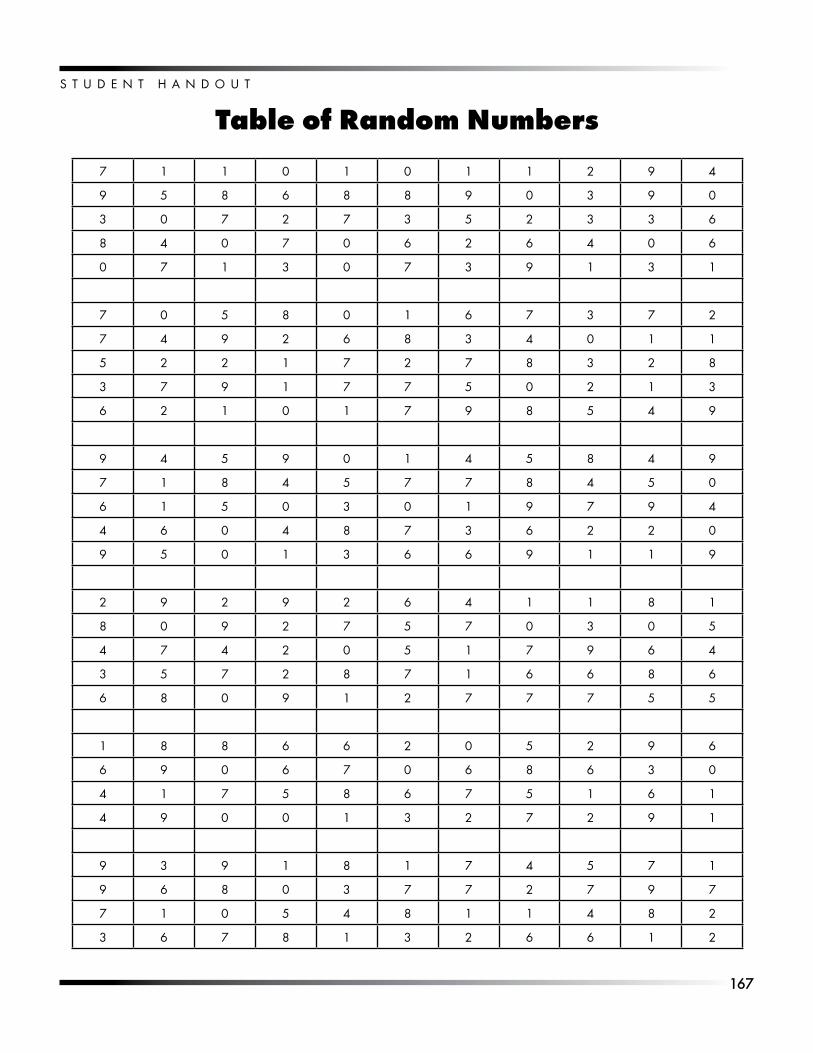
1�7
S T U D E N T . H A N D O U T
Table of Random Numbers
7 1 1 0 1 0 1 1 2 9 4
9 5 8 6 8 8 9 0 3 9 0
3 0 7 2 7 3 5 2 3 3 6
8 4 0 7 0 6 2 6 4 0 6
0 7 1 3 0 7 3 9 1 3 1
7 0 5 8 0 1 6 7 3 7 2
7 4 9 2 6 8 3 4 0 1 1
5 2 2 1 7 2 7 8 3 2 8
3 7 9 1 7 7 5 0 2 1 3
6 2 1 0 1 7 9 8 5 4 9
9 4 5 9 0 1 4 5 8 4 9
7 1 8 4 5 7 7 8 4 5 0
6 1 5 0 3 0 1 9 7 9 4
4 6 0 4 8 7 3 6 2 2 0
9 5 0 1 3 6 6 9 1 1 9
2 9 2 9 2 6 4 1 1 8 1
8 0 9 2 7 5 7 0 3 0 5
4 7 4 2 0 5 1 7 9 6 4
3 5 7 2 8 7 1 6 6 8 6
6 8 0 9 1 2 7 7 7 5 5
1 8 8 6 6 2 0 5 2 9 6
6 9 0 6 7 0 6 8 6 3 0
4 1 7 5 8 6 7 5 1 6 1
4 9 0 0 1 3 2 7 2 9 1
9 3 9 1 8 1 7 4 5 7 1
9 6 8 0 3 7 7 2 7 9 7
7 1 0 5 4 8 1 1 4 8 2
3 6 7 8 1 3 2 6 6 1 2
1�8
VocabularyAssociation:.The.trend.in.a.graph.that.shows.the.effect.on.one.measure.by.a.second.measure.
Biased sampling: A.sample.that.overrepresents.or.underrepresents.part.of.the.population..
Bar graph: A.graph.of.data.with.parallel.bars.used.for.comparing.information.on.categories.where.each.bar.represents.a.category.and.the.height.or.length.of.the.bar.represents.the.number.of.events.in.that.category.
Bivariate data: Data.or.events.described.using.two.variables.
Box-and-whisker plot: A.diagram.that.shows.pictorially.the.median.and.measures.of.spread.(upper.and.lower.interquartile.ranges.and.the.range).for.one.set.of.data.
Broken-scale symbol(): Is.used.at.the.end.of.the.axis.to.indicate.that.the.graph.does.not.begin.at.the.origin.(0,0).
Causation:.The.relationship.between.two.variables.where.a.change.in.one.variable.affects.the.outcome.of.the.other.variable.
Categorical data: Data.that.can.be.classified.by.type;.e.g.,.color,.types.of.dogs..These.types.of.data.are.typically.represented.using.bar.chart,.pie.charts.or.pictographs.
Census: When.every.member.of.the.population.has.data.collected.from.them.
Clusters and gaps: Numbers.that.tend.to.crowd.around.a.particular.point.in.a.set.of.values..The.spaces.between.the.clusters.are.called.gaps.
Combination: A.selection.of.a.group.of.items.or.events.from.a.set.without.regard.to.order;.e.g.,.the.number.of.three-piece.outfits.from.the.set.of.clothes.in.the.closet.
Complementary events: Two.or.more mutually exclusive events that.together.cover.all.possible.outcomes..The.sum.of.the.probabilities.of.complementary.events.is.one.
Compound events: Combining.two.or.more.independent.events.or.outcomes.and.considering.it.as.one.single.event.or.outcome.
Conditional probability: The.probability.of.an.event.occurring.given.that.another.event.has.already.occurred..For.example:.What.is.the.probability.that.the.total.of.two.dice.will.be.greater.than.eight.given.that.the.first.die.is.a.six?
Continuous data: Data.that.can.be.assigned.an.infinite.number.of.values.between.whole.numbers,.the.assigned.values.are.approximated;.e.g.,.the.size.of.the.apples.on.an.apple.tree.is.continuous.data..See.discrete data for.a.counterexample.
Convenience data: Data.that.has.been.gathered.with.the.group.at.hand.
Coordinate plane: A.plane.determined.by.the.intersection.of.two.perpendicular number.lines.in.which.any.point.can.be.located.
Coordinates: An.ordered.pair.of.numbers.used.to.show.a.position.on.a.graph..The.first.number.(X).gives.the.place.left.or.right.and.the.second.number.(Y).gives.the.place.up.or.down.(X,Y).
1��
Correlation: The.relation.between.two.sets.of.data,.a.positive.or.direct.correlation.exists.when.both.sets.vary.in.the.same.direction.(both.sets.decrease);.a.negative.or.inverse.correlation.exists.when.one.set.of.data.increases.as.the.other.decreases.
Correlation coefficient:.A.measure.of.the.correlation.between.two.variables.or.sets.of.data..The.value.of.the.correlation.coefficient,.r,.is.always.-1.to.1,.where.1.is.perfect.positive.correlation,.0.is.no.correlation,.and.-1.is.perfect.negative.correlation.
Cumulative frequency:.A.running.total.of.frequencies.
Datum: A.single.piece.of.data..The.singular.form.of.data.
Dependent events: A.statement.or.probability.for.one.event.affects.a.statement.or.probability.for.another.event.
Descriptive statistics: Gathered.and.described.data.using.probability,.statistical.methods.and.concepts.like.graphs.and.measures.of.center.
Discrete data: Data.that.can.be.counted;.e.g.,.the.number.of.people.in.a.town.is.discrete.(there.is.no.such.thing.as.a.fractional.person)..See.continuous data.for.a.counterexample.
Disjoint events: Two.events.that.have.no.outcomes.in.common.
Dispersion: How.data.is.spread.out.around.some.central.point.
Distribution: A.graph.or.table.showing.how.many.pieces.of.data.there.are.in.each.class,.or.of.each.type.
Equation:.A.statement.that.shows.two.mathematical.expressions.that.are.equal.to.each.other.
Event:.An.outcome.of.a.probability.experiment.
Experiment:.The.collecting.of.data.through.a.planned.investigation.
Experimental probability: The.probability.based.on.a.series.of.trials..The.experimental.probability,.P,.can.be.found.using.the.following.equation:
P(event).=.. #.of.trials.w/favorable.outcomes. number.of.trials.in.experiment
Experimental results: The.outcome.as.a.result.of.a.probability.experiment.or.test..These.outcomes.are.sometimes.called.actual.results.
Extrapolation: A.term.used.in.interpreting.scatter.plots.that.predicts.the.location.of.points.extending.beyond.the.data.displayed.
Frequency:.The.number.of.times.an.occurrence.takes.place.as.expressed.in.a.count..The.count.is.the.frequency.
Frequency distribution: A.collection.of.data.that.represents.the.number.of.times.a.set.of.numbers,.items.or.events.has.occurred.
Frequency table: A.table.that.shows.how.often.each.item,.number.or.range.of.numbers.occurs.in.a.set.of.data.
Geometric probability (area models): The.probability.that.a.random.point.is.located.in.a.particular.part.subregion.or.larger.region.
Glyph: A.picture.that.represents.data.
Histogram: Shows.how.measurements.spread.out.across.a.real.number.line,.marked.off.in.equal.intervals..The.height.of.the.bar.represents.the.frequencies.of.measurements.contained.in.that.interval.
Independent event: Two.events.in.which.the.outcome.of.the.first.event.does.not.affect.the.outcome.of.the.second.event.
170
Intercepts: The.value.of.y.on.the.coordinate plane where.x.=.0,.called.the.y-intercept..The.value.of.x.on.the.coordinate.plane.where.y.=.0,.called.the.x-intercept.
Interpolation:.A.term.used.in.interpreting.scatter.plots.that.predicts.the.location.of.points.that.would.lie.between.those.points.of.the.data.already.displayed.
Interquartile range: The.difference.between.the.upper.quartile.and.the.lower.quartile.
Interval:.The.distance.on.a.real.number.scale.between.two.consecutive.tick.marks.or.the.space.between.the.two.points.
Line of best fit: A.line.drawn.in.the.midst.of.the.points.on.a.scatter.plot.in.an.attempt.to.estimate.the.mathematical.relationship.between.the.variables used.to.generate.the.plot.
Line plot:.A.graph.that.indicates.the.location.of.data.points.along.a.segment.of.the.real.number.line.
Linear equation:.An.equation.whose.graph.on.a.coordinate.grid.is.a.straight.line.
Lower extreme: The.lowest.value.in.a.set.of.data.
Lower quartile: When.data.is.ordered.from.smallest.to.largest.and.divided.into.four.quarters,.the.values.that.are.in.the.lower.quarter.of.the.data.
Matrix: A.rectangular.array.of.numbers.or.symbols.
Measurement data (quantitative): Has.a.numerical.value.and.could.be.placed.on.a.number.line.
Measures of center: Numbers.that.provide.information.about.cluster.and.average.of.a.collection.of.data..They.include.the.mean,.mode.and.median.
Measures of spread.or.variability: A.term.used.to.refer.to.how.much.numbers.are.spread,.varied.or dispersed.in.a.set.of.data..They.include.range,.quartile.and.interquartile.range..
Mean: The.sum.of.a.set.of.numbers.divided.by.the.number.of.elements.in.the.set.
Median: The.middle.number.or.item.in.a.set.of.numbers.or.objects.arranged.from.least.to.greatest,.or.the.mean of.the.two.middle.numbers.when.the.set.has.two.middle.numbers.
Mode:.The.number.or.object.that.appears.most.frequently.in.a.set.of.numbers.or.objects.
Mutually exclusive events:.Two.events.that.cannot.occur.at.the.same.time..
Negative association:.A.pattern.in.the.shape.of.the.data.that.shows.when.one.measurement.grows.larger,.the.second.measure.grows.smaller..A.negative.association.will.be.slanted.downward.from.left.to.right.
Odds of an event: The.ratio.of.favorable.outcomes.to.unfavorable.outcomes.
Ordered pairs:.A.pair.of.numbers.that.gives.the.coordinates.of.a.point.on.a.grid.in.this.order.(horizontal.coordinate,.vertical.coordinate)..Also.called.paired.data.or.paired.coordinates.
Origin:.The.point.on.a.coordinate.plane.where.the.x-axis.and.the.y-axis.meet.and.have.the.ordered.pair.(0,0).
Outcome:.Any.possible.result.of.an.activity.or.experiment.
Outlier:.A.data.point.in.a.sample.widely.separated.from.the.main.cluster.of.points.in.the.sample.
Parallel box plots: Two.or.more.box.plots.using.the.same.number.line.to.allow.comparison.of.the.data.
171
Population: A.whole.set.of.individuals,.items.or.data.from.which.a.sample.is.drawn.
Permutations:.Possible.orders.or.arrangements.of.a.set.of.events.or.items.
Positive association: The.pattern.in.the.shape.of.data.that.shows.when.one.number.gets.larger,.the.second.also.gets.larger..It.will.be.slanted.upward.from.the.left.to.right.
Probability: The.chance.of.an.event.occurring..The.probability.of.an.event.is.equal.to.the.number.of.favorable.outcomes.divided.by.the.number.of.possible.outcomes.
Pictograph:.The.use.of.a.repeat.picture.in.a.bar.graph.form,.to.represent.data.
Quadrants: The.four.separate.sections.formed.by.the.two.axes.of.a.coordinate.system..These.are.identified.as.the.first,.second,.third.and.fourth.quadrants.
Qualitative data: Data.that.can.be.assigned.qualities.or.categories..They.are.nonnumerical.data.
Quantitative data: Data.that.are.numerical..The.data.can.be.discrete or.continuous.
Quartile: In.conjunction.with.the.median,.the.quartiles.divide.the.set.of.data.into.four.groups.of.equal.size.
Random sample: A.sample in.which.every.event.has.an.equal.chance.of.selection.and.each.event.is.chosen.by.a.random.process.
Random variable: A.variable that.takes.any.of.a.range.of.values.that.cannot.be.predicted.with.certainty.
Range: The.difference.between.the.greatest.and.the.least.numbers.in.a.set.of.data.
Rank: Placing.a.numerical.order.according.to.scale.or.value.
Relative frequency: The.number.of.times.an.event.occurs.divided.by.the.total.number.of.trials.
Sample: A.set.of.data.taken.from.a.larger.set.used.to.create.or.test.theories.about.the.data.as.a.whole.
Sample space: A.list.of.all.possible.outcomes.of.an.activity.
Sampling method: The.process.used.to.collect.data;..see.random sample.
Scale:.The.regular.intervals.of.the.number.line.that.are.chosen.to.represent.the.full.range.of.data.on.a.graph.
Scatter plot: A.graph.with.one.point.for.each.item.being.measured..The.coordinates.of.a.point.represent.the.measure.of.two.attributes.of.each.item.
Simple event:.A.subset.of.the.sample.space.that.contains.only.one.outcome.that.cannot.be.broken.down.into.a.simpler,.more.basic.outcome.
Simulation: The.study.of.probability.by.collecting.mathematically.appropriate.data.that.models.an.actual.event.
Slope of 1: A.line.that.contains.points.where.the.abscissa.(x.value).and.the.ordinate.(Y.value).are.equal..(The.rise.equals.the.run.)
Stem-and-leaf plot: A.frequency.diagram.that.displays.the.actual.data.together.with.its.frequency,.by.using.a.part.of.the.value.of.each.piece.of.data.to.fix.the.class.or.group.(the.stem),.while.the.remainder.of.the.value.is.actually.listed.(the.leaves)..
Survey:.A.question.or.set.of.questions.answered.by.a.population.of.people.
172
Symbolic form: A.representation.of.something.using.numbers.and.symbols.
Target population: The.set.from.which.a.sample.will.be.selected.
Theoretical probability: Identifying,.using.mathematical.expectations,.the.number.of.ways.an.event.could.happen.compared.to.all.the.events.that.could.happen.
Theoretical results: The.expected.results.given.the.theoretical probability of.an.event.
Tree diagram: A.graphic.representation.that.resembles.the.branching.out.of.a.tree..It.is.used.to.illustrate.outcomes.of.an.event.
Trend: An.emerging.pattern.in.the.shape.of.a.data.display.that.can.be.seen.on.a.scatter.plot.
Univariate data: Having.one.variable.
Upper extreme: The.largest.value.in.a.set.of.data;.the.maximum.
Upper quartile: When.data.is.ordered.from.smallest.to.largest.and.divided.into.four.quarters,.the.values.that.are.in.the.upper.quarter.of.the.data.
Variable: A.changing.quantity,.usually.a.letter.in.an.algebraic.equation.or.expression,.that.might.have.one.of.a.range.of.possible.values.
Variance: A.measure.of.the.dispersion of.the.distribution of.a.random variable.
Variants: A.quantity.whose.value.may.change.or.vary.
X-axis: The.horizontal.axis.on.a.coordinate.grid.
Y-axis: The.vertical.axis.on.a.coordinate.grid.
Definitions.are.from.the.Ohio State Content Standards for Mathematics.and.Exploring Statistics in the Elementary Grades.by.Bereska,.Boster,.Bolster.and.Scheaffer..(Dale.Seymour.Publications).
http://www.WesternReservePublicMedia.org/quizbus
Standards

17�
Data StandardsGrade Four
03-04 Benchmark A. Gather and organize data from surveys and classroom experiments, including data collected over a period of time.
Data.Collection./.Y2003.CMA.S05.G03-04.BA.L04.I01.
01.. Create.a.plan.for.collecting.data.for.a.specific.purpose..
Doing a Data Project, p. 106
03-04 Benchmark B. Read and interpret tables, charts, graphs (bar, picture, line, line plot), and timelines as sources of information, identify main idea, draw conclusions, and make predictions.
Data.Collection./.Y2003.CMA.S05.G03-04.BB.L04.I02
02.. Represent.and.interpret.data.using.tables,.bar.graphs,.line.plots.and.line.graphs..
Interpreting Graphs Using CBR and Graphing Calculator, p. 13
Data.Collection./Y2003.CMA.S05.G03-04.BB.L04.I05.
05.. Propose.and.explain.interpretations.and.predictions.based.on.data.displayed.in.tables,.charts.and.graphs..
Interpreting Graphs Using CBR and Graphing Calculator, p. 13
03-04 Benchmark C. Construct charts, tables and graphs to represent data, including picture graphs, bar graphs, line graphs, line plots and Venn diagrams.
Data.Collection./.Y2003.CMA.S05.G03-04.BC.L04.I02.
02.. Represent.and.interpret.data.using.tables,.bar.graphs,.line.plots.and.line.graphs..
The Need to Use a Random Sample, p. 94
Data.Collection./.Y2003.CMA.S05.G03-04.BC.L04.I04.
04.. Compare.different.representations.of.the.same.data.to.evaluate.how.well.each.representation.shows.important.aspects.of.the.data,.and.identify.appropriate.ways.to.display.the.data..
Doing a Data Project, p. 106
The Need to Use a Random Sample, p. 94
17�
03-04 Benchmark E. Describe data using mode, median and range.
Statistical.Methods./.Y2003.CMA.S05.G03-04.BE.L04.I07
07.. Identify.the.median.of.a.set.of.data.and.describe.what.it.indicates.about.the.data..
Mean, Median, Mode and Range, p. 21
The Need to Use a Random Sample, p. 94
Statistical.Methods./.Y2003.CMA.S05.G03-04.BE.L04.I08.
08.. Use.range,.median.and.mode.to.make.comparisons.among.related.sets.of.data..
Mean, Median, Mode and Range, p. 21
03-04 Benchmark F. Conduct a simple probability experiment and draw conclusions about the likelihood of possible outcomes.
Probability./.Y2003.CMA.S05.G03-04.BF.L04.I09
09.. Conduct.simple.probability.experiments.and.draw.conclusions.from.the.results;.e.g.,.rolling.number.cubes.or.drawing.marbles.from.a.bag..
An Introduction to Probability, p. 115
Probability./.Y2003.CMA.S05.G03-04.BF.L04.I10.
10.. Represent.the.likelihood.of.possible.outcomes.for.chance.situations;.e.g.,.probability.of.selecting.a.red.marble.from.a.bag.containing.3.red.and.5.white.marbles..
An Introduction to Probability, p. 115
Probability./.Y2003.CMA.S05.G03-04.BF.L04.I11
11.. Relate.the.concepts.of.impossible.and.certain-to-happen.events.to.the.numerical.values.of.0.(impossible).and.1.(certain)..
An Introduction to Probability, p. 115
Probability./.Y2003.CMA.S05.G03-04.BF.L04.I12
12.. Place.events.in.order.of.likelihood.and.use.a.diagram.or.appropriate.language.to.compare.the.chance.of.each.event.occurring;.e.g..impossible,.unlikely,.equal,.likely,.certain..
An Introduction to Probability, p. 115
177
03-04 Benchmark G. Identify and represent possible outcomes, such as arrangements of a set of up to four members and possible combinations from several sets, each containing 2 or 3 members.
Probability./.Y2003.CMA.S05.G03-04.BG.L04.I13
13.. List.and.count.all.possible.combinations.using.one.member.from.each.of.several.sets,.each.containing.2.or.3.members;.e.g.,.the.number.of.possible.outfits.from.3.shirts,.2.shorts.and.2.pair.of.shoes..
Probability: Native American Game of Sticks, p. 127
Tree Diagrams, p. 118
Grade Five 05-07 Benchmark A. Read, create and use line graphs, histograms, circle graphs, box-and-whisker plots, stem-and-
leaf plots, and other representations when appropriate.
Data.Collection./.Y2003.CMA.S05.G05-07.BA.L05.I01
01.. Read,.construct.and.interpret.frequency.tables,.circle.graphs.and.line.graphs..
All About You Survey: Which Graph Is Best?, p. 54
Zodiac Circle Graphs, p. 45
05-07 Benchmark C. Evaluate interpretations and conclusions as additional data are collected, modify conclusions and predictions, and justify new findings.
Data.Collection./.Y2003.CMA.S05.G05-07.BC.L05.I05
05.. Modify.initial.conclusions,.propose.and.justify.new.interpretations.and.predictions.as.additional.data.are.collected.
Interpreting Graphs Using CBR and Graphing Calculator, p. 13
05-07 Benchmark D. Compare increasingly complex displays of data, such as multiple sets of data on the same graph.
Data.Collection./.Y2003.CMA.S05.G05-07.BD.L05.I03
03.. Read.and.interpret.increasingly.complex.displays.of.data,.such.as.double.bar.graphs..
A Variety of Graphs, p. 49
178
05-07 Benchmark E. Collect, organize, display and interpret data for a specific purpose or need.
Data.Collection./.Y2003.CMA.S05.G05-07.BE.L05.I02
02.. Select.and.use.a.graph.that.is.appropriate.for.the.type.of.data.to.be.displayed;.e.g.,.numerical.vs..categorical.data,.discrete.vs..continuous.data..
Bar Graphs, p. 41
Line Plots, p. 38
Types of Data: Categorical vs. Measurement and Discrete vs. Continuous, p. 27
A Variety of Graphs, p. 49
Wheel of Fortune: Line Plots, p. 35
Data.Collection./.Y2003.CMA.S05.G05-07.BE.L05.I04
04.. Determine.appropriate.data.to.be.collected.to.answer.questions.posed.by.students.or.teacher,.collect.and.display.data,.and.clearly.communicate.findings..
All About You Survey: Which Graph Is Best?, p. 54
Bar Graphs, p. 41
Doing a Data Project, p. 106
Line Plots, p. 38
Taking a Survey, p. 101
A Variety of Graphs, p. 49
Wheel of Fortune: Line Plots, p. 35
05-07 Benchmark F. Determine and use the range, mean, median and mode to analyze and compare data, and explain what each indicates about the data.
Statistical.Methods./.Y2003.CMA.S05.G05-07.BF.L05.I06
06.. Determine.and.use.the.range,.mean,.median.and.mode,.and.explain.what.each.does.and.does.not.indicate.about.the.set.of.data..
Doing a Data Project, p. 106
Human Box-and-Whisker Plot, p. 67
Line Plots, p. 38
Mean, Median, Mode and Range, p. 21
Wheel of Fortune: Line Plots, p. 35

17�
05-07 Benchmark H. Find all possible outcomes of simple experiments or problem situations, using methods such as lists, arrays and tree diagrams.
Probability./.Y2003.CMA.S05.G05-07.BH.L05.I07
07.. List.and.explain.all.possible.outcomes.in.a.given.situation..
An Introduction to Probability, p. 115
Tree Diagrams, p. 118
05-07 Benchmark I. Describe the probability of an event using ratios, including fractional notation.
Probability./.Y2003.CMA.S05.G05-07.BI.L05.I08
08.. Identify.the.probability.of.events.within.a.simple.experiment,.such.as.three.chances.out.of.eight..
An Introduction to Probability, p. 115
Tree Diagrams, p. 118
Probability./.Y2003.CMA.S05.G05-07.BI.L05.I09
09.. Use.0,1.and.ratios.between.0.and.1.to.represent.the.probability.of.outcomes.for.an.event,.and.associate.the.ratio.with.the.likelihood.of.the.outcome..
An Introduction to Probability, p. 115
Tree Diagrams, p. 118
05-07 Benchmark J. Compare experimental and theoretical results for a variety of simple experiments.
Probability./.Y2003.CMA.S05.G05-07.BJ.L05.I10
10.. Compare.what.should.happen.(theoretical/expected.results).with.what.did.happen.(experimental/actual.results).in.a.simple.experiment..
Experimental vs. Theoretical Probability: The Checkout Game, p. 131
Probability: Native American Stick Game, p. 127
05-07 Benchmark K. Make and justify predictions based on experimental and theoretical probabilities.
Probability./.Y2003.CMA.S05.G05-07.BK.L05.I11
11.. Make.predictions.based.on.experimental.and.theoretical.probabilities..
Experimental vs. Theoretical Probability: The Checkout Game, p. 131
Probability: Native American Stick Game, p. 127
180
Grade Six 05-07 Benchmark A. Read, create and use line graphs, histograms, circle graphs, box-and-whisker plots, stem-and-
leaf plots, and other representations when appropriate.
Data.Collection./.Y2003.CMA.S05.G05-07.BA.L06.I01
01.. Read,.construct.and.interpret.line.graphs,.circle.graphs.and.histograms..
All About You Survey: Which Graph Is Best?, p. 54
Grades: Making a Histogram, p. 43
A Variety of Graphs, p. 49
Wheel of Fortune: Line Plots, p. 35
Zodiac Circle Graphs, p. 45
05-07 Benchmark B. Interpret data by looking for patterns and relationships, draw and justify conclusions, and answer related questions.
Statistical.Methods./.Y2003.CMA.S05.G05-07.BB.L06.I05
05.. Describe.the.frequency.distribution.of.a.set.of.data,.as.shown.in.a.histogram.or.frequency.table,.by.general.appearance.or.shape;.e.g.,.number.of.modes,.middle.of.data,.level.of.symmetry,.outliers.
All About You Survey: Which Graph Is Best?, p. 54
Grades: Making a Histogram, p. 43
Line Plots, p. 38
Wheel of Fortune: Line Plots, p. 35
Zodiac Circle Graphs, p. 45
05-07 Benchmark D. Compare increasingly complex displays of data, such as multiple sets of data on the same graph.
Data.Collection./.Y2003.CMA.S05.G05-07.BD.L06.I03
03.. Compare.representations.of.the.same.data.in.different.types.of.graphs,.such.as.a.bar.graph.and.circle.graph..
All About You Survey: Which Graph Is Best?, p. 54
Bar Graphs, p. 41
A Variety of Graphs, p. 49
181
05-07 Benchmark E. Collect, organize, display and interpret data for a specific purpose or need.
Data.Collection./.Y2003.CMA.S05.G05-07.BE.L06.I02
02.. Select,.create.and.use.graphical.representations.that.are.appropriate.for.the.type.of.data.collected..
All About You Survey: Which Graph Is Best?, p. 54
Bar Graphs, p. 41
Doing a Data Project, p. 106
Grades: Making a Histogram, p. 43
Human Box-and-Whisker Plots, p. 67
Line Plots, p. 38
A Variety of Graphs, p. 49
Wheel of Fortune: Line Plots, p. 35
Zodiac Circle Graphs, p. 45
05-07 Benchmark F. Determine and use the range, mean, median and mode to analyze and compare data, and explain what each indicates about the data.
Statistical.Methods./.Y2003.CMA.S05.G05-07.BF.L06.I04
04.. Understand.the.different.information.provided.by.measures.of.center.(mean,.mode.and.median).and.measures.of.spread.(range)..
Doing a Data Project, p. 106
Human Box-and-Whisker Plots, p. 67
Line Plots, p. 38
Mean, Median, Mode and Range, p. 21
Wheel of Fortune: Line Plots, p. 35
05-07 Benchmark G. Evaluate conjectures and predictions based upon data presented in tables and graphs, and identify misuses of statistical data and displays.
Statistical.Methods./.Y2003.CMA.S05.G05-07.BG.L06.I06
06.. Make.logical.inferences.from.statistical.data.
Bar Graphs, p. 41
Doing a Data Project, p. 106
Line Plots, p. 38
Labeling Graphs, p. 9
The Need to Use a Random Sample, p. 94
Wheel of Fortune: Line Plots, p. 35
.
182
05-07 Benchmark K. Make and justify predictions based on experimental and theoretical probabilities.
Probability./.Y2003.CMA.S05.G05-07.BK.L06.I07
07.. Design.an.experiment.to.test.a.theoretical.probability.and.explain.how.the.results.may.vary..
Experimental vs. Theoretical Probability: The Checkout Game, p. 131
Grade Seven 05-07 Benchmark A. Read, create and use line graphs, histograms, circle graphs, box-and-whisker plots, stem-and-
leaf plots, and other representations when appropriate.
Data.Collection./.Y2003.CMA.S05.G05-07.BA.L07.I01
01.. Read,.create.and.interpret.box-and-whisker.plots,.stem-and-leaf.plots,.and.other.types.of.graphs,.when.appropriate..
All About You Survey: Which Graph Is Best?, p. 54
Box-and-Whisker Plots, p. 70
Human Box-and-Whisker Plots, p. 67
Mean, Median, Mode and Range, p. 21
Scatter Plots and Median Fit Lines, p. 87
Stem-and-Leaf Plot, p. 63
A Variety of Graphs, p. 49
05-07 Benchmark B. Interpret data by looking for patterns and relationships, draw and justify conclusions, and answer related questions.
Statistical.Methods./.Y2003.CMA.S05.G05-07.BB.L07.I04
04.. Construct.opposing.arguments.based.on.analysis.of.the.same.data,.using.different.graphical.representations..
All About You Survey: Which Graph Is Best?, p. 54
Doing a Data Project, p. 106
18�
05-07 Benchmark D. Compare increasingly complex displays of data, such as multiple sets of data on the same graph.
Statistical.Methods./.Y2003.CMA.S05.G05-07.BD.L07.I05
05.. Compare.data.from.two.or.more.samples.to.determine.how.sample.selection.can.influence.results..
Doing a Data Project, p. 106
Learning About Sampling, p. 97
05-07 Benchmark E. Collect, organize, display and interpret data for a specific purpose or need.
Data.Collection./.Y2003.CMA.S05.G05-07.BE.L07.I02
02.. Analyze.how.decisions.about.graphing.affect.the.graphical.representation;.e.g.,.scale,.size.of.classes.in.a.histogram,.number.of.categories.in.a.circle.graph..
Doing a Data Project, p. 106
Grades: Making a Histogram, p. 43
Zodiac Circle Graphs, p. 45
05-07 Benchmark F. Determine and use the range, mean, median and mode to analyze and compare data, and explain what each indicates about the data.
Statistical.Methods./.Y2003.CMA.S05.G05-07.BF.L07.I03
03.. Analyze.a.set.of.data.by.using.and.comparing.combinations.of.measures.of.center.(mean,.mode,.median).and.measures.of.spread.(range,.quartile,.interquartile.range),.and.describe.how.the.inclusion.or.exclusion.of.outliers.affects.those.measures.
Box-and-Whisker Plots, p. 70
Doing a Data Project, p. 106
Human Box-and-Whisker Plot, p. 67
Mean, Median, Mode and Range, p. 21
05-07 Benchmark G. Evaluate conjectures and predictions based upon data presented in tables and graphs, and identify misuses of statistical data and displays.
Data.Collection./.Y2003.CMA.S05.G05-07.BG.L07.I02
02..Analyze.how.decisions.about.graphing.affect.the.graphical.representation;.e.g.,.scale,.size.of.classes.in.a.histogram,.number.of.categories.in.a.circle.graph.
Doing a Data Project, p. 106
Grades: Making a Histogram, p. 43
18�
Statistical.Methods./.Y2003.CMA.S05.G05-07.BG.L07.I06
06.. Identify.misuses.of.statistical.data.in.articles,.advertisements,.and.other.media..
Misleading Graphs, p. 17
05-07 Benchmark I. Describe the probability of an event using ratios, including fractional notation.
Probability./.Y2003.CMA.S05.G05-07.BI.L07.I07
07.. Compute.probabilities.of.compound.events;.e.g.,.multiple.coin.tosses.or.multiple.rolls.of.number.cubes,.using.such.methods.as.organized.lists,.tree.diagrams.and.area.models..
Area Models or Geometric Probability, p. 138
Multiplying the Probability, p. 123
Probability: Native American Stick Game, p. 127
Tree Diagrams, p. 118
05-07 Benchmark K. Make and justify predictions based on experimental and theoretical probabilities.
Probability./.Y2003.CMA.S05.G05-07.BK.L07.I08
08.. Make.predictions.based.on.theoretical.probabilities,.design.and.conduct.an.experiment.to.test.the.predictions,.compare.actual.results.to.predicted.results,.and.explain.differences..
Experimental vs. Theoretical Probability: The Checkout Game, p. 131
An Introduction to Probability, p. 115
Grade Eight 08-10 Benchmark A. Create, interpret and use graphical displays and statistical measures to describe data; e.g.,
box-and-whisker plots, histograms, scatter plots, measures of center and variability.
Data.Collection./.Y2003.CMA.S05.G08-10.BA.L08.I01
01.. Use,.create.and.interpret.scatter.plots.and.other.types.of.graphs.as.appropriate..
Doing a Data Project, p. 106
Monopoly Madness, p. 87
Scatter Plots and Median Fit Lines, p. 77
18�
08-10 Benchmark B. Evaluate different graphical representations of the same data to determine which is the most appropriate representation for an identified purpose.
Data.Collection./Y2003.CMA.S05.G08-10.BB.L08.I02
02.. Evaluate.different.graphical.representations.of.the.same.data.to.determine.which.is.the.most.appropriate.representation.for.an.identified.purpose;.e.g.,.line.graph.for.change.over.time,.circle.graph.for.part-to-whole.comparison,.scatter.plot.for.relationship.between.two.variants..
All About You Survey: Which Graph Is Best?, p. 54
Doing a Data Project, p. 106
Data.Collection./.Y2003.CMA.S05.G08-10.BB.L08.I03.
03.. Differentiate.between.discrete.and.continuous.data.and.appropriate.ways.to.represent.each..
Doing a Data Project, p. 106
Types of Data: Categorical vs. Measurement and Discrete vs. Continuous, p. 27
08-10 Benchmark C. Compare the characteristics of the mean, median and mode for a given set of data, and explain which measure of center best represents the data.
Statistical.Methods./.Y2003.CMA.S05.G08-10.BC.L08.I05
05.. Explain.the.mean’s.sensitivity.to.extremes.and.its.use.in.comparison.with.the.median.and.mode
Scatter Plots and Median Fit Line, p. 77
08-10 Benchmark D. Find, use and interpret measures of center and spread, such as mean and quartiles, and use those measures to compare and draw conclusions about sets of data.
Statistical.Methods./.Y2003.CMA.S05.G08-10.BD.L08.I04
04.. Compare.two.sets.of.data.using.measures.of.center.(mean,.mode,.median).and.measures.of.spread.(range,.quartiles,.interquartile.range,.percentiles)..
Mean, Median, Mode and Range, p. 21
Statistical.Methods./.Y2003.CMA.S05.G08-10.BE.L08.I08
08.. Describe.how.the.relative.size.of.a.sample.compared.to.the.target.population.affects.the.validity.of.predictions..
Doing a Data Project, p. 106
Learning About Sampling, p. 97
The Need to Use a Random Sample, p. 94
18�
08-10 Benchmark F. Construct convincing arguments based on analysis of data and interpretation of graphs.
Statistical.Methods./.Y2003.CMA.S05.G08-10.BF.L08.I06
06.. Make.conjectures.about.possible.relationship.in.a.scatter.plot.and.approximate.line.of.best.fit.
Doing a Data Project, p. 106
Interpreting Graphs Using CBR and Graphing Calculator, p. 13
Monopoly Madness, p. 87
Scatter Plots and Median Fit Line, p. 77
Statistical.Methods./.Y2003.CMA.S05.G08-10.BF.L08.I09
09.. Construct.convincing.arguments.based.on.analysis.of.data.and.interpretation.of.graphs..
Doing a Data Project, p. 106
Interpreting Graphs Using CBR and Graphing Calculator, p. 13
Monopoly Madness, p. 87
The Need to Use a Random Sample, p. 94
08-10 Benchmark H. Use counting techniques, such as permutations and combinations, to determine the total number of options and possible outcomes.
Probability./.Y2003.CMA.S05.G08-10.BH.L08.I10
10.. Calculate.the.number.of.possible.outcomes.for.a.situation,.recognizing.and.accounting.for.when.items.may.occur.more.than.once.or.when.order.is.important..
Experimental vs. Theoretical Probability: The Checkout Game, p. 131
08-10 Benchmark J. Compute probabilities of compound events, independent events, and simple dependent events.
Probability./Y2003.CMA.S05.G08-10.BJ.L08.I11
11.. Demonstrate.an.understanding.that.the.probability.of.either.of.two.disjoint.events.occurring.can.be.found.by.adding.the.probabilities.for.each.and.that.the.probability.of.one.independent.event.following.another.can.be.found.by.multiplying.the.probabilities..
Multiplying the Probability, p. 123
Tree Diagrams, p. 118


Western Reserve Public Media1750.Campus.Center.Drive
Kent,.OH.44240-5191330-677-4549
http://www.WesternReservePublicMedia.org/quizbus