teacher evaluation in tennessee: a report on year 1 ... leaders have a voice in the improvement of...
TRANSCRIPT

1
Teacher Evaluation in Tennessee:
A Report on Year 1 Implementation
July 2012
i
Table of Contents
Executive Summary 1
Introduction 8
Evaluation Overview 9
Feedback: Process and Findings 10
Results: Student Outcomes and Teacher Observation Results 27
Recommendations & Considerations 34
Closing 43

1
Executive Summary
In July 2011, Tennessee became one of the first states in the country to implement a comprehensive,
student outcomes-based, statewide educator evaluation system. This implementation was a key tenet
of Tennessee’s First to the Top Act, adopted by the General Assembly with bipartisan support during
2010’s extraordinary session under the backdrop of the federal Race to the Top competition. This
landmark legislation established the parameters of a new teacher and principal evaluation system and
committed to implementation during the 2011-12 school year. The act required 50 percent of the
evaluation to be comprised of student achievement data—35 percent based on student growth as
represented by the Tennessee Value-Added Assessment System (TVAAS) or a comparable measure and
the other 15 percent based on additional measures of student achievement adopted by the State Board
of Education and chosen through mutual agreement by the educator and evaluator. The remaining 50
percent of the evaluation is determined through qualitative measures such as teacher observations,
personal conferences and review of prior evaluations and work.
An important component of the First to the Top Act was the creation of the Teacher Evaluation Advisory
Committee (TEAC), a group of teachers, principals, superintendents, legislators, business leaders, and
other community members, which met 21 times over the course of the following year to review and
discuss various issues related to policy and implementation. The committee reviewed field tests of four
different observation rubrics, which were conducted in the 2010-11 school year in approximately 125
schools across the state. The TEAC supported use of the TEAM (Tennessee Educator Acceleration Model)
rubric as the state model and also voted on a number of key components of implementation, including
the number and structure of observations for the year. By law, those recommendations were made to
the State Board of Education, which was charged with adopting the final guidelines and criteria for the
annual evaluation of all teachers and principals. The board ultimately unanimously adopted the TEAC-
endorsed TEAM model and, in addition, approved three alternative models – 1) Project Coach in
Hamilton County; 2) TEM (Teacher Effectiveness Measure) in Memphis City; and 3) TIGER (Teacher
Instructional Growth for Effectiveness and Results) in 12, mostly municipal, school systems statewide.
The board also approved a menu of achievement measures that could be used as part of the 15 percent
measure.
In the summer of 2011, the Tennessee Department of Education contracted with the National Institute
for Excellence in Teaching (NIET) to provide a four-day training for all evaluators across the state. NIET
trained more than 5,000 evaluators intensively in the state model (districts using alternative instruments
delivered their own training). Evaluators were required to pass an inter-rater reliability exam, in which
they viewed video recordings of teachers delivering lessons and rated them to ensure they understood
the distinction between differing levels of performance.
Implementation of the evaluation system began at the start of the 2011-12 school year. The department
made a concentrated effort to solicit and encourage feedback, meeting with teachers and
administrators across the state. Educators voiced both strengths and concerns about various facets of
the teacher evaluation process and implementation. Legislators also received feedback from their
constituents and shared information with department officials. The department and others heard
2
positive comments from administrators about improvements in the quality of instruction in classrooms
and also heard concerns about particular facets of the system. As implementation continued through
the first semester of the school year, it became clear that satisfaction with the evaluation system varied
considerably from district to district, driven largely by district- and school-level leadership.
While administrators continued to tout the system’s impact on instruction, the public discussion about
teacher evaluation began to detract from the real purpose of the evaluation system: improving student
achievement. In response, Governor Haslam, supported by legislative leadership, tasked the State
Collaborative on Reforming Education (SCORE) with conducting an independent review of the system
through a statewide listening and feedback process and producing a report to the State Board of
Education and department outlining a range of policy considerations. In addition, the Governor
announced his support of House Joint Resolution (HJR) 520, which ultimately was adopted by the
General Assembly. This resolution directed the department to follow through on its commitment to seek
feedback, conduct an internal review of the evaluation system, and provide a report with
recommendations to the House and Senate Education Committees by July 15, 2012.
Feedback
In response to the charge presented to the department, and in an ongoing effort to ensure teachers and
school leaders have a voice in the improvement of the teacher evaluation system, the department has
offered multiple opportunities and methods (outlined in this report) for educators and stakeholders to
provide feedback about what is working and which areas of the system need improvement. The
feedback represented in this report is based on the following sources:
In-person meetings and presentations by department team members in front of more than
7,500 teachers across the state
120 stakeholder meetings across the state through focus groups and study councils
More than 7,500 emails (feedback and questions) received through our teacher evaluation
electronic help desk
Meetings with all of the state’s 136 directors of schools, in large and small group discussions
In-person visits by Commissioner Huffman to more than 100 school districts since the evaluation
plan was adopted
Two surveys of teachers—one from SCORE and one from TNCRED (Tennessee Consortium on
Research, Evaluation & Development) —open to all Tennessee educators, resulting in
approximately 17,000 responses to SCORE and a similar number to TNCRED
An in-depth report and analysis by SCORE based on nine public roundtables throughout the
state, its on-line questionnaire/survey, and numerous interviews
Additionally, the most important piece of feedback is the overlay of three pieces of data: the results of
the state’s annual student assessments; the TVAAS scores of teachers and schools; and the observation
scores of teachers. These represent thousands of pieces of data that help show the overall accuracy and
impact of the evaluation system.
This feedback loop and model of continuous improvement is not a one-time event; it must carry on into
the coming months and years as we continue to make the system better.

3
Through our feedback gathering process, common themes have emerged:
Administrators and teachers—including both supporters and opponents of the evaluation
model—believe the TEAM rubric effectively represents high-quality instruction and facilitates
rich conversations about instruction.
Administrators consistently noted that having school-wide value-added scores has led to
increased collaboration among teachers and a higher emphasis on academic standards in all
subjects.
Administrators and teachers both feel too many teachers have treated the rubric like a checklist
rather than viewing it as a holistic representation of an effective lesson, and both groups feel
additional training is needed on this point.
Teachers in subjects and grades that do not yield an individual value-added score do not believe
it is fair to have 35 percent of their evaluation determined by school-wide scores.
Implementation of the 15 percent measure has not led to selection of appropriate measures,
with choices too often dictated by teacher and principal perceptions of which measure would
generate the highest score rather than an accurate reflection of achievement.
Administrators consistently noted the large amount of time needed to complete the evaluation
process. In particular, administrators want to spend less time observing their highest performing
teachers and more time observing lower performing teachers. Additionally, they feel the
mechanics of the process (e.g., data entry) need to be more streamlined and efficient.
Both administrators and teachers consistently felt better about the system as the year
progressed, in part due to familiarity with the expectations and because of changes that allowed
for fewer classroom visits during the second semester.
Local capacity to offer high-quality feedback and to facilitate targeted professional development
based on evaluation results varies considerably across districts.
Results
Student Outcomes
The 2011-12 school year saw tremendous progress for public education in Tennessee, as measured by
the most significant outcome - student achievement. Test scores improved, in aggregate, at a faster rate
than any previously measured year. Math and science scores, in particular, increased significantly,
moving students forward against rigorous, nationally-benchmarked standards. To put this into
perspective, 55,000 more students are at or above grade level in math than in 2010; 38,000 more
students are at or above grade level in science. This growth and achievement represents real change in
the academic trajectory and potential life options for Tennessee students and can be the very real
difference between long-term success and failure.
We attribute this strong academic performance to a number of factors, including higher academic
standards through the Tennessee Diploma Project; an accountability framework that recognizes
ambitious but achievable goals; stronger professional development offerings funded in many cases
through districts’ Race to the Top plans; and continued state financial investment in K-12 education

4
despite a challenging budget climate. We also believe teacher evaluation has played an important role in
our student achievement gains as administrators have specifically cited its role in improving instruction.
In all areas of education reform, Tennessee’s focus must be on continuous improvement. While we have
made significant progress over the last several years, we have a long way to go to serve all students at a
high level. We view teacher evaluation through the same lens as all of our work: we must measure and
improve every year.
Observation Results
Teacher observation results from year one are encouraging and demonstrate more meaningful
differentiation than ever before. However, they also indicate that as a state, we must more accurately
and consistently reflect the true spectrum of teacher performance. While there was concern among
educators in the early stages of training and implementation that few teachers would receive
observation scores demonstrating performance exceeding expectations, results show that more than 75
percent of teachers scored a 4 or a 5 (scores demonstrating performance exceeding expectation) with
less than 2.5 percent scoring a 1 or 2 (scores demonstrating performance below expectations). While
these scores dispel the myth that teachers cannot receive high scores on the observation rubric, when
considered alongside student achievement results, they demand reflection and thoughtful
consideration. For example, while scores for teachers exceeding expectations on observations were
aligned with those receiving scores of 4 or 5 based on student achievement growth, this same alignment
did not occur for those teachers performing at the lowest levels in terms of student outcomes.
This variation is crucial to analyze and address as it translates into districts ignoring our most struggling
teachers and not providing the appropriate feedback educators need to improve their performance and,
ultimately, student outcomes.
Framework for Recommendations
In reviewing student outcomes and teacher evaluation results from year one and considering potential
changes to the evaluation system, we have focused on striking the appropriate balance between
competing realities across a number of different areas:
Most schools and districts made significant academic progress in 2011-12, leading to tens of
thousands of additional students performing at or above grade level. Still, there is enormous
differentiation in performance between districts, even when controlling for demographic and
other variables.
Most teachers in Tennessee are performing at a high level as measured by their impact on
student achievement. The majority of teachers in the state are not simply adequate, but exceed
expectations against high standards. At the same time, one in six teachers falls significantly short
of expectations in advancing student learning.
District and school administrators spent considerable time in evaluation training demonstrating
an understanding of the different levels of performance for observations, and all evaluators
passed a test demonstrating this understanding. However, in implementation, observers
systematically failed to identify the lowest performing teachers, leaving these teachers without
5
access to meaningful professional development and leaving their students and parents without
a reasonable expectation of improved instruction in the future.
It is important to grapple with these dichotomies in considering changes to the evaluation model. Our
goal is to recommend a set of improvements that will increase fairness and efficiency, heighten
professional development, and build on the rich instructional conversations from the past year. At the
same time, we must not lose track of the need to provide honest assessments of performance that
differentiate between our highest performing teachers and their lower performing peers. Absent this
level of accurate differentiation, districts and schools cannot appropriately tailor professional
development and risk missing opportunities to improve performance over time. Our recommendations
for improving the design and implementation of the evaluation system fall into the following four
categories:
I. Measurement of the quantitative impact on student performance. This includes an examination
of both the 35 percent of evaluation scores driven by TVAAS and the 15 percent achievement
measure selected by teachers and principals. In particular, we must ensure that as many
teachers as possible have effective means of measuring impact on students, and we must
consider what additional weight the quantitative portion of the evaluation should be given for
teachers who do not have access to individual metrics.
II. Changes to the qualitative rubric. This area focuses on ways to maintain the many pieces of the
rubric that allow teachers and administrators to have strong discussions about instruction, while
streamlining areas that were redundant or less effective in facilitating conversations.
III. Increases in process efficiencies. We want to ensure that administrators are spending their time
on observations and on feedback conversations, not on entering data into systems. Additionally,
administrators should spend time with the teachers who need the most help.
IV. Management of district implementation. We must ensure that districts apply the evaluation
system fairly, while still allowing for significant local innovation. We must also ensure that
districts provide robust feedback and professional development to teachers who currently lack
the skills to advance student achievement effectively.
Recommendations
I. Measurement of the quantitative impact on student performance (all evaluation models)
1. The state should ensure that additional teachers have access to an individual value-added growth
measure, while maintaining the principle that assessments should only be added when they will
benefit student performance and should not be added for the sole purpose of measuring
teachers. Responsible party: Department of Education.
2. The prohibition on including students with disabilities in calculating an individual teacher’s value-
added score should be removed. This prohibition prevents accurate measurement of special
education teachers, does not align with the state’s goal of improving outcomes for all students,
and is based on the statistically inaccurate presumption that students with disabilities will harm
teacher effect scores. Responsible party: General Assembly.

6
3. Teachers who do not have access to individual value-added scores should continue to have a
portion of their evaluation come from school-wide value-added scores given the positive impact
on academic standards this year. However, that portion should be reduced from 35 percent to a
lower threshold. Responsible party: General Assembly.
4. School-wide value-added scores should be based on a one-year score rather than a three-year
score. While it makes sense, where possible, to use three-year averages for individuals because
of smaller sample sizes, school-wide scores can and should be based on one-year data.
Responsible party: Department of Education.
5. Teachers with individual value-added scores who receive a 4 or 5 on TVAAS should be allowed to
use that score to count for 100 percent of their total evaluation score. Because the TVAAS score
comes at the end of the year, these teachers would still receive feedback from observations
during the year. Responsible party: General Assembly.
6. The options available for the 15 percent achievement portion of the evaluation scores should be
significantly limited, prioritizing options that can be calculated prior to the start of the following
school year and ensuring that the options provide legitimate measures of impact on
achievement. After one year, the General Assembly should revisit the 15 percent measure and
consider removing this as a factor in evaluations if the measure does not align with student
outcomes. Responsible parties: State Board of Education & General Assembly.
II. Changes to the qualitative rubric (TEAM model)
1. The instructional components of the rubric should be left largely intact to build on successful
implementation and to increase educator familiarity with the rubric. The department should
undergo a careful examination during the coming year to determine if there are ways to
streamline the rubric further for 2013-14. Responsible party: Department of Education.
2. The state should continue to train evaluators to use the rubric holistically and should provide
professional development to ensure that teachers and evaluators understand that the rubric
should not be viewed as a checklist. Responsible party: Department of Education.
3. The state should provide access to additional examples of performance levels for teachers
through increased video libraries, sample lessons, and through facilitation of peer-to-peer
observations. Responsible party: Department of Education.
4. The professionalism component of the rubric should be significantly reduced and streamlined.
There are redundancies in the rubric and significant grade inflation led to artificial inflation in
overall scores. Responsible parties: State Board of Education & Department of Education.
5. The state should explore the use and funding of student surveys and pilot programs to use video
scoring of observations at district discretion. Each of these areas has shown significant promise in
national pilots and we should encourage their use in Tennessee. Responsible party: Department
of Education.

7
III. Increases in process efficiencies (all evaluation models)
1. Teachers who receive a 5 on either their overall evaluation score or on their individual TVAAS
score should have a more streamlined evaluation process the following year. This process should
include one full-length observation and two additional short, unscheduled visits with limited
paperwork. Responsible parties: State Board of Education & Department of Education.
2. Teachers who receive a 1 on either their overall evaluation score or on their individual TVAAS
score should have additional, unannounced, full-length observations with feedback to ensure
they receive professional development to improve. Because many evaluators systematically
failed to identify the lowest-performing teachers in 2011-12, it is critical that this policy include
teachers who receive a 1 on the individual TVAAS score, meaning that students in their classes
advanced significantly less than would be expected. Responsible parties: State Board of
Education & Department of Education.
3. The evaluation data system should continue to be measured and streamlined to increase
efficiencies, reduce time and paperwork on school districts, and allow for increased functionality.
Responsible party: Department of Education.
IV. Management of district implementation (all evaluation models)
1. Currently, under the provisions of State Board of Education’s Teacher and Principal Evaluation
Policy 5.201, districts that have a significant variance between value-added scores and
observation scores can lose their right to implement alternative evaluation models and can be
subject to more intensive state monitoring. The board, with the assistance of the department,
should more clearly define what this means. As part of this intervention, evaluators with
observation scores that deviate significantly from the quantitative scores should have their
certification as evaluators re-evaluated and be required to attend re-certification classes.
Responsible parties: State Board of Education & Department of Education.
2. The state should utilize its eight Centers of Regional Excellence (Field Service Centers) to provide
district and school leaders with increased access to professional development in areas of high
need of evaluation implementation. Responsible party: Department of Education.
From the outset of the 2011-12 school year, the Department of Education committed to listen to
stakeholders, gather feedback, collect data, measure outcomes, and build a continuous improvement
process that ensures that the state evaluation model improves every year. We take that responsibility
seriously. This report contains significant data and feedback that have helped guide our
recommendations. We believe the recommended changes will improve upon our effective evaluation
model and lead to even stronger student outcomes.
The evidence is clear that students in Tennessee are learning more than ever before. At the same time,
fully half of Tennessee children fail to meet state standards. There is more work to be done. With the
help of the General Assembly, State Board of Education, districts, schools, and educators, we remain
committed to the challenging work of building an exceptional public education system for all of our
students.
8
Introduction
Tennessee has set an ambitious goal: we seek to be the fastest improving state in the nation when it
comes to student achievement. In our winning Race to the Top application, made possible through the
bipartisan adoption of the Tennessee First to the Top Act, we articulated a compelling and bold vision
for education in Tennessee and set challenging but achievable goals. Attainment of these goals will
dramatically change the trajectory of our education system and improve upon the life prospects of
students and families.
As part of our winning Race to the Top effort as well as our strategic plan for education, Tennessee
committed to expand student access to effective teachers and leaders by implementing a
comprehensive, student outcomes-based, statewide educator evaluation system—a system where
every teacher is evaluated every year and provided with constructive feedback for improvement. All
students deserve a high quality teacher in the classroom and all teachers deserve appropriate feedback
to assist them in making this goal a reality.
There is no perfect teacher evaluation system. However, as a state, we simply cannot afford to continue
the status quo or let the perfect be the enemy of the good. As highlighted in this report, the bold steps
Tennessee has taken, including the implementation of teacher evaluation, are working. Student
achievement is increasing and more students than ever are reaching or exceeding proficiency levels in
key subjects. That said, we are committed to seeking feedback and making adjustments every year to
improve the effectiveness of our teacher evaluation system. The information, considerations and
recommendations contained in this report are a reflection of that commitment and represent a wealth
of feedback and learning from year one of implementation.

9
Evaluation Overview
Tennessee’s new teacher evaluation system is based on multiple measures, including classroom
observations (50 percent), student achievement (15 percent) and student growth data /TVAAS (35
percent), and every teacher is evaluated regardless of years of service or tenure status. Evaluation
scoring differentiates teachers into five effectiveness levels with the breakdown as follows: 1:
Significantly Below Expectations; 2: Below Expectations; 3: Meets Expectations; 4: Above Expectations;
and 5: Significantly Above Expectations. All teachers receive feedback based on the evaluator’s
observations and, ultimately, the evaluations are designed to inform personnel decisions, including,
perhaps most importantly, professional development and assistance to improve the effectiveness of the
teacher.
Classroom observations are scored using a rubric that outlines clear expectations of high-quality
instruction, planning, classroom environment and professionalism. Teachers with a professional license
are observed four times annually with two 15-minute observations and two lesson-length observations.
Teachers with an apprentice license are observed six times annually with three 15-minute observations
and three lesson-length observations. [Note: In November 2011, the State Board of Education approved
a flexibility provision that gives the option for the observation of two domains (planning and instruction
or environment and instruction) in a single classroom visit.] The observations are equally distributed
across the two semesters, and at least half must be unannounced.
The state TEAM rubric is modeled after the National Institute for Excellence in Teaching’s (NIET)
evaluation model. The rubric is based on research and best practices from multiple sources. NIET
studied and reviewed instructional guidelines and standards developed by numerous national and state
teacher standard organizations and developed a comprehensive set of standards represented in the
rubric.

10
Feedback I. Process
Beginning in spring 2010 with the Tennessee Evaluation Advisory Committee’s (TEAC) charge and
subsequent policy recommendations, the Tennessee Department of Education committed to ensuring
that teachers, leaders and stakeholders have a voice in the design, implementation and ongoing
improvement of the Tennessee Educator Acceleration Model (TEAM). As noted in the executive
summary, the system was designed through a collaborative effort that included teachers, principals,
community leaders, and national experts. Thousands of educators participated in a field-testing process,
using the new model, providing feedback and ultimately contributing to many of the final design
decisions.
As implementation began during the 2011-12 school year, it was clear that there were communication
challenges. Communication capacity varied greatly by district, teachers often did not know who to turn
to with questions, and school leaders struggled to find the support and guidance needed to navigate the
early stages of implementation. In light of these challenges, legislators and others tasked the
department to develop a more centralized communication strategy to address these needs. We
responded with a renewed sense of urgency and significantly increased our efforts to communicate with
educators. As such, the department also dedicated significant time and resources during year one to
learning from educators’ on the-ground experiences with TEAM in order to determine the effectiveness
of the system, as well as areas in need of revision.
We have numerous sources of feedback, including department structures, surveys and interviews
conducted by TNCRED, a report by SCORE, and student achievement and teacher evaluation results.
Each of these is described in further detail below.
Department Feedback Gathering
From the first stages of implementation, the department has gathered feedback on TEAM with an eye
toward improving the system for all teachers. To this end, the department has offered multiple
opportunities and methods for educators and stakeholders to provide input regarding TEAM—what’s
working and what needs to be improved. This is a broad, collective effort and stakeholders have played
a critical role over the past year in offering suggestions for refinement. This feedback loop and model of
continuous improvement will continue into the coming months and years as we work to make the
system even better. Through intentional, ongoing efforts to facilitate collaboration and solicit input, the
department has learned a great deal about TEAM’s effectiveness in helping teachers improve instruction
and increase student achievement, and this learning will continue.
To date, the department has met with more than 7,500 educators as part of this system of continuous
feedback and received direct input from thousands more through surveys, stakeholder meetings and
email communication. In addition, Commissioner Huffman has personally visited more than 100 districts
to talk to school leaders and educators about teacher evaluation implementation.

11
A. Educator and stakeholder meetings
The department has held numerous meetings with educators and stakeholders throughout the
year to gather feedback on the evaluation model. These have included regular, on-going work
with superintendent, supervisor, and principal study councils. These meetings have also
included teachers and some have additionally included students and parents. Including the on-
going engagement with study councils, educators and stakeholders were convened over 120
times across the state: 41 times in the West grand division—eight teacher groups, 18 supervisor
groups, and 15 principal groups; 40 times in the Middle grand division—five teacher groups, 18
supervisor groups, and 17 principal groups; and 38 times in the East grand division—six teacher
groups, 17 supervisor groups, and 15 principal groups.
B. Directors of Schools
The department has also made it a priority to solicit feedback on design and implementation
specifically from directors of schools. Department staff members have met with directors more
than 200 times since September. Additionally, Commissioner Huffman has met with directors to
discuss evaluations throughout the year. In these meetings, directors provided specific input on
the implementation of TEAM in their districts. Furthermore, the commissioner and department
leadership have held monthly meetings with the Executive Committee of the Superintendents’
Study Council with TEAM as a standing agenda item. TEAM was also a primary focus at last
September’s CEO conference in Gatlinburg. This provided superintendents with the chance to
ask questions, provide feedback and to get more information at a critical point in year one
implementation.
C. Regional Consultants
As part of the department’s effort to support implementation at the school and district level,
nine regional consultants were hired to work directly with teachers and leaders. These
individuals were Tennessee educators, all of whom were selected in part because of a track
record of success with educators and students. Consultants worked regionally and were charged
with helping their designated districts with various aspects of TEAM implementation throughout
the year. Consultants collected and reported feedback to the department. Through this regular,
on-the-ground collaboration with districts and schools, the consultants were able to provide
important, real-time information that helped guide implementation decisions and facilitate
additional support efforts when needed.
D. Specific Educator Groups
The department convened educator groups from specific content areas to provide feedback on
both the observation instrument as well as student growth measures. Based on the feedback
provided, educator groups worked with department staff to create guidance documents to
12
inform classroom observations of specific groups. Additionally, these groups continued the
department’s ongoing effort to identify growth-based measures for educators in non-tested
grades and subjects. Their input has been instrumental in the work to approve additional growth
measures for the coming 2012-13 school year. In some cases where individual growth measures
are not yet feasible, these groups have also discussed the possibility of applying greater weight
on the qualitative portion of a select set of educators’ evaluation scores.
E. E-mail Questions & Communications
The evaluation team implemented two key methods for answering questions and collecting
feedback. [email protected] is an email address to which any educator can send a
question about the evaluation system and receive a response within 24 hours. To date, the team
has answered over 6,500 questions, with a 98 percent response rate within 24 hours.
Additionally, [email protected] is an email address to which any educator can send
feedback regarding the evaluation system. At the time of this publication, more than 1,000
educators have sent feedback to the department.
F. General Assembly
In addition to its work with educators, the department worked closely with the General
Assembly to ensure an open line of communication during year one of implementation. This
entailed frequent meetings with individual legislators, as well as formal presentations to the
House and Senate Education Committees during fall 2011 and spring 2012. We have also
presented quarterly updates on implementation to the Joint Government Operations
Committee in an effort to keep all stakeholders informed about key issues related to
implementation. In addition, pursuant to House Joint Resolution (HJR) 520, adopted by the
General Assembly during the 2012 session, the department provided an interim report on
teacher evaluation to the House and Senate Education Committees on April 15.
Tennessee Consortium on Research, Evaluation and Development
As part of Tennessee’s Race to the Top grant, the Tennessee Consortium on Research, Evaluation and
Development (TNCRED) is responsible for carrying out a detailed, focused program of research. In
collaboration with researchers and practitioners from across Tennessee and the nation, the consortium
leads and engages in research studies, program and policy evaluations, and subsequent development
activities to promote results-oriented decision-making. TNCRED researchers and its partners also work
to disseminate lessons learned, inform policies, programs and practices with research-based evidence,
and help build Tennessee’s research capacity. As part of their participation in Race to the Top, all of
Tennessee’s school districts have agreed to participate in TNCRED’s research.
While TNCRED is charged with evaluating numerous key initiatives under the state’s First to the Top
plan, ongoing review and analysis of teacher and principal evaluation systems is a top priority. This
includes review of all four new evaluation models: 1) TEAM; 2) Teacher Instructional Growth for
13
Effectiveness and Results (TIGER) in use in 12 mostly municipal and special school districts; 3) Project
Coach in use in Hamilton County; and 4) Teacher Effectiveness Measure (TEM) in use in Memphis. As
such, during the 2011-12 school year, TNCRED researchers provided educators across the state with
opportunities to share their experiences, perceptions, and recommendations regarding teacher and
principal evaluation. These opportunities have included a comprehensive survey for Tennessee
educators as well as interviews with principals and district evaluators regarding evaluation of both
principals and teachers.
Interviews were conducted by phone with 42 district evaluators and school-based administrators
between March 19 and March 30. Additionally, TNCRED launched teacher and administrator surveys to
over 70,000 educators in the spring of 2012. More than 16,000 teachers and non-administrators and
nearly 1,000 administrators responded. This information will contribute to the continuous improvement
of all evaluation models.
State Collaborative on Reforming Education (SCORE) Report
At the request of Governor Haslam, in December 2011, SCORE initiated a formal statewide listening and
feedback process, independent of state government, on Tennessee’s teacher evaluation system. As part
of the process, Governor Haslam asked SCORE to produce a report to the State Board of Education and
Department of Education that would reflect feedback from across the state and propose a range of
policy considerations for refining Tennessee’s teacher evaluation system moving forward.
SCORE’s role in this process was to listen. SCORE collected feedback from stakeholders across the state
including teachers, principals, superintendents, parents, local and state officials, community and
business leaders, and other citizens. To gather feedback, SCORE conducted nine regional roundtables,
which were open to the public, from February through the beginning of April. Additionally, SCORE
conducted an on-line questionnaire for teachers and administrators to collect feedback on their
experiences with TEAM implementation and received responses from more than 15,000 teachers, 900
principals and 800 other evaluators. SCORE also conducted in-depth interviews with school leaders
across the state and nation, including educators overseeing all four approved models currently approved
for use in Tennessee. Finally, SCORE formed an Educator Work Team comprised of 22 teachers,
principals, and district leaders from across the state and received additional feedback from existing
networks of teachers, principals, district leaders and numerous other educators and stakeholders.
On June 11, SCORE reported their findings to the State Board of Education and the department. The
information gleaned from SCORE’s findings has been a valuable tool to the department and will drive
further improvements to the TEAM evaluation model.
Student achievement and teacher observation results
Perhaps the most important piece of feedback is the overlay of three critical pieces of data: 1) the
results of the state’s annual student assessments; 2) the TVAAS scores of teachers and schools; and 3)
the observation scores of teachers. This data represents thousands of pieces of information that help
14
show the overall accuracy and impact of the evaluation system. A detailed analysis of these results is
provided in the next section of this report.
II. Findings
Feedback from educators and key stakeholders during year one has been tremendously valuable.
Though this feedback has taken many forms, one thing has remained constant throughout this
process—the comments and opinions of the state’s educators have been a driving force in the
continuous improvement of the state’s evaluation process. By continuously seeking feedback, the
department, along with TNCRED and SCORE, has worked to facilitate conversations centered on
improving and adapting the evaluation system.
This collective input gave impetus for mid-year adjustments and also highlighted areas for additional
consideration as we move forward. This feedback has directly informed proposed changes to the system
for next year as outlined in the Recommendations and Considerations section of this report.
Through the department’s feedback gathering process, TNCRED’s research and analysis, and the SCORE
report, common themes have emerged:
The TEAM rubric represents high-quality instruction and facilitates productive conversation
about improving instruction between teachers and administrators.
Some educators have been confused about how to appropriately use the rubric. The quality of
training had a major impact on understanding of the rubric and how to use it.
While administrators believe the use of school-wide scores has led to increased collaboration
among teachers, teachers in subjects and grades that do not yield an individual value-added
score do not believe 35 percent of their evaluation should be determined by school-wide scores.
Implementation of the 15 percent measure needs adjustment for accuracy and timeliness.
Administrators consistently noted time challenges in completing the evaluation process and
support additional flexibility.
Evaluators were effective in identifying high-performing teachers but systematically failed to
identify the lowest performing teachers.
Communication is critical in increasing understanding and confidence in the system.
Capacity to facilitate development is highly variable across districts.
These themes are apparent in the feedback gathered through department mechanisms, the TNCRED
survey and interview findings as well as the SCORE report.
Findings from department feedback and assessment results
High-quality instruction
The department received feedback on an ongoing basis about the policy of evaluating every
teacher, every year. Many educators expressed appreciation regarding the observation of every
teacher multiple times a year, as it provided a more accurate picture of how teachers were
performing and what additional support might be needed. Some educators expressed the belief,
15
however, that high-performing teachers might not need to be observed as often as struggling
teachers.
On the whole, educators and stakeholders agreed that all teachers deserve regular, meaningful
feedback on their instruction. Teachers need successful practices to be reinforced.
Administrators learned more about the successful practices happening within their schools,
allowing them to better support struggling teachers because they had concrete examples and
resources to point them to. Additionally, the TEAM rubric is intentionally designed so that all
teachers have room to grow and improve their craft. It is important for even high performing
teachers to be observed every year in order to grow and develop further and also to allow
districts to learn from their instructional methods.
While the new evaluation model does require administrators spend additional time in the
classroom as compared to past policies and practices, most agree that time spent in a classroom
is extremely valuable. Administrators and teachers alike have commented throughout the year
that one of the greatest benefits of the new evaluation model is the rich conversations about
instruction that result from classroom observations. These conversations are focused on specific
teaching practices and facilitated by the rubric and regularity of observations required under the
new system.
Rubric and training
During the summer of 2011, the department, in conjunction with the National Institute for
Excellence in Teaching (NIET) trained and certified over 5,000 evaluators on the TEAM model.
This training enabled evaluators to conduct observations during the 2011-12 school year.
Feedback from the training highlighted positive elements, such as the focus on inter-rater
reliability among evaluators, including the effort to norm evaluators across indicators on the
rubric to national scorers. Evaluators generally felt confident in their ability to go into a
classroom and conduct observations of teachers. Despite their relative confidence in scoring,
the department and others heard repeatedly that evaluators were getting the message that
teachers could not score a 4 or 5 on the rubric. The department quickly took steps to clarify that
this message was incorrect, and results from year one clearly illustrate that the accurate
information was received.
Initially, many evaluators articulated that they went into the school year unsure of all the
timelines and process points, especially where the quantitative measures were concerned.
Administrators expressed a belief that the school services personnel rubric was necessary, but
lack of norming on the rubric and training on how to observe such personnel made its use
difficult. Educators also called for a streamlining of the professionalism component of the rubric,
citing redundancies and expressed desire for more examples of highly effective instruction and
lesson planning.
In addition, administrators and teachers believe many educators have treated the rubric as a
checklist rather than viewing it as intended, which is as a holistic representation of an effective
16
lesson, taking into consideration student response and the intent of the indicator. Currently
indicators and definitions are provided at levels 5, 3, and 1. Some educators advocate for adding
indicators and definitions for levels 2 and 4, rather than deferring to the evaluator’s professional
judgment. These two common points of feedback are somewhat in tension; creating additional
indicators may lead to less professional judgment on the part of the evaluator and more of a
checklist approach.
Furthermore, while evaluators largely felt prepared to conduct observations, the distribution of
observation scores and their relationship to value-added scores indicate that evaluators do an
excellent job of identifying high performing teachers but a much less effective job of identifying
the lowest performers.
School-wide or system-wide data
Tennessee law requires 35 percent of the evaluation criteria to be student achievement data
based on student growth data as represented by the Tennessee Value-Added Assessment
System (TVAAS) or some other comparable measure of student growth, if no such TVAAS data is
available. For this school year, teachers who taught in tested grades and subjects used their
individual value added score as their 35 percent measure. This score is calculated using the TCAP
and/or End of Course (EOC) student growth results of an individual teacher’s students. Teachers
who were in non-tested grades and subjects received a school-wide or system-wide value added
score. There were four composite options for school-wide value added scores during this year:
1) School-wide overall: includes all tested courses at the school
2) School-wide numeracy: includes all state math tested courses at the school
3) School-wide literacy: includes all state English tested courses at the school
4) School-wide numeracy/literacy: includes all math and English tested courses at the school
School leaders consistently expressed that use of school-wide value-added scores, while not the
ultimate solution for some groups of educators, has increased collaboration among teachers
and led to a higher emphasis on academic standards in all subjects. Though the department
continues to work with educator groups to identify and develop additional individual growth
measures for teachers in currently non-tested areas and grades, this heightened sense of shared
responsibility and interdisciplinary collaboration is important to note and build upon in coming
years.
With that said, teachers in subjects and grades that do not yield an individual value-added score
consistently noted that having 35 percent of their score based on school-wide data is not
reflective of their performance. Most educators support the development of individual
assessments or, in the alternative, believe the weight of school-wide data in their evaluation
should be decreased.
One educator group—special education teachers—currently has available value added data but
state law prohibits its use in evaluation. The Advisory Council for the Education of Students with
Disabilities has recommended amending the law to remove the prohibition.
17
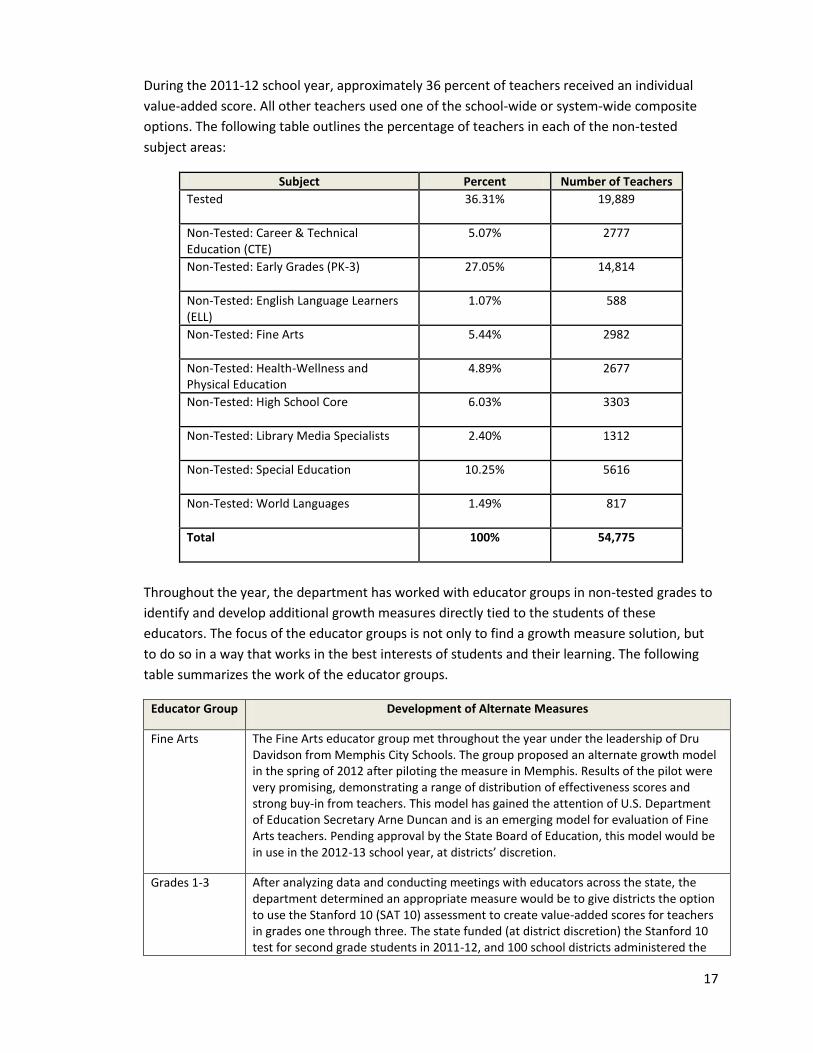
During the 2011-12 school year, approximately 36 percent of teachers received an individual
value-added score. All other teachers used one of the school-wide or system-wide composite
options. The following table outlines the percentage of teachers in each of the non-tested
subject areas:
Subject Percent Number of Teachers
Tested
36.31% 19,889
Non-Tested: Career & Technical Education (CTE)
5.07% 2777
Non-Tested: Early Grades (PK-3)
27.05% 14,814
Non-Tested: English Language Learners (ELL)
1.07% 588
Non-Tested: Fine Arts
5.44% 2982
Non-Tested: Health-Wellness and Physical Education
4.89% 2677
Non-Tested: High School Core
6.03% 3303
Non-Tested: Library Media Specialists 2.40% 1312
Non-Tested: Special Education
10.25% 5616
Non-Tested: World Languages
1.49% 817
Total
100% 54,775
Throughout the year, the department has worked with educator groups in non-tested grades to
identify and develop additional growth measures directly tied to the students of these
educators. The focus of the educator groups is not only to find a growth measure solution, but
to do so in a way that works in the best interests of students and their learning. The following
table summarizes the work of the educator groups.
Educator Group Development of Alternate Measures
Fine Arts The Fine Arts educator group met throughout the year under the leadership of Dru Davidson from Memphis City Schools. The group proposed an alternate growth model in the spring of 2012 after piloting the measure in Memphis. Results of the pilot were very promising, demonstrating a range of distribution of effectiveness scores and strong buy-in from teachers. This model has gained the attention of U.S. Department of Education Secretary Arne Duncan and is an emerging model for evaluation of Fine Arts teachers. Pending approval by the State Board of Education, this model would be in use in the 2012-13 school year, at districts’ discretion.
Grades 1-3 After analyzing data and conducting meetings with educators across the state, the department determined an appropriate measure would be to give districts the option to use the Stanford 10 (SAT 10) assessment to create value-added scores for teachers in grades one through three. The state funded (at district discretion) the Stanford 10 test for second grade students in 2011-12, and 100 school districts administered the
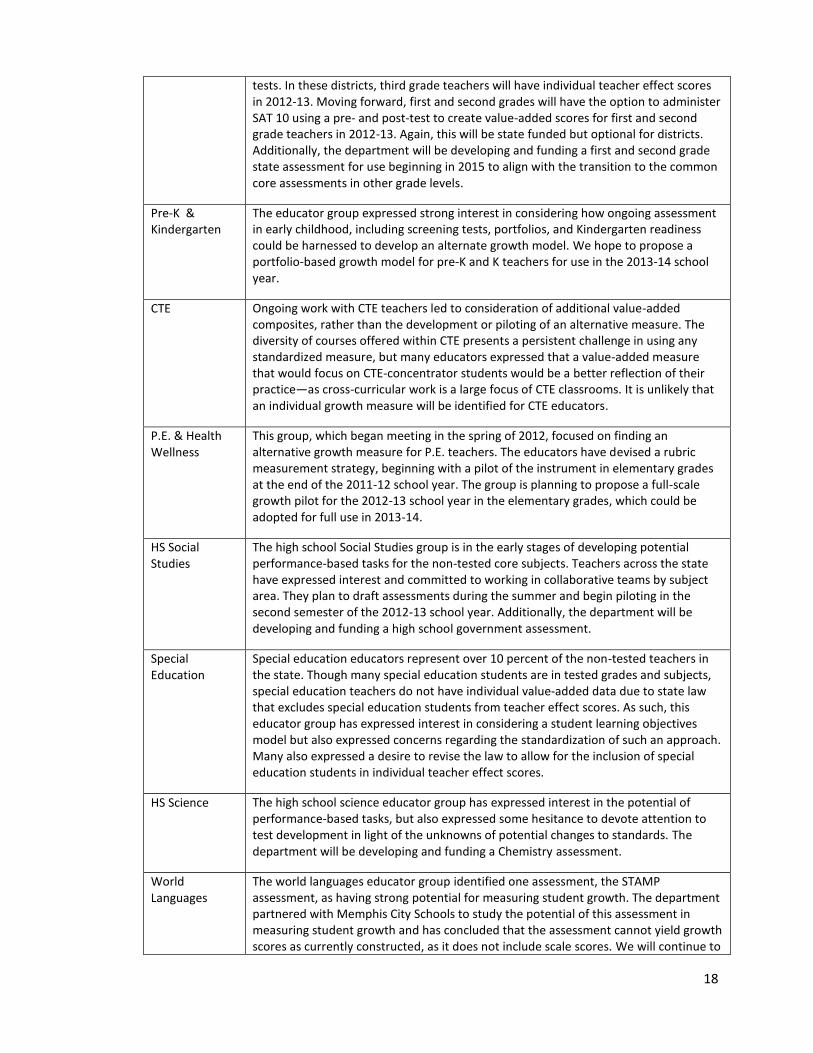
18
tests. In these districts, third grade teachers will have individual teacher effect scores in 2012-13. Moving forward, first and second grades will have the option to administer SAT 10 using a pre- and post-test to create value-added scores for first and second grade teachers in 2012-13. Again, this will be state funded but optional for districts. Additionally, the department will be developing and funding a first and second grade state assessment for use beginning in 2015 to align with the transition to the common core assessments in other grade levels.
Pre-K & Kindergarten
The educator group expressed strong interest in considering how ongoing assessment in early childhood, including screening tests, portfolios, and Kindergarten readiness could be harnessed to develop an alternate growth model. We hope to propose a portfolio-based growth model for pre-K and K teachers for use in the 2013-14 school year.
CTE Ongoing work with CTE teachers led to consideration of additional value-added composites, rather than the development or piloting of an alternative measure. The diversity of courses offered within CTE presents a persistent challenge in using any standardized measure, but many educators expressed that a value-added measure that would focus on CTE-concentrator students would be a better reflection of their practice—as cross-curricular work is a large focus of CTE classrooms. It is unlikely that an individual growth measure will be identified for CTE educators.
P.E. & Health Wellness
This group, which began meeting in the spring of 2012, focused on finding an alternative growth measure for P.E. teachers. The educators have devised a rubric measurement strategy, beginning with a pilot of the instrument in elementary grades at the end of the 2011-12 school year. The group is planning to propose a full-scale growth pilot for the 2012-13 school year in the elementary grades, which could be adopted for full use in 2013-14.
HS Social Studies
The high school Social Studies group is in the early stages of developing potential performance-based tasks for the non-tested core subjects. Teachers across the state have expressed interest and committed to working in collaborative teams by subject area. They plan to draft assessments during the summer and begin piloting in the second semester of the 2012-13 school year. Additionally, the department will be developing and funding a high school government assessment.
Special Education
Special education educators represent over 10 percent of the non-tested teachers in the state. Though many special education students are in tested grades and subjects, special education teachers do not have individual value-added data due to state law that excludes special education students from teacher effect scores. As such, this educator group has expressed interest in considering a student learning objectives model but also expressed concerns regarding the standardization of such an approach. Many also expressed a desire to revise the law to allow for the inclusion of special education students in individual teacher effect scores.
HS Science The high school science educator group has expressed interest in the potential of performance-based tasks, but also expressed some hesitance to devote attention to test development in light of the unknowns of potential changes to standards. The department will be developing and funding a Chemistry assessment.
World Languages
The world languages educator group identified one assessment, the STAMP assessment, as having strong potential for measuring student growth. The department partnered with Memphis City Schools to study the potential of this assessment in measuring student growth and has concluded that the assessment cannot yield growth scores as currently constructed, as it does not include scale scores. We will continue to

19
work with educator groups and other states over the coming year in an effort to develop appropriate individual growth measures.
Value-added data vs. observations
As outlined in the next section of this report, teacher evaluation results from Year 1 show that
districts have not accurately and consistently reflected the true spectrum of teacher
performance. While observation scores generally aligned for teachers who scored 4s or 5s on
value-added based on their growth in student achievement results, this same alignment did not
occur for those teachers performing at the lowest levels in terms of student outcomes.
On a related note, some educators expressed a concern that unorthodox but ultimately
effective instructional methods could lead to lower evaluation scores due to evaluators
providing low scores on observations. This concern was reflected in legislation introduced during
the 2012 legislation session—SB 2165 by Senators Mike Faulk, Brian Kelsey, and Ken Yager and
HB 2666 by Representative Jeremy Faison. These teachers and legislators expressed the position
that increased student achievement beyond expected levels should account for a higher
percentage of their overall evaluation score since these scores represent objective data.
15 percent achievement measure
Fifteen percent of a teacher’s evaluation is based on an achievement measure selected by the
teacher in conjunction with the evaluator. The spirit of the 15 percent measure is for the
teacher to select an achievement goal at the beginning of the year, aligned to the teacher’s job
responsibilities, and work toward that goal throughout the year. The following table outlines the
15 percent achievement categories currently approved by the State Board of Education and the
number of teachers who selected each option:
15% Achievement Measure Choice Percent Selecting Measure
State Assessments (TCAP & EOC) 38.4%
School-Wide TVAAS 25.9%
Off-the-shelf Assessments 12.7%
Graduation Rate/CTE Concentrator Graduation Rate 11.1%
ACT/SAT 5.4%
9th Grade Promotion Rate to 10th Grade/9th Grade Retention Rate
4.2%
Completion/Success in Advanced Coursework, Including Dual Credit and Dual Enrollment
1.9%

20
AP/IB/NIC 0.3%
Post-Secondary Placement 0.0%
A review of year one data poses two challenges to the 15 percent measure and the menu of
options. First, choices are too often dictated by teacher and principal perceptions of which
measure will generate the highest score rather than provide an accurate reflection of
achievement. For example, a review of available year one data shows 65 percent of teachers
received a score of 5 for their 15 percent measure—a level not reflected by actual student
achievement.
Secondly, results for some of the 15 percent options will not be available until well into the next
school year. This is particularly problematic given efforts by the state to significantly speed up
the return of TVAAS scores. The 2010-11 scores were returned to teachers in October 2011. By
contract, the department returned this year’s scores on June 15, 2012.
Time challenges
During the beginning of the 2011-12 school year, the department received considerable
feedback about the time administrators were spending conducting observations. While time
required by teachers actually has been reduced from the state’s previous evaluation system1, on
the whole, feedback indicated that for administrators, the amount of time spent to implement
TEAM was unmanageable. Based on this feedback, the department recommended a policy
change to the State Board of Education in November 2011, which would allow administrators to
combine two observations during one classroom visit. This combination was created based on
the findings of a principal time study that the department conducted to see how much time
observations were taking. The combination of observations reduced the amount of time
administrators had to spend scheduling and conducting pre- and post-conferences, in addition
to the time spent observing teachers. Administrators across the state applauded this policy
change and noted time savings were seen as a result.
A second highlight from the time study was that the ratio of teachers to evaluators across the
state ranged from 9:1 to 36:1. While there are some uncontrollable factors in districts that put
the ratio on the higher end, many districts were able to lower the ratio by having additional
personnel certified as evaluators. Some districts used available resources through Race to the
Top to hire additional support to conduct observations. Others used peer observers when
conducting observations. Though there is hesitation in some districts to use peer observers, the
information received by the department is that peer observers are consistent in their scoring
and often provide valuable content-specific feedback.
1 Though some districts have chosen to require lesson plans more frequently from teachers, this is a district decision, not a
state requirement. The only paper work required by teachers in the current system is the one lesson plan associated with the planning domain observation.
21
Also related to the issue of time demands, administrators consistently noted that they would
prefer to spend less time with their most effective teachers and more time with their less
effective teachers. In addition, school leaders support improvements to the state’s teacher
evaluation data system to reduce time and paperwork and allow for increased functionality.
Administrators reported throughout the 2011-12 school year that the data system, while easy to
understand and navigate, was not efficient. The department is cognizant of the need to further
refine our evaluation data system and plans are underway to do this for the 2012-13 school
year.
Flexibility
A common point of feedback from school leaders is that they desire flexibility in the evaluation
system. In response to a direct appeal by districts to exercise additional control over
implementation and to promote district ownership, the department developed and offered
districts additional implementation flexibility within the current policy requirements. This
flexibility allows districts to innovate and make the model more applicable to their specific
needs and context.
In the spring of 2012, 42 school districts applied for flexibility under the TEAM model for the
coming 2012-13 school year. This flexibility allows districts to implement the evaluation model
in a way that best suits their local needs.
For example, Williamson County Schools and the Franklin Special School District applied for
flexibility by giving their principals three options for how they will conduct observations during
the school year. The options allow principals to determine whether they want to conduct
lesson-length observations and then score the indicators, or if they want to conduct walk-
throughs during each semester and score the appropriate indicators at the mid-point and end of
year. All principals will select which option they will use at the start of the year. Having this
option gives principals the flexibility to determine how to best utilize the evaluation system to
support and facilitate success for their teachers and students.
Student Surveys
Various research studies, as well as the SCORE report, identify the use of student surveys as an
evaluation component that districts should consider utilizing. The department also examined
surveys and the use of video technology through meetings with the Gates Foundation to analyze
its research and through conversations with the Memphis City Schools, which piloted student
surveys this year.
The Tripod student perceptions survey used in the Measures of Effective Teaching (MET) Project
conducted by the Gates Foundation presents an opportunity for students to reflect on their
classroom experiences. The survey asks student to provide feedback on three “legs” of quality
teaching: content, pedagogy, and relationships. The model emphasizes the importance of
whether students are being challenged and engaged by their teacher. The questions are
22
gathered under seven headings: Care, Control, Clarify, Challenge, Captivate, Confer, and
Consolidate and each of the C’s is measured using multiple survey items.
The results from the MET Project suggest that the student surveys would be a valuable
complement to other performance measures. Specifically, the research indicates that the
inclusion of student surveys to an existing evaluation model that includes observations and
value-added scores increases the predictive power of the evaluation. The predictive power of
surveys is identified as being strong since students see their teachers every day, throughout a
semester or school year. Additionally, teachers are more appropriately differentiated based on
student outcomes when student surveys are used. In the study, when teachers were evaluated
on only observation scores, the highest and lowest performing teachers were only differentiated
by 2.6 months of student learning. However, when surveys were also combined with
observations, the highest and lowest teachers were differentiated by 4.8 months of student
learning. The strongest differentiation was seen when value-added scores were included. In this
case, the highest and lowest performing teachers were differentiated by 7.6 months of student
learning. The difference of 7.6 months of learning is more predictive of the differences seen in
student outcomes. To learn more about student surveys or the MET Project, visit:
http://www.metproject.org/downloads/MET_Gathering_Feedback_Practioner_Brief.pdf
Video Technology
In addition to student surveys, the MET study also discusses the benefits of utilizing videotape
technology in classrooms so that observations can be conducted without the presence of an
observer in the classroom. The technology requires minimal set up, training, and maintenance
by teachers. To record lessons, the MET project used the panoramic camera to simultaneously
capture two views from a fixed position: a 360-degree perspective and a higher-resolution
stationary view of the classroom whiteboard. Microphones located on the camera and worn by
the teacher pick up the teacher’s voice and whole-group discussion.
The Teachscape technology used in the MET study makes the shift from traditional paper forms
to a technology-enabled observation process. Since this technology does not require the
presence of an observer, this is particularly helpful for districts with a low ratio of evaluators to
teachers. Additionally, various evaluators can look at the lesson to provide necessary feedback
to the teacher. Teachers often utilize the technology to self-reflect on their practice and identify
specific areas for improvement. To learn more about the benefits of video technology, visit:
http://www.metproject.org/downloads/MET_Gathering_Feedback_Practioner_Brief.pdf.
Linking Evaluation Results to Professional Development
Throughout the feedback gathering process, teachers and administrators regularly highlighted
the desire for evaluation results to drive professional development offerings. The department is
committed to ensuring that all educators have regular opportunities for targeted, high-quality
professional growth. In fact, this is the overarching aim of the evaluation system. All
professionals have areas that are strong and areas that are in need of further development. The
TEAM model attempts to capitalize on this universal reality by providing regular, individualized
23
feedback anchored in a robust instructional rubric and ambitious expectations for student
growth.
During the course of the coming 2012-13 school year, the department will work diligently to
support district and school implementation as well as to facilitate opportunities and resources
for ongoing, evaluation-driven teacher and leader development. This support will take a variety
of forms but will include additional tools and resources designed to both capitalize on areas of
identified strength as well as address identified areas of need.
One of the key means of implementation support will be through regionally deployed TEAM
coaches who will work to ensure schools have high-quality support for implementation
challenges. In collaboration with NIET, the department is in the process of hiring up to five full
and part time evaluation coaches for the 2012-13 school year. These coaches will be charged
with a host of duties, including close work with schools whose year-one scores were most out of
alignment and general professional development support for schools in their region. In addition,
the department is working with NIET to build out the TAP© portal to include more tools and
resources that tie directly to the rubric indicators. As part of this portal development, more
model lessons at the 4 and 5 levels will also be added. This is in response to feedback we heard
repeatedly from educators that called for more sample lessons at the high end of the
performance spectrum.
Furthermore, through competitive supplemental funds for evaluation-driven professional
development that have been awarded to a host of small districts throughout the state under
Race to the Top, we are learning more about what embedded, targeted development for
teachers looks like. These grants are being used to develop school-based models for ongoing,
individualized professional growth. Through the experiences of these districts we will be able to
share best practices and highlight success for other districts and schools across the state.
We believe that districts must take a high level of ownership for ongoing opportunities for
educator growth. Ultimately, districts and schools, not the state, deliver the vast majority of
professional development. At the same time, the department remains committed to facilitating
best practices and providing tools and resources to support this instrumental part of the
evaluation process.
Tennessee Consortium on Research, Evaluation and Development
Building on the 2011 Educator Evaluation Survey completed by participants in the state’s 2010-11
evaluation field test and findings from the 2011 First to the Top Survey, the second administration of
this annual survey by TNCRED was designed to better understand educators’ experiences with and
attitudes around design and implementation of TEAM, as well as the three alternative, state-approved
evaluation models.
The 2012 survey was administered on-line and solicited experiences and perceptions of TEAM and other
state-approved models from the perspective of individuals trained to conduct observations, such as

24
principals and assistant principals, as well as teachers and other school-based personnel being observed
and evaluated. All certified school staff members were invited to participate. Of those invited to
participate, 27.3 percent of administrators (N=905) and 24.8 percent of non-administrators (N=16,705)
responded to the survey.2
A review of TNCRED’s preliminary findings shows clearly that there is a high degree of consistency and
alignment with other sources of feedback mentioned in this report (i.e., department feedback
mechanisms, SCORE report, etc.). In sum, the preliminary 2012 survey results indicate that the
evaluation models are generally being implemented as designed. TNCRED’s early findings also highlight,
however, areas of challenge and give further credence to the changes proposed in the
Recommendations and Considerations section of this report. Preliminary findings include:
Fidelity of implementation. During the course of the 2011-12 school year, over two-thirds of
teachers in TEAM districts experienced short observations between one and three times; nearly
two-thirds of them were observed with lesson-length observations exactly twice. Written and
verbal feedback was typically provided within 10 days of an observation. These results are
generally consistent with expectations for observation.
Feedback. Evaluators generally believe that the feedback they provided or received, depending
on role, was focused on both improving teaching and on making a judgment about performance.
The observation rubric was generally used to guide the conversation between observer and
teacher in the post-observation conference. However, responses may suggest that the quality of
feedback provided was wide-ranging and not always at an adequate level of depth.
Training for observers. Respondents appear to feel that they were adequately trained to
perform TEAM observations; similarly, nearly three-quarters of teachers reported that they felt
their evaluators were qualified to evaluate their teaching. Levels of satisfaction with the overall
process, however, differed distinctly between teachers and administrators.
Scoring. Approximately two out of three teachers report to understand how their effectiveness
score is calculated. There also appears to be little disagreement between teachers and
administrators concerning what to utilize as a 15 percent measure. However, more than half of
teachers surveyed do not believe the 15 percent achievement measure accurately reflects their
teaching performance. On the whole, there appears to be greater support for the 35 percent
growth measure in that 76 percent of teachers agree or strongly agree that it reflects teaching
performance. In addition, while teachers are split in their support for the qualitative measure,
principals appear to believe that that this measure reflects teachers’ teaching performance.
Time challenge. Roughly two-thirds of TEAM observees report spending more than 90 minutes
preparing for an announced observation; slightly half report spending more than three hours.
Observers on the other hand, report spending far less time preparing for an observation, but
more time on providing feedback. Over 30 percent of observers report spending 30-45 minutes
on feedback; slightly over 10 percent report spending more than 45 minutes.
2 Tennessee Consortium on Research, Evaluation and Development. (2012, July). Educator evaluation in Tennessee: preliminary
findings from the 2012 First to the Top Survey. Nashville, TN: Pepper, M.J., Burns, S.F., &Springer, M.G.

25
Informing professional development. Across all models, few teachers believe that their
professional development activities in the 2011-12 school year were informed by feedback from
their evaluations.
General satisfaction with implementation. Findings reveal that teachers, on the whole, were not
satisfied with TEAM implementation in year one. Administrators on the other hand, had a
different perspective. Two-thirds of those surveyed are satisfied with the evaluation process and
feel positive about using evaluation results to inform personnel decision.
The TNCRED survey can be found at the following address:
http://www.tnconsortium.org/projects-publications/projects-publications/first-to-top-survey/
Preliminary findings can be found at:
http://www.tnconsortium.org/projects-publications/evaluation/
SCORE report
As a result of its extensive feedback gathering process, SCORE identified strengths and weaknesses in
the state’s new evaluation system in a very detailed report released on June 11. Findings from the
SCORE report indicate that TEAM is improving the quality of instruction in the classroom as well as
accountability for results. The report included the following positive perceptions of the evaluation
system as gathered by SCORE during their feedback process:
Educators have much clearer and more rigorous performance expectations, along with
an understanding of what constitutes effective teaching.
Educators are receiving more regular and specific feedback on their performance.
Clear expectations and regular feedback are leading to more self-reflection and
collaboration among teachers.
New kinds of conversations have been generated about the improvement of instruction
and outcomes for students.
The evaluation system has encouraged more intentional use of student data by
individual teachers and has driven school-wide collaboration around student growth.
The evaluation system is highlighting the importance of individualized professional
learning for teachers.
The system also is establishing clear expectations for principals to serve as instructional
leaders who understand and support effective teaching in their school.
Most principals and other evaluators feel that the system is having positive impacts on
student achievement in their schools.
Highly promising and diverse sets of practices have emerged across the four different
models.3
3 State Collaborative on Reforming Education. (2012, June.) Supporting Effective Teaching in Tennessee: Listening and
Gathering Feedback on Tennessee’s Teacher Evaluations.

26
In addition, SCORE also noted several challenges and concerns identified through the feedback gathering
process:
Unlike most principals and evaluators, many teachers are not yet convinced of the
benefits of the evaluation system.
Teachers do not have access to high-quality professional learning opportunities tied to
their performance feedback.
Approximately two-thirds of teachers do not have individual value-added student
growth data for their grades and subjects. For these teachers, 35 percent of their
evaluation is not directly tied to their own individual performance.
Currently, the 15 percent student achievement measure is not viewed as directly driving
effective teaching.
Educators feel that balancing the evaluation system with existing responsibilities is a
challenge for administrators.
Not all principals and evaluators have developed the instructional leadership skills to
effectively recognize and assess teaching practice.
Many teachers reported that observations of classroom practice do not always capture
authentic instruction, and that there has been inconsistent interpretation and
implementation of the rubric.
There is not yet sufficient focus on how the pending implementation of the Common
Core State Standards needs to be reflected in and reinforced by the teacher evaluation
system. 4
The SCORE report included seven recommendations in its 46-page report, most of which are reflected in
the department’s recommendations. The full SCORE report can be found at www.tnscore.org.
Both the Consortium’s 2012 survey findings and the SCORE report are largely consistent with feedback
gathered by the department. Taken together, these feedback patterns and themes have driven the
department’s desire to make additional changes to the design, training and implementation support of
TEAM.
4 Ibid.
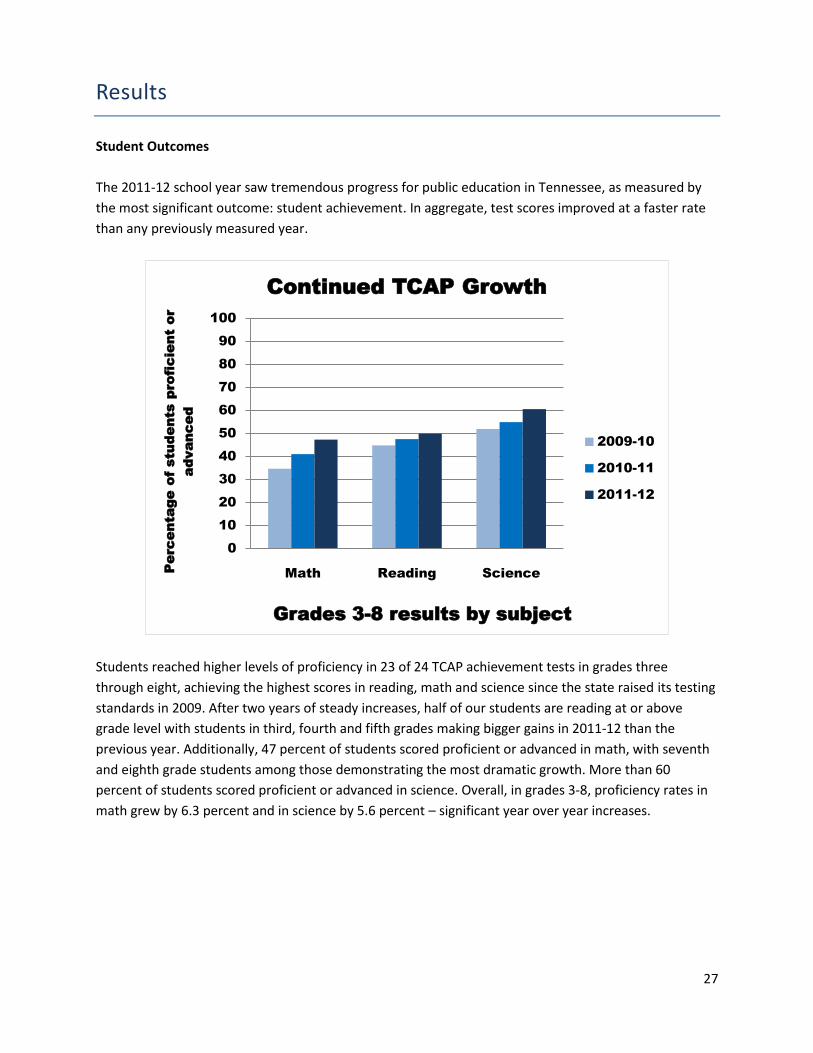
27
Results
Student Outcomes
The 2011-12 school year saw tremendous progress for public education in Tennessee, as measured by
the most significant outcome: student achievement. In aggregate, test scores improved at a faster rate
than any previously measured year.
Students reached higher levels of proficiency in 23 of 24 TCAP achievement tests in grades three
through eight, achieving the highest scores in reading, math and science since the state raised its testing
standards in 2009. After two years of steady increases, half of our students are reading at or above
grade level with students in third, fourth and fifth grades making bigger gains in 2011-12 than the
previous year. Additionally, 47 percent of students scored proficient or advanced in math, with seventh
and eighth grade students among those demonstrating the most dramatic growth. More than 60
percent of students scored proficient or advanced in science. Overall, in grades 3-8, proficiency rates in
math grew by 6.3 percent and in science by 5.6 percent – significant year over year increases.
0
10
20
30
40
50
60
70
80
90
100
Math Reading Science
Perc
enta
ge of stu
dents pro
ficient or
advanced
Grades 3-8 results by subject
Continued TCAP Growth
2009-10
2010-11
2011-12
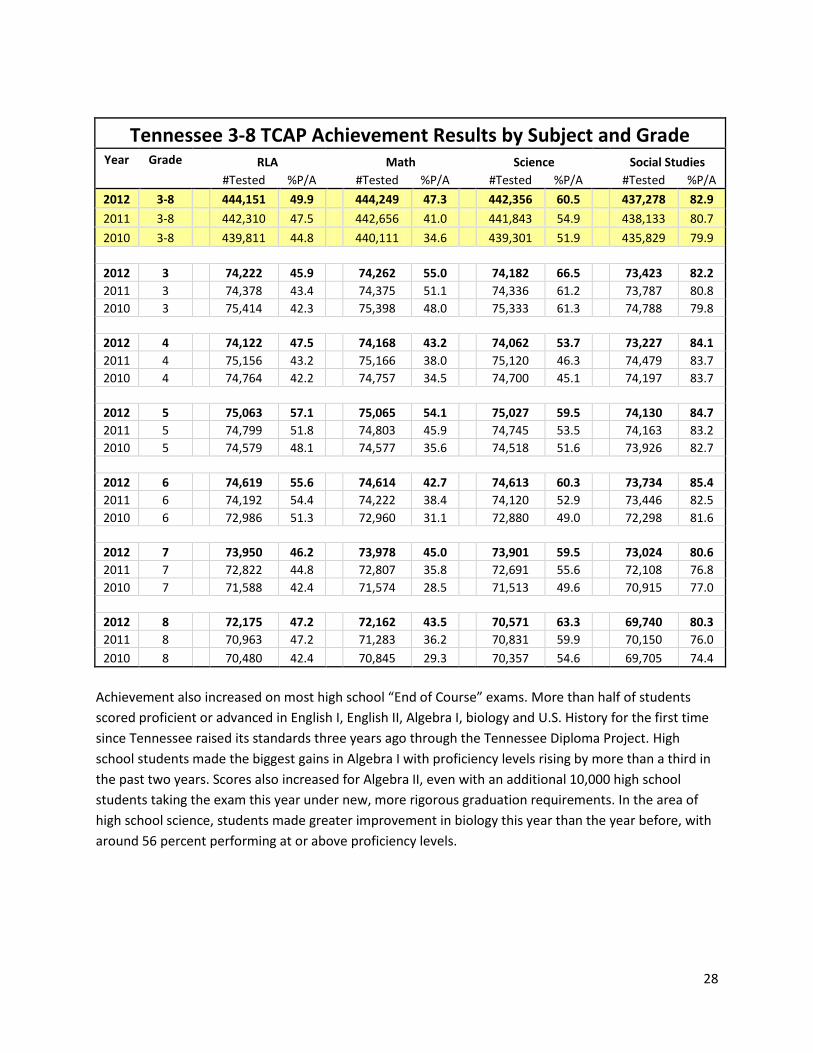
28
Tennessee 3-8 TCAP Achievement Results by Subject and Grade Year Grade RLA Math Science Social Studies
#Tested %P/A #Tested %P/A #Tested %P/A #Tested %P/A
2012 3-8 444,151 49.9 444,249 47.3 442,356 60.5 437,278 82.9
2011 3-8 442,310 47.5 442,656 41.0 441,843 54.9 438,133 80.7
2010 3-8 439,811 44.8 440,111 34.6 439,301 51.9 435,829 79.9
2012 3 74,222 45.9 74,262 55.0 74,182 66.5 73,423 82.2
2011 3 74,378 43.4 74,375 51.1 74,336 61.2 73,787 80.8
2010 3 75,414 42.3 75,398 48.0 75,333 61.3 74,788 79.8
2012 4 74,122 47.5 74,168 43.2 74,062 53.7 73,227 84.1
2011 4 75,156 43.2 75,166 38.0 75,120 46.3 74,479 83.7
2010 4 74,764 42.2 74,757 34.5 74,700 45.1 74,197 83.7
2012 5 75,063 57.1 75,065 54.1 75,027 59.5 74,130 84.7
2011 5 74,799 51.8 74,803 45.9 74,745 53.5 74,163 83.2
2010 5 74,579 48.1 74,577 35.6 74,518 51.6 73,926 82.7
2012 6 74,619 55.6 74,614 42.7 74,613 60.3 73,734 85.4
2011 6 74,192 54.4 74,222 38.4 74,120 52.9 73,446 82.5
2010 6 72,986 51.3 72,960 31.1 72,880 49.0 72,298 81.6
2012 7 73,950 46.2 73,978 45.0 73,901 59.5 73,024 80.6
2011 7 72,822 44.8 72,807 35.8 72,691 55.6 72,108 76.8
2010 7 71,588 42.4 71,574 28.5 71,513 49.6 70,915 77.0
2012 8 72,175 47.2 72,162 43.5 70,571 63.3 69,740 80.3
2011 8 70,963 47.2 71,283 36.2 70,831 59.9 70,150 76.0
2010 8 70,480 42.4 70,845 29.3 70,357 54.6 69,705 74.4
Achievement also increased on most high school “End of Course” exams. More than half of students
scored proficient or advanced in English I, English II, Algebra I, biology and U.S. History for the first time
since Tennessee raised its standards three years ago through the Tennessee Diploma Project. High
school students made the biggest gains in Algebra I with proficiency levels rising by more than a third in
the past two years. Scores also increased for Algebra II, even with an additional 10,000 high school
students taking the exam this year under new, more rigorous graduation requirements. In the area of
high school science, students made greater improvement in biology this year than the year before, with
around 56 percent performing at or above proficiency levels.

29
This strong academic growth is attributable to a number of factors, including higher academic standards
through the Tennessee Diploma Project; an accountability framework that recognizes ambitious but
achievable goals; stronger professional development offerings funded in many cases through districts’
Race to the Top plans; and increased state investment in education despite challenging budgetary times.
We believe teacher evaluation has also played an important role in our student achievement gains, as
administrators have consistently expressed the opinion that instruction improved this year as a result.
While the 2011-12 student achievement results are certainly cause for celebration, we must remember
that even with this significant jump in TCAP scores, approximately half of Tennessee’s students in grades
three through eight are not performing at grade level and, on the last administration of the National
Assessment of Educational Progress, a national benchmark test, Tennessee ranked near the bottom
when compared to other states in math and reading.5
5 46th in 4th grade math; 41st in 4th grade reading; 45th in 8th grade math; 41st in 8th grade reading. 2011 NCES NAEP data.
0
10
20
30
40
50
60
70
80
90
100
Algebra I Algebra II English I English II Biology
Perc
enta
ge of stu
dents pro
ficient or advanced
End-of-Course results by subject
High School Improvement
2010-11
2011-12
#Tested %P/A #Tested %P/A #Tested %P/A #Tested %P/A #Tested %P/A #Tested %P/A
2012 9-12 71,504 66.1 70,308 60.7 65,962 55.4 65,747 33.3 68,882 55.8 58,739 95.3
2011 9-12 71,128 66.3 71,888 58.1 69,520 46.9 55,935 30.8 71,488 52.0 65,677 95.6
2010 9-12 71,593 61.3 71,383 59.6 80,232 41.2 0 76,552 53.8 65,645 96.5
Tennessee End of Course Results by Subject
Year GradeEnglish I English II Algebra I Algebra II Biology US History

30
With our recent waiver from provisions of the federal No Child Left Behind Act, Tennessee has aligned
accountability for the state, districts, schools, principals, and teachers under a common theory of action:
measure growth and reward continuous improvement against baselines. The state has a long way to go
in reaching our ambitious student achievement goals, but our growth indicates we are on the right path.
Teacher Evaluation Results
The 2011-12 student achievement results show that our students are learning more and, because
students are learning more, our TVAAS scores are exceptionally strong. At the same time, there is
differentiation in TVAAS results by teacher and school. We would expect this level of differentiation to
mirror differentiated scores on observations. However, while observation scores were more
differentiated than under previous systems, the range of distribution is not reflective of student
outcomes.
Calculation of Scores
Fifty percent of a teacher’s overall evaluation score is based on qualitative measures. In the TEAM
model, this component is made up of observations. Over the course of a school year, teachers receive a
score of 1 to 5 on each of 41 or 60 indicators (with the number dependent on professional or apprentice
licensure status, given the differing number of observations required for each). These scores are then
averaged to arrive at an overall observation score, rounded to the hundredth place. For example, if the
sum of 1 to 5 scores for the 41 indicators equaled 167, the teacher’s observation would equal 167/41 or
4.07. The observation rubric assumes that all teachers have areas of strengths and weaknesses. A
teacher can score low in several indicators but still achieve a very high overall score because of the
design.
TVAAS or value-added scores make up 35 percent of a teacher’s total evaluation and are represented by
a composite score on a 1 to 5 scale. In the first year of implementation, the number of applicable years
for school-wide value-added scores was dependent upon the number of years a teacher was in his/her
current school. Teachers who had been at the same school for three or more years received a three-year
score, teachers who were there for two years received a two-year score, and teachers who were there
for one year received a one-year score. Individual value-added scores are based on an average of three-
years of data, given the smaller sample sizes. Value-added analyses are used to measure the change in
academic achievement for groups of students from the end of one year or class to the next. In
Tennessee, this is measured by TCAP or End of Course assessments. Value-added measures take into
account where each student is academically at the beginning of the school year, based on prior testing
history. Using this information, value-added analyses estimate the impact of a teacher, school or district
on the amount of progress students make from the beginning of the school year until they are tested.
Because value-added measures are estimates of student progress, they offer insights into how
effectively districts, schools and teachers provide opportunities for students to grow academically.
Therefore, teachers working with different groups of students are rated based on the growth of each
individual student.
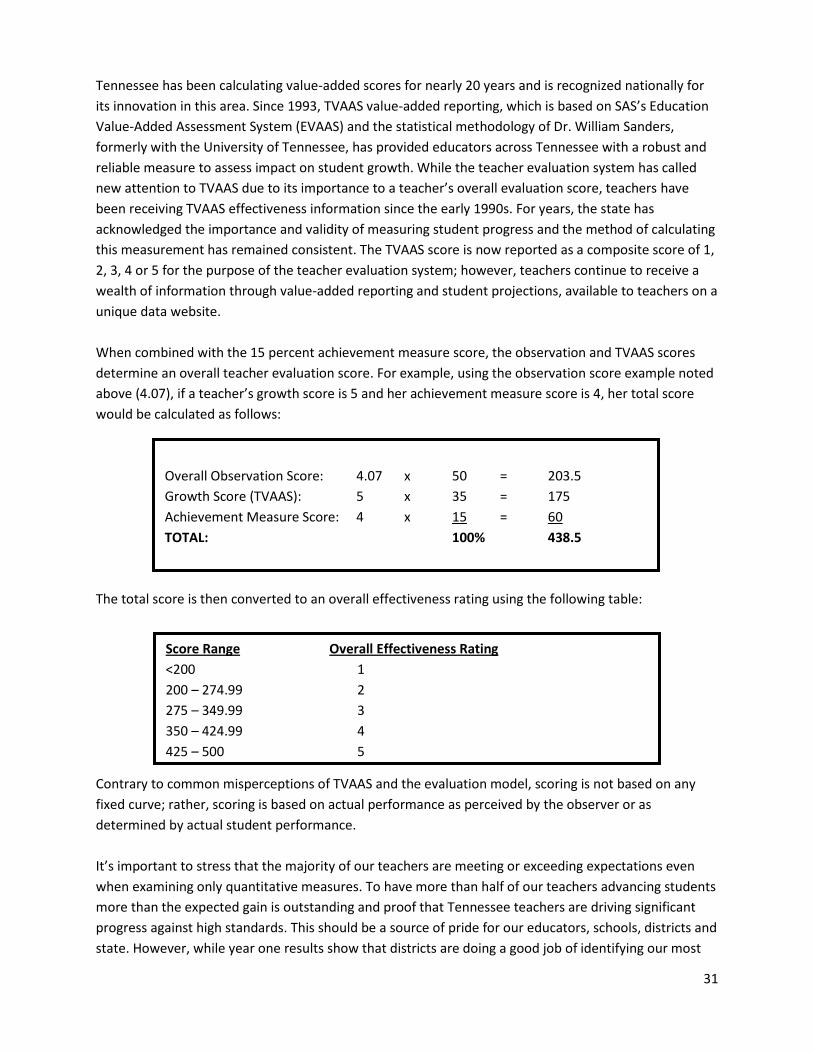
31
Tennessee has been calculating value-added scores for nearly 20 years and is recognized nationally for
its innovation in this area. Since 1993, TVAAS value-added reporting, which is based on SAS’s Education
Value-Added Assessment System (EVAAS) and the statistical methodology of Dr. William Sanders,
formerly with the University of Tennessee, has provided educators across Tennessee with a robust and
reliable measure to assess impact on student growth. While the teacher evaluation system has called
new attention to TVAAS due to its importance to a teacher’s overall evaluation score, teachers have
been receiving TVAAS effectiveness information since the early 1990s. For years, the state has
acknowledged the importance and validity of measuring student progress and the method of calculating
this measurement has remained consistent. The TVAAS score is now reported as a composite score of 1,
2, 3, 4 or 5 for the purpose of the teacher evaluation system; however, teachers continue to receive a
wealth of information through value-added reporting and student projections, available to teachers on a
unique data website.
When combined with the 15 percent achievement measure score, the observation and TVAAS scores
determine an overall teacher evaluation score. For example, using the observation score example noted
above (4.07), if a teacher’s growth score is 5 and her achievement measure score is 4, her total score
would be calculated as follows:
The total score is then converted to an overall effectiveness rating using the following table:
Contrary to common misperceptions of TVAAS and the evaluation model, scoring is not based on any
fixed curve; rather, scoring is based on actual performance as perceived by the observer or as
determined by actual student performance.
It’s important to stress that the majority of our teachers are meeting or exceeding expectations even
when examining only quantitative measures. To have more than half of our teachers advancing students
more than the expected gain is outstanding and proof that Tennessee teachers are driving significant
progress against high standards. This should be a source of pride for our educators, schools, districts and
state. However, while year one results show that districts are doing a good job of identifying our most
Overall Observation Score: 4.07 x 50 = 203.5
Growth Score (TVAAS): 5 x 35 = 175
Achievement Measure Score: 4 x 15 = 60
TOTAL: 100% 438.5
Score Range Overall Effectiveness Rating
<200 1
200 – 274.99 2
275 – 349.99 3
350 – 424.99 4
425 – 500 5

32
effective teachers through observations, there is a clear disconnect when it comes to evaluators’
measurement of those teachers who fall below expectations based on student growth data.
Distribution of TVAAS Individual Teacher Effect and Observation Scores
*Figures rounded to the nearest tenth.
While the observation scores dispel the myth that teachers cannot receive high scores on the
observation rubric, they demand reflection and thoughtful consideration when considered alongside
student achievement results. For example, the average observation score for a teacher with an
individual value-added score of a 5 was just above a 4, indicating evaluators are doing an effective job
identifying their higher performing teachers. However, teachers with a value-added score of a 1
received an average observation score of a 3.64, demonstrating an inability or unwillingness on the part
of evaluators to identify the lowest performing teachers.
Less than one half of one percent of teachers are identified by their evaluators as falling significantly
below expectations. At the same time student growth data identifies more than 16 percent of such
teachers. This creates an environment in which struggling teachers receive little assistance or feedback
on how to improve. In many cases, evaluators are telling teachers they exceed expectations in their
observation feedback when in fact student outcomes paint a very different picture. This behavior skirts
managerial responsibility and ensures that districts fail to align professional development for teachers in
a way that focuses on the greatest areas of need. This in turn leads teachers to maintain the same
instructional methods and strategies and results in continued low levels of growth for their students.
This is unacceptable for low-performing teachers, who lack the assistance to improve. It is even more
unacceptable for students assigned to these teachers, since they will, in all likelihood, fall behind their
peers who are assigned to more effective instructors.
In addition, this disparity between student results and observations signifies an unequal application of
the evaluation system throughout the state, whereby districts implementing evaluation with the utmost
fidelity can face criticism and pressure from teachers who see their peers in other districts receiving
higher scores without the results to justify the ratings.
The disparity and disconnect is not limited to TEAM. In fact, an analysis of all four approved evaluation
models shows the same challenges. In addition to the state model, the State Board of Education
Level 1 2 3 4 5
TVAAS Individual Teacher
Effect
16.5% 8.1% 24.5% 11.9% 39.1%
Observation 0.2% 2.2% 21.5% 53.0% 23.2%
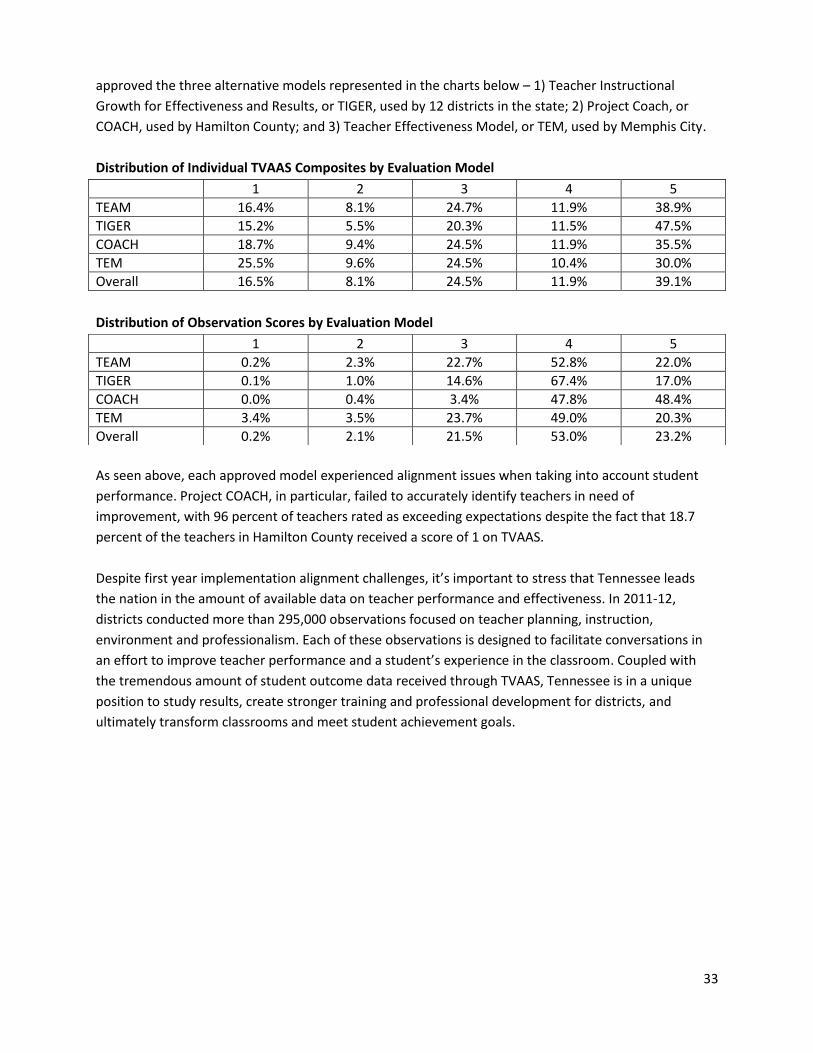
33
approved the three alternative models represented in the charts below – 1) Teacher Instructional
Growth for Effectiveness and Results, or TIGER, used by 12 districts in the state; 2) Project Coach, or
COACH, used by Hamilton County; and 3) Teacher Effectiveness Model, or TEM, used by Memphis City.
Distribution of Individual TVAAS Composites by Evaluation Model
Distribution of Observation Scores by Evaluation Model
As seen above, each approved model experienced alignment issues when taking into account student
performance. Project COACH, in particular, failed to accurately identify teachers in need of
improvement, with 96 percent of teachers rated as exceeding expectations despite the fact that 18.7
percent of the teachers in Hamilton County received a score of 1 on TVAAS.
Despite first year implementation alignment challenges, it’s important to stress that Tennessee leads
the nation in the amount of available data on teacher performance and effectiveness. In 2011-12,
districts conducted more than 295,000 observations focused on teacher planning, instruction,
environment and professionalism. Each of these observations is designed to facilitate conversations in
an effort to improve teacher performance and a student’s experience in the classroom. Coupled with
the tremendous amount of student outcome data received through TVAAS, Tennessee is in a unique
position to study results, create stronger training and professional development for districts, and
ultimately transform classrooms and meet student achievement goals.
1 2 3 4 5
TEAM 16.4% 8.1% 24.7% 11.9% 38.9%
TIGER 15.2% 5.5% 20.3% 11.5% 47.5%
COACH 18.7% 9.4% 24.5% 11.9% 35.5%
TEM 25.5% 9.6% 24.5% 10.4% 30.0%
Overall 16.5% 8.1% 24.5% 11.9% 39.1%
1 2 3 4 5
TEAM 0.2% 2.3% 22.7% 52.8% 22.0%
TIGER 0.1% 1.0% 14.6% 67.4% 17.0%
COACH 0.0% 0.4% 3.4% 47.8% 48.4%
TEM 3.4% 3.5% 23.7% 49.0% 20.3%
Overall 0.2% 2.1% 21.5% 53.0% 23.2%
34
Recommendations and Considerations
From the outset of the 2011-12 school year, the department has been committed to listening to
educators and other stakeholders, gathering feedback, collecting data, measuring outcomes and
building a continuous improvement process for the evaluation model. The recommendations below
represent this commitment.
I. Measurement of the quantitative impact on student performance
1. The state should ensure that additional teachers have access to an individual growth measure,
while maintaining the principle that assessments should be added only when they will benefit
student performance and not for the sole purpose of measuring teachers.
Based on progress made by the educator groups noted in the Feedback section, the department
recommends that the State Board of Education adopt the following additional individual growth
measures for the 2012-13 school year:
1) 1st- 3rd grade: pre- and post- test for the Stanford 10 (SAT 10) in first and second grade. The
end of year SAT 10 test for districts that adopted it during the 2011-12 school year will be used
to create value-added scores for 3rd grade teachers next year.
2) Fine Arts: peer-review portfolio model.
It is important to note we are not recommending that the use of the proposed additions to growth
measures be mandated. Instead, we recommend maintaining district flexibility, giving districts the
opportunity to opt in to any of the approved measures or to continue using one of the school-wide
value-added composites.
In addition to the individual growth measures noted above, the department recommends that the State
Board of Education adopt the following additional school-wide growth measures for the 2012-13 school
year:
1) English Language Learners: the use of English Language Development Assessment (ELDA), a
required test for all ELL students in Tennessee. This assessment will be used to create school
level composites specific to students in an ELL setting.
2) CTE Concentrator Value-Added: the use of a school-wide numeracy/literacy score specific to
students who are CTE concentrators.
Based on current progress by educator groups, we anticipate the following non-tested grades and
subjects will have an individual growth measure by the 2013-14 school year:
1) Pre-K & Kindergarten: peer review portfolio model
2) P.E. & Health Wellness: peer review portfolio model
3) High School Government
35
4) High School Chemistry
Based on these estimates, a potential 58 percent of teachers could have a growth score directly tied to
their students during the 2012-13 school year with State Board of Education approval. Again, the caveat
is that districts will have the option of participating or not, so the actual percentage across the state will
likely be slightly lower. An additional 10 percent of teachers – those working with special education
students - could receive an individual teacher effect score with our next recommendation relative to
qualitative scoring, increasing the ratio of teachers eligible to receive an individual teacher effect score
above two-thirds of total state educators. For the 2013-14 school year, a potential of 80 percent of
teachers could have an individual growth measure.
The department, through its work and communication with educator groups, does not anticipate having
an individual growth measure for CTE subject area teachers, ELL teachers, school service personnel and
world language teachers, absent developments in the immediate future that allow for stronger
measurement systems that would also benefit students. However, we plan to continue to work with
educator groups and other states on the development of additional individual growth measures.
2. The prohibition on including students with disabilities in calculating an individual teacher’s value-
added scores should be removed.
The current prohibition on including special education student data as part of a teacher’s effect data
prevents accurate measurement of special education teachers, does not align with the state’s goal of
improving outcomes for all students and is based on the statistically inaccurate presumption that
students with disabilities will harm teacher effect scores. Furthermore, the Tennessee Advisory Council
for the Education of Students with Disabilities, which consists of experts in the field of special education,
has recommended amending the law to remove the prohibition. To that end, the department
recommends that the General Assembly remove the prohibition located in Tenn. Code Ann. § 49-1-606.
3. Teachers who do not have access to individual value-added scores should continue to have a
portion of their evaluation come from school-wide scores; however, that portion should be
reduced from 35 percent to a lower threshold.
Throughout the year, the department received feedback from administrators emphasizing the
importance of using the school-wide value added score as an evaluation measure and citing the positive
impact it was having on teacher collaboration and student performance. However, educators also
questioned the weighting of the school-wide data. SCORE noted a similar sentiment in its report of
educator feedback. The SCORE report specifically articulated alternative weighting options for educators
in non-tested grades and subjects. The department agrees that the weighting should be adjusted and
recommends that the General Assembly reduce the weight from 35 percent.
4. School-wide value added scores should be based on a one-year score rather than a three-year
score.
In the first year of implementation, the number of applicable years for school-wide value-added scores
was dependent upon the number of years a teacher was in his/her current school. Teachers who had
36
been at the same school for three or more years received a three-year score, teachers who were there
for two years received a two-year score, and teachers who were there for one year received a one-year
score. After hearing feedback from administrators, especially in school turnaround situations, there is
agreement that using only the current year score for school-wide value added is more appropriate.
Additionally, from a statistical standpoint, the number of student scores included in a school-wide score
lends sufficient validity and reliability.
The department currently has the authority to base school-wide scores on one year’s worth of data and
will implement this change for the 2012-13 school year.
5. Teachers with individual value-added scores who receive a 4 or 5 on TVAAS should be allowed to
use that score to count for 100 percent of their total evaluation score.
The state of Tennessee, through First to the Top and other reforms, has taken on ambitious student
achievement goals to ensure that student outcomes are improving every year. During the year, the
department heard feedback articulating concerns from teachers who were worried they would score
lower on the observation component of the system, while still showing strong student growth. In
particular, many educators stated that some teachers who may teach using non-traditional methods
would score low on the observation component but still show strong student growth. Based on this
feedback, which was also reflected in legislation introduced during the 2012 legislation session, the
department believes that teachers whose students demonstrate a high level of growth should be
rewarded for their impact on student achievement. Therefore, the department recommends that the
General Assembly revise the law to allow teachers with a 4 or 5 on TVAAS at the end of the year to use
those scores to account for 100 percent of their evaluation score.
6. The options available for the 15 percent achievement portion of the evaluation should be limited,
prioritizing options that can be calculated prior to the start of the next school year and ensuring
options provide legitimate impact on student achievement.
During the 2011-12 school year, educators viewed the 15 percent measure as one of the least effective
components of the system for two primary reasons: 1) The 15 percent measures are being
inconsistently selected by similar groups of teachers, and, at times, teachers are selecting measures that
are not aligned to their job responsibilities; and 2) Some measures that are approved, by definition,
result in data returning well after the school year is finished. The late return in data means that some
teachers will not have their overall evaluation completed until the 2012-13 school year has already
begun.
To address the concerns, the department has adjusted the training for all evaluators during the summer
of 2012. Each evaluator will be trained specifically on the spirit of the 15 percent measure, how to help
teachers select a measure that is aligned with job responsibilities, and how to scale the measure so that
it reflects a rigorous vision for student outcomes. Evaluators will also be trained on resources at their
disposal, so that the process of selecting the achievement measure does not become a burdensome
task.
Additionally, to ensure that teachers receive their overall evaluation scores in a timely manner, the
department recommends that the State Board of Education remove options that do not return in a

37
timely manner and examine which 15 percent selections were most closely related to student
outcomes.
It is important to note that school-wide value-added is an option for all teachers. In keeping with the
feedback received on the importance of school-wide value-added as a component of the evaluation
system, teachers who receive an individual value-added score should strongly consider selecting the
school-wide score as an option to unify all teachers at the school around a common goal.
II. Changes to the qualitative rubric
1. The instructional pieces of the rubric should be largely left intact to build upon successful
implementation and to increase educator familiarity with the rubric; however the department
should undergo a careful examination during the coming year to determine if there are ways to
further streamline the rubric.
The rubric used to evaluate teachers under the TEAM model, derived from NIET’s TAP rubric, is
grounded in years of research to determine which teacher practices are best related to improving
student outcomes. The rubric sets a high standard for excellent performance so that administrators and
teachers can have rich conversations about instructional practices. Throughout the year, the
department received feedback on both strengths and areas for improvement on the teacher rubric. As
noted in the Feedback section of this report, the most common feedback that the department received
throughout the year was that the instruction domain of the rubric provided the basis for stronger
conversations and improved instruction. The feedback specifically articulated that the 12 instruction
indicators provide teachers with a holistic understanding of the necessary components required to
improve student outcomes.
At the same time, the department received feedback that the specific evidence points within the
indicators of the rubric were being treated as a checklist by both teachers and administrators, leading to
our next recommendation in this area.
2. The state should continue to train evaluators to use the rubric holistically and should provide
professional development to ensure that teachers and evaluators understand that the rubric
should not be viewed as a checklist.
The department is providing trainings for all evaluators this summer and will continue to communicate
the proper implementation of the rubric to school leaders and evaluators. All summer trainings are
structured around a series of core beliefs and trainers are working to emphasize key areas. Trainers are
focused on the message that the rubric should not be treated like a checklist, but rather should be
scored holistically, taking into consideration student response and the intent of the indicator. As
evaluators watch lessons and score the evidence, they are doing so with a holistic viewpoint in mind.
3. The state should provide access to additional examples of performance levels for teachers
through increased video libraries, sample lessons and through facilitation of peer-to-peer
observations.
38
Through the feedback process, the department found that educators would like to have more examples
of highly effective teaching and lesson planning. For example, teachers and administrators provided
feedback on the planning domain, indicating that teachers were spending eight to 12 hours writing very
lengthy lesson plans, a time frame that exceeds the intent of the domain. Throughout the state,
educators provided lessons that received a score of a 5 and were written in a very manageable amount
of time and with a limited amount of writing. Similar to the instruction domain, it is important that
planning not be treated as a checklist, but rather, thought of as a holistic domain. Much like training on
the instructional domain, treating the planning domain as a holistic measure will be emphasized by the
department and examples of short, but highly-rated lesson plans, will be provided.
In addition, teachers have noted that there are limited examples of highly effective instruction available
for their review. The department will provide additional examples to educators through the NIET Best
Practices Portal, which is available electronically to all teachers. Finally, the department will encourage
and facilitate peer-to-peer observations as they have proven to provide valuable content-specific
feedback.
4. The professionalism component of the rubric should be significantly reduced and streamlined.
The professionalism domain, completed within the last six weeks of the school year, does not require a
single observation but rather the collection of evidence throughout the year. During the beginning of
the year, the department received feedback that there was not a specific rubric that distinguished the
performance levels within a single indicator. As a result, with the help of educator groups, the
department distributed a rubric that explained the existing indicators in further detail. As the school
year came to an end, administrators expressed additionally that the 10 indicators in the professionalism
rubric were repetitive. As a result, the department will present a recommendation to the State Board of
Education that it reduce the professionalism rubric from 10 indicators to four.
5. The state should explore the funding and use of student surveys and pilot programs to use video
scoring of observations at district discretion.
As outlined in the Feedback section, various research studies, including the SCORE report, identify the
use of student surveys as an evaluation component that districts should consider utilizing.
The State Board of Education has already approved the use of student surveys for five percent of the
qualitative measure through TEM, which is the teacher evaluation model in use in Memphis City
Schools. Through available grants, the department plans to fund the use of student surveys for TEAM
districts that apply to use them during the 2012-13 school year. While there are some funding
limitations, we hope to offer the Tripod survey to as many districts as possible.
In addition to student surveys, the MET study also discusses the benefits of utilizing videotape
technology in classrooms so that observations can be conducted without the presence of an observer in
the classroom.
In addition, the department will seek grant funding to assist districts in obtaining the use of available
technology to utilize video scoring of observations.
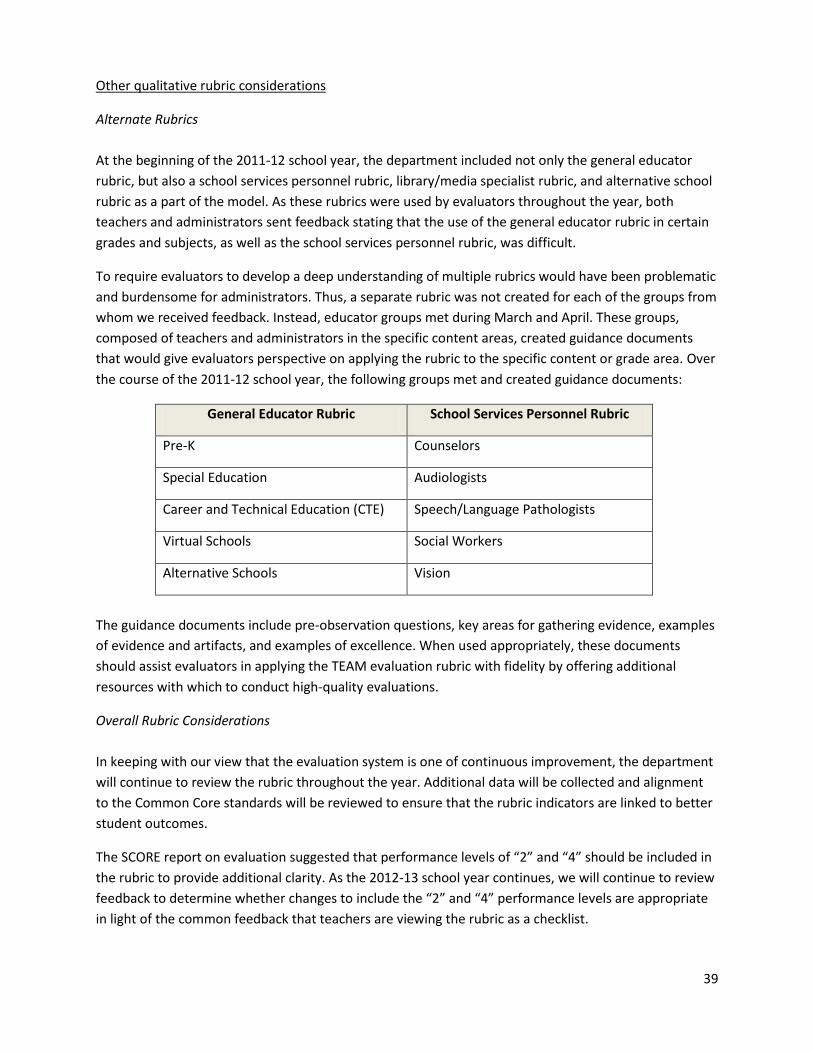
39
Other qualitative rubric considerations
Alternate Rubrics
At the beginning of the 2011-12 school year, the department included not only the general educator
rubric, but also a school services personnel rubric, library/media specialist rubric, and alternative school
rubric as a part of the model. As these rubrics were used by evaluators throughout the year, both
teachers and administrators sent feedback stating that the use of the general educator rubric in certain
grades and subjects, as well as the school services personnel rubric, was difficult.
To require evaluators to develop a deep understanding of multiple rubrics would have been problematic
and burdensome for administrators. Thus, a separate rubric was not created for each of the groups from
whom we received feedback. Instead, educator groups met during March and April. These groups,
composed of teachers and administrators in the specific content areas, created guidance documents
that would give evaluators perspective on applying the rubric to the specific content or grade area. Over
the course of the 2011-12 school year, the following groups met and created guidance documents:
General Educator Rubric School Services Personnel Rubric
Pre-K Counselors
Special Education Audiologists
Career and Technical Education (CTE) Speech/Language Pathologists
Virtual Schools Social Workers
Alternative Schools Vision
The guidance documents include pre-observation questions, key areas for gathering evidence, examples
of evidence and artifacts, and examples of excellence. When used appropriately, these documents
should assist evaluators in applying the TEAM evaluation rubric with fidelity by offering additional
resources with which to conduct high-quality evaluations.
Overall Rubric Considerations
In keeping with our view that the evaluation system is one of continuous improvement, the department
will continue to review the rubric throughout the year. Additional data will be collected and alignment
to the Common Core standards will be reviewed to ensure that the rubric indicators are linked to better
student outcomes.
The SCORE report on evaluation suggested that performance levels of “2” and “4” should be included in
the rubric to provide additional clarity. As the 2012-13 school year continues, we will continue to review
feedback to determine whether changes to include the “2” and “4” performance levels are appropriate
in light of the common feedback that teachers are viewing the rubric as a checklist.
40
III. Increases in process efficiency
1. Teachers who receive a 5 on either their overall evaluation score or on their individual TVAAS
score should have a more streamlined evaluation process the following year with one full-length
observation and two additional short, unscheduled visits with limited paperwork.
2. Teachers who receive a 1 on either their overall evaluation score or on their individual TVAAS
score should have additional, unannounced, full-length observations with feedback to ensure they
receive professional development to improve.
As the year progressed, administrators expressed the value and importance of observations, but seemed
to prefer a system in which more time could be spent with teachers most in need of improvement and
less time spent with high performing teachers. Based on that feedback, the department recommends
that the State Board of Education modify requirements for the number of observations required based
on value-added or overall evaluation scores as noted above. For teachers who score a 1, this
recommendation would make the number of observations consistent with the number for novice
teachers, who often need more assistance. Note that any board action would provide the minimum
requirement and districts could choose to conduct additional observations.
This shift in the requirement of observations allows evaluators to spend more time with teachers most
in need of improvement, while reducing the amount of time spent with teachers whose student
outcomes demonstrate strong performance. It is important to remember, however, that even the
strongest teachers need regular feedback to further improve practice.
It is also important to note that because many evaluators systematically failed to identify the lowest-
performing teachers, it is critical that the additional observation requirements are tied to the individual
TVAAS score, meaning students advanced significantly less than would be expected. Again, the purpose
of the evaluation system is to identify areas of need and provide professional development so that
teachers can get better and student outcomes can improve.
If evaluators and school districts continue to inaccurately assess the lowest performing teachers and fail
to provide feedback for improvement, the General Assembly should consider revisiting the issue of
public access to teacher evaluation data and making such data available to parents for information
purposes.
3. The evaluation data system should continue to be measured and streamlined to increase
efficiencies, reduce time and paperwork on school districts and allow for increased functionality.
To address inefficiencies in the data system, the department is working to release a more efficient data
system with the functionality improved by the beginning of the year. Specifically, all evaluators will be
able to access all necessary data entry components from a single grid, allowing for one-click data entry.
Additionally, having all components by August 1st will enable evaluators to enter forms and data in the
system directly, rather than having to write it on paper first and then transfer it over to the data system.
41
In addition to making the data system more user-friendly, the department will provide training on the
use of the data system to district teams at the beginning of the 2012-13 school year so that the teams
can go back to their districts and train their evaluators. This training will supplement online video
tutorials and guides that have been available throughout the 2011-12 school year. The trainings will be
important to ensure that all evaluators can take full advantage of the features in the data system.
While the data system for the state is useful in collecting data, there has been desire around the state
for evaluators to have a performance management system. Such a system would help observers
schedule observations, script evidence during observations, and link specific pieces of evidence to
indicators on the rubric. Some districts have been working with a variety of vendors to purchase their
own systems and have reported many benefits. First, the ability to schedule observations and script
evidence via the application saves observers time before and after an observation and allows the focus
of energy to be on the observation itself. Additionally, the systems are functional with iPads and allow
districts to utilize their technology.
Other Process Considerations
By statute, many teachers are not subject to the new evaluation procedures due to their status as 120-
day contract or part-time employees. The department has targeted this omission for further review.
IV. Management of District Implementation
1. The State Board of Education, with assistance from the department, should more clearly define
its policy relative to state monitoring of districts that have a significant variance between value-
added and observation scores. Evaluators with significant deviation should have their certification
as evaluators examined and be required to attend re-certification classes.
State Board of Education policy 5.201 (Teacher and Principal Evaluation Policy) requires the department
to determine a process for making sure that observation scores are aligned to value-added scores.
Specifically, section 3 of the guidelines states the following:
By August 1 of each year, the state board of education will publish an anticipated range of
distribution of evaluation results for the coming school year, subject to variation based on
differences in student achievement growth in individual schools and districts. The department
will monitor observation scores throughout the year and enforce consistent application of
standards across districts. Upon the conclusion of the school year and relevant data collection,
the department will publish evaluation results by district. Districts that fall outside the
acceptable range of results, subject to student achievement scores, will not be approved to use
alternate models for the following school year, and will be subject to additional training and
monitoring by the department.
To ensure equitable application of the evaluation system across the state, the department will analyze
the relationship between observation scores and value-added scores to determine the appropriate
policy for monitoring districts that fall outside an acceptable score correlation and recommend action to
the State Board of Education.

42
2. The state should utilize its eight Centers of Regional Excellence (formerly Field Service Centers) to
provide district and school leaders with increased access to professional development in areas of
high need of evaluation implementation.
The department will directly support schools and evaluators that have demonstrated a high need in the
areas of evaluation implementation. This will be accomplished through our eight newly configured
Centers of Regional Excellence, which will have a renewed focus on academics rather than school
system compliance.

43
Closing
When Tennessee came together across party and geographic lines to support bold legislation and a
courageous First to the Top plan, the state embarked on a challenging journey to improve educational
outcomes. We are engaged in this work because we are not satisfied with our past results. We believe
that Tennessee students can and will compete with students anywhere in the country and the world.
Therefore, we have an obligation to build a public education system that gives students the very best
chance to succeed.
Our students and our educators are meeting the challenge. Test scores are rising across all subjects and
grade levels. Tennessee’s students are better prepared than ever before.
Still, we know we must improve our work every year if we are going to be the fastest growing state in
the country in student achievement. We can only improve if we measure our performance, offer
meaningful feedback, and take steps to better outcomes each year.
The Department of Education has made this commitment with our own work. When we implement
significant programs, we will measure them, gather evidence, accept feedback, and make changes in an
effort to improve. From the outset of our implementation of the new teacher evaluation system, we
committed to listen, to measure, to assess, and to make changes. This commitment extends into future
years, too.
This report catalogues the most significant findings gathered from hundreds of thousands of student
assessments and teacher observations, tens of thousands of survey responses, thousands of
conversations and emails, and hundreds of school and district visits. We believe our evaluation model
helped students learn more in 2011-12. We also believe that the changes recommended here will
further increase student achievement in 2012-13.
We remain incredibly grateful for the hard work of educators in Tennessee. If anything, this report
should demonstrate the incredible impact that effective teachers can have on the lives of students and
the importance of building models that recognize our very best teachers for their immeasurable
contribution to the state of Tennessee.