teacher education and development study in … · figure 1ean scores and confidence intervals for...
TRANSCRIPT

Teacher Education and Development Study in
Mathematics 2008C
AN
AD
IAN
REP
ORT
Teacher Education and Development Study in
Mathematics 2008
Canadian RepoRt
Acknowledgements
We would like to thank the students professors and deans of the faculties of education who gave of their time to participate in the 2008 TEDS-M study The support for this international collaborative project provided by members of the TEDS Steering Committee and by the coordinators in each participating ministry or department of education during all stages of the study is gratefully acknowledged The dedication of the survey development implementation processing and methodology teams was essential to the projectrsquos success and is much appreciated
This publication was prepared by the Council of Ministers of Education Canada (CMEC)
Council of Ministers of Education Canada 95 St Clair West Suite 1106 Toronto Ontario M4V 1N6
Telephone (416) 962-8100 Fax (416) 962-2800 E-mail cmeccmecca copy 2010 Council of Ministers of Education Canada
ISBN 978-0-88987-205-9
Ce rapport est eacutegalement disponible en franccedilais
Printed on recycled paper
iii
Table of Contents
What is TEDS-M 2008 1
Research design and methodology for TEDS-M 2
What is to be learned from TEDS-M 2
What value will TEDS-M add to existing research on teacher education 3
Target populations 3
Components of TEDS-M 4
Component 1 studies of teacher-education policies for elementary and lower-secondary mathematics teachers and their cultural and social contexts 4
Component 2 studies of elementary and lower-secondary mathematics teacher-preparation routes programs standards and expectations for teacher learning 5
Component 3 studies of the mathematics and related teaching knowledge of future elementary and lower-secondary school teachers 7
Participating countries in TEDS-M 9
The Canadian administration 9
Structure and organization of teacher education in Canada 10
Programs in specific jurisdictions 12
Ontario 12
Quebec 12
Nova Scotia 13
Newfoundland and Labrador 14
iv
The administration of the TEDS-M survey in Canada 14
Representation at international meetings 15
Adaptation translation and approval of assessment and questionnaire materials 15
Sampling institutions 15
Contacting institutions and sending and collecting materials 16
Quality monitoring 16
Coding 17
Description of teacher-education courses and collection and coding of syllabi 17Coding of mathematics content knowledge and mathematics pedagogical content knowledge 17
Results 18
Institutional Program Questionnaire 18
Survey for Mathematics Mathematics Pedagogy and General Pedagogy Educators 19
Survey for Future Teachers of Lower-Secondary Mathematics 21
Survey for Future Teachers of Elementary Mathematics 22
Conclusion 30
References 31
APPENDIX I 33
Sample Syllabus Coding 33
APPENDIX II 35
Examples of assessment items in the Primary General Pedagogy Knowledge for Teaching section of the Future Teacher Questionnaire 35
Examples of assessment items in the Secondary General Pedagogy Knowledge for Teaching section of the Future Teacher Questionnaire 41
v
List of Figures
Figure 1 Mean scores and confidence intervals for participating countriesmdashElementary-level future teachersrsquo mathematics content knowledge 24
Figure 2 Mean scores and confidence intervals for participating countriesmdashElementary-level future teachersrsquo pedagogy content knowledge 25
Figure 3 Mean scores and confidence intervals for participating countriesmdashLower-secondary-level future teachersrsquo mathematics content knowledge 26
Figure 4 Mean scores and confidence intervals for participating countriesmdashLower-secondary-level future teachersrsquo pedagogy content knowledge 27
Figure 5 Mean scores and confidence intervals by gender primary mathematics knowledge 28
Figure 6 Mean scores and confidence intervals by gender primary pedagogical knowledge 28
Figure 7 Mean scores and confidence intervals by gender lower-secondary mathematics knowledge 29
Figure 8 Mean scores and confidence intervals by gender lower-secondary pedagogical knowledge 29
1
What is TEDS-M 2008The Teacher Education and Development Study in Mathematics 2008 is a comparative study of teacher education with a focus on the preparation of mathematics teachers at the elementary and lower-secondary levels The study was carried out under the aegis of the International Association for the Evaluation of Educational Achievement (IEA) a consortium of research institutions in 60 countries TEDS-M focused particularly on the links between teacher-education policies practices and outcomes The study provided participating countries with a valuable opportunity to conduct research on their own teacher-education systems and to learn from approaches used in other countries
Teacher education has become an area of considerable interest among policy-makers in many countries over recent years This reflects the growing body of research on the vital importance of teachersrsquo knowledge and skills to quality learning opportunities for students It also reflects the need to recruit and prepare a new generation of teachers as large numbers of current teachers reach retirement age
TEDS-M addressed research questions of central interest to policy-makers who want to improve the effectiveness of teacher-education systems such as
bull Whatarethecharacteristicsofteacher-educationprogramsthateffectivelypreparefuture mathematics teachers
bull Whatkindsof learningexperiencesareeffective in transformingthebeliefsoffuture teachers about the teaching and learning of mathematics
bull Whatkindsofschoolexperiencesaremosteffectiveinpreparingmathematicsteachers
bull Howcantheoutcomesofteacher-educationprogramsformathematicsteachersbe measured in ways that are reliable and valid
bull Underwhatconditionscannationalpoliciesfortheregulationoraccreditationofteachereducation have a positive impact on the quality of outcomes from teacher education
bull Whatkindsofpoliciesareprovingtobeeffectiveinrecruitingmathematicsteachersfrom a diverse range of social and cultural backgrounds
The main goal of TEDS-M was to show whether and how much teacher-preparation policies programs and practices across the world contribute to the capability to teach mathematics effectively in elementary and lower-secondary schools The TEDS-M project included
bull studiesofcountrycontextandofteacher-trainingpoliciesprogramsandpracticesat the national level
bull studiesofcurriculaandteacher-preparationpractices includingstandardsandexpectations for future teachers at the institutional level
bull studies of the impact of teacher preparation on the knowledge skills anddispositions acquired by future teachers
2
Research design and methodology for TEDS-MThe study surveyed future teachers at the end of their teacher preparation in order to examine elementary and lower-secondary teachersrsquo mathematical knowledge and its relationship with future teachersrsquo opportunity to learn1
TEDS-M used a national probability sample and a customized sample plan for each participating country
One of the fundamental principles of IEA design is to base cross-national comparisons on national probability samples This approach entails the development of an international master sampling plan the adaptation of this master plan to national contexts and the adjudication of differences by an IEA-designated sampling referee TEDS-M sampled teacher-education institutions instructors and future teachers
What is to be learned from TEDS-Mbull TEDS-M provided answers on the POLICY and CONTEXT of mathematics
teacher education TEDS-M examined the intended and implemented policies that support
elementary and lower-secondary teachersrsquo achieved level and depth of mathematics and related teaching knowledge and how teacher-education policies influence the structure of elementary and lower-secondary mathematics teachersrsquo opportunities to learn
bull TEDS-M provided answers on the ORGANIZATION of mathematics teacher education
TEDS-M examined the learning opportunities available to future elementary and lower-secondary mathematics teachers that allow them to attain the necessary knowledge to teach mathematics It also studied the structure of the learning opportunities the content of teacher-education programs and the organization of instruction
bull TEDS-M provided answers on the OUTCOMES of mathematics teacher education TEDS-M examined the level and depth of the mathematics and related teaching
knowledge attained by future elementary and lower-secondary teachers and how this knowledge varies across countries
1 The two target populations for future teachers were those teaching at the primaryelementary level and the lower-secondary level In Canada this corresponds to Grades 1 to 6 and Grade 8 (Secondary II in Quebec)
3
What value will TEDS-M add to existing research on teacher education
TEDS-M is the first mathematics teacher-education study to follow a rigorous methodology to
bull gatherempiricaldataontheexperienceofparticipatingcountriestocontributeto policy debate about the nature benefits and costs of teacher education
bull strengthentheknowledgebasetoaddressparticipatingcountriesrsquonationalpriorities
bull develop concepts measurement strategies indicators and instrumentation tostrengthen the research in this field
bull furtheramorescientificapproachtothestudyofteachereducationandteacherlearning in mathematics
Target populationsThe target populations of TEDS-M included
bull educationpolicy-makersindividualsororganizationsresponsibleforthedevelopmentand implementation of national (provincialregional) policies for teacher education including recruitment curriculum quality assurance and funding
bull teacher-educationinstitutionsinparticipatingcountriessecondaryorpostsecondaryschoolscollegesuniversities that offer structured programs of study on a regular and frequent basis to future teachers within a system of teacher preparation
bull educatorsoffutureteacherspersonswithregularrepeatedresponsibilitytoinstructor mentor future teachers within a given teacher-preparation program
bull futureteacherspersonsenrolledinateacher-preparationprogramthatisexplicitlyintended to prepare individuals to teach mathematics in any grade at the elementary or lower-secondary school level
4
Components of TEDS-MTEDS-M had three components
Component 1studies of teacher-education policies for elementary and lower-secondary mathematics teachers and their cultural and social contexts
ObjeCtiveTo examine the intended implemented and achieved policies directed at mathematics teachers including recruitment selection preparation and certification
QuestiOnsa) What are the policies that regulate and influence the design and delivery of mathematics
teacher education for elementary and lower-secondary teachers within and across countries
b)How do countriesrsquo distinctive political historical and cultural contexts shapemathematics teaching and learning and how do these influence policy and practice in mathematics teacher education
c) What are the consequences of policies for the development of standards for degrees coverage of topics and certification practices What are the consequences of policies for the recruitment selection and preparation of future mathematics teachers Are these policies coherent or do they compete with one another
d) What would it take (in terms of resources capacity and costs) to bring the preparation of average mathematics teachers to a level that produces high-quality elementary and lower-secondary mathematics teachers in participating countries What are the comparative costs of implementing alternative teacher-education policies in different contexts
Data-COlleCtiOn instrumentsThese studies used a set of guidelines and protocols in conjunction with interviews and focus groups of policy-makers in teacher education to examine
bull documentsreflectingnational-levelpolicyregardingtheteachingofmathematicsunderlying each route (ie consecutive or concurrent teacher education)
bull descriptions of the mathematics curricula for the different teacher-educationprograms within routes
bull descriptions of elementary and secondary school curricula standards andexaminations
bull theimplementationofteacherpolicy(recruitmentselectionandcertification)within each route and institution and
bull thecostsofalternativemathematicsteachereducationforfutureelementaryandsecondary teachers
5
These data revealed national teacher-preparation policies and trends how national authorities define a qualified mathematics teacher their implicit or explicit theories about how one becomes qualified the kinds of policies that produce enough highly qualified mathematics teachers and the continuity of these policies from development to implementation Because of the complexity entailed in defining a route in countries with a decentralized or federalized governance structure specific states or provinces were selected with the recognition that policy structures vary widely by stateprovince and that even within a stateprovince alternative pathways to credentialing vary as well
Component 2studies of elementary and lower-secondary mathematics teacher-preparation routes programs standards and expectations for teacher learning
ObjeCtiveTo examine the intended and implemented curricula in teacher education
QuestiOnsa) What kinds of institutional and field-based opportunities are provided to future
elementary and lower-secondary mathematics teachers
b)Howareprogramexpectationscurriculaandstandardsenacted
c) What are the qualifications and prior experiences of the university mathematics lecturersprofessorsinstructors and teacher educators responsible for the implementation of these programs
d) What factors explain how much impact routes programs and practices have on the mathematics knowledge of future mathematics teachers
Data-COlleCtiOn instruments1 Institutional Questionnaire on Teacher-Preparation Programs
This questionnaire asked questions regarding the nature and depth of mathematics taught to future teachers in general education and in the professional curriculum the kind of program future mathematics teachers followed (ie consecutive or concurrent) the standards for teacher preparation in mathematics the kinds of assessments and the level of performance required and the pedagogical preparation and mathematics-specific pedagogical preparation It also included questions on the resources used to operate teacher-education programs as well as on the general profile of teacher educators (eg credentials professional path courses taught) For countries that had a concurrent route only future teachers in the last year of teacher education were surveyed and their knowledge of mathematics was approximated from the study of the national curriculum
6
TEDS-M used a national probability sample of teacher-education institutions in each countryIn countries where institutions offer both elementary and secondary education one sample combining elementary and secondary schools was chosen for each route In cases where institutions offer more than one route the frame was organized by the number of routes an institution offered Some countries opted to select a cohort of students at the beginning of their teacher education In that case the larger of the two cohorts was used as the measure of size
Target population secondary or postsecondary institutions that offered opportunities to learn (OTL) to future elementary and secondary mathematics teachers within a major route
Sampling frame routes that could lead to elementary and secondary school teaching were identified Within each route eligible institutions within the target population were identified with some measure of size (eg number of future elementary andor secondary school teachers in their final yearrsquos cohort) If the figures for elementary and secondary grades were difficult to obtain more readily available figures were used for the total size of these populations at the elementary or lower-secondary levels including the required stratification variables
Sample design stratification was done by additional attributes such as type of institution urbanrural setting sub-national region or administrative jurisdiction The selection was made using a stratified probability proportional to size (PPS) systematic sample design Some national conditions made this design choice impractical in which case the national design was approved by the sample referee in agreement with the TEDS-M Joint Management Committee
Sample size at least 50 institutions from each route were sampled Countries with much smaller numbers of institutions conducted census sampling Countries with much larger numbers of institutions sampled institutions
2 Questionnaire for Mathematics Instructors and Teacher Educators
This questionnaire collected data from mathematics instructors and teacher educators on their background their mathematics-teaching knowledge the materials used in their instruction their beliefs about mathematics and their expectations for future teachers Parts of this questionnaire were similar to the Future Teacher Questionnaire (see below) in order to examine correspondence and differences between faculty and future teachers (on such things as knowledge pedagogy and beliefs) as an indicator of coherence between these two populations
TEDS-M sampled mathematics instructors and teacher educatorsIf the sub-sampling of instructors was deemed required or appropriate a list of eligible instructors was drawn and a sample plan was submitted for acceptance
Target population persons with regular repeated responsibility to instruct or mentor future elementary and lower-secondary mathematics teachers within a given route
7
Sampling frame a list of eligible instructors at each sampled teacher-education institution with a minimum of four strata was established as follows (1) instructors of mathematics whose primary responsibility is to teach the content of mathematics (2) teacher educators whose primary responsibility is to help students understand the pedagogy and learning of mathematics in elementary andor secondary schools (3) other teacher educators in an academic component and (4) other teacher educators in a field-experience component These four strata applied to instructors of both elementary and lower-secondary future teachers when appropriate
Sample design all eligible instructors at sampled institutions were to be surveyed Howeversomenationalconditionsmadethisdesignchoiceimpracticalinwhichcasethe national design was approved by the sample referee in agreement with the TEDS-M Joint Management Committee
Sample size in nearly all institutions it was expected that the number of eligible instructors would be too small for sub-sampling in at least one and frequently more than one of the strata Sub-sampling was used only when the number of respondents within the stratum of a sampled institution was larger than needed and overly burdensome to survey
3 Content Analysis of the Teacher-Education Mathematics Curriculum
A protocol was developed to analyze syllabi and sample assignments from teacher-education mathematics curricula in relation to mathematics standards for elementary and secondary students in participating countries and to the Trends in International Mathematics and Science Study (TIMSS) international database of mathematics content standards In addition the protocol examined the relation between the content and performance expectations of courses in mathematics teacher-education curricula and the local or national examinations for teacher certification or licensing These analyses produced an initial profile of the implemented curricula in mathematics teacher education in terms of the knowledge pedagogy dispositions and other knowledge that future teachers are exposed to as they get ready to teach
Component 3studies of the mathematics and related teaching knowledge of future elementary and lower-secondary school teachers
ObjeCtiveTo examine the intended and achieved outcomes of teacher education focusing on answering the following research questions
QuestiOnsa) What is the content knowledge of mathematics that future teachers are expected to
acquire in the participating countries
8
b) What is the depth of understanding that they are intended to attain
c) What beliefs about the teaching and learning of mathematics are promoted by teacher-education programs What beliefs do future teachers hold about teaching and learning mathematics at the end of their preparation
d) What is the knowledge for mathematics teaching (eg of the content pedagogy curriculum and attitudes) that future elementary and lower-secondary mathematics teachers actually have at the end of their teacher preparation and once they are considered ldquoready to teachrdquo
e) What other characteristics help to explain future mathematics teachersrsquo ability to master this knowledge
Data-COlleCtiOn instrumentFuture Teacher QuestionnaireThis questionnaire measured the intended and achieved mathematics and teaching-related knowledge and beliefs among future teachers
The questionnaire asked future teachers about their
bull academicbackgroundbull mathematicscontentknowledgebull knowledgeofmathematics-specificpedagogyandofgeneralpedagogybull beliefsconcerningstudentsrsquodispositionsandabilitieswhenlearningmathematicsbull beliefsaboutpurposesforlearningmathematicsbull self-perceptionoftheirlevelofpreparednesstoteachmathematicseffectively
TEDS-M used a national probability sample of future teachersThe sample was distributed among the selected teacher-education institutions as evenly as possible Some countries opted to sample from both beginning and ending cohorts Countries that opted to allow for sub-national comparisons ensured that an effective sample size was selected from each of the sub-national domains of interest and adjusted their total sample size accordingly
Target population Future teachers were defined as all members of a route starting from the point at which they were enrolled in a formal OTL explicitly intended to prepare teachers to teach mathematics in any of the grades included in the elementary and secondary levels in their last year of teacher education
Sampling frame A list of eligible students in their last year of teacher education from each sampled institution within identified routes was established In institutions that prepared teachers for both elementary and lower-secondary schools both domains were sub-sampled
Sample design The simplest approach was used an equal-size simple random sampling of eligible future teachers from the sampled institutions
Sample size An effective national sample size of 400 future elementary and secondary teachers for each route was desired
9
The TEDS-M final report is bringing together the three componentsThe route and institutional profiles of teacher education the institutional questionnaire the curriculum analysis and the instructorteacher-educator data will provide an institutional-level as well as a larger contextual frame for the analysis of program data collected in this study These data will help to refine key concepts and clarify the theorized coherence in order to facilitate further analysis across and within programs as they influence teacher knowledge (via curriculum and instruction) The data collected from the Future Teacher Questionnaire are correlated with the institutional data in order to construct profiles of the intended implemented and achieved curriculum for mathematics teachers by country route and institution
Participating countries in TEDS-Mbull Botswanabull Canadabull Chilebull Georgiabull Germanybull Malaysiabull Norwaybull Omanbull Philippinesbull Polandbull RussianFederationbull Singaporebull Spainbull Switzerlandbull Taiwan(ChineseTaipei)bull Thailandbull UnitedStates
The Canadian administrationInCanadaeducationistheexclusiveresponsibilityofprovincesandterritoriesThusthereis no national system of teacher education and certification in the country and individual jurisdictions determine whether they wish to participate in international education-related projectssuchasTEDS-M
FourCanadianprovinceschosetoparticipateinTEDS-MNewfoundlandandLabradorNovaScotiaOntarioandQuebecSixofOntariorsquos13institutionsparticipatedsixofQuebecrsquos12institutionsparticipatedtwoofNovaScotiarsquosfourinstitutionsparticipatedasdidthesingleinstitutioninNewfoundlandandLabrador
10
The Canadian administration was carried out between March 7 and April 30 2008 An exception was made for one institution to accommodate the length of its studentsrsquo practicum therefore that administration was carried out in May
The sample was drawn randomly from a list of all possible participants supplied by each institution A sample of 40 future teachers was drawn for each institution their professors were selected to complete the survey
Structure and organization of teacher education in CanadaTeacher education is offered at a total of 56 institutions in Canada A small number of these are affiliates of larger institutions and include English and French programs within the same institution for program purposes English and French programs within one institution are considered independent units The total number of institutions has not changed much in recent years Multiple institutions are found in all but two provinces Newfoundland and Labrador and Prince Edward Island There are no programs in Canadarsquos three territories as they tend to draw their teachers from the provincial teacher-education institutions across the country
Approximately 50000 students are enrolled in teacher-education programs each year (Statistics Canada 2008) The enrolment trend over time has been toward a slight decline in the 1990s followed by a slight increase since 2000 The ratio of females to males is more than 31 and there has been a slight increase in this ratio in recent years Just under 40 per cent of those enrolled or about 18000 students graduate in any one year a figure thathasremainedfairlyconstantinrecentyearsHoweverduetotherangeofone-yearand multi-year education programs offered this percentage cannot be taken as a direct measure of productivity
Programs range widely in size enrolling from fewer than 100 to almost 4000 students and graduating from about 30 to more than 1200 students per year The number of faculty members ranges from as low as 6 to more than 150 per institution Program size appears to be linked to program variety and specialization For example programs in small institutions may have a liberal-arts focus based on the argument that a general program in liberal arts and the foundations of education is appropriate preparation for teaching at any level Such universities tend to consider their small size a virtue and in their promotion they tend to highlight their small classes the close ties between faculty and students and their focus on liberal arts
In general there are two routes to graduation at teacher-education institutions mdash concurrent or consecutive Concurrent programs usually offer four years of both professional education courses along with academic courses Some of these concurrent programs lead to the Bachelor of Education (BEd) degree others requiring five years of study lead to a degree in an academic specialty as well as a BEd Consecutive programs require candidates to first obtain an academic degree in order to be accepted into a program of studies in education
11
usually concentrated in one or two years (two to four semesters) The duration is related to certification requirements for example a two-year program following a first degree is the minimum requirement for certification in Nova Scotia while a one-year program is required for certification in Ontario
Some institutions offer only one route while others offer both routes The general trend across most provinces is toward consecutive programs The exception is Quebec where almost all programs offer concurrent studies
Because most jurisdictions have strong incentives for upgrading academic credentials built into their salary scales most teachers continue their academic education beyond the first degree For this reason it is common for teachers to possess two undergraduate degrees one in an area of academic specialization and a BEd or equivalent In any event two degrees is the normal outcome of consecutive teacher-education programs Across Canada close to 20 per cent of teachers have a masterrsquos degree usually in education The proportion holding advanced degrees varies across jurisdictions and is linked to the structure of the certificationsalary scale
In either of the two routes to a BEd most institutions offer programs at two levels elementary and secondary Teachers of the elementary grades are usually considered generalists while teachers at the secondary level are expected to specialize in one or more disciplines Consequently most elementary programs are concurrent and most secondary programs are consecutive The specialization associated with an academic degree in a major subject area is considered desirable for secondary teachers The concept of a ldquoteachable subjectrdquo that is a discrete subject in the provincial curriculum is often transferred from certification requirements to academic major subjects creating the expectation that the academic major is some subject that can be taught in schools
In some jurisdictions teaching certificates are endorsed only for specific levels or subjects Howeverthedegreetowhichtheteachersholdingtheseendorsedcertificatesarerestrictedto their defined areas of specialization varies by jurisdiction and location and depends on teacher supply and demand
Beyond the two program routes and the two levels for which teachers are prepared a variety of more specialized programs can be found For example physical education and music are often separated from mainstream programs and offered either through the respective academic units or through collaborative arrangements between programs Special education second-language teaching Aboriginal studies and technological studies are other examples of areas in which specialized programs have been developed Sometimes these are organized as separate degrees (such as a Bachelor of Special Education or a Bachelor of Physical Education) but these areas are also specializations within the mainstream degrees
All teacher-education programs require student teachers to participate in some in-school teaching experience referred to variously as a practicum an internship or student teaching Indeed this is generally a significant component of teacher-education programs The long-term trend is toward longer in-school placements distributed throughout the program rather than concentrated at the end
12
Programs in specific jurisdictionsTEDS-M from the International Association for the Evaluation of Educational Achievement (IEA) was conducted in four Canadian jurisdictions mdash Ontario Quebec Nova Scotia and Newfoundland and Labrador
OntariOThere are 14 publicly assisted faculties of education in Ontario universities together they enrol approximately 13000 students and graduate about 8000 teacher candidates per year All of the publicly assisted faculties of education offer programs in English and two offer programs in French
Almost all Ontario institutions offer consecutive programs of two semestersrsquo duration to students who already have a bachelorrsquos degree The practicum ranges from a minimum of 42 days to over 60 days depending on the institution The number of graduates from teacher-education programs ranges from fewer than 100 per year to more than 1000 per year in the larger institutions although most programs enrol at least several hundred students A three-level structure categorized into PrimaryJunior (Grades Kndash6) JuniorIntermediate (Grades 4ndash10) and IntermediateSenior (Grades 7ndash12) is typical and this structure conforms to the structure for teacher certification This allows teachers to be certified to teach a range of grade levels Some more highly specialized programs are offered in areas such as music second-language teaching and technological studies Candidates for admission to the faculties of education in Ontario apply through the central Teacher Education Application Service (TEAS) which allows applicants three choices of institution or program Individual universities conduct their selection of candidates
Teacher certification in Ontario is governed by an independent body the Ontario College of Teachers (OCT) The governing council of this body comprises 23 teacher-members elected by members of the college and 14 members of the public appointed by the provincial government and broadly representative of other stakeholders in education Graduates of teacher-education programs at Ontario universities apply to OCT for a general certificate of qualification and registration as their licence to teach OCTrsquos ldquoTransition to Teachingrdquo studies indicate that early in the decade the province was experiencing a generalshortageofteachersHoweverinrecentyearsOntariorsquosemploymentmarkethasbeen characterized by an oversupply of teachers in most subject areas as the number of new teachers entering the profession has substantially increased and the number of teachers leaving the profession or retiring has declined (Ontario College of Teachers 2009)
QuebeC Twelve institutions offer teacher-education programs in Quebec nine in French and three in English Close to 18000 students are enrolled in these programs and about 4000 graduate per year This rate reflects the concurrent nature of most Quebec programs under which students take four years to complete the BEd degree Typically programs are divided into elementary and secondary levels with many more specialized programs Candidates for teaching at the elementary level are prepared as generalists candidates for teaching at the secondary level are expected to specialize in subjects or subject clusters corresponding to those taught in secondary schools Most programs are specifically designed to prepare candidates for certification as teachers in Quebec
13
Teacher certification in Quebec is governed by the Comiteacute drsquoagreacutement des programmes de formation agrave lrsquoenseignement (CAPFE) [committee on accreditation of teacher-training programs] a representative body of stakeholders CAPFE is responsible for accrediting teacher-training programs in the province and it is an autonomous independent body created and funded by the Ministry of Education Recreation and Sports
The most recent work on teacher supply and demand in Quebec was a report by the Service des eacutetudes eacuteconomiques et deacutemographiques [department of economic and demographic research] dated November 2004 The report (Ministegravere de lrsquoEacuteducation du Queacutebec 2004) noted that teacher shortages were expected for teachers of French language arts and social sciences in the period from 2005 to 2007 due to changes to the curricula There would also be shortages in 2006 in the number of second-language (French and English) teachers arts teachers and physical-education teachers It was also expected that there would be a deficit in mathematics and science teachers in French-language schools The report also predicted that declining enrolment in schools would lead to a major surplus of teachers in all disciplines for 2008 to 2013
nOva sCOtiaFour institutions in Nova Scotia offer teacher-education programs three in English and one in French All these programs are relatively small compared to national averages with approximately 900 students and 400 graduates per year in total This represents a substantial decrease from the early 1990s when an external review led to the closure of programs at several institutions and a reduction in the number of students accepted into teacher education That review also led to the establishment of the only system in Canada in which a two-year (four-semester) consecutive program is the norm and a requirement for certification
Nova Scotia is one Canadian jurisdiction in which high-profile government-commissioned external reviews have had an impact on teacher education The most recent review completed in 2008 (Nova Scotia Department of Education 2008) addressed both program structures and labour-market issues The major labour-market concern was the continued oversupply of teachers despite the significant constraints imposed following the previous review The oversupply was attributed to the continuing substantial demand for places many students move to other jurisdictions to complete their programs encouraged by arrangements negotiated between Nova Scotia universities and institutions outside the province these students then return to Nova Scotia seeking certification As a consequence a recent Nova Scotia study of teacher supply and demand predicted that supply will exceed demand by a ratio of close to 31 from now until 2014 with approximately 1000 teachers entering the system every year and only about 360 leaving (Nova Scotia Department of Education2007)Howevershortageswouldcontinuetobefeltinspecificgeographicalareas of the province and in some subject areas (but not in mathematics)
Teacher certification in Nova Scotia is administered by the Department of Education The Office of Teacher Certification is advised by a representative committee of stakeholders appointed by the minister of education
14
newfOunDlanD anD labraDOrNewfoundland and Labrador has only one university offering teacher-education programs A total of approximately 1000 students register and about 500 graduate annually The main program divisions are referred to as PrimaryElementary and Intermediate Secondary The PrimaryElementary program is concurrent requiring a total of five years to complete Students enter the professional component usually in the third year The IntermediateSecondary program is a three-semester consecutive one completed over 14 months Specialized programs are available in music physical education technology special education and other areas All programs are designed to meet the provincersquos teacher-certification requirements
Teacher certification in Newfoundland and Labrador is governed by a representative body of stakeholders and the system is administered by the Department of Education The most recent comprehensive study of teacher supply and demand in Newfoundland and Labrador was completed in 2001 At that time Dibbon and Sheppard (2001) found that in spite of a large pool of substitute teachers in the province the supply of teachers in the specialized areas of mathematics and science was low and remote communities had difficulty recruiting teachers Since that time both the number of new positions and of new graduates per year have increased suggesting that the supply-demand ratio has not changed very much
A recent review of school mathematics programs in Newfoundland and Labrador (Atlantic Evaluation and Research Consultants 2007) which included a comprehensive survey of mathematics teachers revealed that only a small proportion (about 10 per cent) of elementary school teachers have mathematics as their major area of study The proportions are much higher for Grade 9 (72 per cent) and for senior-secondary school (83 per cent)
The administration of the TEDS-M survey in CanadaAs stated previously TEDS-M was administered in four provinces in Canada (Ontario Quebec Nova Scotia and Newfoundland and Labrador) These four provinces mandated the Council of Ministers of Education Canada (CMEC) to act as the National Research Centre (NRC) responsible for the coordination of the study
NRC was responsible for representing provinces at international meetings adapting translating and approving all assessment and questionnaire materials sampling institutions educators and future teachers in accordance with international guidelines contacting participating institutions and sending and collecting materials arranging for quality-monitoring of the administration arranging the coding of curriculum documents questionnaires and assessment materials capturing and validating all data and analyzing the data and publishing the national report
15
representatiOn at internatiOnal meetingsThe International Study Centre (ISC) for TEDS-M was located at Michigan State UniversityISCwasresponsiblefortheplanningimplementationandreportingofallaspects of the study at the international level A conceptual framework (Tatto et al 2008) guided the design of the study Throughout the development of the framework and of all instruments the international group of experts from ISC consulted NRC on a regular basis including at biannual meetings
aDaptatiOn translatiOn anD apprOval Of assessment anD QuestiOnnaire materialsAll materials were developed by ISC in English and approved by all participating countries Individual countries were responsible for adapting materials for use in their own country and for translating all materials into the target language(s) for the country In Canada TEDS-M was administered in English and in French and all documents (manuals questionnaires coding guides) had to be approved by ISC prior to the administration
Sampling institutions
In order to ensure that valid cross-national comparisons could be made ISC implemented strict sampling guidelines based on national probability samples In Canada with only four provinces participating it was determined that all 31 institutions in these provinces wouldbeinvitedtoparticipateHoweverinstitutionsrsquoparticipationwasvoluntaryandtheinstitutional response rate was very low (37 or n=10) This could be explained in large part by the fact that the administration of the survey was occurring at the end of April a very busy period for institutions with end-of-term exams and practica In several cases institutionsrsquo research-ethics committeesboards did not have sufficient time to review the application to conduct the study
A total of 94 educators were sampled in the 10 participating institutions Again it was determined to invite all educators (of pedagogy mathematics and mathematics pedagogy) to participate Overall 74 educators responded to the questionnaires a response rate of 79 per cent
For the reasons stated above the response rates for future teachers were also very low Overall 183 future teachers at the elementary level and 155 future teachers at the secondary level participated (response rates of 69 per cent and 79 per cent respectively)
As a result of these low response rates (overall and within institutions) the sampling referee determined that the Canadian sample was not sufficiently representative of the overall population and ISC elected to report all Canadian results in appendix to the international report and did not include Canada in all international comparisons
16
COntaCting institutiOns anD senDing anD COlleCting materialsAdministering the TEDS-M survey was a collaborative task shared between the National Research Centre institutional coordinators and survey administrators
Institutional coordinators were responsible for seeking the participation of educators and of future teachers as well as for most administrative arrangements for the TEDS-M main study at the institution including providing a list of future teachers and educators administering educator and institutional questionnaires and collecting syllabi
The National Research Centre appointed survey administrators to administer the sessions to future teachers Survey administrators were selected on the basis of their experience If possible individuals who had previous experience in survey or test administration (eg the Trends in International Mathematics and Science Study the Progress in International Reading Literacy Study the Programme for International Student Assessment) were selected These survey administrators reported directly to the National Research Centre
Quality mOnitOringIn all participating countries approximately 10 per cent of participating institutions were visited during the administration of the survey International quality monitors ensured that the administration procedures were strictly followed and provided detailed reports to ISC
Generally the institutional coordinator was responsible for identifying the most suitable individual who could complete the institutional questionnaire The respondent was asked to complete the questionnaire confidentially and return it to the institutional coordinator It took approximately two hours to complete this questionnaire
The institutional coordinator was also responsible for identifying all educators who were teaching to the target population of future teachers at the time of the administration The questionnaire for educators took approximately 30 minutes to complete
The questionnaire for future teachers was administered by the survey administrator over a two-hour uninterrupted period There were two different versions of the Future Teacher Questionnaire one for elementary teachers and one for secondary teachers In each case several equivalent forms of the questionnaires were used Three of the four sections were equivalent across all forms of the questionnaires General Background (5 minutes) Opportunity to Learn (15 minutes) and Beliefs about Mathematics and Teaching (10 minutes) The Mathematics Knowledge for Teaching section (60 minutes) differed across booklets with some anchor questions to ensure equivalence across forms Some sample questions can be found in the section below
17
CODingDescription of teacher-education courses and collection and coding of syllabi
In all participating institutions the institutional coordinator asked participating educators to provide the course syllabus for each course they were teaching at the time of the data collection These syllabi were sent to the National Research Centre for coding (see Appendix I for a sample of a coded syllabus)
Syllabus analysis is a systematic method of obtaining comprehensive information from syllabus documentation and materials It examines content sequence (when and what topics are intended) and when appropriate performance expectations (what students are expected to do with the content) at the institutional and course levels Qualitative coding protocols were used to capture the coursesrsquo academic content
TEDS-M used a low inference procedure to perform the analysis to reliably investigate the opportunities to learn in different institutions and different countries In addition to understanding how to code the different syllabi coders developed a high level of reliability when coding Inter-coder reliability was closely monitored at the international level An example of the syllabus-coding activity can be found in Appendix I
Coding of mathematics content knowledge and mathematics pedagogical content knowledge
As described in the TEDS-M conceptual framework teaching mathematics consists of two constructs mathematics content knowledge and mathematics pedagogical content knowledge (see Appendix II for sample items) Each question in the Mathematics Knowledge for Teaching section measured one of the four content domains (number geometry algebra data) and one of the three cognitive domains (knowing applying reasoning) Each question in the Mathematics Pedagogical Content Knowledge section measured one of the three aspects of the framework (mathematical curricular knowledge knowledge of planning for mathematics teaching and learning enacting mathematics for teaching and learning)
Coding of all the knowledge questions took place in a central location All coders were graduating future teachers of mathematics who received extensive training Coder reliability was closely monitored throughout the coding session In Canada all coding took place in both English and French ensuring a high degree of consistency across languages
18
ResultsAs mentioned previously TEDS-M surveyed three populations institutions educators and future teachers This section presents some selected Canadian results from the three surveys Due to the very low response rates it should be noted that these results are descriptive of the participating respondents generalizations made to the entire population are not advised
institutional program QuestionnaireOverall 82 questionnaires were distributed to 10 participating institutions because these offered more than one program In some cases institutions offered consecutive andor concurrent programs in others they offered programs at the elementary andor secondary levels and in others yet programs in English andor French All these possible variations explain the number of questionnaires analyzed
HerearesomefindingsfromtheInstitutionalProgramQuestionnaire
bull Amajorityofinstitutions(65)preparefutureteacherstoteachinbothelementaryand secondary schools and there are as many concurrent as consecutive programs represented in the sample
bull Over60ofinstitutionsrequirefutureteachersundertakingtheprogramtohavecompletedatleastGrade12mathematics(advancedorregular)However26of programs do not require a minimum level of mathematics for future teachers
bull Almost all institutions (87) within guidelines set by regional or provincialauthorities set policies governing which applicants are admitted to the program
bull When selecting students for their teacher-preparation programs institutionspay particular attention to candidatesrsquo suitability for teaching which may be assessed by an interview or a written application or by their demonstrated high level of achievement in mathematics (with 87 and 65 of institutions rating thesecriteriaassomewhatimportantorveryimportantrespectively)Howevercandidatesrsquo overall achievement level (91) and performance at the end of the school year (100) are either not considered or considered not important for selection purposes This finding would need to be investigated further as it seems to be inconsistent with findings from Crocker and Dibbon (2008) which suggest that institutions do consider minimum averages in a set of prerequisite courses especially in a competitive environment where the number of applicants exceeds the number of places
bull Withrespecttoprovincialnormsrespondentsviewfutureteachersenteringtheprogram as either high- or above-average achievers (44 and 52 respectively)
bull In theprogramsunder study respondents state thateithermoderateormajorweight is placed on the following program goals
m planning lessons based on recommended pedagogical principles (100)m learning to reflect on onersquos own learning and teaching practices (100)m studying the content of the school curriculum and of the mathematics
curriculum to be taught (100)
19
bull Nolittleoronlysomeweightisplacedonthefollowinggoals
m interpreting data from externally conducted tests (69)m studying mathematics or other disciplines at the tertiary level (65 and
69 respectively)m learning specific strategies and curricula for teaching gifted students (61)m developing the knowledge and skills to do teacher action research (70)
bull Intermsofinstitutionalrequirementsforsuccessfullycompletingtheprogramallrespondents (100) state that future teachers must pass all courses required for the program successfully demonstrate a required level of teaching competence in the classroom and receive a passing grade on their field experience None of the programs require future teachers to write a thesis and only a few (less than 10) require future teachers to pass a written or an oral examination
bull Inabout three-quartersof theprograms teacherswhomentor future teachersduring their extended field practice receive some form of compensation As part of their responsibilities these mentors are expected in all programs to observe future teachers in classrooms They are also expected to provide a formal summative assessment and written narrative reports of the field practice
bull Generally institutionsare responsible forfindingplacements for theextendedteaching practice (in 82 of programs) and although about half of the institutions have no difficulty finding suitable placements for future teachers another 30 state that appropriate placements are not readily available in sufficient numbers
bull Ofthefacultyemployedtoteachmathematicsormathematics-relatedcontentto future teachers all institutions indicate that a masterrsquos degree would normally be required and 70 of institutions would normally require a doctorate Few institutions require that these educators be qualified to teach or have experience teaching at the elementary or secondary level However educators teachingmathematics pedagogy are normally expected to have some experience teaching at the elementary or secondary level in about half of the programs It should be noted that this relative lack of a requirement for teaching experience in some programs does not mean that many educators do not have some teaching experience This is illustrated below by the fact that more than half of the surveyed educators held a teaching certificate All institutions require that mentors supervising the extended teaching practice hold at least a bachelorrsquos degree and in 78 of the programs mentors are expected to hold a masterrsquos degree
survey for mathematics mathematics pedagogy and general pedagogy educatorsOverall 194 questionnaires were distributed and 94 questionnaires were returned
bull The academic rankof the respondentswaswell distributed across all possibleranks with 19 being professors 16 being associate professors 23 assistant professors 17 lecturers 14 instructors and 11 in other roles There were slightly more females (56) than males
20
bull Oftheseeducators27hadadegreeineducation14inmathematicseducationand 10 in mathematics at the doctoral level or higher These figures should be interpreted with caution As stated above a large number of respondents to the survey were likely to be sessional appointees
bull Fifty-twopercentofrespondentsheldateachingcertificateatthetimeofthestudy one-third has never held a teaching certificate
bull Onaveragetheseeducatorshavespentapproximately10yearsattheircurrentinstitutions and about seven years in their teacher-preparation role They teach mostly at the undergraduate level (93) but also at the masterrsquos level (48) and in some cases at the doctoral level (18) In terms of experience 30 have been involved in instructing or supervising future teachers for over 10 years but 37 have done this for three years or less suggesting the existence of a cadre of educators with relatively little experience at least when considering the general profile of the respondents
bull Overthepast12monthsmorethanhalfoftheseeducatorshavenotparticipatedin any professional-development activities related to mathematics or mathematics pedagogyHoweverover60hadparticipatedinatleastsixhoursofprofessionaldevelopment in general pedagogy
bull In thepastyear respondentshavespentabout30of theirworkingtimeonresearch and research-related activities
bull Whenaskedtoconsiderallcoursesintheteacher-educationprogramsofferedattheir institutions about 80 of these educators felt that each stage seemed to be planned to meet the main needs of future teachers at each stage of their preparation and that the programs were organized in a way that covered what future teachers needed tobecomeeffective teachersHowever30disagreed that therewereclear links between most of the courses in the program of study
bull When asked to describe future teachersrsquo level of preparedness for teachingmathematics as they complete the teacher-education program and start their teaching careers 80 or more of these educators felt that future teachers were prepared to a moderate or major extent to clearly communicate ideas and information about mathematics to students that they could establish appropriate learning goals in mathematics for students and that they could set up mathematics learning activities to help students achieve learning goals Conversely over a third of these educators felt that future teachers were not at all or just to a minor extent prepared to use computers and information and communication technology (ICT) to aid in teaching mathematics and to provide parents with useful information about studentsrsquo progress in mathematics Further research would be useful to compare the views of teachers principals and faculties regarding the level of preparedness in using ICT to teach mathematics
bull Finally almost 80 of educators felt that their pre-service teacher-educationprograms were effective or very effective in preparing future teachers of mathematics
21
survey for future teachers of lower-secondary mathematicsOverall 282 questionnaires were distributed to future teachers at the secondary level and 155 were completed
bull Themedianageofrespondentswas24yearsand61werefemalesAbout86of respondents always or almost always spoke the language of the questionnaire at home Eighty-three per cent had taken a calculus or pre-calculus course in high school When comparing themselves to other students at the same grade level in their schools 82 saw themselves as being at the top or near the top of their class in terms of marks
bull Whenaskedtoidentifythemainreasonswhytheydecidedtobecometeachersthese future teachers at the secondary level mentioned their perception of teaching as a challenging job their desire to have an influence on the next generation their desire to work with young people their belief that they have a talent for teaching and their love of mathematics as the most significant reasons For the most part they were not influenced by teacher salaries the availability of teaching positions or the fact that they had always been good students in school
bull Almosthalf(47)ofthesefutureteacherssaidthatneedingtoborrowmoneyhindered their studies during their teacher-preparation programs
bull Almostallfutureteachersatthesecondarylevel(95)thoughtthattheywouldor could possibly spend their entire career as a teacher
bull Theserespondentswereaskedtoconsideranumberofmathematicstopicsandtoindicate which ones they had or had never studied Over 80 stated that they had studied calculus linear algebra probability and theoretical or applied statistics Fifty per cent or more stated that they had never studied topology differential geometry theory of real or complex functions or functional analysis or abstract algebra In the context of their teacher-education programs more than half also said that they had not studied validation structuring and abstracting or calculus In terms of emphasis three-quarters said that in their programs they studied mathematics at the level of the school curriculum
bull Intermsofmathematicspedagogyover80saidthattheirprogramscoveredmathematics instruction mathematics standards and curriculum and the development of teaching plans Their programs allowed them to engage in the following activities most often accommodating a wide range of abilities in each lesson exploring how to use manipulatives and creating learning experiences that make central concepts under study meaningful to students The activities that were mentioned the least often were using standardized tests to guide decisions about what and how to teach using assessment to give feedback to parents or guardians and helping students learn how to assess their own learning
bull Whenlookingateducationandpedagogytopicsoverathirdofthesecondary-levelfuture teachers said that they had not studied methods of educational research or the history of education and educational systems
22
bull Withregardtotheirpracticaover60agreedthatthefeedbacktheyreceivedfromtheir mentors helped them to improve their teaching methods that this feedback helped them to improve their understanding of their students and that they had a clear understanding of what their mentors expected of them as teachers in order to pass the practica
bull Regardingtheperceivedoveralleffectivenessoftheirpre-serviceteacher-educationprograms almost a quarter of these future teachers at the secondary level felt that the programs were not effective in preparing them to teach mathematics
survey for future teachers of elementary mathematicsOverall 580 questionnaires were distributed to future teachers at the elementary level and 183 were completed Although the number of respondents is quite substantial the response rate is below the international standard therefore any generalization to the population of future elementary teachers should be made with extreme caution
bull Eighty-sevenpercentofrespondentsofthisquestionnairewerefemaleThismaybe slightly higher than the overall population of elementary teachers Based on the Progress in International Reading Literacy Study (2006) data in which five provinces participated the figures would vary between 72 and 86 for female teachersattheelementarylevelUnfortunatelynoofficialdataareavailableatthepan-Canadian level for this aspect
bull About95alwaysoralmostalwaysspokethelanguageofthequestionnaireathome Only 40 had taken a calculus or pre-calculus course in high school which is much lower than for future teachers at the lower-secondary level When comparing themselves to other students at the same grade level in their schools about half of the respondents saw themselves as being at the top or near the top of their class in terms of marks again a much lower percentage than for the lower-secondary level
bull Whenaskedtoidentifythemainreasonswhytheydecidedtobecometeachersthese future teachers at the elementary level had very similar response patterns to those at the lower-secondary level They mentioned their talent for teaching their perception of teaching as a challenging job and their desire to work with young people and to have an influence on the next generation as the most significant reasons For the most part they were not influenced by teacher salaries the availability of teaching positions or their love of mathematics (which is logical since elementary-level teachers are normally generalists)
bull Theserespondentswereaskedtoconsideranumberofmathematicstopicsandtoindicate which ones they had or had never studied As can be expected the vast majority had not studied many advanced topics in mathematics with over 90 not having studied advanced calculus abstract or linear algebra or theory of real or complex functions or functional analysis In fact the only advanced topics
23
studied by more than half of these respondents were probability and number theory In the context of their teacher-education programs over 85 said that they had not studied calculus validation or structuring and abstracting In terms of emphasis almost 90 said that in their programs they studied mathematics at the level of the school curriculum and 63 said that their learning was at a deeper or more conceptual level than that of the school curriculum
bull Intermsofmathematicspedagogyover80saidthattheirprogramscoveredmathematics instruction mathematics standards and curriculum and mathematics teaching per se Their programs allowed them to engage in the following activities most often exploring how to use manipulatives creating learning experiences that make central concepts under study meaningful to students locating suitable curriculum materials and teaching resources and developing games or puzzles accommodating a wide range of abilities in each lesson and building on studentsrsquo existing mathematics knowledge and thinking skills The activities that were mentioned the least often were using standardized tests to guide decisions about what and how to teach using assessment to give feedback to parents or guardians and helping students learn how to assess their own learning (similar to lower-secondary respondents)
bull Whenlookingateducationandpedagogytopicsoverathirdoftheelementary-level future teachers said that they had not studied methods of educational research or the history of education and educational systems
bull Withregardtotheirpracticaaswasthecaseforthelower-secondarylevelover60 agreed that they had a clear understanding of what their mentors expected of them as teachers in order to pass the practica that the feedback they received from their mentors helped them to improve their teaching methods and that this feedback helped them to improve their understanding of their students A large proportion of these respondents also felt that their mentors valued the ideas and approaches they brought from their teacher-education programs
bull Regardingtheperceivedoveralleffectivenessoftheirpre-serviceteacher-educationprograms elementary-level future teachers were generally more pleased than secondary-level future teachers with their programs in preparing them to teach mathematics
An important contribution of TEDS-M is the assessment of participating future teachers with regard to their knowledge of mathematics of mathematics pedagogy and of general pedagogy The design of TEDS-M lends itself to the ranking of countries according to theirmeanscoresonthesethreeareasHoweverinternationalcomparisonsbasedontheserankings are not desirable because these mean scores are relatively unstable due to the small number of respondents in several participating countries Moreover since Canada did not meet the sampling requirements the Canadian data must be treated with extreme caution For the same reason no results are provided by province although ministries and departments of education have access to their own data in order to analyze their results according to their own contexts
24
What may be most useful in the Canadian context is to look at countries that tend to perform better on this knowledge component and to analyze their contextual factors which may help to explain their results Furthermore it should be kept in mind that teacher-education programs in Canada are far from homogeneous mdash even within a province mdash and that it may be more useful to analyze the contextual factors in each province taking into account the limitations of the study
Results are presented separately for teachers at the elementary level and teachers at the lower-secondary level and are broken down for mathematics content knowledge and mathematics pedagogical content knowledge Results are scaled with an international mean of 500 and a standard deviation of 100
Figure 1 Mean scores and confidence intervals for participating countriesmdash Elementary-level future teachersrsquo mathematics content knowledge
Note The Canadian average score is not part of the international average score due to Canadas low response rates
Poland (490)
Malaysia (488)
Spain (481)
Canada (522)
Georgia (345)
Chile (413)
Botswana (441)
Philippines (440)
International (500)
Germany (510)
Thailand (528)
Norway (519)
United States (518)
Russian Federation (535)
Singapore (590)
Switzerland (543)
Chinese Taipei (623)
Below the international average
At the international average
Above the international average
330 350 370 390 410 430 450 470 490 510 530 550 570 590 610 630
95 Confidence interval
Estimated mean score
25
Figure 2 Mean scores and confidence intervals for participating countriesmdash Elementary-level future teachersrsquo pedagogy content knowledge
Note The Canadian average score is not part of the international average score due to Canadas low response rates
Among the other 15 countries participating in the study elementary-level future teachers from Chinese Taipei and from Singapore outperformed those from other countries in both mathematics content knowledge and mathematics pedagogical content knowledge Another groupofcountriescomprisingSwitzerlandNorwayandtheUnitedStateshadresultsabove the international average in both mathematics and pedagogical content knowledge as did Canada A group of six countries (Georgia Chile the Philippines Botswana Spain and Poland) performed below the international average in both components
International (500)
Spain (492)
Poland (478)
Canada (541)
Georgia (345)
Chile (425)
Philippines (457)
Botswana (448)
Germany (502)
Malaysia (503)
Switzerland (537)
Russian Federation (512)
Thailand (506)
United States (544)
Chinese Taipei (592)
Norway (545)
Singapore (593)
Below the international average
At the international average
Above the international average
330 350 370 390 410 430 450 470 490 510 530 550 570 590 610 630
95 Confidence interval
Estimated mean score
26
Figure 3 Mean scores and confidence intervals for participating countriesmdash Lower-secondary-level future teachersrsquo mathematics content knowledge
Note The Canadian average score is not part of the international average score due to Canadas low response rates
Thailand (479)
Oman (472)
Norway (444)
Canada (516)
Chile (354)
Georgia (424)
Philippines (442)
Botswana (441)
Malaysia (493)
International (500)
Switzerland (531)
Germany (519)
United States (505)
Poland (540)
Russian Federation (594)
Singapore (570)
Chinese Taipei (667)
Below the international average
At the international average
Above the international average
340 360 380 400 420 440 460 480 500 520 540 560 580 600 620 640 660 680
95 Confidence interval
Estimated mean score
27
Figure 4 Mean scores and confidence intervals for participating countriesmdash Lower-secondary-level future teachersrsquo pedagogy content knowledge
Note The Canadian average score is not part of the international average score due to Canadas low response rates
The results are quite similar at the lower-secondary level however future teachers from Chinese Taipei significantly outperformed all other countries in both mathematics and pedagogical content knowledge This is not surprising considering that on the PISA 2006 mathematics assessment 15-year-old students from Chinese Taipei outperformed students from all other countries Interestingly future teachers from the Russian Federation had a much stronger performance in both aspects at the lower-secondary level compared to the elementary level This also holds true for German future teachers although to a lesser extent Conversely future teachers from Norway performed below the international average at the lower-secondary level even though they performed above the international average at the elementary level
Keeping in mind the serious data limitations for Canada it is worth noting that our future teachers performed above the international average in both mathematics and pedagogical content knowledge at both the elementary and lower-secondary levels
Oman (474)
Malaysia (472)
Norway (463)
Canada (513)
Chile (394)
Botswana (425)
Philippines (450)
Georgia (443)
Thailand (476)
International (500)
Germany (540)
Poland (524)
United States (502)
Switzerland (549)
Russian Federation (566)
Singapore (553)
Chinese Taipei (649)
Below the international average
At the international average
Above the international average
380 400 420 440 460 480 500 520 540 560 580 600 620 640 660 680
95 Confidence interval
Estimated mean score
28
Figure 5 Mean scores and confidence intervals by gender primary mathematics knowledge
Figure 6 Mean scores and confidence intervals by gender primary pedagogical knowledge
Among Canadian future teachers at the elementary level there was no statistical difference between their mathematics and pedagogical content knowledge Although the mean score for female future teachers was higher than that for males in pedagogical content knowledge the difference was not statistically significant Of note is the large imbalance intheproportionofmaleteachersinthesample(1in7)Howeverthisisafairlyaccuratereflection of the situation in the population which sees about 80 of teachers in elementary schools in Canada being female (Mullis et al 2007)
524
521Female
Male
400 450 500 550 600
528
543Female
Male
400 450 500 550 600
29
Figure 7 Mean scores and confidence intervals by gender lower-secondary mathematics knowledge
Figure 8 Mean scores and confidence intervals by gender lower-secondary pedagogical knowledge
At the lower-secondary level male future teachers had higher mean scores in both mathematics and pedagogical content knowledge than did females but the differences were not statistically significant The gender imbalance in the sample was not as pronounced at this level as at the elementary level (three female future teachers for every two males at the lower-secondary level) Overall in Canada this is a fair reflection of the situation at the lower-secondary level which sees approximately 70 of teachers being female2
527
509Female
Male
400 450 500 550 600
526
505Female
Male
400 450 500 550 600
2 According to the Pan-Canadian Assessment Program 2007 across all provinces and territories between 50 and 87 of teachers of 13-year-olds are females
30
ConclusionTEDS-M is a comparative study of teacher education with a focus on the preparation of mathematics teachers at the elementary and lower-secondary levels As the first attempt to systematically investigate both the knowledge and skills of future teachers in an international setting the study faced significant challenges in several countries In Canada given the structure of our education systems provinces and territories individually determined whether they wished to be involved in such an endeavour Four provinces (Ontario Quebec Nova Scotia and Newfoundland and Labrador) elected to participate and in each province the participation of individual institutions individual educators and individual future teachers was completely voluntary The very low response rates obtained in Canada and the ensuing non-inclusion in the international data set are indeed disappointing mdash but also very informative mdash should such an initiative be repeated in the future Conducting such an ambitious assessment project is possible but would require engaging all parties early on and throughout the implementation of the project
We are grateful to the ministriesdepartments of education institutions faculties of education educators and future teachers who did participate in this TEDS-M 2008 assessment project It is hoped that the project will yield useful information to guide teacher education in the future
Keeping in mind the serious limitations of the data gathered from TEDS-M there are a few conclusions from the study that may help elicit further discussion among policy-makers and educators
bull IngeneralCanadianinstitutionsdonotseemtohaveverystrongrequirementsin mathematics for individuals wishing to enter into teacher-education programs Other than assessments to meet the requirements for a course in mathematics or in mathematics education there is no formal test of the mathematical knowledge or skills of future teachers at the completion of their program of study
bull Mosteducatorsofmathematicsorofmathematicspedagogyforfutureteachersin Canadian universities are specialized in areas other than mathematics and few hold a doctorate in the discipline At the international level about one-quarter of educators who participated in the TEDS-M study held a doctorate in mathematics with a higher proportion in higher-performing countries In Canada 10 per cent of participating educators held a doctorate in mathematics
bull WithregardtoknowledgeofmathematicsandofmathematicspedagogyCanadianfuture teachers at the elementary and lower-secondary levels performed above the international average Although Canadian 15-year-olds have performed among the top-ranking countries in mathematics since the inception of PISA in 2000 it appears that there is potential for further improvement by possibly providing future teachers at the elementary level with more advanced training in mathematics that covers elements beyond the school curriculum and by providing future teachers at the lower-secondary level with more advanced training in testing- and assessment-related topics
31
ReferencesAtlantic Evaluation and Research Consultants (2007) Kndash12 mathematics curriculum review Final report Retrieved from httpwwwedgovnlcaedupublicationsk12NLMathReportpdf
Bloumlmeke S Kaiser G amp Lehmann R (Eds) (2010) TEDS-M 2008 Professional Competences and Opportunities to Learn of Future Mathematics Teachers at Lower-Secondary Schools in the International Context Muumlnster Waxmann
Bloumlmeke S Kaiser G amp Lehmann R (Eds) (2010) TEDS-M 2008 Professional Competences and Opportunities to Learn of Future Primary Teachers in the International Context Muumlnster Waxmann
Carnoy M Beteille T Brodziak I Loyalka P amp Luschei T (2009) Do countries paying teachers higher relative salaries have higher student mathematics achievement Palo Alto CA StanfordUniversityRetrievedfromhttpstedseducmsueduTEDS_CostsStudyzip
Council of Ministers of Education Canada (2009) PCAP-13 2007 Contextual Report on Student Achievement in Reading Toronto Author
Crocker R amp Dibbon D (2008) Teacher education in Canada a baseline study Kelowna BC Society for the Advancement of Excellence in Education
Dibbon D amp Sheppard B (2001) Teacher demand supply and retention in Newfoundland and LabradorMemorialUniversityofNewfoundlandRetrievedfromhttpwwwmuncaeducpeoplefacultyddibbonpdfFinal20reportchapter1-Introductionpdf
Feng-JuiHTing-YingWChia-JuiHShu-JyhTGuohengCChiu-KeungLet al (2010) A milestone of an international study in Taiwan teacher education National Research Center of Taiwan Teacher Education and Development Study in Mathematics in Taiwan
Ministegravere de lrsquoEacuteducation du Queacutebec (2004) Surplus ou peacutenurie de personnel enseignant qualifieacute au Queacutebec situation actuelle et perspectives agrave court et moyen terme pour le secteur francophone Retrieved from httpwwwmelsgouvqccadftpsinterieurpdfpers_emploi_prevision_nov04pdf
Mullis IVS Martin MO Kennedy AM amp Foy P (2007) PIRLS 2006 International ReportChestnutHillMABostonCollege
Mullis I Martin M Ruddock G OrsquoSullivan C Arora A amp Erberber E (2005) TIMSS 2007 assessment frameworks International Association for the Evaluation of Educational Achievement Retrieved from httptimssbceduTIMSS2007PDFT07_AFpdf
Nova Scotia Department of Education (2007) Nova Scotia public education teacher supply and demand Retrieved from httpwwwednetnscapdfdocsreportsteacher_supply_and_demand_reportpdf
32
Nova Scotia Department of Education (2008) Report and recommendations of the review panel on teacher education in Nova Scotia Retrieved from httpwwwednetnscaeventsteacher_education_reviewdocumentsreview_panel_report_web_epdf
Ontario College of Teachers (2001) Teacher supply and demand Report on the consultation Retrieved from httpwwwoctcapublicationspdftsd_epdf
Ontario College of Teachers (2007) State of the teaching profession 2007 Annual Ontario College of Teachers survey of teachers Retrieved from httpwwwoctcapublicationsPDFsurvey07_epdf
Ontario College of Teachers (2009) Transition to teaching 2009 Retrieved from httpwwwoctcapublicationsPDFtransitions09_epdf
Statistics Canada (2008) CANSIM Table 477-0014 mdash University degrees diplomas and certificates granted by program level Classification of Instructional Programs Primary Grouping (CIP_PG) and sex annual (number) Retrieved from httpdc2chassutorontoca
Tatto MT Ingvarson L Schwille J Peck R Senk SL amp Rowley G (2008) Teacher Education and Development Study in Mathematics (TEDS-M) Policy practice and readiness to teach primary and secondary mathematics Conceptual framework East Lansing MITEDS-MInternationalStudyCenteratMichiganStateUniversityRetrievedfromhttpstedseducmsueduTEDS_FrameworkFinalzip
33
APPENDIX I
sample syllabus Coding
math 250 probability and statistics for elementary middle-school teachers
Instructor Dr KP Lee Office 456HonorsTower
Phone 789-0123 E-mail kpleestandarduedu
Office hours 350ndash450 pm on Mondays and by appointment
COurse prereQuisitesCompletion of Math 125 or equivalent with a C grade or higher Those not meeting the course prerequisites will be automatically dropped from the course by the Department of Mathematics
COurse materialsText Probability and Statistics for ElementaryMiddle-School Teachers
A TI-73 graphing calculator (other models such as the TI-83 and TI-86 will not have the features needed for this course and will not be sufficient)
COurse Overview anD ObjeCtivesThis course is designed to provide pre-service elementary and middle-school teachers with
[laboratory-based experiences designed to teach and reinforce basic statistics and probability concepts often situated in the core tasks of teaching including the examination and critiquing of the statistical thinking and arguments of others]
[opportunities to demonstrate their understanding of statistics and probability concepts in meaningful constructive and alternative ways]
[activities involving the use of calculator technology (this course is usedtosatisfypartoftheUniversityComputerUsagerequirementfor students in elementary teacher education)]
[experiences that model techniques for use in their future elementarymiddle-school classrooms]
U1 T24
B1 T2117331332
B2 T2
117
B3 T2
117355356
34
[The majority of class time will be devoted to small-group exploration and class discussion with an emphasis on reasoning and communication of statistics and probability ideas rather than on rote memorization Students will be expected to demonstrate that they are prepared for class each day by bringing course materials and completed homework assignments Students will be asked to work cooperatively in groups and participate in whole-class discussions Studentsrsquo consistent engagement in these activities will be reflected in their participation grade]
Codes Used in this Excerpt
U1 Sequentialunitnumberofthecodeddocument
T2 An objective of the course
T24 A course that covers specialized mathematics knowledge needed for teaching mathematics
B1 B2 B3 and B4 Each block of information being coded
117 Mathematics block on data representation probability and statistics
331 Mathematics education block on developing mathematical concepts
332 Mathematics education block on reasoning argumentation and proving
355 Mathematics instruction block on using calculators
356 Mathematics instruction block on using computers
117
B4 T2
35
APPENDIX II
examples of assessment items in the primary general pedagogy Knowledge for teaching section of the future teacher Questionnaire
Example 1
Label MFC106Item type Multiple choiceDimension Mathematics Content KnowledgeDomain DataSub-domain Applying
Two fair six-sided number cubes are thrown in a probability game and the two numbers at the top are recorded
Josie wins if the difference between the two numbers is 0 1 or 2 Farid wins if the difference between the two numbers is 3 4 or 5
The students discuss whether the game is fair
Which of the following statements is correct
Check one box
A Both have an equal chance of winning
33
B Josie has the greater chance of winning
50
C Farid has the greater chance of winning
12
D As the game involves number cubes itrsquos not possible to say who has the greater chance of winning
05
For this probability question only half of the future teachers responded correctly that Josie had a greater chance of winning One-third of the respondents were incorrectly drawn to the first option thinking that both Josie and Farid had an equal chance of winning
36
Example 2
Label MFC108Item type Multiple choiceDimension Mathematics Pedagogical Content KnowledgeDomain AlgebraSub-domain Enacting
Amy is building a sequence of geometric figures with toothpicks by following the pattern shown below Each new figure has one extra triangle
Variable t denotes the position of a figure in the sequence
In finding a mathematical description of the pattern Amy explains her thinking by saying I use three sticks for each triangle
Then I see that I am counting one stick twice for each triangle except the last one so I have to remove those
Variable n represents the total number of toothpicks used in a figure
Which of the equations below best represent Amyrsquos statement in algebraic notation
Check one box
A n = 2t + 1 29
B n = 2(t + 1) ndash 1
26
C n = 3t ndash (t ndash1)
36
D n = 3t + 1 ndash t
08
This question was difficult for Canadian future teachers with almost two-thirds of the respondents unable to identify the correct algebraic notation for this pattern
t = 1 t = 2 t = 3
hellip
37
Example 3
Label MFC202Item type Multiple choiceDimension Mathematics Content KnowledgeDomain AlgebraSub-domain Knowing
Indicate whether each of the following statements is true for the set of all whole numbers a b and c greater than zero
Check one box in each row
True Not True
A a ndash b = b ndash a
16
84
B a divide b = b divide a
06
95
C (a + b) + c = a + (b + c)
93
07
D (a ndash b) ndash c = a ndash (b ndash c)
23
77
ThisalgebraquestionwasrelativelyeasyforCanadianfutureteachersHoweveralmostone-quarter of the respondents did not know that the fourth statement was not true even though the question appeared to be relatively easy to solve with whole numbers
38
Example 4
Label MFC203Item type Multiple choiceDimension Mathematics Content Knowledge Domain GeometrySub-domain Applying
A rectangular-shaped swimming pool has a paved walkway (shaded) around it as shown
What is the area of the walkway
Check one box
A 100 m2
04
B 161 m2
06
C 710 m2
78
D 1610 m2
12
This question was relatively easy for Canadian respondents with 78 getting the correctanswerHowever12calculatedtheentireareabutfailedtosubtractthearea of the swimming pool
70 m
50 m
18 m 23 mPool
not to scale
Walkway
39
Example 5
Label MFC206Item type Constructed responseDimension Mathematics Content Knowledge Domain NumberSub-domains Applying Planning
a) Amachineuses24litresoffuelforevery30hoursofoperationHowmanylitresoffuel will the machine use in 100 hours if it continues to use fuel at the same rate
Check one box
A 72
11
B 80
79
C 84
08
D 96
02
This question was relatively easy for Canadian respondents with almost 80 getting thecorrectresponseHoweveroneinfiverespondentsdidmakeacalculationerrorwhen solving this simple problem
b) Create a different problem of the same type as the problem in (a) (same processesoperations) that is EASIER for primary children to solve
40
Scoring Guide
Code Response Item MFC206B
Correct Response
10
A different problem of the same type (same processesoperations) but easier to solveExamples
bull Amachineuses3litresoffuelforevery30hoursofoperationHowmanylitres of fuel will the machine use in 100 hours
bull Acaruses24litresoffuelforevery50kmHowmanylitresoffuelwillthe car use in 100 km
Incorrect Response
70
A different problem of the same type (same processesoperations) but NOT easier to solve (Note Items judged to be of the same level of difficulty are NOT easier)Examples
bull Amachineuses2litresoffuelforevery30hoursofoperationHowmanylitres of fuel will the machine use in 100 hours (2 is not divisible by 3)
bull Atapdrips2litresofwatereverydayHowmanymlisthispersecond(The metric knowledge required and the computational load are significantly higher)
79
Other incorrect response (including crossed out erased illegible or off-task responses and stray marks)Examples
bull questionsthatarenotmeaningfulorhavenoanswer
No Response
99 Blank
About 84 of Canadian future teachers were able to create a problem of the same type but that was easier to solve Nine per cent of respondents created a similar problem but that was not easier to solve
41
examples of assessment items in the secondary general pedagogy Knowledge for teaching section of the future teacher Questionnaire
Example 1
Label MFC604Item type Constructed responseDimension Mathematics Content KnowledgeDomain AlgebraSub-doman Applying
The following problems appear in a mathematics textbook for lower secondary schools
1 Peter David and James play a game with marbles They have 198 marbles altogether Peter has 6 times as many marbles as David and James has 2 times as many marbles asDavidHowmanymarblesdoeseachboyhave
2 Three children Wendy Joyce and Gabriela have 198 zeds altogether Wendy has 6timesasmuchmoneyasJoyceand3timesasmuchasGabrielaHowmanyzedsdoes each child have
(a) Solve each problem
Solution to Problem 1
Solution to Problem 2
42
Scoring Guide
Note The correct answers to MFC604A1 and MFC604A2 are as follows
Problem 1 David has 22 marbles Peter has 132 marbles and James has 44 marbles
Problem 2 Wendy has 132 zeds Joyce has 22 zeds and Gabriela has 44 zeds
The following methods are considered in the scoring guide
1) Usingone variable setting up one equation and solving
Example (Problem 1) Let m = the number of marbles that David has Then Peter has 6m and James has 2m Therefore 6m + 2m + m = 198 and m = 22
2) Usingmore than one variable establishing a system of equations performing substitutions and solving
Example (Problem 1) Let p = the number of marbles that Peter has d = the number of marbles that David has and j = the number of marbles that James has Therefore p = 6d and j = 2d p + d + j = 198
3) Trial and error or guess and check
4) Ratio or other arithmetic methods
5) Representationdiagram
Code Response Item ID MFC604A1
Correct Response
11 Response uses Method 1 correctly to solve Problem 1 and get the correct answers
12 Response uses Method 2 correctly to solve Problem 1 and get the correct answers
13 Response uses Method 3 correctly to solve Problem 1 and get the correct answers
14 Response uses Method 4 correctly to solve Problem 1 and get the correct answers
15 Response uses Method 5 correctly to solve Problem 1 and get the correct answers
19Response uses a correct but different method from those listed above to solve Problem 1 and get the correct answers
Incorrect Response
70Response uses one of Methods 1 to 5 to solve Problem 1 but arrives at an incorrect answer or cannot complete the solution because of a computation or algebra error
71Response uses a correct but different method from those listed above to solve Problem 1 but arrives at an incorrect answer or cannot complete the solution because of a computation or algebra error
79 Other incorrect response (including crossed out erased illegible or off-task responses and stray marks)
No Response
99 Blank
43
Code Response Item ID MFC604A2
Correct Response
11 Response uses Method 1 to solve Problem 2
12 Response uses Method 2 to solve Problem 2
13 Response uses Method 3 to solve Problem 2
14 Response uses Method 4 to solve Problem 2
15 Response uses Method 5 to solve Problem 2
19Response uses a correct but different method from those listed above to solve Problem 2 and get the correct answers
Incorrect Response
70Response uses one of Methods 1 to 5 to solve Problem 2 but arrives at an incorrect answer or cannot complete the solution because of a computation or algebra error
71Response uses a correct but different method from those listed above to solve Problem 2 but arrives at an incorrect answer or cannot complete the solution because of a computation or algebra error
79 Other incorrect response (including crossed out erased illegible or off-task responses and stray marks)
No Response
99 Blank
Overall Problem 1 was easy to solve for Canadian future teachers with 85 getting the correct response The majority of respondents (53) used Method 1 to solve Problem 1 and 29 used Method 2 Problem 2 was of medium difficulty for Canadian future teachers with 65 getting a right answer Sixteen per cent of future teachers used one of the five methods listed to solve Problem 2 but made a computation or algebra error (code 70)
44
Example 2
Label MFC610Item type Multiple choiceDimension Mathematics Content KnowledgeDomain NumberSub-domain Knowing
Determine whether each of the following is an irrational number always sometimes or never
Check one box in each row
Always Sometimes Never
A The result of dividing the circumference of a circle by its diameter
65 26 09
B The diagonal of a square with side of length 1
75 11 14
C Result of dividing 22 by 7 66 06 28
Canadian future teachers had some difficulty identifying the characteristics of irrational numbers Only 28 of respondents knew that dividing 22 by 7 never results in an irrational number possibly confusing this fraction with π which is irrational
45
Example 3
Label MFC704Item type Constructed responseDimension Mathematics Content KnowledgeDomain GeometrySub-domain Applying
On the figure ABCD is a parallelogram ang BAD = 60˚ AM and BM are angle bisectors of angles BAD and ABC respectively If the perimeter of ABCD is 6 cm find the sides of triangle ABM
Write your answers on the lines below
AB = _______ cm
AM = _______ cm
BM = _______ cm
Scoring Guide
Code Response Item ID MFC704
Correct Response
20
Response indicates all three correct entries belowAB = 2 cmAM = radic3 cm or equivalentBM = 1 cm
Partially Correct Response
10 Response indicates any two correct entries and one incorrect (or blank) entry
11 Response indicates any one correct entry and two incorrect (or blank) entries
Incorrect Response
79 Incorrect mathematical statements or statements of no value (including crossed out erased illegible or off-task responses and stray marks)
No Response
99 Blank
This was a difficult question for Canadian future teachers with only 41 giving all three correct responses Another 14 had two correct responses and 8 had one correct response This means that 37 of respondents could not find any of the three measures of the triangle
D
A B
M C
46
Example 4
Label MFC705Item type Multiple choiceDimension Mathematics Content KnowledgeDomain GeometrySub-domain Knowing
We know that there is only one point on the real line that satisfies the equation 3x = 6 namely x = 2
Suppose now that we consider this same equation in the plane with coordinates x and y and then in space with coordinates x y and z What does the set of points that satisfy the equation 3x = 6 look like in these settings
Check one box in each row
One point One line One plane Other
A The solution to 3x = 6 in the plane 22 69 08 01
B The solution to 3x = 6 in space 14 09 71 07
This geometry question was moderately difficult for Canadian future teachers with about 70 of respondents knowing that the proposed solution would look like one line in the plane and one plane in space
- Table of Contents
- List of Figures
- What is TEDS-M 2008
- Research design and methodology for TEDS-M
- What is to be learned from TEDS-M
- What value will TEDS-M add to existing research on teacher education
- Target populations
- Components of TEDS-M
-
- Component 1 studies of teacher-education policies for elementary and lower-secondary mathematics teachers and their cultural and social contexts
- Component 2 studies of elementary and lower-secondary mathematics teacher-preparation routes programs standards and expectations for teacher learning
- Component 3 studies of the mathematics and related teaching knowledge of future elementary and lower-secondary school teachers
-
- Participating countries in TEDS-M
- The Canadian administration
- Structure and organization of teacher education in Canada
- Programs in specific jurisdictions
-
- Ontario
- Quebec
- Nova Scotia
- Newfoundland and Labrador
-
- The administration of the TEDS-M survey in Canada
-
- Representation at international meetings
- Adaptation translation and approval of assessment and questionnaire materials
-
- Sampling institutions
-
- Contacting institutions and sending and collecting materials
- Quality monitoring
- Coding
-
- Description of teacher-education courses and collection and coding of syllabi
- Coding of mathematics content knowledge and mathematics pedagogical content knowledge
-
- Results
-
- Institutional Program Questionnaire
- Survey for Mathematics Mathematics Pedagogy and General Pedagogy Educators
- Survey for Future Teachers of Lower-Secondary Mathematics
- Survey for Future Teachers of Primary Elementary Mathematics
-
- Conclusion
- References
- Figures
-
- Figure 1enspMean scores and confidence intervals for participating countriesmdashElementary-level future teachers mathematics content knowledge
- Figure 2enspMean scores and confidence intervals for participating countriesmdashElementary-level future teachers pedagogy content knowledge
- Figure 3enspMean scores and confidence intervals for participating countriesmdashLower-secondary-level future teachers mathematics content knowledge
- Figure 4enspMean scores and confidence intervals for participating countriesmdashLower-secondary-level future teachers pedagogy content knowledge
- Figure 5enspMean scores and confidence intervals by gender primary mathematics knowledge
- Figure 6enspMean scores and confidence intervals by gender primary pedagogical knowledge
- Figure 7enspMean scores and confidence intervals by gender lower-secondary mathematics knowledge
- Figure 8enspMean scores and confidence intervals by gender lower-secondary mathematics knowledge
-
- Appendices
-
- APPENDIX I
-
- Sample Syllabus Coding
-
- APPENDIX II
-
- Examples of assessment items in the Primary General Pedagogy Knowledge for Teaching section of the Future Teacher Questionnaire
- Examples of assessment items in the Secondary General Pedagogy Knowledge for Teaching section of the Future Teacher Questionnaire
-
10
The Canadian administration was carried out between March 7 and April 30 2008 An exception was made for one institution to accommodate the length of its studentsrsquo practicum therefore that administration was carried out in May
The sample was drawn randomly from a list of all possible participants supplied by each institution A sample of 40 future teachers was drawn for each institution their professors were selected to complete the survey
Structure and organization of teacher education in CanadaTeacher education is offered at a total of 56 institutions in Canada A small number of these are affiliates of larger institutions and include English and French programs within the same institution for program purposes English and French programs within one institution are considered independent units The total number of institutions has not changed much in recent years Multiple institutions are found in all but two provinces Newfoundland and Labrador and Prince Edward Island There are no programs in Canadarsquos three territories as they tend to draw their teachers from the provincial teacher-education institutions across the country
Approximately 50000 students are enrolled in teacher-education programs each year (Statistics Canada 2008) The enrolment trend over time has been toward a slight decline in the 1990s followed by a slight increase since 2000 The ratio of females to males is more than 31 and there has been a slight increase in this ratio in recent years Just under 40 per cent of those enrolled or about 18000 students graduate in any one year a figure thathasremainedfairlyconstantinrecentyearsHoweverduetotherangeofone-yearand multi-year education programs offered this percentage cannot be taken as a direct measure of productivity
Programs range widely in size enrolling from fewer than 100 to almost 4000 students and graduating from about 30 to more than 1200 students per year The number of faculty members ranges from as low as 6 to more than 150 per institution Program size appears to be linked to program variety and specialization For example programs in small institutions may have a liberal-arts focus based on the argument that a general program in liberal arts and the foundations of education is appropriate preparation for teaching at any level Such universities tend to consider their small size a virtue and in their promotion they tend to highlight their small classes the close ties between faculty and students and their focus on liberal arts
In general there are two routes to graduation at teacher-education institutions mdash concurrent or consecutive Concurrent programs usually offer four years of both professional education courses along with academic courses Some of these concurrent programs lead to the Bachelor of Education (BEd) degree others requiring five years of study lead to a degree in an academic specialty as well as a BEd Consecutive programs require candidates to first obtain an academic degree in order to be accepted into a program of studies in education
11
usually concentrated in one or two years (two to four semesters) The duration is related to certification requirements for example a two-year program following a first degree is the minimum requirement for certification in Nova Scotia while a one-year program is required for certification in Ontario
Some institutions offer only one route while others offer both routes The general trend across most provinces is toward consecutive programs The exception is Quebec where almost all programs offer concurrent studies
Because most jurisdictions have strong incentives for upgrading academic credentials built into their salary scales most teachers continue their academic education beyond the first degree For this reason it is common for teachers to possess two undergraduate degrees one in an area of academic specialization and a BEd or equivalent In any event two degrees is the normal outcome of consecutive teacher-education programs Across Canada close to 20 per cent of teachers have a masterrsquos degree usually in education The proportion holding advanced degrees varies across jurisdictions and is linked to the structure of the certificationsalary scale
In either of the two routes to a BEd most institutions offer programs at two levels elementary and secondary Teachers of the elementary grades are usually considered generalists while teachers at the secondary level are expected to specialize in one or more disciplines Consequently most elementary programs are concurrent and most secondary programs are consecutive The specialization associated with an academic degree in a major subject area is considered desirable for secondary teachers The concept of a ldquoteachable subjectrdquo that is a discrete subject in the provincial curriculum is often transferred from certification requirements to academic major subjects creating the expectation that the academic major is some subject that can be taught in schools
In some jurisdictions teaching certificates are endorsed only for specific levels or subjects Howeverthedegreetowhichtheteachersholdingtheseendorsedcertificatesarerestrictedto their defined areas of specialization varies by jurisdiction and location and depends on teacher supply and demand
Beyond the two program routes and the two levels for which teachers are prepared a variety of more specialized programs can be found For example physical education and music are often separated from mainstream programs and offered either through the respective academic units or through collaborative arrangements between programs Special education second-language teaching Aboriginal studies and technological studies are other examples of areas in which specialized programs have been developed Sometimes these are organized as separate degrees (such as a Bachelor of Special Education or a Bachelor of Physical Education) but these areas are also specializations within the mainstream degrees
All teacher-education programs require student teachers to participate in some in-school teaching experience referred to variously as a practicum an internship or student teaching Indeed this is generally a significant component of teacher-education programs The long-term trend is toward longer in-school placements distributed throughout the program rather than concentrated at the end
12
Programs in specific jurisdictionsTEDS-M from the International Association for the Evaluation of Educational Achievement (IEA) was conducted in four Canadian jurisdictions mdash Ontario Quebec Nova Scotia and Newfoundland and Labrador
OntariOThere are 14 publicly assisted faculties of education in Ontario universities together they enrol approximately 13000 students and graduate about 8000 teacher candidates per year All of the publicly assisted faculties of education offer programs in English and two offer programs in French
Almost all Ontario institutions offer consecutive programs of two semestersrsquo duration to students who already have a bachelorrsquos degree The practicum ranges from a minimum of 42 days to over 60 days depending on the institution The number of graduates from teacher-education programs ranges from fewer than 100 per year to more than 1000 per year in the larger institutions although most programs enrol at least several hundred students A three-level structure categorized into PrimaryJunior (Grades Kndash6) JuniorIntermediate (Grades 4ndash10) and IntermediateSenior (Grades 7ndash12) is typical and this structure conforms to the structure for teacher certification This allows teachers to be certified to teach a range of grade levels Some more highly specialized programs are offered in areas such as music second-language teaching and technological studies Candidates for admission to the faculties of education in Ontario apply through the central Teacher Education Application Service (TEAS) which allows applicants three choices of institution or program Individual universities conduct their selection of candidates
Teacher certification in Ontario is governed by an independent body the Ontario College of Teachers (OCT) The governing council of this body comprises 23 teacher-members elected by members of the college and 14 members of the public appointed by the provincial government and broadly representative of other stakeholders in education Graduates of teacher-education programs at Ontario universities apply to OCT for a general certificate of qualification and registration as their licence to teach OCTrsquos ldquoTransition to Teachingrdquo studies indicate that early in the decade the province was experiencing a generalshortageofteachersHoweverinrecentyearsOntariorsquosemploymentmarkethasbeen characterized by an oversupply of teachers in most subject areas as the number of new teachers entering the profession has substantially increased and the number of teachers leaving the profession or retiring has declined (Ontario College of Teachers 2009)
QuebeC Twelve institutions offer teacher-education programs in Quebec nine in French and three in English Close to 18000 students are enrolled in these programs and about 4000 graduate per year This rate reflects the concurrent nature of most Quebec programs under which students take four years to complete the BEd degree Typically programs are divided into elementary and secondary levels with many more specialized programs Candidates for teaching at the elementary level are prepared as generalists candidates for teaching at the secondary level are expected to specialize in subjects or subject clusters corresponding to those taught in secondary schools Most programs are specifically designed to prepare candidates for certification as teachers in Quebec
13
Teacher certification in Quebec is governed by the Comiteacute drsquoagreacutement des programmes de formation agrave lrsquoenseignement (CAPFE) [committee on accreditation of teacher-training programs] a representative body of stakeholders CAPFE is responsible for accrediting teacher-training programs in the province and it is an autonomous independent body created and funded by the Ministry of Education Recreation and Sports
The most recent work on teacher supply and demand in Quebec was a report by the Service des eacutetudes eacuteconomiques et deacutemographiques [department of economic and demographic research] dated November 2004 The report (Ministegravere de lrsquoEacuteducation du Queacutebec 2004) noted that teacher shortages were expected for teachers of French language arts and social sciences in the period from 2005 to 2007 due to changes to the curricula There would also be shortages in 2006 in the number of second-language (French and English) teachers arts teachers and physical-education teachers It was also expected that there would be a deficit in mathematics and science teachers in French-language schools The report also predicted that declining enrolment in schools would lead to a major surplus of teachers in all disciplines for 2008 to 2013
nOva sCOtiaFour institutions in Nova Scotia offer teacher-education programs three in English and one in French All these programs are relatively small compared to national averages with approximately 900 students and 400 graduates per year in total This represents a substantial decrease from the early 1990s when an external review led to the closure of programs at several institutions and a reduction in the number of students accepted into teacher education That review also led to the establishment of the only system in Canada in which a two-year (four-semester) consecutive program is the norm and a requirement for certification
Nova Scotia is one Canadian jurisdiction in which high-profile government-commissioned external reviews have had an impact on teacher education The most recent review completed in 2008 (Nova Scotia Department of Education 2008) addressed both program structures and labour-market issues The major labour-market concern was the continued oversupply of teachers despite the significant constraints imposed following the previous review The oversupply was attributed to the continuing substantial demand for places many students move to other jurisdictions to complete their programs encouraged by arrangements negotiated between Nova Scotia universities and institutions outside the province these students then return to Nova Scotia seeking certification As a consequence a recent Nova Scotia study of teacher supply and demand predicted that supply will exceed demand by a ratio of close to 31 from now until 2014 with approximately 1000 teachers entering the system every year and only about 360 leaving (Nova Scotia Department of Education2007)Howevershortageswouldcontinuetobefeltinspecificgeographicalareas of the province and in some subject areas (but not in mathematics)
Teacher certification in Nova Scotia is administered by the Department of Education The Office of Teacher Certification is advised by a representative committee of stakeholders appointed by the minister of education
14
newfOunDlanD anD labraDOrNewfoundland and Labrador has only one university offering teacher-education programs A total of approximately 1000 students register and about 500 graduate annually The main program divisions are referred to as PrimaryElementary and Intermediate Secondary The PrimaryElementary program is concurrent requiring a total of five years to complete Students enter the professional component usually in the third year The IntermediateSecondary program is a three-semester consecutive one completed over 14 months Specialized programs are available in music physical education technology special education and other areas All programs are designed to meet the provincersquos teacher-certification requirements
Teacher certification in Newfoundland and Labrador is governed by a representative body of stakeholders and the system is administered by the Department of Education The most recent comprehensive study of teacher supply and demand in Newfoundland and Labrador was completed in 2001 At that time Dibbon and Sheppard (2001) found that in spite of a large pool of substitute teachers in the province the supply of teachers in the specialized areas of mathematics and science was low and remote communities had difficulty recruiting teachers Since that time both the number of new positions and of new graduates per year have increased suggesting that the supply-demand ratio has not changed very much
A recent review of school mathematics programs in Newfoundland and Labrador (Atlantic Evaluation and Research Consultants 2007) which included a comprehensive survey of mathematics teachers revealed that only a small proportion (about 10 per cent) of elementary school teachers have mathematics as their major area of study The proportions are much higher for Grade 9 (72 per cent) and for senior-secondary school (83 per cent)
The administration of the TEDS-M survey in CanadaAs stated previously TEDS-M was administered in four provinces in Canada (Ontario Quebec Nova Scotia and Newfoundland and Labrador) These four provinces mandated the Council of Ministers of Education Canada (CMEC) to act as the National Research Centre (NRC) responsible for the coordination of the study
NRC was responsible for representing provinces at international meetings adapting translating and approving all assessment and questionnaire materials sampling institutions educators and future teachers in accordance with international guidelines contacting participating institutions and sending and collecting materials arranging for quality-monitoring of the administration arranging the coding of curriculum documents questionnaires and assessment materials capturing and validating all data and analyzing the data and publishing the national report
15
representatiOn at internatiOnal meetingsThe International Study Centre (ISC) for TEDS-M was located at Michigan State UniversityISCwasresponsiblefortheplanningimplementationandreportingofallaspects of the study at the international level A conceptual framework (Tatto et al 2008) guided the design of the study Throughout the development of the framework and of all instruments the international group of experts from ISC consulted NRC on a regular basis including at biannual meetings
aDaptatiOn translatiOn anD apprOval Of assessment anD QuestiOnnaire materialsAll materials were developed by ISC in English and approved by all participating countries Individual countries were responsible for adapting materials for use in their own country and for translating all materials into the target language(s) for the country In Canada TEDS-M was administered in English and in French and all documents (manuals questionnaires coding guides) had to be approved by ISC prior to the administration
Sampling institutions
In order to ensure that valid cross-national comparisons could be made ISC implemented strict sampling guidelines based on national probability samples In Canada with only four provinces participating it was determined that all 31 institutions in these provinces wouldbeinvitedtoparticipateHoweverinstitutionsrsquoparticipationwasvoluntaryandtheinstitutional response rate was very low (37 or n=10) This could be explained in large part by the fact that the administration of the survey was occurring at the end of April a very busy period for institutions with end-of-term exams and practica In several cases institutionsrsquo research-ethics committeesboards did not have sufficient time to review the application to conduct the study
A total of 94 educators were sampled in the 10 participating institutions Again it was determined to invite all educators (of pedagogy mathematics and mathematics pedagogy) to participate Overall 74 educators responded to the questionnaires a response rate of 79 per cent
For the reasons stated above the response rates for future teachers were also very low Overall 183 future teachers at the elementary level and 155 future teachers at the secondary level participated (response rates of 69 per cent and 79 per cent respectively)
As a result of these low response rates (overall and within institutions) the sampling referee determined that the Canadian sample was not sufficiently representative of the overall population and ISC elected to report all Canadian results in appendix to the international report and did not include Canada in all international comparisons
16
COntaCting institutiOns anD senDing anD COlleCting materialsAdministering the TEDS-M survey was a collaborative task shared between the National Research Centre institutional coordinators and survey administrators
Institutional coordinators were responsible for seeking the participation of educators and of future teachers as well as for most administrative arrangements for the TEDS-M main study at the institution including providing a list of future teachers and educators administering educator and institutional questionnaires and collecting syllabi
The National Research Centre appointed survey administrators to administer the sessions to future teachers Survey administrators were selected on the basis of their experience If possible individuals who had previous experience in survey or test administration (eg the Trends in International Mathematics and Science Study the Progress in International Reading Literacy Study the Programme for International Student Assessment) were selected These survey administrators reported directly to the National Research Centre
Quality mOnitOringIn all participating countries approximately 10 per cent of participating institutions were visited during the administration of the survey International quality monitors ensured that the administration procedures were strictly followed and provided detailed reports to ISC
Generally the institutional coordinator was responsible for identifying the most suitable individual who could complete the institutional questionnaire The respondent was asked to complete the questionnaire confidentially and return it to the institutional coordinator It took approximately two hours to complete this questionnaire
The institutional coordinator was also responsible for identifying all educators who were teaching to the target population of future teachers at the time of the administration The questionnaire for educators took approximately 30 minutes to complete
The questionnaire for future teachers was administered by the survey administrator over a two-hour uninterrupted period There were two different versions of the Future Teacher Questionnaire one for elementary teachers and one for secondary teachers In each case several equivalent forms of the questionnaires were used Three of the four sections were equivalent across all forms of the questionnaires General Background (5 minutes) Opportunity to Learn (15 minutes) and Beliefs about Mathematics and Teaching (10 minutes) The Mathematics Knowledge for Teaching section (60 minutes) differed across booklets with some anchor questions to ensure equivalence across forms Some sample questions can be found in the section below
17
CODingDescription of teacher-education courses and collection and coding of syllabi
In all participating institutions the institutional coordinator asked participating educators to provide the course syllabus for each course they were teaching at the time of the data collection These syllabi were sent to the National Research Centre for coding (see Appendix I for a sample of a coded syllabus)
Syllabus analysis is a systematic method of obtaining comprehensive information from syllabus documentation and materials It examines content sequence (when and what topics are intended) and when appropriate performance expectations (what students are expected to do with the content) at the institutional and course levels Qualitative coding protocols were used to capture the coursesrsquo academic content
TEDS-M used a low inference procedure to perform the analysis to reliably investigate the opportunities to learn in different institutions and different countries In addition to understanding how to code the different syllabi coders developed a high level of reliability when coding Inter-coder reliability was closely monitored at the international level An example of the syllabus-coding activity can be found in Appendix I
Coding of mathematics content knowledge and mathematics pedagogical content knowledge
As described in the TEDS-M conceptual framework teaching mathematics consists of two constructs mathematics content knowledge and mathematics pedagogical content knowledge (see Appendix II for sample items) Each question in the Mathematics Knowledge for Teaching section measured one of the four content domains (number geometry algebra data) and one of the three cognitive domains (knowing applying reasoning) Each question in the Mathematics Pedagogical Content Knowledge section measured one of the three aspects of the framework (mathematical curricular knowledge knowledge of planning for mathematics teaching and learning enacting mathematics for teaching and learning)
Coding of all the knowledge questions took place in a central location All coders were graduating future teachers of mathematics who received extensive training Coder reliability was closely monitored throughout the coding session In Canada all coding took place in both English and French ensuring a high degree of consistency across languages
18
ResultsAs mentioned previously TEDS-M surveyed three populations institutions educators and future teachers This section presents some selected Canadian results from the three surveys Due to the very low response rates it should be noted that these results are descriptive of the participating respondents generalizations made to the entire population are not advised
institutional program QuestionnaireOverall 82 questionnaires were distributed to 10 participating institutions because these offered more than one program In some cases institutions offered consecutive andor concurrent programs in others they offered programs at the elementary andor secondary levels and in others yet programs in English andor French All these possible variations explain the number of questionnaires analyzed
HerearesomefindingsfromtheInstitutionalProgramQuestionnaire
bull Amajorityofinstitutions(65)preparefutureteacherstoteachinbothelementaryand secondary schools and there are as many concurrent as consecutive programs represented in the sample
bull Over60ofinstitutionsrequirefutureteachersundertakingtheprogramtohavecompletedatleastGrade12mathematics(advancedorregular)However26of programs do not require a minimum level of mathematics for future teachers
bull Almost all institutions (87) within guidelines set by regional or provincialauthorities set policies governing which applicants are admitted to the program
bull When selecting students for their teacher-preparation programs institutionspay particular attention to candidatesrsquo suitability for teaching which may be assessed by an interview or a written application or by their demonstrated high level of achievement in mathematics (with 87 and 65 of institutions rating thesecriteriaassomewhatimportantorveryimportantrespectively)Howevercandidatesrsquo overall achievement level (91) and performance at the end of the school year (100) are either not considered or considered not important for selection purposes This finding would need to be investigated further as it seems to be inconsistent with findings from Crocker and Dibbon (2008) which suggest that institutions do consider minimum averages in a set of prerequisite courses especially in a competitive environment where the number of applicants exceeds the number of places
bull Withrespecttoprovincialnormsrespondentsviewfutureteachersenteringtheprogram as either high- or above-average achievers (44 and 52 respectively)
bull In theprogramsunder study respondents state thateithermoderateormajorweight is placed on the following program goals
m planning lessons based on recommended pedagogical principles (100)m learning to reflect on onersquos own learning and teaching practices (100)m studying the content of the school curriculum and of the mathematics
curriculum to be taught (100)
19
bull Nolittleoronlysomeweightisplacedonthefollowinggoals
m interpreting data from externally conducted tests (69)m studying mathematics or other disciplines at the tertiary level (65 and
69 respectively)m learning specific strategies and curricula for teaching gifted students (61)m developing the knowledge and skills to do teacher action research (70)
bull Intermsofinstitutionalrequirementsforsuccessfullycompletingtheprogramallrespondents (100) state that future teachers must pass all courses required for the program successfully demonstrate a required level of teaching competence in the classroom and receive a passing grade on their field experience None of the programs require future teachers to write a thesis and only a few (less than 10) require future teachers to pass a written or an oral examination
bull Inabout three-quartersof theprograms teacherswhomentor future teachersduring their extended field practice receive some form of compensation As part of their responsibilities these mentors are expected in all programs to observe future teachers in classrooms They are also expected to provide a formal summative assessment and written narrative reports of the field practice
bull Generally institutionsare responsible forfindingplacements for theextendedteaching practice (in 82 of programs) and although about half of the institutions have no difficulty finding suitable placements for future teachers another 30 state that appropriate placements are not readily available in sufficient numbers
bull Ofthefacultyemployedtoteachmathematicsormathematics-relatedcontentto future teachers all institutions indicate that a masterrsquos degree would normally be required and 70 of institutions would normally require a doctorate Few institutions require that these educators be qualified to teach or have experience teaching at the elementary or secondary level However educators teachingmathematics pedagogy are normally expected to have some experience teaching at the elementary or secondary level in about half of the programs It should be noted that this relative lack of a requirement for teaching experience in some programs does not mean that many educators do not have some teaching experience This is illustrated below by the fact that more than half of the surveyed educators held a teaching certificate All institutions require that mentors supervising the extended teaching practice hold at least a bachelorrsquos degree and in 78 of the programs mentors are expected to hold a masterrsquos degree
survey for mathematics mathematics pedagogy and general pedagogy educatorsOverall 194 questionnaires were distributed and 94 questionnaires were returned
bull The academic rankof the respondentswaswell distributed across all possibleranks with 19 being professors 16 being associate professors 23 assistant professors 17 lecturers 14 instructors and 11 in other roles There were slightly more females (56) than males
20
bull Oftheseeducators27hadadegreeineducation14inmathematicseducationand 10 in mathematics at the doctoral level or higher These figures should be interpreted with caution As stated above a large number of respondents to the survey were likely to be sessional appointees
bull Fifty-twopercentofrespondentsheldateachingcertificateatthetimeofthestudy one-third has never held a teaching certificate
bull Onaveragetheseeducatorshavespentapproximately10yearsattheircurrentinstitutions and about seven years in their teacher-preparation role They teach mostly at the undergraduate level (93) but also at the masterrsquos level (48) and in some cases at the doctoral level (18) In terms of experience 30 have been involved in instructing or supervising future teachers for over 10 years but 37 have done this for three years or less suggesting the existence of a cadre of educators with relatively little experience at least when considering the general profile of the respondents
bull Overthepast12monthsmorethanhalfoftheseeducatorshavenotparticipatedin any professional-development activities related to mathematics or mathematics pedagogyHoweverover60hadparticipatedinatleastsixhoursofprofessionaldevelopment in general pedagogy
bull In thepastyear respondentshavespentabout30of theirworkingtimeonresearch and research-related activities
bull Whenaskedtoconsiderallcoursesintheteacher-educationprogramsofferedattheir institutions about 80 of these educators felt that each stage seemed to be planned to meet the main needs of future teachers at each stage of their preparation and that the programs were organized in a way that covered what future teachers needed tobecomeeffective teachersHowever30disagreed that therewereclear links between most of the courses in the program of study
bull When asked to describe future teachersrsquo level of preparedness for teachingmathematics as they complete the teacher-education program and start their teaching careers 80 or more of these educators felt that future teachers were prepared to a moderate or major extent to clearly communicate ideas and information about mathematics to students that they could establish appropriate learning goals in mathematics for students and that they could set up mathematics learning activities to help students achieve learning goals Conversely over a third of these educators felt that future teachers were not at all or just to a minor extent prepared to use computers and information and communication technology (ICT) to aid in teaching mathematics and to provide parents with useful information about studentsrsquo progress in mathematics Further research would be useful to compare the views of teachers principals and faculties regarding the level of preparedness in using ICT to teach mathematics
bull Finally almost 80 of educators felt that their pre-service teacher-educationprograms were effective or very effective in preparing future teachers of mathematics
21
survey for future teachers of lower-secondary mathematicsOverall 282 questionnaires were distributed to future teachers at the secondary level and 155 were completed
bull Themedianageofrespondentswas24yearsand61werefemalesAbout86of respondents always or almost always spoke the language of the questionnaire at home Eighty-three per cent had taken a calculus or pre-calculus course in high school When comparing themselves to other students at the same grade level in their schools 82 saw themselves as being at the top or near the top of their class in terms of marks
bull Whenaskedtoidentifythemainreasonswhytheydecidedtobecometeachersthese future teachers at the secondary level mentioned their perception of teaching as a challenging job their desire to have an influence on the next generation their desire to work with young people their belief that they have a talent for teaching and their love of mathematics as the most significant reasons For the most part they were not influenced by teacher salaries the availability of teaching positions or the fact that they had always been good students in school
bull Almosthalf(47)ofthesefutureteacherssaidthatneedingtoborrowmoneyhindered their studies during their teacher-preparation programs
bull Almostallfutureteachersatthesecondarylevel(95)thoughtthattheywouldor could possibly spend their entire career as a teacher
bull Theserespondentswereaskedtoconsideranumberofmathematicstopicsandtoindicate which ones they had or had never studied Over 80 stated that they had studied calculus linear algebra probability and theoretical or applied statistics Fifty per cent or more stated that they had never studied topology differential geometry theory of real or complex functions or functional analysis or abstract algebra In the context of their teacher-education programs more than half also said that they had not studied validation structuring and abstracting or calculus In terms of emphasis three-quarters said that in their programs they studied mathematics at the level of the school curriculum
bull Intermsofmathematicspedagogyover80saidthattheirprogramscoveredmathematics instruction mathematics standards and curriculum and the development of teaching plans Their programs allowed them to engage in the following activities most often accommodating a wide range of abilities in each lesson exploring how to use manipulatives and creating learning experiences that make central concepts under study meaningful to students The activities that were mentioned the least often were using standardized tests to guide decisions about what and how to teach using assessment to give feedback to parents or guardians and helping students learn how to assess their own learning
bull Whenlookingateducationandpedagogytopicsoverathirdofthesecondary-levelfuture teachers said that they had not studied methods of educational research or the history of education and educational systems
22
bull Withregardtotheirpracticaover60agreedthatthefeedbacktheyreceivedfromtheir mentors helped them to improve their teaching methods that this feedback helped them to improve their understanding of their students and that they had a clear understanding of what their mentors expected of them as teachers in order to pass the practica
bull Regardingtheperceivedoveralleffectivenessoftheirpre-serviceteacher-educationprograms almost a quarter of these future teachers at the secondary level felt that the programs were not effective in preparing them to teach mathematics
survey for future teachers of elementary mathematicsOverall 580 questionnaires were distributed to future teachers at the elementary level and 183 were completed Although the number of respondents is quite substantial the response rate is below the international standard therefore any generalization to the population of future elementary teachers should be made with extreme caution
bull Eighty-sevenpercentofrespondentsofthisquestionnairewerefemaleThismaybe slightly higher than the overall population of elementary teachers Based on the Progress in International Reading Literacy Study (2006) data in which five provinces participated the figures would vary between 72 and 86 for female teachersattheelementarylevelUnfortunatelynoofficialdataareavailableatthepan-Canadian level for this aspect
bull About95alwaysoralmostalwaysspokethelanguageofthequestionnaireathome Only 40 had taken a calculus or pre-calculus course in high school which is much lower than for future teachers at the lower-secondary level When comparing themselves to other students at the same grade level in their schools about half of the respondents saw themselves as being at the top or near the top of their class in terms of marks again a much lower percentage than for the lower-secondary level
bull Whenaskedtoidentifythemainreasonswhytheydecidedtobecometeachersthese future teachers at the elementary level had very similar response patterns to those at the lower-secondary level They mentioned their talent for teaching their perception of teaching as a challenging job and their desire to work with young people and to have an influence on the next generation as the most significant reasons For the most part they were not influenced by teacher salaries the availability of teaching positions or their love of mathematics (which is logical since elementary-level teachers are normally generalists)
bull Theserespondentswereaskedtoconsideranumberofmathematicstopicsandtoindicate which ones they had or had never studied As can be expected the vast majority had not studied many advanced topics in mathematics with over 90 not having studied advanced calculus abstract or linear algebra or theory of real or complex functions or functional analysis In fact the only advanced topics
23
studied by more than half of these respondents were probability and number theory In the context of their teacher-education programs over 85 said that they had not studied calculus validation or structuring and abstracting In terms of emphasis almost 90 said that in their programs they studied mathematics at the level of the school curriculum and 63 said that their learning was at a deeper or more conceptual level than that of the school curriculum
bull Intermsofmathematicspedagogyover80saidthattheirprogramscoveredmathematics instruction mathematics standards and curriculum and mathematics teaching per se Their programs allowed them to engage in the following activities most often exploring how to use manipulatives creating learning experiences that make central concepts under study meaningful to students locating suitable curriculum materials and teaching resources and developing games or puzzles accommodating a wide range of abilities in each lesson and building on studentsrsquo existing mathematics knowledge and thinking skills The activities that were mentioned the least often were using standardized tests to guide decisions about what and how to teach using assessment to give feedback to parents or guardians and helping students learn how to assess their own learning (similar to lower-secondary respondents)
bull Whenlookingateducationandpedagogytopicsoverathirdoftheelementary-level future teachers said that they had not studied methods of educational research or the history of education and educational systems
bull Withregardtotheirpracticaaswasthecaseforthelower-secondarylevelover60 agreed that they had a clear understanding of what their mentors expected of them as teachers in order to pass the practica that the feedback they received from their mentors helped them to improve their teaching methods and that this feedback helped them to improve their understanding of their students A large proportion of these respondents also felt that their mentors valued the ideas and approaches they brought from their teacher-education programs
bull Regardingtheperceivedoveralleffectivenessoftheirpre-serviceteacher-educationprograms elementary-level future teachers were generally more pleased than secondary-level future teachers with their programs in preparing them to teach mathematics
An important contribution of TEDS-M is the assessment of participating future teachers with regard to their knowledge of mathematics of mathematics pedagogy and of general pedagogy The design of TEDS-M lends itself to the ranking of countries according to theirmeanscoresonthesethreeareasHoweverinternationalcomparisonsbasedontheserankings are not desirable because these mean scores are relatively unstable due to the small number of respondents in several participating countries Moreover since Canada did not meet the sampling requirements the Canadian data must be treated with extreme caution For the same reason no results are provided by province although ministries and departments of education have access to their own data in order to analyze their results according to their own contexts
24
What may be most useful in the Canadian context is to look at countries that tend to perform better on this knowledge component and to analyze their contextual factors which may help to explain their results Furthermore it should be kept in mind that teacher-education programs in Canada are far from homogeneous mdash even within a province mdash and that it may be more useful to analyze the contextual factors in each province taking into account the limitations of the study
Results are presented separately for teachers at the elementary level and teachers at the lower-secondary level and are broken down for mathematics content knowledge and mathematics pedagogical content knowledge Results are scaled with an international mean of 500 and a standard deviation of 100
Figure 1 Mean scores and confidence intervals for participating countriesmdash Elementary-level future teachersrsquo mathematics content knowledge
Note The Canadian average score is not part of the international average score due to Canadas low response rates
Poland (490)
Malaysia (488)
Spain (481)
Canada (522)
Georgia (345)
Chile (413)
Botswana (441)
Philippines (440)
International (500)
Germany (510)
Thailand (528)
Norway (519)
United States (518)
Russian Federation (535)
Singapore (590)
Switzerland (543)
Chinese Taipei (623)
Below the international average
At the international average
Above the international average
330 350 370 390 410 430 450 470 490 510 530 550 570 590 610 630
95 Confidence interval
Estimated mean score
25
Figure 2 Mean scores and confidence intervals for participating countriesmdash Elementary-level future teachersrsquo pedagogy content knowledge
Note The Canadian average score is not part of the international average score due to Canadas low response rates
Among the other 15 countries participating in the study elementary-level future teachers from Chinese Taipei and from Singapore outperformed those from other countries in both mathematics content knowledge and mathematics pedagogical content knowledge Another groupofcountriescomprisingSwitzerlandNorwayandtheUnitedStateshadresultsabove the international average in both mathematics and pedagogical content knowledge as did Canada A group of six countries (Georgia Chile the Philippines Botswana Spain and Poland) performed below the international average in both components
International (500)
Spain (492)
Poland (478)
Canada (541)
Georgia (345)
Chile (425)
Philippines (457)
Botswana (448)
Germany (502)
Malaysia (503)
Switzerland (537)
Russian Federation (512)
Thailand (506)
United States (544)
Chinese Taipei (592)
Norway (545)
Singapore (593)
Below the international average
At the international average
Above the international average
330 350 370 390 410 430 450 470 490 510 530 550 570 590 610 630
95 Confidence interval
Estimated mean score
26
Figure 3 Mean scores and confidence intervals for participating countriesmdash Lower-secondary-level future teachersrsquo mathematics content knowledge
Note The Canadian average score is not part of the international average score due to Canadas low response rates
Thailand (479)
Oman (472)
Norway (444)
Canada (516)
Chile (354)
Georgia (424)
Philippines (442)
Botswana (441)
Malaysia (493)
International (500)
Switzerland (531)
Germany (519)
United States (505)
Poland (540)
Russian Federation (594)
Singapore (570)
Chinese Taipei (667)
Below the international average
At the international average
Above the international average
340 360 380 400 420 440 460 480 500 520 540 560 580 600 620 640 660 680
95 Confidence interval
Estimated mean score
27
Figure 4 Mean scores and confidence intervals for participating countriesmdash Lower-secondary-level future teachersrsquo pedagogy content knowledge
Note The Canadian average score is not part of the international average score due to Canadas low response rates
The results are quite similar at the lower-secondary level however future teachers from Chinese Taipei significantly outperformed all other countries in both mathematics and pedagogical content knowledge This is not surprising considering that on the PISA 2006 mathematics assessment 15-year-old students from Chinese Taipei outperformed students from all other countries Interestingly future teachers from the Russian Federation had a much stronger performance in both aspects at the lower-secondary level compared to the elementary level This also holds true for German future teachers although to a lesser extent Conversely future teachers from Norway performed below the international average at the lower-secondary level even though they performed above the international average at the elementary level
Keeping in mind the serious data limitations for Canada it is worth noting that our future teachers performed above the international average in both mathematics and pedagogical content knowledge at both the elementary and lower-secondary levels
Oman (474)
Malaysia (472)
Norway (463)
Canada (513)
Chile (394)
Botswana (425)
Philippines (450)
Georgia (443)
Thailand (476)
International (500)
Germany (540)
Poland (524)
United States (502)
Switzerland (549)
Russian Federation (566)
Singapore (553)
Chinese Taipei (649)
Below the international average
At the international average
Above the international average
380 400 420 440 460 480 500 520 540 560 580 600 620 640 660 680
95 Confidence interval
Estimated mean score
28
Figure 5 Mean scores and confidence intervals by gender primary mathematics knowledge
Figure 6 Mean scores and confidence intervals by gender primary pedagogical knowledge
Among Canadian future teachers at the elementary level there was no statistical difference between their mathematics and pedagogical content knowledge Although the mean score for female future teachers was higher than that for males in pedagogical content knowledge the difference was not statistically significant Of note is the large imbalance intheproportionofmaleteachersinthesample(1in7)Howeverthisisafairlyaccuratereflection of the situation in the population which sees about 80 of teachers in elementary schools in Canada being female (Mullis et al 2007)
524
521Female
Male
400 450 500 550 600
528
543Female
Male
400 450 500 550 600
29
Figure 7 Mean scores and confidence intervals by gender lower-secondary mathematics knowledge
Figure 8 Mean scores and confidence intervals by gender lower-secondary pedagogical knowledge
At the lower-secondary level male future teachers had higher mean scores in both mathematics and pedagogical content knowledge than did females but the differences were not statistically significant The gender imbalance in the sample was not as pronounced at this level as at the elementary level (three female future teachers for every two males at the lower-secondary level) Overall in Canada this is a fair reflection of the situation at the lower-secondary level which sees approximately 70 of teachers being female2
527
509Female
Male
400 450 500 550 600
526
505Female
Male
400 450 500 550 600
2 According to the Pan-Canadian Assessment Program 2007 across all provinces and territories between 50 and 87 of teachers of 13-year-olds are females
30
ConclusionTEDS-M is a comparative study of teacher education with a focus on the preparation of mathematics teachers at the elementary and lower-secondary levels As the first attempt to systematically investigate both the knowledge and skills of future teachers in an international setting the study faced significant challenges in several countries In Canada given the structure of our education systems provinces and territories individually determined whether they wished to be involved in such an endeavour Four provinces (Ontario Quebec Nova Scotia and Newfoundland and Labrador) elected to participate and in each province the participation of individual institutions individual educators and individual future teachers was completely voluntary The very low response rates obtained in Canada and the ensuing non-inclusion in the international data set are indeed disappointing mdash but also very informative mdash should such an initiative be repeated in the future Conducting such an ambitious assessment project is possible but would require engaging all parties early on and throughout the implementation of the project
We are grateful to the ministriesdepartments of education institutions faculties of education educators and future teachers who did participate in this TEDS-M 2008 assessment project It is hoped that the project will yield useful information to guide teacher education in the future
Keeping in mind the serious limitations of the data gathered from TEDS-M there are a few conclusions from the study that may help elicit further discussion among policy-makers and educators
bull IngeneralCanadianinstitutionsdonotseemtohaveverystrongrequirementsin mathematics for individuals wishing to enter into teacher-education programs Other than assessments to meet the requirements for a course in mathematics or in mathematics education there is no formal test of the mathematical knowledge or skills of future teachers at the completion of their program of study
bull Mosteducatorsofmathematicsorofmathematicspedagogyforfutureteachersin Canadian universities are specialized in areas other than mathematics and few hold a doctorate in the discipline At the international level about one-quarter of educators who participated in the TEDS-M study held a doctorate in mathematics with a higher proportion in higher-performing countries In Canada 10 per cent of participating educators held a doctorate in mathematics
bull WithregardtoknowledgeofmathematicsandofmathematicspedagogyCanadianfuture teachers at the elementary and lower-secondary levels performed above the international average Although Canadian 15-year-olds have performed among the top-ranking countries in mathematics since the inception of PISA in 2000 it appears that there is potential for further improvement by possibly providing future teachers at the elementary level with more advanced training in mathematics that covers elements beyond the school curriculum and by providing future teachers at the lower-secondary level with more advanced training in testing- and assessment-related topics
31
ReferencesAtlantic Evaluation and Research Consultants (2007) Kndash12 mathematics curriculum review Final report Retrieved from httpwwwedgovnlcaedupublicationsk12NLMathReportpdf
Bloumlmeke S Kaiser G amp Lehmann R (Eds) (2010) TEDS-M 2008 Professional Competences and Opportunities to Learn of Future Mathematics Teachers at Lower-Secondary Schools in the International Context Muumlnster Waxmann
Bloumlmeke S Kaiser G amp Lehmann R (Eds) (2010) TEDS-M 2008 Professional Competences and Opportunities to Learn of Future Primary Teachers in the International Context Muumlnster Waxmann
Carnoy M Beteille T Brodziak I Loyalka P amp Luschei T (2009) Do countries paying teachers higher relative salaries have higher student mathematics achievement Palo Alto CA StanfordUniversityRetrievedfromhttpstedseducmsueduTEDS_CostsStudyzip
Council of Ministers of Education Canada (2009) PCAP-13 2007 Contextual Report on Student Achievement in Reading Toronto Author
Crocker R amp Dibbon D (2008) Teacher education in Canada a baseline study Kelowna BC Society for the Advancement of Excellence in Education
Dibbon D amp Sheppard B (2001) Teacher demand supply and retention in Newfoundland and LabradorMemorialUniversityofNewfoundlandRetrievedfromhttpwwwmuncaeducpeoplefacultyddibbonpdfFinal20reportchapter1-Introductionpdf
Feng-JuiHTing-YingWChia-JuiHShu-JyhTGuohengCChiu-KeungLet al (2010) A milestone of an international study in Taiwan teacher education National Research Center of Taiwan Teacher Education and Development Study in Mathematics in Taiwan
Ministegravere de lrsquoEacuteducation du Queacutebec (2004) Surplus ou peacutenurie de personnel enseignant qualifieacute au Queacutebec situation actuelle et perspectives agrave court et moyen terme pour le secteur francophone Retrieved from httpwwwmelsgouvqccadftpsinterieurpdfpers_emploi_prevision_nov04pdf
Mullis IVS Martin MO Kennedy AM amp Foy P (2007) PIRLS 2006 International ReportChestnutHillMABostonCollege
Mullis I Martin M Ruddock G OrsquoSullivan C Arora A amp Erberber E (2005) TIMSS 2007 assessment frameworks International Association for the Evaluation of Educational Achievement Retrieved from httptimssbceduTIMSS2007PDFT07_AFpdf
Nova Scotia Department of Education (2007) Nova Scotia public education teacher supply and demand Retrieved from httpwwwednetnscapdfdocsreportsteacher_supply_and_demand_reportpdf
32
Nova Scotia Department of Education (2008) Report and recommendations of the review panel on teacher education in Nova Scotia Retrieved from httpwwwednetnscaeventsteacher_education_reviewdocumentsreview_panel_report_web_epdf
Ontario College of Teachers (2001) Teacher supply and demand Report on the consultation Retrieved from httpwwwoctcapublicationspdftsd_epdf
Ontario College of Teachers (2007) State of the teaching profession 2007 Annual Ontario College of Teachers survey of teachers Retrieved from httpwwwoctcapublicationsPDFsurvey07_epdf
Ontario College of Teachers (2009) Transition to teaching 2009 Retrieved from httpwwwoctcapublicationsPDFtransitions09_epdf
Statistics Canada (2008) CANSIM Table 477-0014 mdash University degrees diplomas and certificates granted by program level Classification of Instructional Programs Primary Grouping (CIP_PG) and sex annual (number) Retrieved from httpdc2chassutorontoca
Tatto MT Ingvarson L Schwille J Peck R Senk SL amp Rowley G (2008) Teacher Education and Development Study in Mathematics (TEDS-M) Policy practice and readiness to teach primary and secondary mathematics Conceptual framework East Lansing MITEDS-MInternationalStudyCenteratMichiganStateUniversityRetrievedfromhttpstedseducmsueduTEDS_FrameworkFinalzip
33
APPENDIX I
sample syllabus Coding
math 250 probability and statistics for elementary middle-school teachers
Instructor Dr KP Lee Office 456HonorsTower
Phone 789-0123 E-mail kpleestandarduedu
Office hours 350ndash450 pm on Mondays and by appointment
COurse prereQuisitesCompletion of Math 125 or equivalent with a C grade or higher Those not meeting the course prerequisites will be automatically dropped from the course by the Department of Mathematics
COurse materialsText Probability and Statistics for ElementaryMiddle-School Teachers
A TI-73 graphing calculator (other models such as the TI-83 and TI-86 will not have the features needed for this course and will not be sufficient)
COurse Overview anD ObjeCtivesThis course is designed to provide pre-service elementary and middle-school teachers with
[laboratory-based experiences designed to teach and reinforce basic statistics and probability concepts often situated in the core tasks of teaching including the examination and critiquing of the statistical thinking and arguments of others]
[opportunities to demonstrate their understanding of statistics and probability concepts in meaningful constructive and alternative ways]
[activities involving the use of calculator technology (this course is usedtosatisfypartoftheUniversityComputerUsagerequirementfor students in elementary teacher education)]
[experiences that model techniques for use in their future elementarymiddle-school classrooms]
U1 T24
B1 T2117331332
B2 T2
117
B3 T2
117355356
34
[The majority of class time will be devoted to small-group exploration and class discussion with an emphasis on reasoning and communication of statistics and probability ideas rather than on rote memorization Students will be expected to demonstrate that they are prepared for class each day by bringing course materials and completed homework assignments Students will be asked to work cooperatively in groups and participate in whole-class discussions Studentsrsquo consistent engagement in these activities will be reflected in their participation grade]
Codes Used in this Excerpt
U1 Sequentialunitnumberofthecodeddocument
T2 An objective of the course
T24 A course that covers specialized mathematics knowledge needed for teaching mathematics
B1 B2 B3 and B4 Each block of information being coded
117 Mathematics block on data representation probability and statistics
331 Mathematics education block on developing mathematical concepts
332 Mathematics education block on reasoning argumentation and proving
355 Mathematics instruction block on using calculators
356 Mathematics instruction block on using computers
117
B4 T2
35
APPENDIX II
examples of assessment items in the primary general pedagogy Knowledge for teaching section of the future teacher Questionnaire
Example 1
Label MFC106Item type Multiple choiceDimension Mathematics Content KnowledgeDomain DataSub-domain Applying
Two fair six-sided number cubes are thrown in a probability game and the two numbers at the top are recorded
Josie wins if the difference between the two numbers is 0 1 or 2 Farid wins if the difference between the two numbers is 3 4 or 5
The students discuss whether the game is fair
Which of the following statements is correct
Check one box
A Both have an equal chance of winning
33
B Josie has the greater chance of winning
50
C Farid has the greater chance of winning
12
D As the game involves number cubes itrsquos not possible to say who has the greater chance of winning
05
For this probability question only half of the future teachers responded correctly that Josie had a greater chance of winning One-third of the respondents were incorrectly drawn to the first option thinking that both Josie and Farid had an equal chance of winning
36
Example 2
Label MFC108Item type Multiple choiceDimension Mathematics Pedagogical Content KnowledgeDomain AlgebraSub-domain Enacting
Amy is building a sequence of geometric figures with toothpicks by following the pattern shown below Each new figure has one extra triangle
Variable t denotes the position of a figure in the sequence
In finding a mathematical description of the pattern Amy explains her thinking by saying I use three sticks for each triangle
Then I see that I am counting one stick twice for each triangle except the last one so I have to remove those
Variable n represents the total number of toothpicks used in a figure
Which of the equations below best represent Amyrsquos statement in algebraic notation
Check one box
A n = 2t + 1 29
B n = 2(t + 1) ndash 1
26
C n = 3t ndash (t ndash1)
36
D n = 3t + 1 ndash t
08
This question was difficult for Canadian future teachers with almost two-thirds of the respondents unable to identify the correct algebraic notation for this pattern
t = 1 t = 2 t = 3
hellip
37
Example 3
Label MFC202Item type Multiple choiceDimension Mathematics Content KnowledgeDomain AlgebraSub-domain Knowing
Indicate whether each of the following statements is true for the set of all whole numbers a b and c greater than zero
Check one box in each row
True Not True
A a ndash b = b ndash a
16
84
B a divide b = b divide a
06
95
C (a + b) + c = a + (b + c)
93
07
D (a ndash b) ndash c = a ndash (b ndash c)
23
77
ThisalgebraquestionwasrelativelyeasyforCanadianfutureteachersHoweveralmostone-quarter of the respondents did not know that the fourth statement was not true even though the question appeared to be relatively easy to solve with whole numbers
38
Example 4
Label MFC203Item type Multiple choiceDimension Mathematics Content Knowledge Domain GeometrySub-domain Applying
A rectangular-shaped swimming pool has a paved walkway (shaded) around it as shown
What is the area of the walkway
Check one box
A 100 m2
04
B 161 m2
06
C 710 m2
78
D 1610 m2
12
This question was relatively easy for Canadian respondents with 78 getting the correctanswerHowever12calculatedtheentireareabutfailedtosubtractthearea of the swimming pool
70 m
50 m
18 m 23 mPool
not to scale
Walkway
39
Example 5
Label MFC206Item type Constructed responseDimension Mathematics Content Knowledge Domain NumberSub-domains Applying Planning
a) Amachineuses24litresoffuelforevery30hoursofoperationHowmanylitresoffuel will the machine use in 100 hours if it continues to use fuel at the same rate
Check one box
A 72
11
B 80
79
C 84
08
D 96
02
This question was relatively easy for Canadian respondents with almost 80 getting thecorrectresponseHoweveroneinfiverespondentsdidmakeacalculationerrorwhen solving this simple problem
b) Create a different problem of the same type as the problem in (a) (same processesoperations) that is EASIER for primary children to solve
40
Scoring Guide
Code Response Item MFC206B
Correct Response
10
A different problem of the same type (same processesoperations) but easier to solveExamples
bull Amachineuses3litresoffuelforevery30hoursofoperationHowmanylitres of fuel will the machine use in 100 hours
bull Acaruses24litresoffuelforevery50kmHowmanylitresoffuelwillthe car use in 100 km
Incorrect Response
70
A different problem of the same type (same processesoperations) but NOT easier to solve (Note Items judged to be of the same level of difficulty are NOT easier)Examples
bull Amachineuses2litresoffuelforevery30hoursofoperationHowmanylitres of fuel will the machine use in 100 hours (2 is not divisible by 3)
bull Atapdrips2litresofwatereverydayHowmanymlisthispersecond(The metric knowledge required and the computational load are significantly higher)
79
Other incorrect response (including crossed out erased illegible or off-task responses and stray marks)Examples
bull questionsthatarenotmeaningfulorhavenoanswer
No Response
99 Blank
About 84 of Canadian future teachers were able to create a problem of the same type but that was easier to solve Nine per cent of respondents created a similar problem but that was not easier to solve
41
examples of assessment items in the secondary general pedagogy Knowledge for teaching section of the future teacher Questionnaire
Example 1
Label MFC604Item type Constructed responseDimension Mathematics Content KnowledgeDomain AlgebraSub-doman Applying
The following problems appear in a mathematics textbook for lower secondary schools
1 Peter David and James play a game with marbles They have 198 marbles altogether Peter has 6 times as many marbles as David and James has 2 times as many marbles asDavidHowmanymarblesdoeseachboyhave
2 Three children Wendy Joyce and Gabriela have 198 zeds altogether Wendy has 6timesasmuchmoneyasJoyceand3timesasmuchasGabrielaHowmanyzedsdoes each child have
(a) Solve each problem
Solution to Problem 1
Solution to Problem 2
42
Scoring Guide
Note The correct answers to MFC604A1 and MFC604A2 are as follows
Problem 1 David has 22 marbles Peter has 132 marbles and James has 44 marbles
Problem 2 Wendy has 132 zeds Joyce has 22 zeds and Gabriela has 44 zeds
The following methods are considered in the scoring guide
1) Usingone variable setting up one equation and solving
Example (Problem 1) Let m = the number of marbles that David has Then Peter has 6m and James has 2m Therefore 6m + 2m + m = 198 and m = 22
2) Usingmore than one variable establishing a system of equations performing substitutions and solving
Example (Problem 1) Let p = the number of marbles that Peter has d = the number of marbles that David has and j = the number of marbles that James has Therefore p = 6d and j = 2d p + d + j = 198
3) Trial and error or guess and check
4) Ratio or other arithmetic methods
5) Representationdiagram
Code Response Item ID MFC604A1
Correct Response
11 Response uses Method 1 correctly to solve Problem 1 and get the correct answers
12 Response uses Method 2 correctly to solve Problem 1 and get the correct answers
13 Response uses Method 3 correctly to solve Problem 1 and get the correct answers
14 Response uses Method 4 correctly to solve Problem 1 and get the correct answers
15 Response uses Method 5 correctly to solve Problem 1 and get the correct answers
19Response uses a correct but different method from those listed above to solve Problem 1 and get the correct answers
Incorrect Response
70Response uses one of Methods 1 to 5 to solve Problem 1 but arrives at an incorrect answer or cannot complete the solution because of a computation or algebra error
71Response uses a correct but different method from those listed above to solve Problem 1 but arrives at an incorrect answer or cannot complete the solution because of a computation or algebra error
79 Other incorrect response (including crossed out erased illegible or off-task responses and stray marks)
No Response
99 Blank
43
Code Response Item ID MFC604A2
Correct Response
11 Response uses Method 1 to solve Problem 2
12 Response uses Method 2 to solve Problem 2
13 Response uses Method 3 to solve Problem 2
14 Response uses Method 4 to solve Problem 2
15 Response uses Method 5 to solve Problem 2
19Response uses a correct but different method from those listed above to solve Problem 2 and get the correct answers
Incorrect Response
70Response uses one of Methods 1 to 5 to solve Problem 2 but arrives at an incorrect answer or cannot complete the solution because of a computation or algebra error
71Response uses a correct but different method from those listed above to solve Problem 2 but arrives at an incorrect answer or cannot complete the solution because of a computation or algebra error
79 Other incorrect response (including crossed out erased illegible or off-task responses and stray marks)
No Response
99 Blank
Overall Problem 1 was easy to solve for Canadian future teachers with 85 getting the correct response The majority of respondents (53) used Method 1 to solve Problem 1 and 29 used Method 2 Problem 2 was of medium difficulty for Canadian future teachers with 65 getting a right answer Sixteen per cent of future teachers used one of the five methods listed to solve Problem 2 but made a computation or algebra error (code 70)
44
Example 2
Label MFC610Item type Multiple choiceDimension Mathematics Content KnowledgeDomain NumberSub-domain Knowing
Determine whether each of the following is an irrational number always sometimes or never
Check one box in each row
Always Sometimes Never
A The result of dividing the circumference of a circle by its diameter
65 26 09
B The diagonal of a square with side of length 1
75 11 14
C Result of dividing 22 by 7 66 06 28
Canadian future teachers had some difficulty identifying the characteristics of irrational numbers Only 28 of respondents knew that dividing 22 by 7 never results in an irrational number possibly confusing this fraction with π which is irrational
45
Example 3
Label MFC704Item type Constructed responseDimension Mathematics Content KnowledgeDomain GeometrySub-domain Applying
On the figure ABCD is a parallelogram ang BAD = 60˚ AM and BM are angle bisectors of angles BAD and ABC respectively If the perimeter of ABCD is 6 cm find the sides of triangle ABM
Write your answers on the lines below
AB = _______ cm
AM = _______ cm
BM = _______ cm
Scoring Guide
Code Response Item ID MFC704
Correct Response
20
Response indicates all three correct entries belowAB = 2 cmAM = radic3 cm or equivalentBM = 1 cm
Partially Correct Response
10 Response indicates any two correct entries and one incorrect (or blank) entry
11 Response indicates any one correct entry and two incorrect (or blank) entries
Incorrect Response
79 Incorrect mathematical statements or statements of no value (including crossed out erased illegible or off-task responses and stray marks)
No Response
99 Blank
This was a difficult question for Canadian future teachers with only 41 giving all three correct responses Another 14 had two correct responses and 8 had one correct response This means that 37 of respondents could not find any of the three measures of the triangle
D
A B
M C
46
Example 4
Label MFC705Item type Multiple choiceDimension Mathematics Content KnowledgeDomain GeometrySub-domain Knowing
We know that there is only one point on the real line that satisfies the equation 3x = 6 namely x = 2
Suppose now that we consider this same equation in the plane with coordinates x and y and then in space with coordinates x y and z What does the set of points that satisfy the equation 3x = 6 look like in these settings
Check one box in each row
One point One line One plane Other
A The solution to 3x = 6 in the plane 22 69 08 01
B The solution to 3x = 6 in space 14 09 71 07
This geometry question was moderately difficult for Canadian future teachers with about 70 of respondents knowing that the proposed solution would look like one line in the plane and one plane in space
- Table of Contents
- List of Figures
- What is TEDS-M 2008
- Research design and methodology for TEDS-M
- What is to be learned from TEDS-M
- What value will TEDS-M add to existing research on teacher education
- Target populations
- Components of TEDS-M
-
- Component 1 studies of teacher-education policies for elementary and lower-secondary mathematics teachers and their cultural and social contexts
- Component 2 studies of elementary and lower-secondary mathematics teacher-preparation routes programs standards and expectations for teacher learning
- Component 3 studies of the mathematics and related teaching knowledge of future elementary and lower-secondary school teachers
-
- Participating countries in TEDS-M
- The Canadian administration
- Structure and organization of teacher education in Canada
- Programs in specific jurisdictions
-
- Ontario
- Quebec
- Nova Scotia
- Newfoundland and Labrador
-
- The administration of the TEDS-M survey in Canada
-
- Representation at international meetings
- Adaptation translation and approval of assessment and questionnaire materials
-
- Sampling institutions
-
- Contacting institutions and sending and collecting materials
- Quality monitoring
- Coding
-
- Description of teacher-education courses and collection and coding of syllabi
- Coding of mathematics content knowledge and mathematics pedagogical content knowledge
-
- Results
-
- Institutional Program Questionnaire
- Survey for Mathematics Mathematics Pedagogy and General Pedagogy Educators
- Survey for Future Teachers of Lower-Secondary Mathematics
- Survey for Future Teachers of Primary Elementary Mathematics
-
- Conclusion
- References
- Figures
-
- Figure 1enspMean scores and confidence intervals for participating countriesmdashElementary-level future teachers mathematics content knowledge
- Figure 2enspMean scores and confidence intervals for participating countriesmdashElementary-level future teachers pedagogy content knowledge
- Figure 3enspMean scores and confidence intervals for participating countriesmdashLower-secondary-level future teachers mathematics content knowledge
- Figure 4enspMean scores and confidence intervals for participating countriesmdashLower-secondary-level future teachers pedagogy content knowledge
- Figure 5enspMean scores and confidence intervals by gender primary mathematics knowledge
- Figure 6enspMean scores and confidence intervals by gender primary pedagogical knowledge
- Figure 7enspMean scores and confidence intervals by gender lower-secondary mathematics knowledge
- Figure 8enspMean scores and confidence intervals by gender lower-secondary mathematics knowledge
-
- Appendices
-
- APPENDIX I
-
- Sample Syllabus Coding
-
- APPENDIX II
-
- Examples of assessment items in the Primary General Pedagogy Knowledge for Teaching section of the Future Teacher Questionnaire
- Examples of assessment items in the Secondary General Pedagogy Knowledge for Teaching section of the Future Teacher Questionnaire
-

11
usually concentrated in one or two years (two to four semesters) The duration is related to certification requirements for example a two-year program following a first degree is the minimum requirement for certification in Nova Scotia while a one-year program is required for certification in Ontario
Some institutions offer only one route while others offer both routes The general trend across most provinces is toward consecutive programs The exception is Quebec where almost all programs offer concurrent studies
Because most jurisdictions have strong incentives for upgrading academic credentials built into their salary scales most teachers continue their academic education beyond the first degree For this reason it is common for teachers to possess two undergraduate degrees one in an area of academic specialization and a BEd or equivalent In any event two degrees is the normal outcome of consecutive teacher-education programs Across Canada close to 20 per cent of teachers have a masterrsquos degree usually in education The proportion holding advanced degrees varies across jurisdictions and is linked to the structure of the certificationsalary scale
In either of the two routes to a BEd most institutions offer programs at two levels elementary and secondary Teachers of the elementary grades are usually considered generalists while teachers at the secondary level are expected to specialize in one or more disciplines Consequently most elementary programs are concurrent and most secondary programs are consecutive The specialization associated with an academic degree in a major subject area is considered desirable for secondary teachers The concept of a ldquoteachable subjectrdquo that is a discrete subject in the provincial curriculum is often transferred from certification requirements to academic major subjects creating the expectation that the academic major is some subject that can be taught in schools
In some jurisdictions teaching certificates are endorsed only for specific levels or subjects Howeverthedegreetowhichtheteachersholdingtheseendorsedcertificatesarerestrictedto their defined areas of specialization varies by jurisdiction and location and depends on teacher supply and demand
Beyond the two program routes and the two levels for which teachers are prepared a variety of more specialized programs can be found For example physical education and music are often separated from mainstream programs and offered either through the respective academic units or through collaborative arrangements between programs Special education second-language teaching Aboriginal studies and technological studies are other examples of areas in which specialized programs have been developed Sometimes these are organized as separate degrees (such as a Bachelor of Special Education or a Bachelor of Physical Education) but these areas are also specializations within the mainstream degrees
All teacher-education programs require student teachers to participate in some in-school teaching experience referred to variously as a practicum an internship or student teaching Indeed this is generally a significant component of teacher-education programs The long-term trend is toward longer in-school placements distributed throughout the program rather than concentrated at the end
12
Programs in specific jurisdictionsTEDS-M from the International Association for the Evaluation of Educational Achievement (IEA) was conducted in four Canadian jurisdictions mdash Ontario Quebec Nova Scotia and Newfoundland and Labrador
OntariOThere are 14 publicly assisted faculties of education in Ontario universities together they enrol approximately 13000 students and graduate about 8000 teacher candidates per year All of the publicly assisted faculties of education offer programs in English and two offer programs in French
Almost all Ontario institutions offer consecutive programs of two semestersrsquo duration to students who already have a bachelorrsquos degree The practicum ranges from a minimum of 42 days to over 60 days depending on the institution The number of graduates from teacher-education programs ranges from fewer than 100 per year to more than 1000 per year in the larger institutions although most programs enrol at least several hundred students A three-level structure categorized into PrimaryJunior (Grades Kndash6) JuniorIntermediate (Grades 4ndash10) and IntermediateSenior (Grades 7ndash12) is typical and this structure conforms to the structure for teacher certification This allows teachers to be certified to teach a range of grade levels Some more highly specialized programs are offered in areas such as music second-language teaching and technological studies Candidates for admission to the faculties of education in Ontario apply through the central Teacher Education Application Service (TEAS) which allows applicants three choices of institution or program Individual universities conduct their selection of candidates
Teacher certification in Ontario is governed by an independent body the Ontario College of Teachers (OCT) The governing council of this body comprises 23 teacher-members elected by members of the college and 14 members of the public appointed by the provincial government and broadly representative of other stakeholders in education Graduates of teacher-education programs at Ontario universities apply to OCT for a general certificate of qualification and registration as their licence to teach OCTrsquos ldquoTransition to Teachingrdquo studies indicate that early in the decade the province was experiencing a generalshortageofteachersHoweverinrecentyearsOntariorsquosemploymentmarkethasbeen characterized by an oversupply of teachers in most subject areas as the number of new teachers entering the profession has substantially increased and the number of teachers leaving the profession or retiring has declined (Ontario College of Teachers 2009)
QuebeC Twelve institutions offer teacher-education programs in Quebec nine in French and three in English Close to 18000 students are enrolled in these programs and about 4000 graduate per year This rate reflects the concurrent nature of most Quebec programs under which students take four years to complete the BEd degree Typically programs are divided into elementary and secondary levels with many more specialized programs Candidates for teaching at the elementary level are prepared as generalists candidates for teaching at the secondary level are expected to specialize in subjects or subject clusters corresponding to those taught in secondary schools Most programs are specifically designed to prepare candidates for certification as teachers in Quebec
13
Teacher certification in Quebec is governed by the Comiteacute drsquoagreacutement des programmes de formation agrave lrsquoenseignement (CAPFE) [committee on accreditation of teacher-training programs] a representative body of stakeholders CAPFE is responsible for accrediting teacher-training programs in the province and it is an autonomous independent body created and funded by the Ministry of Education Recreation and Sports
The most recent work on teacher supply and demand in Quebec was a report by the Service des eacutetudes eacuteconomiques et deacutemographiques [department of economic and demographic research] dated November 2004 The report (Ministegravere de lrsquoEacuteducation du Queacutebec 2004) noted that teacher shortages were expected for teachers of French language arts and social sciences in the period from 2005 to 2007 due to changes to the curricula There would also be shortages in 2006 in the number of second-language (French and English) teachers arts teachers and physical-education teachers It was also expected that there would be a deficit in mathematics and science teachers in French-language schools The report also predicted that declining enrolment in schools would lead to a major surplus of teachers in all disciplines for 2008 to 2013
nOva sCOtiaFour institutions in Nova Scotia offer teacher-education programs three in English and one in French All these programs are relatively small compared to national averages with approximately 900 students and 400 graduates per year in total This represents a substantial decrease from the early 1990s when an external review led to the closure of programs at several institutions and a reduction in the number of students accepted into teacher education That review also led to the establishment of the only system in Canada in which a two-year (four-semester) consecutive program is the norm and a requirement for certification
Nova Scotia is one Canadian jurisdiction in which high-profile government-commissioned external reviews have had an impact on teacher education The most recent review completed in 2008 (Nova Scotia Department of Education 2008) addressed both program structures and labour-market issues The major labour-market concern was the continued oversupply of teachers despite the significant constraints imposed following the previous review The oversupply was attributed to the continuing substantial demand for places many students move to other jurisdictions to complete their programs encouraged by arrangements negotiated between Nova Scotia universities and institutions outside the province these students then return to Nova Scotia seeking certification As a consequence a recent Nova Scotia study of teacher supply and demand predicted that supply will exceed demand by a ratio of close to 31 from now until 2014 with approximately 1000 teachers entering the system every year and only about 360 leaving (Nova Scotia Department of Education2007)Howevershortageswouldcontinuetobefeltinspecificgeographicalareas of the province and in some subject areas (but not in mathematics)
Teacher certification in Nova Scotia is administered by the Department of Education The Office of Teacher Certification is advised by a representative committee of stakeholders appointed by the minister of education
14
newfOunDlanD anD labraDOrNewfoundland and Labrador has only one university offering teacher-education programs A total of approximately 1000 students register and about 500 graduate annually The main program divisions are referred to as PrimaryElementary and Intermediate Secondary The PrimaryElementary program is concurrent requiring a total of five years to complete Students enter the professional component usually in the third year The IntermediateSecondary program is a three-semester consecutive one completed over 14 months Specialized programs are available in music physical education technology special education and other areas All programs are designed to meet the provincersquos teacher-certification requirements
Teacher certification in Newfoundland and Labrador is governed by a representative body of stakeholders and the system is administered by the Department of Education The most recent comprehensive study of teacher supply and demand in Newfoundland and Labrador was completed in 2001 At that time Dibbon and Sheppard (2001) found that in spite of a large pool of substitute teachers in the province the supply of teachers in the specialized areas of mathematics and science was low and remote communities had difficulty recruiting teachers Since that time both the number of new positions and of new graduates per year have increased suggesting that the supply-demand ratio has not changed very much
A recent review of school mathematics programs in Newfoundland and Labrador (Atlantic Evaluation and Research Consultants 2007) which included a comprehensive survey of mathematics teachers revealed that only a small proportion (about 10 per cent) of elementary school teachers have mathematics as their major area of study The proportions are much higher for Grade 9 (72 per cent) and for senior-secondary school (83 per cent)
The administration of the TEDS-M survey in CanadaAs stated previously TEDS-M was administered in four provinces in Canada (Ontario Quebec Nova Scotia and Newfoundland and Labrador) These four provinces mandated the Council of Ministers of Education Canada (CMEC) to act as the National Research Centre (NRC) responsible for the coordination of the study
NRC was responsible for representing provinces at international meetings adapting translating and approving all assessment and questionnaire materials sampling institutions educators and future teachers in accordance with international guidelines contacting participating institutions and sending and collecting materials arranging for quality-monitoring of the administration arranging the coding of curriculum documents questionnaires and assessment materials capturing and validating all data and analyzing the data and publishing the national report
15
representatiOn at internatiOnal meetingsThe International Study Centre (ISC) for TEDS-M was located at Michigan State UniversityISCwasresponsiblefortheplanningimplementationandreportingofallaspects of the study at the international level A conceptual framework (Tatto et al 2008) guided the design of the study Throughout the development of the framework and of all instruments the international group of experts from ISC consulted NRC on a regular basis including at biannual meetings
aDaptatiOn translatiOn anD apprOval Of assessment anD QuestiOnnaire materialsAll materials were developed by ISC in English and approved by all participating countries Individual countries were responsible for adapting materials for use in their own country and for translating all materials into the target language(s) for the country In Canada TEDS-M was administered in English and in French and all documents (manuals questionnaires coding guides) had to be approved by ISC prior to the administration
Sampling institutions
In order to ensure that valid cross-national comparisons could be made ISC implemented strict sampling guidelines based on national probability samples In Canada with only four provinces participating it was determined that all 31 institutions in these provinces wouldbeinvitedtoparticipateHoweverinstitutionsrsquoparticipationwasvoluntaryandtheinstitutional response rate was very low (37 or n=10) This could be explained in large part by the fact that the administration of the survey was occurring at the end of April a very busy period for institutions with end-of-term exams and practica In several cases institutionsrsquo research-ethics committeesboards did not have sufficient time to review the application to conduct the study
A total of 94 educators were sampled in the 10 participating institutions Again it was determined to invite all educators (of pedagogy mathematics and mathematics pedagogy) to participate Overall 74 educators responded to the questionnaires a response rate of 79 per cent
For the reasons stated above the response rates for future teachers were also very low Overall 183 future teachers at the elementary level and 155 future teachers at the secondary level participated (response rates of 69 per cent and 79 per cent respectively)
As a result of these low response rates (overall and within institutions) the sampling referee determined that the Canadian sample was not sufficiently representative of the overall population and ISC elected to report all Canadian results in appendix to the international report and did not include Canada in all international comparisons
16
COntaCting institutiOns anD senDing anD COlleCting materialsAdministering the TEDS-M survey was a collaborative task shared between the National Research Centre institutional coordinators and survey administrators
Institutional coordinators were responsible for seeking the participation of educators and of future teachers as well as for most administrative arrangements for the TEDS-M main study at the institution including providing a list of future teachers and educators administering educator and institutional questionnaires and collecting syllabi
The National Research Centre appointed survey administrators to administer the sessions to future teachers Survey administrators were selected on the basis of their experience If possible individuals who had previous experience in survey or test administration (eg the Trends in International Mathematics and Science Study the Progress in International Reading Literacy Study the Programme for International Student Assessment) were selected These survey administrators reported directly to the National Research Centre
Quality mOnitOringIn all participating countries approximately 10 per cent of participating institutions were visited during the administration of the survey International quality monitors ensured that the administration procedures were strictly followed and provided detailed reports to ISC
Generally the institutional coordinator was responsible for identifying the most suitable individual who could complete the institutional questionnaire The respondent was asked to complete the questionnaire confidentially and return it to the institutional coordinator It took approximately two hours to complete this questionnaire
The institutional coordinator was also responsible for identifying all educators who were teaching to the target population of future teachers at the time of the administration The questionnaire for educators took approximately 30 minutes to complete
The questionnaire for future teachers was administered by the survey administrator over a two-hour uninterrupted period There were two different versions of the Future Teacher Questionnaire one for elementary teachers and one for secondary teachers In each case several equivalent forms of the questionnaires were used Three of the four sections were equivalent across all forms of the questionnaires General Background (5 minutes) Opportunity to Learn (15 minutes) and Beliefs about Mathematics and Teaching (10 minutes) The Mathematics Knowledge for Teaching section (60 minutes) differed across booklets with some anchor questions to ensure equivalence across forms Some sample questions can be found in the section below
17
CODingDescription of teacher-education courses and collection and coding of syllabi
In all participating institutions the institutional coordinator asked participating educators to provide the course syllabus for each course they were teaching at the time of the data collection These syllabi were sent to the National Research Centre for coding (see Appendix I for a sample of a coded syllabus)
Syllabus analysis is a systematic method of obtaining comprehensive information from syllabus documentation and materials It examines content sequence (when and what topics are intended) and when appropriate performance expectations (what students are expected to do with the content) at the institutional and course levels Qualitative coding protocols were used to capture the coursesrsquo academic content
TEDS-M used a low inference procedure to perform the analysis to reliably investigate the opportunities to learn in different institutions and different countries In addition to understanding how to code the different syllabi coders developed a high level of reliability when coding Inter-coder reliability was closely monitored at the international level An example of the syllabus-coding activity can be found in Appendix I
Coding of mathematics content knowledge and mathematics pedagogical content knowledge
As described in the TEDS-M conceptual framework teaching mathematics consists of two constructs mathematics content knowledge and mathematics pedagogical content knowledge (see Appendix II for sample items) Each question in the Mathematics Knowledge for Teaching section measured one of the four content domains (number geometry algebra data) and one of the three cognitive domains (knowing applying reasoning) Each question in the Mathematics Pedagogical Content Knowledge section measured one of the three aspects of the framework (mathematical curricular knowledge knowledge of planning for mathematics teaching and learning enacting mathematics for teaching and learning)
Coding of all the knowledge questions took place in a central location All coders were graduating future teachers of mathematics who received extensive training Coder reliability was closely monitored throughout the coding session In Canada all coding took place in both English and French ensuring a high degree of consistency across languages
18
ResultsAs mentioned previously TEDS-M surveyed three populations institutions educators and future teachers This section presents some selected Canadian results from the three surveys Due to the very low response rates it should be noted that these results are descriptive of the participating respondents generalizations made to the entire population are not advised
institutional program QuestionnaireOverall 82 questionnaires were distributed to 10 participating institutions because these offered more than one program In some cases institutions offered consecutive andor concurrent programs in others they offered programs at the elementary andor secondary levels and in others yet programs in English andor French All these possible variations explain the number of questionnaires analyzed
HerearesomefindingsfromtheInstitutionalProgramQuestionnaire
bull Amajorityofinstitutions(65)preparefutureteacherstoteachinbothelementaryand secondary schools and there are as many concurrent as consecutive programs represented in the sample
bull Over60ofinstitutionsrequirefutureteachersundertakingtheprogramtohavecompletedatleastGrade12mathematics(advancedorregular)However26of programs do not require a minimum level of mathematics for future teachers
bull Almost all institutions (87) within guidelines set by regional or provincialauthorities set policies governing which applicants are admitted to the program
bull When selecting students for their teacher-preparation programs institutionspay particular attention to candidatesrsquo suitability for teaching which may be assessed by an interview or a written application or by their demonstrated high level of achievement in mathematics (with 87 and 65 of institutions rating thesecriteriaassomewhatimportantorveryimportantrespectively)Howevercandidatesrsquo overall achievement level (91) and performance at the end of the school year (100) are either not considered or considered not important for selection purposes This finding would need to be investigated further as it seems to be inconsistent with findings from Crocker and Dibbon (2008) which suggest that institutions do consider minimum averages in a set of prerequisite courses especially in a competitive environment where the number of applicants exceeds the number of places
bull Withrespecttoprovincialnormsrespondentsviewfutureteachersenteringtheprogram as either high- or above-average achievers (44 and 52 respectively)
bull In theprogramsunder study respondents state thateithermoderateormajorweight is placed on the following program goals
m planning lessons based on recommended pedagogical principles (100)m learning to reflect on onersquos own learning and teaching practices (100)m studying the content of the school curriculum and of the mathematics
curriculum to be taught (100)
19
bull Nolittleoronlysomeweightisplacedonthefollowinggoals
m interpreting data from externally conducted tests (69)m studying mathematics or other disciplines at the tertiary level (65 and
69 respectively)m learning specific strategies and curricula for teaching gifted students (61)m developing the knowledge and skills to do teacher action research (70)
bull Intermsofinstitutionalrequirementsforsuccessfullycompletingtheprogramallrespondents (100) state that future teachers must pass all courses required for the program successfully demonstrate a required level of teaching competence in the classroom and receive a passing grade on their field experience None of the programs require future teachers to write a thesis and only a few (less than 10) require future teachers to pass a written or an oral examination
bull Inabout three-quartersof theprograms teacherswhomentor future teachersduring their extended field practice receive some form of compensation As part of their responsibilities these mentors are expected in all programs to observe future teachers in classrooms They are also expected to provide a formal summative assessment and written narrative reports of the field practice
bull Generally institutionsare responsible forfindingplacements for theextendedteaching practice (in 82 of programs) and although about half of the institutions have no difficulty finding suitable placements for future teachers another 30 state that appropriate placements are not readily available in sufficient numbers
bull Ofthefacultyemployedtoteachmathematicsormathematics-relatedcontentto future teachers all institutions indicate that a masterrsquos degree would normally be required and 70 of institutions would normally require a doctorate Few institutions require that these educators be qualified to teach or have experience teaching at the elementary or secondary level However educators teachingmathematics pedagogy are normally expected to have some experience teaching at the elementary or secondary level in about half of the programs It should be noted that this relative lack of a requirement for teaching experience in some programs does not mean that many educators do not have some teaching experience This is illustrated below by the fact that more than half of the surveyed educators held a teaching certificate All institutions require that mentors supervising the extended teaching practice hold at least a bachelorrsquos degree and in 78 of the programs mentors are expected to hold a masterrsquos degree
survey for mathematics mathematics pedagogy and general pedagogy educatorsOverall 194 questionnaires were distributed and 94 questionnaires were returned
bull The academic rankof the respondentswaswell distributed across all possibleranks with 19 being professors 16 being associate professors 23 assistant professors 17 lecturers 14 instructors and 11 in other roles There were slightly more females (56) than males
20
bull Oftheseeducators27hadadegreeineducation14inmathematicseducationand 10 in mathematics at the doctoral level or higher These figures should be interpreted with caution As stated above a large number of respondents to the survey were likely to be sessional appointees
bull Fifty-twopercentofrespondentsheldateachingcertificateatthetimeofthestudy one-third has never held a teaching certificate
bull Onaveragetheseeducatorshavespentapproximately10yearsattheircurrentinstitutions and about seven years in their teacher-preparation role They teach mostly at the undergraduate level (93) but also at the masterrsquos level (48) and in some cases at the doctoral level (18) In terms of experience 30 have been involved in instructing or supervising future teachers for over 10 years but 37 have done this for three years or less suggesting the existence of a cadre of educators with relatively little experience at least when considering the general profile of the respondents
bull Overthepast12monthsmorethanhalfoftheseeducatorshavenotparticipatedin any professional-development activities related to mathematics or mathematics pedagogyHoweverover60hadparticipatedinatleastsixhoursofprofessionaldevelopment in general pedagogy
bull In thepastyear respondentshavespentabout30of theirworkingtimeonresearch and research-related activities
bull Whenaskedtoconsiderallcoursesintheteacher-educationprogramsofferedattheir institutions about 80 of these educators felt that each stage seemed to be planned to meet the main needs of future teachers at each stage of their preparation and that the programs were organized in a way that covered what future teachers needed tobecomeeffective teachersHowever30disagreed that therewereclear links between most of the courses in the program of study
bull When asked to describe future teachersrsquo level of preparedness for teachingmathematics as they complete the teacher-education program and start their teaching careers 80 or more of these educators felt that future teachers were prepared to a moderate or major extent to clearly communicate ideas and information about mathematics to students that they could establish appropriate learning goals in mathematics for students and that they could set up mathematics learning activities to help students achieve learning goals Conversely over a third of these educators felt that future teachers were not at all or just to a minor extent prepared to use computers and information and communication technology (ICT) to aid in teaching mathematics and to provide parents with useful information about studentsrsquo progress in mathematics Further research would be useful to compare the views of teachers principals and faculties regarding the level of preparedness in using ICT to teach mathematics
bull Finally almost 80 of educators felt that their pre-service teacher-educationprograms were effective or very effective in preparing future teachers of mathematics
21
survey for future teachers of lower-secondary mathematicsOverall 282 questionnaires were distributed to future teachers at the secondary level and 155 were completed
bull Themedianageofrespondentswas24yearsand61werefemalesAbout86of respondents always or almost always spoke the language of the questionnaire at home Eighty-three per cent had taken a calculus or pre-calculus course in high school When comparing themselves to other students at the same grade level in their schools 82 saw themselves as being at the top or near the top of their class in terms of marks
bull Whenaskedtoidentifythemainreasonswhytheydecidedtobecometeachersthese future teachers at the secondary level mentioned their perception of teaching as a challenging job their desire to have an influence on the next generation their desire to work with young people their belief that they have a talent for teaching and their love of mathematics as the most significant reasons For the most part they were not influenced by teacher salaries the availability of teaching positions or the fact that they had always been good students in school
bull Almosthalf(47)ofthesefutureteacherssaidthatneedingtoborrowmoneyhindered their studies during their teacher-preparation programs
bull Almostallfutureteachersatthesecondarylevel(95)thoughtthattheywouldor could possibly spend their entire career as a teacher
bull Theserespondentswereaskedtoconsideranumberofmathematicstopicsandtoindicate which ones they had or had never studied Over 80 stated that they had studied calculus linear algebra probability and theoretical or applied statistics Fifty per cent or more stated that they had never studied topology differential geometry theory of real or complex functions or functional analysis or abstract algebra In the context of their teacher-education programs more than half also said that they had not studied validation structuring and abstracting or calculus In terms of emphasis three-quarters said that in their programs they studied mathematics at the level of the school curriculum
bull Intermsofmathematicspedagogyover80saidthattheirprogramscoveredmathematics instruction mathematics standards and curriculum and the development of teaching plans Their programs allowed them to engage in the following activities most often accommodating a wide range of abilities in each lesson exploring how to use manipulatives and creating learning experiences that make central concepts under study meaningful to students The activities that were mentioned the least often were using standardized tests to guide decisions about what and how to teach using assessment to give feedback to parents or guardians and helping students learn how to assess their own learning
bull Whenlookingateducationandpedagogytopicsoverathirdofthesecondary-levelfuture teachers said that they had not studied methods of educational research or the history of education and educational systems
22
bull Withregardtotheirpracticaover60agreedthatthefeedbacktheyreceivedfromtheir mentors helped them to improve their teaching methods that this feedback helped them to improve their understanding of their students and that they had a clear understanding of what their mentors expected of them as teachers in order to pass the practica
bull Regardingtheperceivedoveralleffectivenessoftheirpre-serviceteacher-educationprograms almost a quarter of these future teachers at the secondary level felt that the programs were not effective in preparing them to teach mathematics
survey for future teachers of elementary mathematicsOverall 580 questionnaires were distributed to future teachers at the elementary level and 183 were completed Although the number of respondents is quite substantial the response rate is below the international standard therefore any generalization to the population of future elementary teachers should be made with extreme caution
bull Eighty-sevenpercentofrespondentsofthisquestionnairewerefemaleThismaybe slightly higher than the overall population of elementary teachers Based on the Progress in International Reading Literacy Study (2006) data in which five provinces participated the figures would vary between 72 and 86 for female teachersattheelementarylevelUnfortunatelynoofficialdataareavailableatthepan-Canadian level for this aspect
bull About95alwaysoralmostalwaysspokethelanguageofthequestionnaireathome Only 40 had taken a calculus or pre-calculus course in high school which is much lower than for future teachers at the lower-secondary level When comparing themselves to other students at the same grade level in their schools about half of the respondents saw themselves as being at the top or near the top of their class in terms of marks again a much lower percentage than for the lower-secondary level
bull Whenaskedtoidentifythemainreasonswhytheydecidedtobecometeachersthese future teachers at the elementary level had very similar response patterns to those at the lower-secondary level They mentioned their talent for teaching their perception of teaching as a challenging job and their desire to work with young people and to have an influence on the next generation as the most significant reasons For the most part they were not influenced by teacher salaries the availability of teaching positions or their love of mathematics (which is logical since elementary-level teachers are normally generalists)
bull Theserespondentswereaskedtoconsideranumberofmathematicstopicsandtoindicate which ones they had or had never studied As can be expected the vast majority had not studied many advanced topics in mathematics with over 90 not having studied advanced calculus abstract or linear algebra or theory of real or complex functions or functional analysis In fact the only advanced topics
23
studied by more than half of these respondents were probability and number theory In the context of their teacher-education programs over 85 said that they had not studied calculus validation or structuring and abstracting In terms of emphasis almost 90 said that in their programs they studied mathematics at the level of the school curriculum and 63 said that their learning was at a deeper or more conceptual level than that of the school curriculum
bull Intermsofmathematicspedagogyover80saidthattheirprogramscoveredmathematics instruction mathematics standards and curriculum and mathematics teaching per se Their programs allowed them to engage in the following activities most often exploring how to use manipulatives creating learning experiences that make central concepts under study meaningful to students locating suitable curriculum materials and teaching resources and developing games or puzzles accommodating a wide range of abilities in each lesson and building on studentsrsquo existing mathematics knowledge and thinking skills The activities that were mentioned the least often were using standardized tests to guide decisions about what and how to teach using assessment to give feedback to parents or guardians and helping students learn how to assess their own learning (similar to lower-secondary respondents)
bull Whenlookingateducationandpedagogytopicsoverathirdoftheelementary-level future teachers said that they had not studied methods of educational research or the history of education and educational systems
bull Withregardtotheirpracticaaswasthecaseforthelower-secondarylevelover60 agreed that they had a clear understanding of what their mentors expected of them as teachers in order to pass the practica that the feedback they received from their mentors helped them to improve their teaching methods and that this feedback helped them to improve their understanding of their students A large proportion of these respondents also felt that their mentors valued the ideas and approaches they brought from their teacher-education programs
bull Regardingtheperceivedoveralleffectivenessoftheirpre-serviceteacher-educationprograms elementary-level future teachers were generally more pleased than secondary-level future teachers with their programs in preparing them to teach mathematics
An important contribution of TEDS-M is the assessment of participating future teachers with regard to their knowledge of mathematics of mathematics pedagogy and of general pedagogy The design of TEDS-M lends itself to the ranking of countries according to theirmeanscoresonthesethreeareasHoweverinternationalcomparisonsbasedontheserankings are not desirable because these mean scores are relatively unstable due to the small number of respondents in several participating countries Moreover since Canada did not meet the sampling requirements the Canadian data must be treated with extreme caution For the same reason no results are provided by province although ministries and departments of education have access to their own data in order to analyze their results according to their own contexts
24
What may be most useful in the Canadian context is to look at countries that tend to perform better on this knowledge component and to analyze their contextual factors which may help to explain their results Furthermore it should be kept in mind that teacher-education programs in Canada are far from homogeneous mdash even within a province mdash and that it may be more useful to analyze the contextual factors in each province taking into account the limitations of the study
Results are presented separately for teachers at the elementary level and teachers at the lower-secondary level and are broken down for mathematics content knowledge and mathematics pedagogical content knowledge Results are scaled with an international mean of 500 and a standard deviation of 100
Figure 1 Mean scores and confidence intervals for participating countriesmdash Elementary-level future teachersrsquo mathematics content knowledge
Note The Canadian average score is not part of the international average score due to Canadas low response rates
Poland (490)
Malaysia (488)
Spain (481)
Canada (522)
Georgia (345)
Chile (413)
Botswana (441)
Philippines (440)
International (500)
Germany (510)
Thailand (528)
Norway (519)
United States (518)
Russian Federation (535)
Singapore (590)
Switzerland (543)
Chinese Taipei (623)
Below the international average
At the international average
Above the international average
330 350 370 390 410 430 450 470 490 510 530 550 570 590 610 630
95 Confidence interval
Estimated mean score
25
Figure 2 Mean scores and confidence intervals for participating countriesmdash Elementary-level future teachersrsquo pedagogy content knowledge
Note The Canadian average score is not part of the international average score due to Canadas low response rates
Among the other 15 countries participating in the study elementary-level future teachers from Chinese Taipei and from Singapore outperformed those from other countries in both mathematics content knowledge and mathematics pedagogical content knowledge Another groupofcountriescomprisingSwitzerlandNorwayandtheUnitedStateshadresultsabove the international average in both mathematics and pedagogical content knowledge as did Canada A group of six countries (Georgia Chile the Philippines Botswana Spain and Poland) performed below the international average in both components
International (500)
Spain (492)
Poland (478)
Canada (541)
Georgia (345)
Chile (425)
Philippines (457)
Botswana (448)
Germany (502)
Malaysia (503)
Switzerland (537)
Russian Federation (512)
Thailand (506)
United States (544)
Chinese Taipei (592)
Norway (545)
Singapore (593)
Below the international average
At the international average
Above the international average
330 350 370 390 410 430 450 470 490 510 530 550 570 590 610 630
95 Confidence interval
Estimated mean score
26
Figure 3 Mean scores and confidence intervals for participating countriesmdash Lower-secondary-level future teachersrsquo mathematics content knowledge
Note The Canadian average score is not part of the international average score due to Canadas low response rates
Thailand (479)
Oman (472)
Norway (444)
Canada (516)
Chile (354)
Georgia (424)
Philippines (442)
Botswana (441)
Malaysia (493)
International (500)
Switzerland (531)
Germany (519)
United States (505)
Poland (540)
Russian Federation (594)
Singapore (570)
Chinese Taipei (667)
Below the international average
At the international average
Above the international average
340 360 380 400 420 440 460 480 500 520 540 560 580 600 620 640 660 680
95 Confidence interval
Estimated mean score
27
Figure 4 Mean scores and confidence intervals for participating countriesmdash Lower-secondary-level future teachersrsquo pedagogy content knowledge
Note The Canadian average score is not part of the international average score due to Canadas low response rates
The results are quite similar at the lower-secondary level however future teachers from Chinese Taipei significantly outperformed all other countries in both mathematics and pedagogical content knowledge This is not surprising considering that on the PISA 2006 mathematics assessment 15-year-old students from Chinese Taipei outperformed students from all other countries Interestingly future teachers from the Russian Federation had a much stronger performance in both aspects at the lower-secondary level compared to the elementary level This also holds true for German future teachers although to a lesser extent Conversely future teachers from Norway performed below the international average at the lower-secondary level even though they performed above the international average at the elementary level
Keeping in mind the serious data limitations for Canada it is worth noting that our future teachers performed above the international average in both mathematics and pedagogical content knowledge at both the elementary and lower-secondary levels
Oman (474)
Malaysia (472)
Norway (463)
Canada (513)
Chile (394)
Botswana (425)
Philippines (450)
Georgia (443)
Thailand (476)
International (500)
Germany (540)
Poland (524)
United States (502)
Switzerland (549)
Russian Federation (566)
Singapore (553)
Chinese Taipei (649)
Below the international average
At the international average
Above the international average
380 400 420 440 460 480 500 520 540 560 580 600 620 640 660 680
95 Confidence interval
Estimated mean score
28
Figure 5 Mean scores and confidence intervals by gender primary mathematics knowledge
Figure 6 Mean scores and confidence intervals by gender primary pedagogical knowledge
Among Canadian future teachers at the elementary level there was no statistical difference between their mathematics and pedagogical content knowledge Although the mean score for female future teachers was higher than that for males in pedagogical content knowledge the difference was not statistically significant Of note is the large imbalance intheproportionofmaleteachersinthesample(1in7)Howeverthisisafairlyaccuratereflection of the situation in the population which sees about 80 of teachers in elementary schools in Canada being female (Mullis et al 2007)
524
521Female
Male
400 450 500 550 600
528
543Female
Male
400 450 500 550 600
29
Figure 7 Mean scores and confidence intervals by gender lower-secondary mathematics knowledge
Figure 8 Mean scores and confidence intervals by gender lower-secondary pedagogical knowledge
At the lower-secondary level male future teachers had higher mean scores in both mathematics and pedagogical content knowledge than did females but the differences were not statistically significant The gender imbalance in the sample was not as pronounced at this level as at the elementary level (three female future teachers for every two males at the lower-secondary level) Overall in Canada this is a fair reflection of the situation at the lower-secondary level which sees approximately 70 of teachers being female2
527
509Female
Male
400 450 500 550 600
526
505Female
Male
400 450 500 550 600
2 According to the Pan-Canadian Assessment Program 2007 across all provinces and territories between 50 and 87 of teachers of 13-year-olds are females
30
ConclusionTEDS-M is a comparative study of teacher education with a focus on the preparation of mathematics teachers at the elementary and lower-secondary levels As the first attempt to systematically investigate both the knowledge and skills of future teachers in an international setting the study faced significant challenges in several countries In Canada given the structure of our education systems provinces and territories individually determined whether they wished to be involved in such an endeavour Four provinces (Ontario Quebec Nova Scotia and Newfoundland and Labrador) elected to participate and in each province the participation of individual institutions individual educators and individual future teachers was completely voluntary The very low response rates obtained in Canada and the ensuing non-inclusion in the international data set are indeed disappointing mdash but also very informative mdash should such an initiative be repeated in the future Conducting such an ambitious assessment project is possible but would require engaging all parties early on and throughout the implementation of the project
We are grateful to the ministriesdepartments of education institutions faculties of education educators and future teachers who did participate in this TEDS-M 2008 assessment project It is hoped that the project will yield useful information to guide teacher education in the future
Keeping in mind the serious limitations of the data gathered from TEDS-M there are a few conclusions from the study that may help elicit further discussion among policy-makers and educators
bull IngeneralCanadianinstitutionsdonotseemtohaveverystrongrequirementsin mathematics for individuals wishing to enter into teacher-education programs Other than assessments to meet the requirements for a course in mathematics or in mathematics education there is no formal test of the mathematical knowledge or skills of future teachers at the completion of their program of study
bull Mosteducatorsofmathematicsorofmathematicspedagogyforfutureteachersin Canadian universities are specialized in areas other than mathematics and few hold a doctorate in the discipline At the international level about one-quarter of educators who participated in the TEDS-M study held a doctorate in mathematics with a higher proportion in higher-performing countries In Canada 10 per cent of participating educators held a doctorate in mathematics
bull WithregardtoknowledgeofmathematicsandofmathematicspedagogyCanadianfuture teachers at the elementary and lower-secondary levels performed above the international average Although Canadian 15-year-olds have performed among the top-ranking countries in mathematics since the inception of PISA in 2000 it appears that there is potential for further improvement by possibly providing future teachers at the elementary level with more advanced training in mathematics that covers elements beyond the school curriculum and by providing future teachers at the lower-secondary level with more advanced training in testing- and assessment-related topics
31
ReferencesAtlantic Evaluation and Research Consultants (2007) Kndash12 mathematics curriculum review Final report Retrieved from httpwwwedgovnlcaedupublicationsk12NLMathReportpdf
Bloumlmeke S Kaiser G amp Lehmann R (Eds) (2010) TEDS-M 2008 Professional Competences and Opportunities to Learn of Future Mathematics Teachers at Lower-Secondary Schools in the International Context Muumlnster Waxmann
Bloumlmeke S Kaiser G amp Lehmann R (Eds) (2010) TEDS-M 2008 Professional Competences and Opportunities to Learn of Future Primary Teachers in the International Context Muumlnster Waxmann
Carnoy M Beteille T Brodziak I Loyalka P amp Luschei T (2009) Do countries paying teachers higher relative salaries have higher student mathematics achievement Palo Alto CA StanfordUniversityRetrievedfromhttpstedseducmsueduTEDS_CostsStudyzip
Council of Ministers of Education Canada (2009) PCAP-13 2007 Contextual Report on Student Achievement in Reading Toronto Author
Crocker R amp Dibbon D (2008) Teacher education in Canada a baseline study Kelowna BC Society for the Advancement of Excellence in Education
Dibbon D amp Sheppard B (2001) Teacher demand supply and retention in Newfoundland and LabradorMemorialUniversityofNewfoundlandRetrievedfromhttpwwwmuncaeducpeoplefacultyddibbonpdfFinal20reportchapter1-Introductionpdf
Feng-JuiHTing-YingWChia-JuiHShu-JyhTGuohengCChiu-KeungLet al (2010) A milestone of an international study in Taiwan teacher education National Research Center of Taiwan Teacher Education and Development Study in Mathematics in Taiwan
Ministegravere de lrsquoEacuteducation du Queacutebec (2004) Surplus ou peacutenurie de personnel enseignant qualifieacute au Queacutebec situation actuelle et perspectives agrave court et moyen terme pour le secteur francophone Retrieved from httpwwwmelsgouvqccadftpsinterieurpdfpers_emploi_prevision_nov04pdf
Mullis IVS Martin MO Kennedy AM amp Foy P (2007) PIRLS 2006 International ReportChestnutHillMABostonCollege
Mullis I Martin M Ruddock G OrsquoSullivan C Arora A amp Erberber E (2005) TIMSS 2007 assessment frameworks International Association for the Evaluation of Educational Achievement Retrieved from httptimssbceduTIMSS2007PDFT07_AFpdf
Nova Scotia Department of Education (2007) Nova Scotia public education teacher supply and demand Retrieved from httpwwwednetnscapdfdocsreportsteacher_supply_and_demand_reportpdf
32
Nova Scotia Department of Education (2008) Report and recommendations of the review panel on teacher education in Nova Scotia Retrieved from httpwwwednetnscaeventsteacher_education_reviewdocumentsreview_panel_report_web_epdf
Ontario College of Teachers (2001) Teacher supply and demand Report on the consultation Retrieved from httpwwwoctcapublicationspdftsd_epdf
Ontario College of Teachers (2007) State of the teaching profession 2007 Annual Ontario College of Teachers survey of teachers Retrieved from httpwwwoctcapublicationsPDFsurvey07_epdf
Ontario College of Teachers (2009) Transition to teaching 2009 Retrieved from httpwwwoctcapublicationsPDFtransitions09_epdf
Statistics Canada (2008) CANSIM Table 477-0014 mdash University degrees diplomas and certificates granted by program level Classification of Instructional Programs Primary Grouping (CIP_PG) and sex annual (number) Retrieved from httpdc2chassutorontoca
Tatto MT Ingvarson L Schwille J Peck R Senk SL amp Rowley G (2008) Teacher Education and Development Study in Mathematics (TEDS-M) Policy practice and readiness to teach primary and secondary mathematics Conceptual framework East Lansing MITEDS-MInternationalStudyCenteratMichiganStateUniversityRetrievedfromhttpstedseducmsueduTEDS_FrameworkFinalzip
33
APPENDIX I
sample syllabus Coding
math 250 probability and statistics for elementary middle-school teachers
Instructor Dr KP Lee Office 456HonorsTower
Phone 789-0123 E-mail kpleestandarduedu
Office hours 350ndash450 pm on Mondays and by appointment
COurse prereQuisitesCompletion of Math 125 or equivalent with a C grade or higher Those not meeting the course prerequisites will be automatically dropped from the course by the Department of Mathematics
COurse materialsText Probability and Statistics for ElementaryMiddle-School Teachers
A TI-73 graphing calculator (other models such as the TI-83 and TI-86 will not have the features needed for this course and will not be sufficient)
COurse Overview anD ObjeCtivesThis course is designed to provide pre-service elementary and middle-school teachers with
[laboratory-based experiences designed to teach and reinforce basic statistics and probability concepts often situated in the core tasks of teaching including the examination and critiquing of the statistical thinking and arguments of others]
[opportunities to demonstrate their understanding of statistics and probability concepts in meaningful constructive and alternative ways]
[activities involving the use of calculator technology (this course is usedtosatisfypartoftheUniversityComputerUsagerequirementfor students in elementary teacher education)]
[experiences that model techniques for use in their future elementarymiddle-school classrooms]
U1 T24
B1 T2117331332
B2 T2
117
B3 T2
117355356
34
[The majority of class time will be devoted to small-group exploration and class discussion with an emphasis on reasoning and communication of statistics and probability ideas rather than on rote memorization Students will be expected to demonstrate that they are prepared for class each day by bringing course materials and completed homework assignments Students will be asked to work cooperatively in groups and participate in whole-class discussions Studentsrsquo consistent engagement in these activities will be reflected in their participation grade]
Codes Used in this Excerpt
U1 Sequentialunitnumberofthecodeddocument
T2 An objective of the course
T24 A course that covers specialized mathematics knowledge needed for teaching mathematics
B1 B2 B3 and B4 Each block of information being coded
117 Mathematics block on data representation probability and statistics
331 Mathematics education block on developing mathematical concepts
332 Mathematics education block on reasoning argumentation and proving
355 Mathematics instruction block on using calculators
356 Mathematics instruction block on using computers
117
B4 T2
35
APPENDIX II
examples of assessment items in the primary general pedagogy Knowledge for teaching section of the future teacher Questionnaire
Example 1
Label MFC106Item type Multiple choiceDimension Mathematics Content KnowledgeDomain DataSub-domain Applying
Two fair six-sided number cubes are thrown in a probability game and the two numbers at the top are recorded
Josie wins if the difference between the two numbers is 0 1 or 2 Farid wins if the difference between the two numbers is 3 4 or 5
The students discuss whether the game is fair
Which of the following statements is correct
Check one box
A Both have an equal chance of winning
33
B Josie has the greater chance of winning
50
C Farid has the greater chance of winning
12
D As the game involves number cubes itrsquos not possible to say who has the greater chance of winning
05
For this probability question only half of the future teachers responded correctly that Josie had a greater chance of winning One-third of the respondents were incorrectly drawn to the first option thinking that both Josie and Farid had an equal chance of winning
36
Example 2
Label MFC108Item type Multiple choiceDimension Mathematics Pedagogical Content KnowledgeDomain AlgebraSub-domain Enacting
Amy is building a sequence of geometric figures with toothpicks by following the pattern shown below Each new figure has one extra triangle
Variable t denotes the position of a figure in the sequence
In finding a mathematical description of the pattern Amy explains her thinking by saying I use three sticks for each triangle
Then I see that I am counting one stick twice for each triangle except the last one so I have to remove those
Variable n represents the total number of toothpicks used in a figure
Which of the equations below best represent Amyrsquos statement in algebraic notation
Check one box
A n = 2t + 1 29
B n = 2(t + 1) ndash 1
26
C n = 3t ndash (t ndash1)
36
D n = 3t + 1 ndash t
08
This question was difficult for Canadian future teachers with almost two-thirds of the respondents unable to identify the correct algebraic notation for this pattern
t = 1 t = 2 t = 3
hellip
37
Example 3
Label MFC202Item type Multiple choiceDimension Mathematics Content KnowledgeDomain AlgebraSub-domain Knowing
Indicate whether each of the following statements is true for the set of all whole numbers a b and c greater than zero
Check one box in each row
True Not True
A a ndash b = b ndash a
16
84
B a divide b = b divide a
06
95
C (a + b) + c = a + (b + c)
93
07
D (a ndash b) ndash c = a ndash (b ndash c)
23
77
ThisalgebraquestionwasrelativelyeasyforCanadianfutureteachersHoweveralmostone-quarter of the respondents did not know that the fourth statement was not true even though the question appeared to be relatively easy to solve with whole numbers
38
Example 4
Label MFC203Item type Multiple choiceDimension Mathematics Content Knowledge Domain GeometrySub-domain Applying
A rectangular-shaped swimming pool has a paved walkway (shaded) around it as shown
What is the area of the walkway
Check one box
A 100 m2
04
B 161 m2
06
C 710 m2
78
D 1610 m2
12
This question was relatively easy for Canadian respondents with 78 getting the correctanswerHowever12calculatedtheentireareabutfailedtosubtractthearea of the swimming pool
70 m
50 m
18 m 23 mPool
not to scale
Walkway
39
Example 5
Label MFC206Item type Constructed responseDimension Mathematics Content Knowledge Domain NumberSub-domains Applying Planning
a) Amachineuses24litresoffuelforevery30hoursofoperationHowmanylitresoffuel will the machine use in 100 hours if it continues to use fuel at the same rate
Check one box
A 72
11
B 80
79
C 84
08
D 96
02
This question was relatively easy for Canadian respondents with almost 80 getting thecorrectresponseHoweveroneinfiverespondentsdidmakeacalculationerrorwhen solving this simple problem
b) Create a different problem of the same type as the problem in (a) (same processesoperations) that is EASIER for primary children to solve
40
Scoring Guide
Code Response Item MFC206B
Correct Response
10
A different problem of the same type (same processesoperations) but easier to solveExamples
bull Amachineuses3litresoffuelforevery30hoursofoperationHowmanylitres of fuel will the machine use in 100 hours
bull Acaruses24litresoffuelforevery50kmHowmanylitresoffuelwillthe car use in 100 km
Incorrect Response
70
A different problem of the same type (same processesoperations) but NOT easier to solve (Note Items judged to be of the same level of difficulty are NOT easier)Examples
bull Amachineuses2litresoffuelforevery30hoursofoperationHowmanylitres of fuel will the machine use in 100 hours (2 is not divisible by 3)
bull Atapdrips2litresofwatereverydayHowmanymlisthispersecond(The metric knowledge required and the computational load are significantly higher)
79
Other incorrect response (including crossed out erased illegible or off-task responses and stray marks)Examples
bull questionsthatarenotmeaningfulorhavenoanswer
No Response
99 Blank
About 84 of Canadian future teachers were able to create a problem of the same type but that was easier to solve Nine per cent of respondents created a similar problem but that was not easier to solve
41
examples of assessment items in the secondary general pedagogy Knowledge for teaching section of the future teacher Questionnaire
Example 1
Label MFC604Item type Constructed responseDimension Mathematics Content KnowledgeDomain AlgebraSub-doman Applying
The following problems appear in a mathematics textbook for lower secondary schools
1 Peter David and James play a game with marbles They have 198 marbles altogether Peter has 6 times as many marbles as David and James has 2 times as many marbles asDavidHowmanymarblesdoeseachboyhave
2 Three children Wendy Joyce and Gabriela have 198 zeds altogether Wendy has 6timesasmuchmoneyasJoyceand3timesasmuchasGabrielaHowmanyzedsdoes each child have
(a) Solve each problem
Solution to Problem 1
Solution to Problem 2
42
Scoring Guide
Note The correct answers to MFC604A1 and MFC604A2 are as follows
Problem 1 David has 22 marbles Peter has 132 marbles and James has 44 marbles
Problem 2 Wendy has 132 zeds Joyce has 22 zeds and Gabriela has 44 zeds
The following methods are considered in the scoring guide
1) Usingone variable setting up one equation and solving
Example (Problem 1) Let m = the number of marbles that David has Then Peter has 6m and James has 2m Therefore 6m + 2m + m = 198 and m = 22
2) Usingmore than one variable establishing a system of equations performing substitutions and solving
Example (Problem 1) Let p = the number of marbles that Peter has d = the number of marbles that David has and j = the number of marbles that James has Therefore p = 6d and j = 2d p + d + j = 198
3) Trial and error or guess and check
4) Ratio or other arithmetic methods
5) Representationdiagram
Code Response Item ID MFC604A1
Correct Response
11 Response uses Method 1 correctly to solve Problem 1 and get the correct answers
12 Response uses Method 2 correctly to solve Problem 1 and get the correct answers
13 Response uses Method 3 correctly to solve Problem 1 and get the correct answers
14 Response uses Method 4 correctly to solve Problem 1 and get the correct answers
15 Response uses Method 5 correctly to solve Problem 1 and get the correct answers
19Response uses a correct but different method from those listed above to solve Problem 1 and get the correct answers
Incorrect Response
70Response uses one of Methods 1 to 5 to solve Problem 1 but arrives at an incorrect answer or cannot complete the solution because of a computation or algebra error
71Response uses a correct but different method from those listed above to solve Problem 1 but arrives at an incorrect answer or cannot complete the solution because of a computation or algebra error
79 Other incorrect response (including crossed out erased illegible or off-task responses and stray marks)
No Response
99 Blank
43
Code Response Item ID MFC604A2
Correct Response
11 Response uses Method 1 to solve Problem 2
12 Response uses Method 2 to solve Problem 2
13 Response uses Method 3 to solve Problem 2
14 Response uses Method 4 to solve Problem 2
15 Response uses Method 5 to solve Problem 2
19Response uses a correct but different method from those listed above to solve Problem 2 and get the correct answers
Incorrect Response
70Response uses one of Methods 1 to 5 to solve Problem 2 but arrives at an incorrect answer or cannot complete the solution because of a computation or algebra error
71Response uses a correct but different method from those listed above to solve Problem 2 but arrives at an incorrect answer or cannot complete the solution because of a computation or algebra error
79 Other incorrect response (including crossed out erased illegible or off-task responses and stray marks)
No Response
99 Blank
Overall Problem 1 was easy to solve for Canadian future teachers with 85 getting the correct response The majority of respondents (53) used Method 1 to solve Problem 1 and 29 used Method 2 Problem 2 was of medium difficulty for Canadian future teachers with 65 getting a right answer Sixteen per cent of future teachers used one of the five methods listed to solve Problem 2 but made a computation or algebra error (code 70)
44
Example 2
Label MFC610Item type Multiple choiceDimension Mathematics Content KnowledgeDomain NumberSub-domain Knowing
Determine whether each of the following is an irrational number always sometimes or never
Check one box in each row
Always Sometimes Never
A The result of dividing the circumference of a circle by its diameter
65 26 09
B The diagonal of a square with side of length 1
75 11 14
C Result of dividing 22 by 7 66 06 28
Canadian future teachers had some difficulty identifying the characteristics of irrational numbers Only 28 of respondents knew that dividing 22 by 7 never results in an irrational number possibly confusing this fraction with π which is irrational
45
Example 3
Label MFC704Item type Constructed responseDimension Mathematics Content KnowledgeDomain GeometrySub-domain Applying
On the figure ABCD is a parallelogram ang BAD = 60˚ AM and BM are angle bisectors of angles BAD and ABC respectively If the perimeter of ABCD is 6 cm find the sides of triangle ABM
Write your answers on the lines below
AB = _______ cm
AM = _______ cm
BM = _______ cm
Scoring Guide
Code Response Item ID MFC704
Correct Response
20
Response indicates all three correct entries belowAB = 2 cmAM = radic3 cm or equivalentBM = 1 cm
Partially Correct Response
10 Response indicates any two correct entries and one incorrect (or blank) entry
11 Response indicates any one correct entry and two incorrect (or blank) entries
Incorrect Response
79 Incorrect mathematical statements or statements of no value (including crossed out erased illegible or off-task responses and stray marks)
No Response
99 Blank
This was a difficult question for Canadian future teachers with only 41 giving all three correct responses Another 14 had two correct responses and 8 had one correct response This means that 37 of respondents could not find any of the three measures of the triangle
D
A B
M C
46
Example 4
Label MFC705Item type Multiple choiceDimension Mathematics Content KnowledgeDomain GeometrySub-domain Knowing
We know that there is only one point on the real line that satisfies the equation 3x = 6 namely x = 2
Suppose now that we consider this same equation in the plane with coordinates x and y and then in space with coordinates x y and z What does the set of points that satisfy the equation 3x = 6 look like in these settings
Check one box in each row
One point One line One plane Other
A The solution to 3x = 6 in the plane 22 69 08 01
B The solution to 3x = 6 in space 14 09 71 07
This geometry question was moderately difficult for Canadian future teachers with about 70 of respondents knowing that the proposed solution would look like one line in the plane and one plane in space
- Table of Contents
- List of Figures
- What is TEDS-M 2008
- Research design and methodology for TEDS-M
- What is to be learned from TEDS-M
- What value will TEDS-M add to existing research on teacher education
- Target populations
- Components of TEDS-M
-
- Component 1 studies of teacher-education policies for elementary and lower-secondary mathematics teachers and their cultural and social contexts
- Component 2 studies of elementary and lower-secondary mathematics teacher-preparation routes programs standards and expectations for teacher learning
- Component 3 studies of the mathematics and related teaching knowledge of future elementary and lower-secondary school teachers
-
- Participating countries in TEDS-M
- The Canadian administration
- Structure and organization of teacher education in Canada
- Programs in specific jurisdictions
-
- Ontario
- Quebec
- Nova Scotia
- Newfoundland and Labrador
-
- The administration of the TEDS-M survey in Canada
-
- Representation at international meetings
- Adaptation translation and approval of assessment and questionnaire materials
-
- Sampling institutions
-
- Contacting institutions and sending and collecting materials
- Quality monitoring
- Coding
-
- Description of teacher-education courses and collection and coding of syllabi
- Coding of mathematics content knowledge and mathematics pedagogical content knowledge
-
- Results
-
- Institutional Program Questionnaire
- Survey for Mathematics Mathematics Pedagogy and General Pedagogy Educators
- Survey for Future Teachers of Lower-Secondary Mathematics
- Survey for Future Teachers of Primary Elementary Mathematics
-
- Conclusion
- References
- Figures
-
- Figure 1enspMean scores and confidence intervals for participating countriesmdashElementary-level future teachers mathematics content knowledge
- Figure 2enspMean scores and confidence intervals for participating countriesmdashElementary-level future teachers pedagogy content knowledge
- Figure 3enspMean scores and confidence intervals for participating countriesmdashLower-secondary-level future teachers mathematics content knowledge
- Figure 4enspMean scores and confidence intervals for participating countriesmdashLower-secondary-level future teachers pedagogy content knowledge
- Figure 5enspMean scores and confidence intervals by gender primary mathematics knowledge
- Figure 6enspMean scores and confidence intervals by gender primary pedagogical knowledge
- Figure 7enspMean scores and confidence intervals by gender lower-secondary mathematics knowledge
- Figure 8enspMean scores and confidence intervals by gender lower-secondary mathematics knowledge
-
- Appendices
-
- APPENDIX I
-
- Sample Syllabus Coding
-
- APPENDIX II
-
- Examples of assessment items in the Primary General Pedagogy Knowledge for Teaching section of the Future Teacher Questionnaire
- Examples of assessment items in the Secondary General Pedagogy Knowledge for Teaching section of the Future Teacher Questionnaire
-

12
Programs in specific jurisdictionsTEDS-M from the International Association for the Evaluation of Educational Achievement (IEA) was conducted in four Canadian jurisdictions mdash Ontario Quebec Nova Scotia and Newfoundland and Labrador
OntariOThere are 14 publicly assisted faculties of education in Ontario universities together they enrol approximately 13000 students and graduate about 8000 teacher candidates per year All of the publicly assisted faculties of education offer programs in English and two offer programs in French
Almost all Ontario institutions offer consecutive programs of two semestersrsquo duration to students who already have a bachelorrsquos degree The practicum ranges from a minimum of 42 days to over 60 days depending on the institution The number of graduates from teacher-education programs ranges from fewer than 100 per year to more than 1000 per year in the larger institutions although most programs enrol at least several hundred students A three-level structure categorized into PrimaryJunior (Grades Kndash6) JuniorIntermediate (Grades 4ndash10) and IntermediateSenior (Grades 7ndash12) is typical and this structure conforms to the structure for teacher certification This allows teachers to be certified to teach a range of grade levels Some more highly specialized programs are offered in areas such as music second-language teaching and technological studies Candidates for admission to the faculties of education in Ontario apply through the central Teacher Education Application Service (TEAS) which allows applicants three choices of institution or program Individual universities conduct their selection of candidates
Teacher certification in Ontario is governed by an independent body the Ontario College of Teachers (OCT) The governing council of this body comprises 23 teacher-members elected by members of the college and 14 members of the public appointed by the provincial government and broadly representative of other stakeholders in education Graduates of teacher-education programs at Ontario universities apply to OCT for a general certificate of qualification and registration as their licence to teach OCTrsquos ldquoTransition to Teachingrdquo studies indicate that early in the decade the province was experiencing a generalshortageofteachersHoweverinrecentyearsOntariorsquosemploymentmarkethasbeen characterized by an oversupply of teachers in most subject areas as the number of new teachers entering the profession has substantially increased and the number of teachers leaving the profession or retiring has declined (Ontario College of Teachers 2009)
QuebeC Twelve institutions offer teacher-education programs in Quebec nine in French and three in English Close to 18000 students are enrolled in these programs and about 4000 graduate per year This rate reflects the concurrent nature of most Quebec programs under which students take four years to complete the BEd degree Typically programs are divided into elementary and secondary levels with many more specialized programs Candidates for teaching at the elementary level are prepared as generalists candidates for teaching at the secondary level are expected to specialize in subjects or subject clusters corresponding to those taught in secondary schools Most programs are specifically designed to prepare candidates for certification as teachers in Quebec
13
Teacher certification in Quebec is governed by the Comiteacute drsquoagreacutement des programmes de formation agrave lrsquoenseignement (CAPFE) [committee on accreditation of teacher-training programs] a representative body of stakeholders CAPFE is responsible for accrediting teacher-training programs in the province and it is an autonomous independent body created and funded by the Ministry of Education Recreation and Sports
The most recent work on teacher supply and demand in Quebec was a report by the Service des eacutetudes eacuteconomiques et deacutemographiques [department of economic and demographic research] dated November 2004 The report (Ministegravere de lrsquoEacuteducation du Queacutebec 2004) noted that teacher shortages were expected for teachers of French language arts and social sciences in the period from 2005 to 2007 due to changes to the curricula There would also be shortages in 2006 in the number of second-language (French and English) teachers arts teachers and physical-education teachers It was also expected that there would be a deficit in mathematics and science teachers in French-language schools The report also predicted that declining enrolment in schools would lead to a major surplus of teachers in all disciplines for 2008 to 2013
nOva sCOtiaFour institutions in Nova Scotia offer teacher-education programs three in English and one in French All these programs are relatively small compared to national averages with approximately 900 students and 400 graduates per year in total This represents a substantial decrease from the early 1990s when an external review led to the closure of programs at several institutions and a reduction in the number of students accepted into teacher education That review also led to the establishment of the only system in Canada in which a two-year (four-semester) consecutive program is the norm and a requirement for certification
Nova Scotia is one Canadian jurisdiction in which high-profile government-commissioned external reviews have had an impact on teacher education The most recent review completed in 2008 (Nova Scotia Department of Education 2008) addressed both program structures and labour-market issues The major labour-market concern was the continued oversupply of teachers despite the significant constraints imposed following the previous review The oversupply was attributed to the continuing substantial demand for places many students move to other jurisdictions to complete their programs encouraged by arrangements negotiated between Nova Scotia universities and institutions outside the province these students then return to Nova Scotia seeking certification As a consequence a recent Nova Scotia study of teacher supply and demand predicted that supply will exceed demand by a ratio of close to 31 from now until 2014 with approximately 1000 teachers entering the system every year and only about 360 leaving (Nova Scotia Department of Education2007)Howevershortageswouldcontinuetobefeltinspecificgeographicalareas of the province and in some subject areas (but not in mathematics)
Teacher certification in Nova Scotia is administered by the Department of Education The Office of Teacher Certification is advised by a representative committee of stakeholders appointed by the minister of education
14
newfOunDlanD anD labraDOrNewfoundland and Labrador has only one university offering teacher-education programs A total of approximately 1000 students register and about 500 graduate annually The main program divisions are referred to as PrimaryElementary and Intermediate Secondary The PrimaryElementary program is concurrent requiring a total of five years to complete Students enter the professional component usually in the third year The IntermediateSecondary program is a three-semester consecutive one completed over 14 months Specialized programs are available in music physical education technology special education and other areas All programs are designed to meet the provincersquos teacher-certification requirements
Teacher certification in Newfoundland and Labrador is governed by a representative body of stakeholders and the system is administered by the Department of Education The most recent comprehensive study of teacher supply and demand in Newfoundland and Labrador was completed in 2001 At that time Dibbon and Sheppard (2001) found that in spite of a large pool of substitute teachers in the province the supply of teachers in the specialized areas of mathematics and science was low and remote communities had difficulty recruiting teachers Since that time both the number of new positions and of new graduates per year have increased suggesting that the supply-demand ratio has not changed very much
A recent review of school mathematics programs in Newfoundland and Labrador (Atlantic Evaluation and Research Consultants 2007) which included a comprehensive survey of mathematics teachers revealed that only a small proportion (about 10 per cent) of elementary school teachers have mathematics as their major area of study The proportions are much higher for Grade 9 (72 per cent) and for senior-secondary school (83 per cent)
The administration of the TEDS-M survey in CanadaAs stated previously TEDS-M was administered in four provinces in Canada (Ontario Quebec Nova Scotia and Newfoundland and Labrador) These four provinces mandated the Council of Ministers of Education Canada (CMEC) to act as the National Research Centre (NRC) responsible for the coordination of the study
NRC was responsible for representing provinces at international meetings adapting translating and approving all assessment and questionnaire materials sampling institutions educators and future teachers in accordance with international guidelines contacting participating institutions and sending and collecting materials arranging for quality-monitoring of the administration arranging the coding of curriculum documents questionnaires and assessment materials capturing and validating all data and analyzing the data and publishing the national report
15
representatiOn at internatiOnal meetingsThe International Study Centre (ISC) for TEDS-M was located at Michigan State UniversityISCwasresponsiblefortheplanningimplementationandreportingofallaspects of the study at the international level A conceptual framework (Tatto et al 2008) guided the design of the study Throughout the development of the framework and of all instruments the international group of experts from ISC consulted NRC on a regular basis including at biannual meetings
aDaptatiOn translatiOn anD apprOval Of assessment anD QuestiOnnaire materialsAll materials were developed by ISC in English and approved by all participating countries Individual countries were responsible for adapting materials for use in their own country and for translating all materials into the target language(s) for the country In Canada TEDS-M was administered in English and in French and all documents (manuals questionnaires coding guides) had to be approved by ISC prior to the administration
Sampling institutions
In order to ensure that valid cross-national comparisons could be made ISC implemented strict sampling guidelines based on national probability samples In Canada with only four provinces participating it was determined that all 31 institutions in these provinces wouldbeinvitedtoparticipateHoweverinstitutionsrsquoparticipationwasvoluntaryandtheinstitutional response rate was very low (37 or n=10) This could be explained in large part by the fact that the administration of the survey was occurring at the end of April a very busy period for institutions with end-of-term exams and practica In several cases institutionsrsquo research-ethics committeesboards did not have sufficient time to review the application to conduct the study
A total of 94 educators were sampled in the 10 participating institutions Again it was determined to invite all educators (of pedagogy mathematics and mathematics pedagogy) to participate Overall 74 educators responded to the questionnaires a response rate of 79 per cent
For the reasons stated above the response rates for future teachers were also very low Overall 183 future teachers at the elementary level and 155 future teachers at the secondary level participated (response rates of 69 per cent and 79 per cent respectively)
As a result of these low response rates (overall and within institutions) the sampling referee determined that the Canadian sample was not sufficiently representative of the overall population and ISC elected to report all Canadian results in appendix to the international report and did not include Canada in all international comparisons
16
COntaCting institutiOns anD senDing anD COlleCting materialsAdministering the TEDS-M survey was a collaborative task shared between the National Research Centre institutional coordinators and survey administrators
Institutional coordinators were responsible for seeking the participation of educators and of future teachers as well as for most administrative arrangements for the TEDS-M main study at the institution including providing a list of future teachers and educators administering educator and institutional questionnaires and collecting syllabi
The National Research Centre appointed survey administrators to administer the sessions to future teachers Survey administrators were selected on the basis of their experience If possible individuals who had previous experience in survey or test administration (eg the Trends in International Mathematics and Science Study the Progress in International Reading Literacy Study the Programme for International Student Assessment) were selected These survey administrators reported directly to the National Research Centre
Quality mOnitOringIn all participating countries approximately 10 per cent of participating institutions were visited during the administration of the survey International quality monitors ensured that the administration procedures were strictly followed and provided detailed reports to ISC
Generally the institutional coordinator was responsible for identifying the most suitable individual who could complete the institutional questionnaire The respondent was asked to complete the questionnaire confidentially and return it to the institutional coordinator It took approximately two hours to complete this questionnaire
The institutional coordinator was also responsible for identifying all educators who were teaching to the target population of future teachers at the time of the administration The questionnaire for educators took approximately 30 minutes to complete
The questionnaire for future teachers was administered by the survey administrator over a two-hour uninterrupted period There were two different versions of the Future Teacher Questionnaire one for elementary teachers and one for secondary teachers In each case several equivalent forms of the questionnaires were used Three of the four sections were equivalent across all forms of the questionnaires General Background (5 minutes) Opportunity to Learn (15 minutes) and Beliefs about Mathematics and Teaching (10 minutes) The Mathematics Knowledge for Teaching section (60 minutes) differed across booklets with some anchor questions to ensure equivalence across forms Some sample questions can be found in the section below
17
CODingDescription of teacher-education courses and collection and coding of syllabi
In all participating institutions the institutional coordinator asked participating educators to provide the course syllabus for each course they were teaching at the time of the data collection These syllabi were sent to the National Research Centre for coding (see Appendix I for a sample of a coded syllabus)
Syllabus analysis is a systematic method of obtaining comprehensive information from syllabus documentation and materials It examines content sequence (when and what topics are intended) and when appropriate performance expectations (what students are expected to do with the content) at the institutional and course levels Qualitative coding protocols were used to capture the coursesrsquo academic content
TEDS-M used a low inference procedure to perform the analysis to reliably investigate the opportunities to learn in different institutions and different countries In addition to understanding how to code the different syllabi coders developed a high level of reliability when coding Inter-coder reliability was closely monitored at the international level An example of the syllabus-coding activity can be found in Appendix I
Coding of mathematics content knowledge and mathematics pedagogical content knowledge
As described in the TEDS-M conceptual framework teaching mathematics consists of two constructs mathematics content knowledge and mathematics pedagogical content knowledge (see Appendix II for sample items) Each question in the Mathematics Knowledge for Teaching section measured one of the four content domains (number geometry algebra data) and one of the three cognitive domains (knowing applying reasoning) Each question in the Mathematics Pedagogical Content Knowledge section measured one of the three aspects of the framework (mathematical curricular knowledge knowledge of planning for mathematics teaching and learning enacting mathematics for teaching and learning)
Coding of all the knowledge questions took place in a central location All coders were graduating future teachers of mathematics who received extensive training Coder reliability was closely monitored throughout the coding session In Canada all coding took place in both English and French ensuring a high degree of consistency across languages
18
ResultsAs mentioned previously TEDS-M surveyed three populations institutions educators and future teachers This section presents some selected Canadian results from the three surveys Due to the very low response rates it should be noted that these results are descriptive of the participating respondents generalizations made to the entire population are not advised
institutional program QuestionnaireOverall 82 questionnaires were distributed to 10 participating institutions because these offered more than one program In some cases institutions offered consecutive andor concurrent programs in others they offered programs at the elementary andor secondary levels and in others yet programs in English andor French All these possible variations explain the number of questionnaires analyzed
HerearesomefindingsfromtheInstitutionalProgramQuestionnaire
bull Amajorityofinstitutions(65)preparefutureteacherstoteachinbothelementaryand secondary schools and there are as many concurrent as consecutive programs represented in the sample
bull Over60ofinstitutionsrequirefutureteachersundertakingtheprogramtohavecompletedatleastGrade12mathematics(advancedorregular)However26of programs do not require a minimum level of mathematics for future teachers
bull Almost all institutions (87) within guidelines set by regional or provincialauthorities set policies governing which applicants are admitted to the program
bull When selecting students for their teacher-preparation programs institutionspay particular attention to candidatesrsquo suitability for teaching which may be assessed by an interview or a written application or by their demonstrated high level of achievement in mathematics (with 87 and 65 of institutions rating thesecriteriaassomewhatimportantorveryimportantrespectively)Howevercandidatesrsquo overall achievement level (91) and performance at the end of the school year (100) are either not considered or considered not important for selection purposes This finding would need to be investigated further as it seems to be inconsistent with findings from Crocker and Dibbon (2008) which suggest that institutions do consider minimum averages in a set of prerequisite courses especially in a competitive environment where the number of applicants exceeds the number of places
bull Withrespecttoprovincialnormsrespondentsviewfutureteachersenteringtheprogram as either high- or above-average achievers (44 and 52 respectively)
bull In theprogramsunder study respondents state thateithermoderateormajorweight is placed on the following program goals
m planning lessons based on recommended pedagogical principles (100)m learning to reflect on onersquos own learning and teaching practices (100)m studying the content of the school curriculum and of the mathematics
curriculum to be taught (100)
19
bull Nolittleoronlysomeweightisplacedonthefollowinggoals
m interpreting data from externally conducted tests (69)m studying mathematics or other disciplines at the tertiary level (65 and
69 respectively)m learning specific strategies and curricula for teaching gifted students (61)m developing the knowledge and skills to do teacher action research (70)
bull Intermsofinstitutionalrequirementsforsuccessfullycompletingtheprogramallrespondents (100) state that future teachers must pass all courses required for the program successfully demonstrate a required level of teaching competence in the classroom and receive a passing grade on their field experience None of the programs require future teachers to write a thesis and only a few (less than 10) require future teachers to pass a written or an oral examination
bull Inabout three-quartersof theprograms teacherswhomentor future teachersduring their extended field practice receive some form of compensation As part of their responsibilities these mentors are expected in all programs to observe future teachers in classrooms They are also expected to provide a formal summative assessment and written narrative reports of the field practice
bull Generally institutionsare responsible forfindingplacements for theextendedteaching practice (in 82 of programs) and although about half of the institutions have no difficulty finding suitable placements for future teachers another 30 state that appropriate placements are not readily available in sufficient numbers
bull Ofthefacultyemployedtoteachmathematicsormathematics-relatedcontentto future teachers all institutions indicate that a masterrsquos degree would normally be required and 70 of institutions would normally require a doctorate Few institutions require that these educators be qualified to teach or have experience teaching at the elementary or secondary level However educators teachingmathematics pedagogy are normally expected to have some experience teaching at the elementary or secondary level in about half of the programs It should be noted that this relative lack of a requirement for teaching experience in some programs does not mean that many educators do not have some teaching experience This is illustrated below by the fact that more than half of the surveyed educators held a teaching certificate All institutions require that mentors supervising the extended teaching practice hold at least a bachelorrsquos degree and in 78 of the programs mentors are expected to hold a masterrsquos degree
survey for mathematics mathematics pedagogy and general pedagogy educatorsOverall 194 questionnaires were distributed and 94 questionnaires were returned
bull The academic rankof the respondentswaswell distributed across all possibleranks with 19 being professors 16 being associate professors 23 assistant professors 17 lecturers 14 instructors and 11 in other roles There were slightly more females (56) than males
20
bull Oftheseeducators27hadadegreeineducation14inmathematicseducationand 10 in mathematics at the doctoral level or higher These figures should be interpreted with caution As stated above a large number of respondents to the survey were likely to be sessional appointees
bull Fifty-twopercentofrespondentsheldateachingcertificateatthetimeofthestudy one-third has never held a teaching certificate
bull Onaveragetheseeducatorshavespentapproximately10yearsattheircurrentinstitutions and about seven years in their teacher-preparation role They teach mostly at the undergraduate level (93) but also at the masterrsquos level (48) and in some cases at the doctoral level (18) In terms of experience 30 have been involved in instructing or supervising future teachers for over 10 years but 37 have done this for three years or less suggesting the existence of a cadre of educators with relatively little experience at least when considering the general profile of the respondents
bull Overthepast12monthsmorethanhalfoftheseeducatorshavenotparticipatedin any professional-development activities related to mathematics or mathematics pedagogyHoweverover60hadparticipatedinatleastsixhoursofprofessionaldevelopment in general pedagogy
bull In thepastyear respondentshavespentabout30of theirworkingtimeonresearch and research-related activities
bull Whenaskedtoconsiderallcoursesintheteacher-educationprogramsofferedattheir institutions about 80 of these educators felt that each stage seemed to be planned to meet the main needs of future teachers at each stage of their preparation and that the programs were organized in a way that covered what future teachers needed tobecomeeffective teachersHowever30disagreed that therewereclear links between most of the courses in the program of study
bull When asked to describe future teachersrsquo level of preparedness for teachingmathematics as they complete the teacher-education program and start their teaching careers 80 or more of these educators felt that future teachers were prepared to a moderate or major extent to clearly communicate ideas and information about mathematics to students that they could establish appropriate learning goals in mathematics for students and that they could set up mathematics learning activities to help students achieve learning goals Conversely over a third of these educators felt that future teachers were not at all or just to a minor extent prepared to use computers and information and communication technology (ICT) to aid in teaching mathematics and to provide parents with useful information about studentsrsquo progress in mathematics Further research would be useful to compare the views of teachers principals and faculties regarding the level of preparedness in using ICT to teach mathematics
bull Finally almost 80 of educators felt that their pre-service teacher-educationprograms were effective or very effective in preparing future teachers of mathematics
21
survey for future teachers of lower-secondary mathematicsOverall 282 questionnaires were distributed to future teachers at the secondary level and 155 were completed
bull Themedianageofrespondentswas24yearsand61werefemalesAbout86of respondents always or almost always spoke the language of the questionnaire at home Eighty-three per cent had taken a calculus or pre-calculus course in high school When comparing themselves to other students at the same grade level in their schools 82 saw themselves as being at the top or near the top of their class in terms of marks
bull Whenaskedtoidentifythemainreasonswhytheydecidedtobecometeachersthese future teachers at the secondary level mentioned their perception of teaching as a challenging job their desire to have an influence on the next generation their desire to work with young people their belief that they have a talent for teaching and their love of mathematics as the most significant reasons For the most part they were not influenced by teacher salaries the availability of teaching positions or the fact that they had always been good students in school
bull Almosthalf(47)ofthesefutureteacherssaidthatneedingtoborrowmoneyhindered their studies during their teacher-preparation programs
bull Almostallfutureteachersatthesecondarylevel(95)thoughtthattheywouldor could possibly spend their entire career as a teacher
bull Theserespondentswereaskedtoconsideranumberofmathematicstopicsandtoindicate which ones they had or had never studied Over 80 stated that they had studied calculus linear algebra probability and theoretical or applied statistics Fifty per cent or more stated that they had never studied topology differential geometry theory of real or complex functions or functional analysis or abstract algebra In the context of their teacher-education programs more than half also said that they had not studied validation structuring and abstracting or calculus In terms of emphasis three-quarters said that in their programs they studied mathematics at the level of the school curriculum
bull Intermsofmathematicspedagogyover80saidthattheirprogramscoveredmathematics instruction mathematics standards and curriculum and the development of teaching plans Their programs allowed them to engage in the following activities most often accommodating a wide range of abilities in each lesson exploring how to use manipulatives and creating learning experiences that make central concepts under study meaningful to students The activities that were mentioned the least often were using standardized tests to guide decisions about what and how to teach using assessment to give feedback to parents or guardians and helping students learn how to assess their own learning
bull Whenlookingateducationandpedagogytopicsoverathirdofthesecondary-levelfuture teachers said that they had not studied methods of educational research or the history of education and educational systems
22
bull Withregardtotheirpracticaover60agreedthatthefeedbacktheyreceivedfromtheir mentors helped them to improve their teaching methods that this feedback helped them to improve their understanding of their students and that they had a clear understanding of what their mentors expected of them as teachers in order to pass the practica
bull Regardingtheperceivedoveralleffectivenessoftheirpre-serviceteacher-educationprograms almost a quarter of these future teachers at the secondary level felt that the programs were not effective in preparing them to teach mathematics
survey for future teachers of elementary mathematicsOverall 580 questionnaires were distributed to future teachers at the elementary level and 183 were completed Although the number of respondents is quite substantial the response rate is below the international standard therefore any generalization to the population of future elementary teachers should be made with extreme caution
bull Eighty-sevenpercentofrespondentsofthisquestionnairewerefemaleThismaybe slightly higher than the overall population of elementary teachers Based on the Progress in International Reading Literacy Study (2006) data in which five provinces participated the figures would vary between 72 and 86 for female teachersattheelementarylevelUnfortunatelynoofficialdataareavailableatthepan-Canadian level for this aspect
bull About95alwaysoralmostalwaysspokethelanguageofthequestionnaireathome Only 40 had taken a calculus or pre-calculus course in high school which is much lower than for future teachers at the lower-secondary level When comparing themselves to other students at the same grade level in their schools about half of the respondents saw themselves as being at the top or near the top of their class in terms of marks again a much lower percentage than for the lower-secondary level
bull Whenaskedtoidentifythemainreasonswhytheydecidedtobecometeachersthese future teachers at the elementary level had very similar response patterns to those at the lower-secondary level They mentioned their talent for teaching their perception of teaching as a challenging job and their desire to work with young people and to have an influence on the next generation as the most significant reasons For the most part they were not influenced by teacher salaries the availability of teaching positions or their love of mathematics (which is logical since elementary-level teachers are normally generalists)
bull Theserespondentswereaskedtoconsideranumberofmathematicstopicsandtoindicate which ones they had or had never studied As can be expected the vast majority had not studied many advanced topics in mathematics with over 90 not having studied advanced calculus abstract or linear algebra or theory of real or complex functions or functional analysis In fact the only advanced topics
23
studied by more than half of these respondents were probability and number theory In the context of their teacher-education programs over 85 said that they had not studied calculus validation or structuring and abstracting In terms of emphasis almost 90 said that in their programs they studied mathematics at the level of the school curriculum and 63 said that their learning was at a deeper or more conceptual level than that of the school curriculum
bull Intermsofmathematicspedagogyover80saidthattheirprogramscoveredmathematics instruction mathematics standards and curriculum and mathematics teaching per se Their programs allowed them to engage in the following activities most often exploring how to use manipulatives creating learning experiences that make central concepts under study meaningful to students locating suitable curriculum materials and teaching resources and developing games or puzzles accommodating a wide range of abilities in each lesson and building on studentsrsquo existing mathematics knowledge and thinking skills The activities that were mentioned the least often were using standardized tests to guide decisions about what and how to teach using assessment to give feedback to parents or guardians and helping students learn how to assess their own learning (similar to lower-secondary respondents)
bull Whenlookingateducationandpedagogytopicsoverathirdoftheelementary-level future teachers said that they had not studied methods of educational research or the history of education and educational systems
bull Withregardtotheirpracticaaswasthecaseforthelower-secondarylevelover60 agreed that they had a clear understanding of what their mentors expected of them as teachers in order to pass the practica that the feedback they received from their mentors helped them to improve their teaching methods and that this feedback helped them to improve their understanding of their students A large proportion of these respondents also felt that their mentors valued the ideas and approaches they brought from their teacher-education programs
bull Regardingtheperceivedoveralleffectivenessoftheirpre-serviceteacher-educationprograms elementary-level future teachers were generally more pleased than secondary-level future teachers with their programs in preparing them to teach mathematics
An important contribution of TEDS-M is the assessment of participating future teachers with regard to their knowledge of mathematics of mathematics pedagogy and of general pedagogy The design of TEDS-M lends itself to the ranking of countries according to theirmeanscoresonthesethreeareasHoweverinternationalcomparisonsbasedontheserankings are not desirable because these mean scores are relatively unstable due to the small number of respondents in several participating countries Moreover since Canada did not meet the sampling requirements the Canadian data must be treated with extreme caution For the same reason no results are provided by province although ministries and departments of education have access to their own data in order to analyze their results according to their own contexts
24
What may be most useful in the Canadian context is to look at countries that tend to perform better on this knowledge component and to analyze their contextual factors which may help to explain their results Furthermore it should be kept in mind that teacher-education programs in Canada are far from homogeneous mdash even within a province mdash and that it may be more useful to analyze the contextual factors in each province taking into account the limitations of the study
Results are presented separately for teachers at the elementary level and teachers at the lower-secondary level and are broken down for mathematics content knowledge and mathematics pedagogical content knowledge Results are scaled with an international mean of 500 and a standard deviation of 100
Figure 1 Mean scores and confidence intervals for participating countriesmdash Elementary-level future teachersrsquo mathematics content knowledge
Note The Canadian average score is not part of the international average score due to Canadas low response rates
Poland (490)
Malaysia (488)
Spain (481)
Canada (522)
Georgia (345)
Chile (413)
Botswana (441)
Philippines (440)
International (500)
Germany (510)
Thailand (528)
Norway (519)
United States (518)
Russian Federation (535)
Singapore (590)
Switzerland (543)
Chinese Taipei (623)
Below the international average
At the international average
Above the international average
330 350 370 390 410 430 450 470 490 510 530 550 570 590 610 630
95 Confidence interval
Estimated mean score
25
Figure 2 Mean scores and confidence intervals for participating countriesmdash Elementary-level future teachersrsquo pedagogy content knowledge
Note The Canadian average score is not part of the international average score due to Canadas low response rates
Among the other 15 countries participating in the study elementary-level future teachers from Chinese Taipei and from Singapore outperformed those from other countries in both mathematics content knowledge and mathematics pedagogical content knowledge Another groupofcountriescomprisingSwitzerlandNorwayandtheUnitedStateshadresultsabove the international average in both mathematics and pedagogical content knowledge as did Canada A group of six countries (Georgia Chile the Philippines Botswana Spain and Poland) performed below the international average in both components
International (500)
Spain (492)
Poland (478)
Canada (541)
Georgia (345)
Chile (425)
Philippines (457)
Botswana (448)
Germany (502)
Malaysia (503)
Switzerland (537)
Russian Federation (512)
Thailand (506)
United States (544)
Chinese Taipei (592)
Norway (545)
Singapore (593)
Below the international average
At the international average
Above the international average
330 350 370 390 410 430 450 470 490 510 530 550 570 590 610 630
95 Confidence interval
Estimated mean score
26
Figure 3 Mean scores and confidence intervals for participating countriesmdash Lower-secondary-level future teachersrsquo mathematics content knowledge
Note The Canadian average score is not part of the international average score due to Canadas low response rates
Thailand (479)
Oman (472)
Norway (444)
Canada (516)
Chile (354)
Georgia (424)
Philippines (442)
Botswana (441)
Malaysia (493)
International (500)
Switzerland (531)
Germany (519)
United States (505)
Poland (540)
Russian Federation (594)
Singapore (570)
Chinese Taipei (667)
Below the international average
At the international average
Above the international average
340 360 380 400 420 440 460 480 500 520 540 560 580 600 620 640 660 680
95 Confidence interval
Estimated mean score
27
Figure 4 Mean scores and confidence intervals for participating countriesmdash Lower-secondary-level future teachersrsquo pedagogy content knowledge
Note The Canadian average score is not part of the international average score due to Canadas low response rates
The results are quite similar at the lower-secondary level however future teachers from Chinese Taipei significantly outperformed all other countries in both mathematics and pedagogical content knowledge This is not surprising considering that on the PISA 2006 mathematics assessment 15-year-old students from Chinese Taipei outperformed students from all other countries Interestingly future teachers from the Russian Federation had a much stronger performance in both aspects at the lower-secondary level compared to the elementary level This also holds true for German future teachers although to a lesser extent Conversely future teachers from Norway performed below the international average at the lower-secondary level even though they performed above the international average at the elementary level
Keeping in mind the serious data limitations for Canada it is worth noting that our future teachers performed above the international average in both mathematics and pedagogical content knowledge at both the elementary and lower-secondary levels
Oman (474)
Malaysia (472)
Norway (463)
Canada (513)
Chile (394)
Botswana (425)
Philippines (450)
Georgia (443)
Thailand (476)
International (500)
Germany (540)
Poland (524)
United States (502)
Switzerland (549)
Russian Federation (566)
Singapore (553)
Chinese Taipei (649)
Below the international average
At the international average
Above the international average
380 400 420 440 460 480 500 520 540 560 580 600 620 640 660 680
95 Confidence interval
Estimated mean score
28
Figure 5 Mean scores and confidence intervals by gender primary mathematics knowledge
Figure 6 Mean scores and confidence intervals by gender primary pedagogical knowledge
Among Canadian future teachers at the elementary level there was no statistical difference between their mathematics and pedagogical content knowledge Although the mean score for female future teachers was higher than that for males in pedagogical content knowledge the difference was not statistically significant Of note is the large imbalance intheproportionofmaleteachersinthesample(1in7)Howeverthisisafairlyaccuratereflection of the situation in the population which sees about 80 of teachers in elementary schools in Canada being female (Mullis et al 2007)
524
521Female
Male
400 450 500 550 600
528
543Female
Male
400 450 500 550 600
29
Figure 7 Mean scores and confidence intervals by gender lower-secondary mathematics knowledge
Figure 8 Mean scores and confidence intervals by gender lower-secondary pedagogical knowledge
At the lower-secondary level male future teachers had higher mean scores in both mathematics and pedagogical content knowledge than did females but the differences were not statistically significant The gender imbalance in the sample was not as pronounced at this level as at the elementary level (three female future teachers for every two males at the lower-secondary level) Overall in Canada this is a fair reflection of the situation at the lower-secondary level which sees approximately 70 of teachers being female2
527
509Female
Male
400 450 500 550 600
526
505Female
Male
400 450 500 550 600
2 According to the Pan-Canadian Assessment Program 2007 across all provinces and territories between 50 and 87 of teachers of 13-year-olds are females
30
ConclusionTEDS-M is a comparative study of teacher education with a focus on the preparation of mathematics teachers at the elementary and lower-secondary levels As the first attempt to systematically investigate both the knowledge and skills of future teachers in an international setting the study faced significant challenges in several countries In Canada given the structure of our education systems provinces and territories individually determined whether they wished to be involved in such an endeavour Four provinces (Ontario Quebec Nova Scotia and Newfoundland and Labrador) elected to participate and in each province the participation of individual institutions individual educators and individual future teachers was completely voluntary The very low response rates obtained in Canada and the ensuing non-inclusion in the international data set are indeed disappointing mdash but also very informative mdash should such an initiative be repeated in the future Conducting such an ambitious assessment project is possible but would require engaging all parties early on and throughout the implementation of the project
We are grateful to the ministriesdepartments of education institutions faculties of education educators and future teachers who did participate in this TEDS-M 2008 assessment project It is hoped that the project will yield useful information to guide teacher education in the future
Keeping in mind the serious limitations of the data gathered from TEDS-M there are a few conclusions from the study that may help elicit further discussion among policy-makers and educators
bull IngeneralCanadianinstitutionsdonotseemtohaveverystrongrequirementsin mathematics for individuals wishing to enter into teacher-education programs Other than assessments to meet the requirements for a course in mathematics or in mathematics education there is no formal test of the mathematical knowledge or skills of future teachers at the completion of their program of study
bull Mosteducatorsofmathematicsorofmathematicspedagogyforfutureteachersin Canadian universities are specialized in areas other than mathematics and few hold a doctorate in the discipline At the international level about one-quarter of educators who participated in the TEDS-M study held a doctorate in mathematics with a higher proportion in higher-performing countries In Canada 10 per cent of participating educators held a doctorate in mathematics
bull WithregardtoknowledgeofmathematicsandofmathematicspedagogyCanadianfuture teachers at the elementary and lower-secondary levels performed above the international average Although Canadian 15-year-olds have performed among the top-ranking countries in mathematics since the inception of PISA in 2000 it appears that there is potential for further improvement by possibly providing future teachers at the elementary level with more advanced training in mathematics that covers elements beyond the school curriculum and by providing future teachers at the lower-secondary level with more advanced training in testing- and assessment-related topics
31
ReferencesAtlantic Evaluation and Research Consultants (2007) Kndash12 mathematics curriculum review Final report Retrieved from httpwwwedgovnlcaedupublicationsk12NLMathReportpdf
Bloumlmeke S Kaiser G amp Lehmann R (Eds) (2010) TEDS-M 2008 Professional Competences and Opportunities to Learn of Future Mathematics Teachers at Lower-Secondary Schools in the International Context Muumlnster Waxmann
Bloumlmeke S Kaiser G amp Lehmann R (Eds) (2010) TEDS-M 2008 Professional Competences and Opportunities to Learn of Future Primary Teachers in the International Context Muumlnster Waxmann
Carnoy M Beteille T Brodziak I Loyalka P amp Luschei T (2009) Do countries paying teachers higher relative salaries have higher student mathematics achievement Palo Alto CA StanfordUniversityRetrievedfromhttpstedseducmsueduTEDS_CostsStudyzip
Council of Ministers of Education Canada (2009) PCAP-13 2007 Contextual Report on Student Achievement in Reading Toronto Author
Crocker R amp Dibbon D (2008) Teacher education in Canada a baseline study Kelowna BC Society for the Advancement of Excellence in Education
Dibbon D amp Sheppard B (2001) Teacher demand supply and retention in Newfoundland and LabradorMemorialUniversityofNewfoundlandRetrievedfromhttpwwwmuncaeducpeoplefacultyddibbonpdfFinal20reportchapter1-Introductionpdf
Feng-JuiHTing-YingWChia-JuiHShu-JyhTGuohengCChiu-KeungLet al (2010) A milestone of an international study in Taiwan teacher education National Research Center of Taiwan Teacher Education and Development Study in Mathematics in Taiwan
Ministegravere de lrsquoEacuteducation du Queacutebec (2004) Surplus ou peacutenurie de personnel enseignant qualifieacute au Queacutebec situation actuelle et perspectives agrave court et moyen terme pour le secteur francophone Retrieved from httpwwwmelsgouvqccadftpsinterieurpdfpers_emploi_prevision_nov04pdf
Mullis IVS Martin MO Kennedy AM amp Foy P (2007) PIRLS 2006 International ReportChestnutHillMABostonCollege
Mullis I Martin M Ruddock G OrsquoSullivan C Arora A amp Erberber E (2005) TIMSS 2007 assessment frameworks International Association for the Evaluation of Educational Achievement Retrieved from httptimssbceduTIMSS2007PDFT07_AFpdf
Nova Scotia Department of Education (2007) Nova Scotia public education teacher supply and demand Retrieved from httpwwwednetnscapdfdocsreportsteacher_supply_and_demand_reportpdf
32
Nova Scotia Department of Education (2008) Report and recommendations of the review panel on teacher education in Nova Scotia Retrieved from httpwwwednetnscaeventsteacher_education_reviewdocumentsreview_panel_report_web_epdf
Ontario College of Teachers (2001) Teacher supply and demand Report on the consultation Retrieved from httpwwwoctcapublicationspdftsd_epdf
Ontario College of Teachers (2007) State of the teaching profession 2007 Annual Ontario College of Teachers survey of teachers Retrieved from httpwwwoctcapublicationsPDFsurvey07_epdf
Ontario College of Teachers (2009) Transition to teaching 2009 Retrieved from httpwwwoctcapublicationsPDFtransitions09_epdf
Statistics Canada (2008) CANSIM Table 477-0014 mdash University degrees diplomas and certificates granted by program level Classification of Instructional Programs Primary Grouping (CIP_PG) and sex annual (number) Retrieved from httpdc2chassutorontoca
Tatto MT Ingvarson L Schwille J Peck R Senk SL amp Rowley G (2008) Teacher Education and Development Study in Mathematics (TEDS-M) Policy practice and readiness to teach primary and secondary mathematics Conceptual framework East Lansing MITEDS-MInternationalStudyCenteratMichiganStateUniversityRetrievedfromhttpstedseducmsueduTEDS_FrameworkFinalzip
33
APPENDIX I
sample syllabus Coding
math 250 probability and statistics for elementary middle-school teachers
Instructor Dr KP Lee Office 456HonorsTower
Phone 789-0123 E-mail kpleestandarduedu
Office hours 350ndash450 pm on Mondays and by appointment
COurse prereQuisitesCompletion of Math 125 or equivalent with a C grade or higher Those not meeting the course prerequisites will be automatically dropped from the course by the Department of Mathematics
COurse materialsText Probability and Statistics for ElementaryMiddle-School Teachers
A TI-73 graphing calculator (other models such as the TI-83 and TI-86 will not have the features needed for this course and will not be sufficient)
COurse Overview anD ObjeCtivesThis course is designed to provide pre-service elementary and middle-school teachers with
[laboratory-based experiences designed to teach and reinforce basic statistics and probability concepts often situated in the core tasks of teaching including the examination and critiquing of the statistical thinking and arguments of others]
[opportunities to demonstrate their understanding of statistics and probability concepts in meaningful constructive and alternative ways]
[activities involving the use of calculator technology (this course is usedtosatisfypartoftheUniversityComputerUsagerequirementfor students in elementary teacher education)]
[experiences that model techniques for use in their future elementarymiddle-school classrooms]
U1 T24
B1 T2117331332
B2 T2
117
B3 T2
117355356
34
[The majority of class time will be devoted to small-group exploration and class discussion with an emphasis on reasoning and communication of statistics and probability ideas rather than on rote memorization Students will be expected to demonstrate that they are prepared for class each day by bringing course materials and completed homework assignments Students will be asked to work cooperatively in groups and participate in whole-class discussions Studentsrsquo consistent engagement in these activities will be reflected in their participation grade]
Codes Used in this Excerpt
U1 Sequentialunitnumberofthecodeddocument
T2 An objective of the course
T24 A course that covers specialized mathematics knowledge needed for teaching mathematics
B1 B2 B3 and B4 Each block of information being coded
117 Mathematics block on data representation probability and statistics
331 Mathematics education block on developing mathematical concepts
332 Mathematics education block on reasoning argumentation and proving
355 Mathematics instruction block on using calculators
356 Mathematics instruction block on using computers
117
B4 T2
35
APPENDIX II
examples of assessment items in the primary general pedagogy Knowledge for teaching section of the future teacher Questionnaire
Example 1
Label MFC106Item type Multiple choiceDimension Mathematics Content KnowledgeDomain DataSub-domain Applying
Two fair six-sided number cubes are thrown in a probability game and the two numbers at the top are recorded
Josie wins if the difference between the two numbers is 0 1 or 2 Farid wins if the difference between the two numbers is 3 4 or 5
The students discuss whether the game is fair
Which of the following statements is correct
Check one box
A Both have an equal chance of winning
33
B Josie has the greater chance of winning
50
C Farid has the greater chance of winning
12
D As the game involves number cubes itrsquos not possible to say who has the greater chance of winning
05
For this probability question only half of the future teachers responded correctly that Josie had a greater chance of winning One-third of the respondents were incorrectly drawn to the first option thinking that both Josie and Farid had an equal chance of winning
36
Example 2
Label MFC108Item type Multiple choiceDimension Mathematics Pedagogical Content KnowledgeDomain AlgebraSub-domain Enacting
Amy is building a sequence of geometric figures with toothpicks by following the pattern shown below Each new figure has one extra triangle
Variable t denotes the position of a figure in the sequence
In finding a mathematical description of the pattern Amy explains her thinking by saying I use three sticks for each triangle
Then I see that I am counting one stick twice for each triangle except the last one so I have to remove those
Variable n represents the total number of toothpicks used in a figure
Which of the equations below best represent Amyrsquos statement in algebraic notation
Check one box
A n = 2t + 1 29
B n = 2(t + 1) ndash 1
26
C n = 3t ndash (t ndash1)
36
D n = 3t + 1 ndash t
08
This question was difficult for Canadian future teachers with almost two-thirds of the respondents unable to identify the correct algebraic notation for this pattern
t = 1 t = 2 t = 3
hellip
37
Example 3
Label MFC202Item type Multiple choiceDimension Mathematics Content KnowledgeDomain AlgebraSub-domain Knowing
Indicate whether each of the following statements is true for the set of all whole numbers a b and c greater than zero
Check one box in each row
True Not True
A a ndash b = b ndash a
16
84
B a divide b = b divide a
06
95
C (a + b) + c = a + (b + c)
93
07
D (a ndash b) ndash c = a ndash (b ndash c)
23
77
ThisalgebraquestionwasrelativelyeasyforCanadianfutureteachersHoweveralmostone-quarter of the respondents did not know that the fourth statement was not true even though the question appeared to be relatively easy to solve with whole numbers
38
Example 4
Label MFC203Item type Multiple choiceDimension Mathematics Content Knowledge Domain GeometrySub-domain Applying
A rectangular-shaped swimming pool has a paved walkway (shaded) around it as shown
What is the area of the walkway
Check one box
A 100 m2
04
B 161 m2
06
C 710 m2
78
D 1610 m2
12
This question was relatively easy for Canadian respondents with 78 getting the correctanswerHowever12calculatedtheentireareabutfailedtosubtractthearea of the swimming pool
70 m
50 m
18 m 23 mPool
not to scale
Walkway
39
Example 5
Label MFC206Item type Constructed responseDimension Mathematics Content Knowledge Domain NumberSub-domains Applying Planning
a) Amachineuses24litresoffuelforevery30hoursofoperationHowmanylitresoffuel will the machine use in 100 hours if it continues to use fuel at the same rate
Check one box
A 72
11
B 80
79
C 84
08
D 96
02
This question was relatively easy for Canadian respondents with almost 80 getting thecorrectresponseHoweveroneinfiverespondentsdidmakeacalculationerrorwhen solving this simple problem
b) Create a different problem of the same type as the problem in (a) (same processesoperations) that is EASIER for primary children to solve
40
Scoring Guide
Code Response Item MFC206B
Correct Response
10
A different problem of the same type (same processesoperations) but easier to solveExamples
bull Amachineuses3litresoffuelforevery30hoursofoperationHowmanylitres of fuel will the machine use in 100 hours
bull Acaruses24litresoffuelforevery50kmHowmanylitresoffuelwillthe car use in 100 km
Incorrect Response
70
A different problem of the same type (same processesoperations) but NOT easier to solve (Note Items judged to be of the same level of difficulty are NOT easier)Examples
bull Amachineuses2litresoffuelforevery30hoursofoperationHowmanylitres of fuel will the machine use in 100 hours (2 is not divisible by 3)
bull Atapdrips2litresofwatereverydayHowmanymlisthispersecond(The metric knowledge required and the computational load are significantly higher)
79
Other incorrect response (including crossed out erased illegible or off-task responses and stray marks)Examples
bull questionsthatarenotmeaningfulorhavenoanswer
No Response
99 Blank
About 84 of Canadian future teachers were able to create a problem of the same type but that was easier to solve Nine per cent of respondents created a similar problem but that was not easier to solve
41
examples of assessment items in the secondary general pedagogy Knowledge for teaching section of the future teacher Questionnaire
Example 1
Label MFC604Item type Constructed responseDimension Mathematics Content KnowledgeDomain AlgebraSub-doman Applying
The following problems appear in a mathematics textbook for lower secondary schools
1 Peter David and James play a game with marbles They have 198 marbles altogether Peter has 6 times as many marbles as David and James has 2 times as many marbles asDavidHowmanymarblesdoeseachboyhave
2 Three children Wendy Joyce and Gabriela have 198 zeds altogether Wendy has 6timesasmuchmoneyasJoyceand3timesasmuchasGabrielaHowmanyzedsdoes each child have
(a) Solve each problem
Solution to Problem 1
Solution to Problem 2
42
Scoring Guide
Note The correct answers to MFC604A1 and MFC604A2 are as follows
Problem 1 David has 22 marbles Peter has 132 marbles and James has 44 marbles
Problem 2 Wendy has 132 zeds Joyce has 22 zeds and Gabriela has 44 zeds
The following methods are considered in the scoring guide
1) Usingone variable setting up one equation and solving
Example (Problem 1) Let m = the number of marbles that David has Then Peter has 6m and James has 2m Therefore 6m + 2m + m = 198 and m = 22
2) Usingmore than one variable establishing a system of equations performing substitutions and solving
Example (Problem 1) Let p = the number of marbles that Peter has d = the number of marbles that David has and j = the number of marbles that James has Therefore p = 6d and j = 2d p + d + j = 198
3) Trial and error or guess and check
4) Ratio or other arithmetic methods
5) Representationdiagram
Code Response Item ID MFC604A1
Correct Response
11 Response uses Method 1 correctly to solve Problem 1 and get the correct answers
12 Response uses Method 2 correctly to solve Problem 1 and get the correct answers
13 Response uses Method 3 correctly to solve Problem 1 and get the correct answers
14 Response uses Method 4 correctly to solve Problem 1 and get the correct answers
15 Response uses Method 5 correctly to solve Problem 1 and get the correct answers
19Response uses a correct but different method from those listed above to solve Problem 1 and get the correct answers
Incorrect Response
70Response uses one of Methods 1 to 5 to solve Problem 1 but arrives at an incorrect answer or cannot complete the solution because of a computation or algebra error
71Response uses a correct but different method from those listed above to solve Problem 1 but arrives at an incorrect answer or cannot complete the solution because of a computation or algebra error
79 Other incorrect response (including crossed out erased illegible or off-task responses and stray marks)
No Response
99 Blank
43
Code Response Item ID MFC604A2
Correct Response
11 Response uses Method 1 to solve Problem 2
12 Response uses Method 2 to solve Problem 2
13 Response uses Method 3 to solve Problem 2
14 Response uses Method 4 to solve Problem 2
15 Response uses Method 5 to solve Problem 2
19Response uses a correct but different method from those listed above to solve Problem 2 and get the correct answers
Incorrect Response
70Response uses one of Methods 1 to 5 to solve Problem 2 but arrives at an incorrect answer or cannot complete the solution because of a computation or algebra error
71Response uses a correct but different method from those listed above to solve Problem 2 but arrives at an incorrect answer or cannot complete the solution because of a computation or algebra error
79 Other incorrect response (including crossed out erased illegible or off-task responses and stray marks)
No Response
99 Blank
Overall Problem 1 was easy to solve for Canadian future teachers with 85 getting the correct response The majority of respondents (53) used Method 1 to solve Problem 1 and 29 used Method 2 Problem 2 was of medium difficulty for Canadian future teachers with 65 getting a right answer Sixteen per cent of future teachers used one of the five methods listed to solve Problem 2 but made a computation or algebra error (code 70)
44
Example 2
Label MFC610Item type Multiple choiceDimension Mathematics Content KnowledgeDomain NumberSub-domain Knowing
Determine whether each of the following is an irrational number always sometimes or never
Check one box in each row
Always Sometimes Never
A The result of dividing the circumference of a circle by its diameter
65 26 09
B The diagonal of a square with side of length 1
75 11 14
C Result of dividing 22 by 7 66 06 28
Canadian future teachers had some difficulty identifying the characteristics of irrational numbers Only 28 of respondents knew that dividing 22 by 7 never results in an irrational number possibly confusing this fraction with π which is irrational
45
Example 3
Label MFC704Item type Constructed responseDimension Mathematics Content KnowledgeDomain GeometrySub-domain Applying
On the figure ABCD is a parallelogram ang BAD = 60˚ AM and BM are angle bisectors of angles BAD and ABC respectively If the perimeter of ABCD is 6 cm find the sides of triangle ABM
Write your answers on the lines below
AB = _______ cm
AM = _______ cm
BM = _______ cm
Scoring Guide
Code Response Item ID MFC704
Correct Response
20
Response indicates all three correct entries belowAB = 2 cmAM = radic3 cm or equivalentBM = 1 cm
Partially Correct Response
10 Response indicates any two correct entries and one incorrect (or blank) entry
11 Response indicates any one correct entry and two incorrect (or blank) entries
Incorrect Response
79 Incorrect mathematical statements or statements of no value (including crossed out erased illegible or off-task responses and stray marks)
No Response
99 Blank
This was a difficult question for Canadian future teachers with only 41 giving all three correct responses Another 14 had two correct responses and 8 had one correct response This means that 37 of respondents could not find any of the three measures of the triangle
D
A B
M C
46
Example 4
Label MFC705Item type Multiple choiceDimension Mathematics Content KnowledgeDomain GeometrySub-domain Knowing
We know that there is only one point on the real line that satisfies the equation 3x = 6 namely x = 2
Suppose now that we consider this same equation in the plane with coordinates x and y and then in space with coordinates x y and z What does the set of points that satisfy the equation 3x = 6 look like in these settings
Check one box in each row
One point One line One plane Other
A The solution to 3x = 6 in the plane 22 69 08 01
B The solution to 3x = 6 in space 14 09 71 07
This geometry question was moderately difficult for Canadian future teachers with about 70 of respondents knowing that the proposed solution would look like one line in the plane and one plane in space
- Table of Contents
- List of Figures
- What is TEDS-M 2008
- Research design and methodology for TEDS-M
- What is to be learned from TEDS-M
- What value will TEDS-M add to existing research on teacher education
- Target populations
- Components of TEDS-M
-
- Component 1 studies of teacher-education policies for elementary and lower-secondary mathematics teachers and their cultural and social contexts
- Component 2 studies of elementary and lower-secondary mathematics teacher-preparation routes programs standards and expectations for teacher learning
- Component 3 studies of the mathematics and related teaching knowledge of future elementary and lower-secondary school teachers
-
- Participating countries in TEDS-M
- The Canadian administration
- Structure and organization of teacher education in Canada
- Programs in specific jurisdictions
-
- Ontario
- Quebec
- Nova Scotia
- Newfoundland and Labrador
-
- The administration of the TEDS-M survey in Canada
-
- Representation at international meetings
- Adaptation translation and approval of assessment and questionnaire materials
-
- Sampling institutions
-
- Contacting institutions and sending and collecting materials
- Quality monitoring
- Coding
-
- Description of teacher-education courses and collection and coding of syllabi
- Coding of mathematics content knowledge and mathematics pedagogical content knowledge
-
- Results
-
- Institutional Program Questionnaire
- Survey for Mathematics Mathematics Pedagogy and General Pedagogy Educators
- Survey for Future Teachers of Lower-Secondary Mathematics
- Survey for Future Teachers of Primary Elementary Mathematics
-
- Conclusion
- References
- Figures
-
- Figure 1enspMean scores and confidence intervals for participating countriesmdashElementary-level future teachers mathematics content knowledge
- Figure 2enspMean scores and confidence intervals for participating countriesmdashElementary-level future teachers pedagogy content knowledge
- Figure 3enspMean scores and confidence intervals for participating countriesmdashLower-secondary-level future teachers mathematics content knowledge
- Figure 4enspMean scores and confidence intervals for participating countriesmdashLower-secondary-level future teachers pedagogy content knowledge
- Figure 5enspMean scores and confidence intervals by gender primary mathematics knowledge
- Figure 6enspMean scores and confidence intervals by gender primary pedagogical knowledge
- Figure 7enspMean scores and confidence intervals by gender lower-secondary mathematics knowledge
- Figure 8enspMean scores and confidence intervals by gender lower-secondary mathematics knowledge
-
- Appendices
-
- APPENDIX I
-
- Sample Syllabus Coding
-
- APPENDIX II
-
- Examples of assessment items in the Primary General Pedagogy Knowledge for Teaching section of the Future Teacher Questionnaire
- Examples of assessment items in the Secondary General Pedagogy Knowledge for Teaching section of the Future Teacher Questionnaire
-
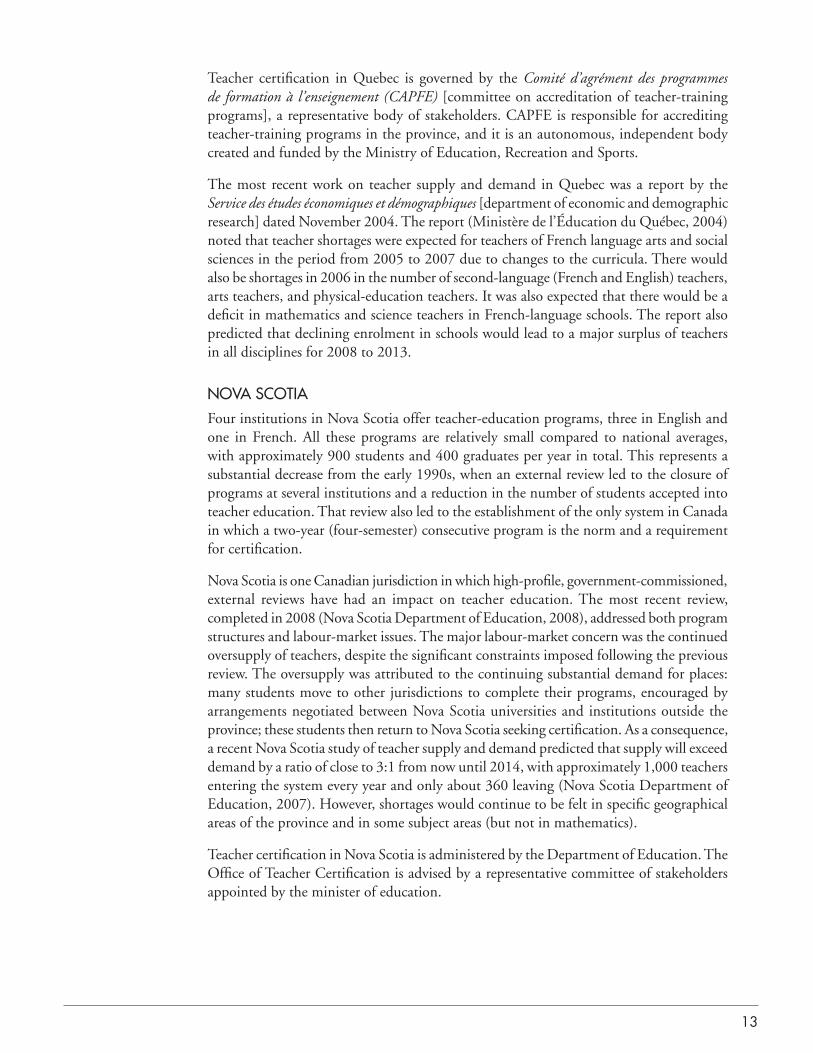

16
COntaCting institutiOns anD senDing anD COlleCting materialsAdministering the TEDS-M survey was a collaborative task shared between the National Research Centre institutional coordinators and survey administrators
Institutional coordinators were responsible for seeking the participation of educators and of future teachers as well as for most administrative arrangements for the TEDS-M main study at the institution including providing a list of future teachers and educators administering educator and institutional questionnaires and collecting syllabi
The National Research Centre appointed survey administrators to administer the sessions to future teachers Survey administrators were selected on the basis of their experience If possible individuals who had previous experience in survey or test administration (eg the Trends in International Mathematics and Science Study the Progress in International Reading Literacy Study the Programme for International Student Assessment) were selected These survey administrators reported directly to the National Research Centre
Quality mOnitOringIn all participating countries approximately 10 per cent of participating institutions were visited during the administration of the survey International quality monitors ensured that the administration procedures were strictly followed and provided detailed reports to ISC
Generally the institutional coordinator was responsible for identifying the most suitable individual who could complete the institutional questionnaire The respondent was asked to complete the questionnaire confidentially and return it to the institutional coordinator It took approximately two hours to complete this questionnaire
The institutional coordinator was also responsible for identifying all educators who were teaching to the target population of future teachers at the time of the administration The questionnaire for educators took approximately 30 minutes to complete
The questionnaire for future teachers was administered by the survey administrator over a two-hour uninterrupted period There were two different versions of the Future Teacher Questionnaire one for elementary teachers and one for secondary teachers In each case several equivalent forms of the questionnaires were used Three of the four sections were equivalent across all forms of the questionnaires General Background (5 minutes) Opportunity to Learn (15 minutes) and Beliefs about Mathematics and Teaching (10 minutes) The Mathematics Knowledge for Teaching section (60 minutes) differed across booklets with some anchor questions to ensure equivalence across forms Some sample questions can be found in the section below
17
CODingDescription of teacher-education courses and collection and coding of syllabi
In all participating institutions the institutional coordinator asked participating educators to provide the course syllabus for each course they were teaching at the time of the data collection These syllabi were sent to the National Research Centre for coding (see Appendix I for a sample of a coded syllabus)
Syllabus analysis is a systematic method of obtaining comprehensive information from syllabus documentation and materials It examines content sequence (when and what topics are intended) and when appropriate performance expectations (what students are expected to do with the content) at the institutional and course levels Qualitative coding protocols were used to capture the coursesrsquo academic content
TEDS-M used a low inference procedure to perform the analysis to reliably investigate the opportunities to learn in different institutions and different countries In addition to understanding how to code the different syllabi coders developed a high level of reliability when coding Inter-coder reliability was closely monitored at the international level An example of the syllabus-coding activity can be found in Appendix I
Coding of mathematics content knowledge and mathematics pedagogical content knowledge
As described in the TEDS-M conceptual framework teaching mathematics consists of two constructs mathematics content knowledge and mathematics pedagogical content knowledge (see Appendix II for sample items) Each question in the Mathematics Knowledge for Teaching section measured one of the four content domains (number geometry algebra data) and one of the three cognitive domains (knowing applying reasoning) Each question in the Mathematics Pedagogical Content Knowledge section measured one of the three aspects of the framework (mathematical curricular knowledge knowledge of planning for mathematics teaching and learning enacting mathematics for teaching and learning)
Coding of all the knowledge questions took place in a central location All coders were graduating future teachers of mathematics who received extensive training Coder reliability was closely monitored throughout the coding session In Canada all coding took place in both English and French ensuring a high degree of consistency across languages
18
ResultsAs mentioned previously TEDS-M surveyed three populations institutions educators and future teachers This section presents some selected Canadian results from the three surveys Due to the very low response rates it should be noted that these results are descriptive of the participating respondents generalizations made to the entire population are not advised
institutional program QuestionnaireOverall 82 questionnaires were distributed to 10 participating institutions because these offered more than one program In some cases institutions offered consecutive andor concurrent programs in others they offered programs at the elementary andor secondary levels and in others yet programs in English andor French All these possible variations explain the number of questionnaires analyzed
HerearesomefindingsfromtheInstitutionalProgramQuestionnaire
bull Amajorityofinstitutions(65)preparefutureteacherstoteachinbothelementaryand secondary schools and there are as many concurrent as consecutive programs represented in the sample
bull Over60ofinstitutionsrequirefutureteachersundertakingtheprogramtohavecompletedatleastGrade12mathematics(advancedorregular)However26of programs do not require a minimum level of mathematics for future teachers
bull Almost all institutions (87) within guidelines set by regional or provincialauthorities set policies governing which applicants are admitted to the program
bull When selecting students for their teacher-preparation programs institutionspay particular attention to candidatesrsquo suitability for teaching which may be assessed by an interview or a written application or by their demonstrated high level of achievement in mathematics (with 87 and 65 of institutions rating thesecriteriaassomewhatimportantorveryimportantrespectively)Howevercandidatesrsquo overall achievement level (91) and performance at the end of the school year (100) are either not considered or considered not important for selection purposes This finding would need to be investigated further as it seems to be inconsistent with findings from Crocker and Dibbon (2008) which suggest that institutions do consider minimum averages in a set of prerequisite courses especially in a competitive environment where the number of applicants exceeds the number of places
bull Withrespecttoprovincialnormsrespondentsviewfutureteachersenteringtheprogram as either high- or above-average achievers (44 and 52 respectively)
bull In theprogramsunder study respondents state thateithermoderateormajorweight is placed on the following program goals
m planning lessons based on recommended pedagogical principles (100)m learning to reflect on onersquos own learning and teaching practices (100)m studying the content of the school curriculum and of the mathematics
curriculum to be taught (100)
19
bull Nolittleoronlysomeweightisplacedonthefollowinggoals
m interpreting data from externally conducted tests (69)m studying mathematics or other disciplines at the tertiary level (65 and
69 respectively)m learning specific strategies and curricula for teaching gifted students (61)m developing the knowledge and skills to do teacher action research (70)
bull Intermsofinstitutionalrequirementsforsuccessfullycompletingtheprogramallrespondents (100) state that future teachers must pass all courses required for the program successfully demonstrate a required level of teaching competence in the classroom and receive a passing grade on their field experience None of the programs require future teachers to write a thesis and only a few (less than 10) require future teachers to pass a written or an oral examination
bull Inabout three-quartersof theprograms teacherswhomentor future teachersduring their extended field practice receive some form of compensation As part of their responsibilities these mentors are expected in all programs to observe future teachers in classrooms They are also expected to provide a formal summative assessment and written narrative reports of the field practice
bull Generally institutionsare responsible forfindingplacements for theextendedteaching practice (in 82 of programs) and although about half of the institutions have no difficulty finding suitable placements for future teachers another 30 state that appropriate placements are not readily available in sufficient numbers
bull Ofthefacultyemployedtoteachmathematicsormathematics-relatedcontentto future teachers all institutions indicate that a masterrsquos degree would normally be required and 70 of institutions would normally require a doctorate Few institutions require that these educators be qualified to teach or have experience teaching at the elementary or secondary level However educators teachingmathematics pedagogy are normally expected to have some experience teaching at the elementary or secondary level in about half of the programs It should be noted that this relative lack of a requirement for teaching experience in some programs does not mean that many educators do not have some teaching experience This is illustrated below by the fact that more than half of the surveyed educators held a teaching certificate All institutions require that mentors supervising the extended teaching practice hold at least a bachelorrsquos degree and in 78 of the programs mentors are expected to hold a masterrsquos degree
survey for mathematics mathematics pedagogy and general pedagogy educatorsOverall 194 questionnaires were distributed and 94 questionnaires were returned
bull The academic rankof the respondentswaswell distributed across all possibleranks with 19 being professors 16 being associate professors 23 assistant professors 17 lecturers 14 instructors and 11 in other roles There were slightly more females (56) than males
20
bull Oftheseeducators27hadadegreeineducation14inmathematicseducationand 10 in mathematics at the doctoral level or higher These figures should be interpreted with caution As stated above a large number of respondents to the survey were likely to be sessional appointees
bull Fifty-twopercentofrespondentsheldateachingcertificateatthetimeofthestudy one-third has never held a teaching certificate
bull Onaveragetheseeducatorshavespentapproximately10yearsattheircurrentinstitutions and about seven years in their teacher-preparation role They teach mostly at the undergraduate level (93) but also at the masterrsquos level (48) and in some cases at the doctoral level (18) In terms of experience 30 have been involved in instructing or supervising future teachers for over 10 years but 37 have done this for three years or less suggesting the existence of a cadre of educators with relatively little experience at least when considering the general profile of the respondents
bull Overthepast12monthsmorethanhalfoftheseeducatorshavenotparticipatedin any professional-development activities related to mathematics or mathematics pedagogyHoweverover60hadparticipatedinatleastsixhoursofprofessionaldevelopment in general pedagogy
bull In thepastyear respondentshavespentabout30of theirworkingtimeonresearch and research-related activities
bull Whenaskedtoconsiderallcoursesintheteacher-educationprogramsofferedattheir institutions about 80 of these educators felt that each stage seemed to be planned to meet the main needs of future teachers at each stage of their preparation and that the programs were organized in a way that covered what future teachers needed tobecomeeffective teachersHowever30disagreed that therewereclear links between most of the courses in the program of study
bull When asked to describe future teachersrsquo level of preparedness for teachingmathematics as they complete the teacher-education program and start their teaching careers 80 or more of these educators felt that future teachers were prepared to a moderate or major extent to clearly communicate ideas and information about mathematics to students that they could establish appropriate learning goals in mathematics for students and that they could set up mathematics learning activities to help students achieve learning goals Conversely over a third of these educators felt that future teachers were not at all or just to a minor extent prepared to use computers and information and communication technology (ICT) to aid in teaching mathematics and to provide parents with useful information about studentsrsquo progress in mathematics Further research would be useful to compare the views of teachers principals and faculties regarding the level of preparedness in using ICT to teach mathematics
bull Finally almost 80 of educators felt that their pre-service teacher-educationprograms were effective or very effective in preparing future teachers of mathematics
21
survey for future teachers of lower-secondary mathematicsOverall 282 questionnaires were distributed to future teachers at the secondary level and 155 were completed
bull Themedianageofrespondentswas24yearsand61werefemalesAbout86of respondents always or almost always spoke the language of the questionnaire at home Eighty-three per cent had taken a calculus or pre-calculus course in high school When comparing themselves to other students at the same grade level in their schools 82 saw themselves as being at the top or near the top of their class in terms of marks
bull Whenaskedtoidentifythemainreasonswhytheydecidedtobecometeachersthese future teachers at the secondary level mentioned their perception of teaching as a challenging job their desire to have an influence on the next generation their desire to work with young people their belief that they have a talent for teaching and their love of mathematics as the most significant reasons For the most part they were not influenced by teacher salaries the availability of teaching positions or the fact that they had always been good students in school
bull Almosthalf(47)ofthesefutureteacherssaidthatneedingtoborrowmoneyhindered their studies during their teacher-preparation programs
bull Almostallfutureteachersatthesecondarylevel(95)thoughtthattheywouldor could possibly spend their entire career as a teacher
bull Theserespondentswereaskedtoconsideranumberofmathematicstopicsandtoindicate which ones they had or had never studied Over 80 stated that they had studied calculus linear algebra probability and theoretical or applied statistics Fifty per cent or more stated that they had never studied topology differential geometry theory of real or complex functions or functional analysis or abstract algebra In the context of their teacher-education programs more than half also said that they had not studied validation structuring and abstracting or calculus In terms of emphasis three-quarters said that in their programs they studied mathematics at the level of the school curriculum
bull Intermsofmathematicspedagogyover80saidthattheirprogramscoveredmathematics instruction mathematics standards and curriculum and the development of teaching plans Their programs allowed them to engage in the following activities most often accommodating a wide range of abilities in each lesson exploring how to use manipulatives and creating learning experiences that make central concepts under study meaningful to students The activities that were mentioned the least often were using standardized tests to guide decisions about what and how to teach using assessment to give feedback to parents or guardians and helping students learn how to assess their own learning
bull Whenlookingateducationandpedagogytopicsoverathirdofthesecondary-levelfuture teachers said that they had not studied methods of educational research or the history of education and educational systems
22
bull Withregardtotheirpracticaover60agreedthatthefeedbacktheyreceivedfromtheir mentors helped them to improve their teaching methods that this feedback helped them to improve their understanding of their students and that they had a clear understanding of what their mentors expected of them as teachers in order to pass the practica
bull Regardingtheperceivedoveralleffectivenessoftheirpre-serviceteacher-educationprograms almost a quarter of these future teachers at the secondary level felt that the programs were not effective in preparing them to teach mathematics
survey for future teachers of elementary mathematicsOverall 580 questionnaires were distributed to future teachers at the elementary level and 183 were completed Although the number of respondents is quite substantial the response rate is below the international standard therefore any generalization to the population of future elementary teachers should be made with extreme caution
bull Eighty-sevenpercentofrespondentsofthisquestionnairewerefemaleThismaybe slightly higher than the overall population of elementary teachers Based on the Progress in International Reading Literacy Study (2006) data in which five provinces participated the figures would vary between 72 and 86 for female teachersattheelementarylevelUnfortunatelynoofficialdataareavailableatthepan-Canadian level for this aspect
bull About95alwaysoralmostalwaysspokethelanguageofthequestionnaireathome Only 40 had taken a calculus or pre-calculus course in high school which is much lower than for future teachers at the lower-secondary level When comparing themselves to other students at the same grade level in their schools about half of the respondents saw themselves as being at the top or near the top of their class in terms of marks again a much lower percentage than for the lower-secondary level
bull Whenaskedtoidentifythemainreasonswhytheydecidedtobecometeachersthese future teachers at the elementary level had very similar response patterns to those at the lower-secondary level They mentioned their talent for teaching their perception of teaching as a challenging job and their desire to work with young people and to have an influence on the next generation as the most significant reasons For the most part they were not influenced by teacher salaries the availability of teaching positions or their love of mathematics (which is logical since elementary-level teachers are normally generalists)
bull Theserespondentswereaskedtoconsideranumberofmathematicstopicsandtoindicate which ones they had or had never studied As can be expected the vast majority had not studied many advanced topics in mathematics with over 90 not having studied advanced calculus abstract or linear algebra or theory of real or complex functions or functional analysis In fact the only advanced topics
23
studied by more than half of these respondents were probability and number theory In the context of their teacher-education programs over 85 said that they had not studied calculus validation or structuring and abstracting In terms of emphasis almost 90 said that in their programs they studied mathematics at the level of the school curriculum and 63 said that their learning was at a deeper or more conceptual level than that of the school curriculum
bull Intermsofmathematicspedagogyover80saidthattheirprogramscoveredmathematics instruction mathematics standards and curriculum and mathematics teaching per se Their programs allowed them to engage in the following activities most often exploring how to use manipulatives creating learning experiences that make central concepts under study meaningful to students locating suitable curriculum materials and teaching resources and developing games or puzzles accommodating a wide range of abilities in each lesson and building on studentsrsquo existing mathematics knowledge and thinking skills The activities that were mentioned the least often were using standardized tests to guide decisions about what and how to teach using assessment to give feedback to parents or guardians and helping students learn how to assess their own learning (similar to lower-secondary respondents)
bull Whenlookingateducationandpedagogytopicsoverathirdoftheelementary-level future teachers said that they had not studied methods of educational research or the history of education and educational systems
bull Withregardtotheirpracticaaswasthecaseforthelower-secondarylevelover60 agreed that they had a clear understanding of what their mentors expected of them as teachers in order to pass the practica that the feedback they received from their mentors helped them to improve their teaching methods and that this feedback helped them to improve their understanding of their students A large proportion of these respondents also felt that their mentors valued the ideas and approaches they brought from their teacher-education programs
bull Regardingtheperceivedoveralleffectivenessoftheirpre-serviceteacher-educationprograms elementary-level future teachers were generally more pleased than secondary-level future teachers with their programs in preparing them to teach mathematics
An important contribution of TEDS-M is the assessment of participating future teachers with regard to their knowledge of mathematics of mathematics pedagogy and of general pedagogy The design of TEDS-M lends itself to the ranking of countries according to theirmeanscoresonthesethreeareasHoweverinternationalcomparisonsbasedontheserankings are not desirable because these mean scores are relatively unstable due to the small number of respondents in several participating countries Moreover since Canada did not meet the sampling requirements the Canadian data must be treated with extreme caution For the same reason no results are provided by province although ministries and departments of education have access to their own data in order to analyze their results according to their own contexts
24
What may be most useful in the Canadian context is to look at countries that tend to perform better on this knowledge component and to analyze their contextual factors which may help to explain their results Furthermore it should be kept in mind that teacher-education programs in Canada are far from homogeneous mdash even within a province mdash and that it may be more useful to analyze the contextual factors in each province taking into account the limitations of the study
Results are presented separately for teachers at the elementary level and teachers at the lower-secondary level and are broken down for mathematics content knowledge and mathematics pedagogical content knowledge Results are scaled with an international mean of 500 and a standard deviation of 100
Figure 1 Mean scores and confidence intervals for participating countriesmdash Elementary-level future teachersrsquo mathematics content knowledge
Note The Canadian average score is not part of the international average score due to Canadas low response rates
Poland (490)
Malaysia (488)
Spain (481)
Canada (522)
Georgia (345)
Chile (413)
Botswana (441)
Philippines (440)
International (500)
Germany (510)
Thailand (528)
Norway (519)
United States (518)
Russian Federation (535)
Singapore (590)
Switzerland (543)
Chinese Taipei (623)
Below the international average
At the international average
Above the international average
330 350 370 390 410 430 450 470 490 510 530 550 570 590 610 630
95 Confidence interval
Estimated mean score
25
Figure 2 Mean scores and confidence intervals for participating countriesmdash Elementary-level future teachersrsquo pedagogy content knowledge
Note The Canadian average score is not part of the international average score due to Canadas low response rates
Among the other 15 countries participating in the study elementary-level future teachers from Chinese Taipei and from Singapore outperformed those from other countries in both mathematics content knowledge and mathematics pedagogical content knowledge Another groupofcountriescomprisingSwitzerlandNorwayandtheUnitedStateshadresultsabove the international average in both mathematics and pedagogical content knowledge as did Canada A group of six countries (Georgia Chile the Philippines Botswana Spain and Poland) performed below the international average in both components
International (500)
Spain (492)
Poland (478)
Canada (541)
Georgia (345)
Chile (425)
Philippines (457)
Botswana (448)
Germany (502)
Malaysia (503)
Switzerland (537)
Russian Federation (512)
Thailand (506)
United States (544)
Chinese Taipei (592)
Norway (545)
Singapore (593)
Below the international average
At the international average
Above the international average
330 350 370 390 410 430 450 470 490 510 530 550 570 590 610 630
95 Confidence interval
Estimated mean score
26
Figure 3 Mean scores and confidence intervals for participating countriesmdash Lower-secondary-level future teachersrsquo mathematics content knowledge
Note The Canadian average score is not part of the international average score due to Canadas low response rates
Thailand (479)
Oman (472)
Norway (444)
Canada (516)
Chile (354)
Georgia (424)
Philippines (442)
Botswana (441)
Malaysia (493)
International (500)
Switzerland (531)
Germany (519)
United States (505)
Poland (540)
Russian Federation (594)
Singapore (570)
Chinese Taipei (667)
Below the international average
At the international average
Above the international average
340 360 380 400 420 440 460 480 500 520 540 560 580 600 620 640 660 680
95 Confidence interval
Estimated mean score
27
Figure 4 Mean scores and confidence intervals for participating countriesmdash Lower-secondary-level future teachersrsquo pedagogy content knowledge
Note The Canadian average score is not part of the international average score due to Canadas low response rates
The results are quite similar at the lower-secondary level however future teachers from Chinese Taipei significantly outperformed all other countries in both mathematics and pedagogical content knowledge This is not surprising considering that on the PISA 2006 mathematics assessment 15-year-old students from Chinese Taipei outperformed students from all other countries Interestingly future teachers from the Russian Federation had a much stronger performance in both aspects at the lower-secondary level compared to the elementary level This also holds true for German future teachers although to a lesser extent Conversely future teachers from Norway performed below the international average at the lower-secondary level even though they performed above the international average at the elementary level
Keeping in mind the serious data limitations for Canada it is worth noting that our future teachers performed above the international average in both mathematics and pedagogical content knowledge at both the elementary and lower-secondary levels
Oman (474)
Malaysia (472)
Norway (463)
Canada (513)
Chile (394)
Botswana (425)
Philippines (450)
Georgia (443)
Thailand (476)
International (500)
Germany (540)
Poland (524)
United States (502)
Switzerland (549)
Russian Federation (566)
Singapore (553)
Chinese Taipei (649)
Below the international average
At the international average
Above the international average
380 400 420 440 460 480 500 520 540 560 580 600 620 640 660 680
95 Confidence interval
Estimated mean score
28
Figure 5 Mean scores and confidence intervals by gender primary mathematics knowledge
Figure 6 Mean scores and confidence intervals by gender primary pedagogical knowledge
Among Canadian future teachers at the elementary level there was no statistical difference between their mathematics and pedagogical content knowledge Although the mean score for female future teachers was higher than that for males in pedagogical content knowledge the difference was not statistically significant Of note is the large imbalance intheproportionofmaleteachersinthesample(1in7)Howeverthisisafairlyaccuratereflection of the situation in the population which sees about 80 of teachers in elementary schools in Canada being female (Mullis et al 2007)
524
521Female
Male
400 450 500 550 600
528
543Female
Male
400 450 500 550 600
29
Figure 7 Mean scores and confidence intervals by gender lower-secondary mathematics knowledge
Figure 8 Mean scores and confidence intervals by gender lower-secondary pedagogical knowledge
At the lower-secondary level male future teachers had higher mean scores in both mathematics and pedagogical content knowledge than did females but the differences were not statistically significant The gender imbalance in the sample was not as pronounced at this level as at the elementary level (three female future teachers for every two males at the lower-secondary level) Overall in Canada this is a fair reflection of the situation at the lower-secondary level which sees approximately 70 of teachers being female2
527
509Female
Male
400 450 500 550 600
526
505Female
Male
400 450 500 550 600
2 According to the Pan-Canadian Assessment Program 2007 across all provinces and territories between 50 and 87 of teachers of 13-year-olds are females
30
ConclusionTEDS-M is a comparative study of teacher education with a focus on the preparation of mathematics teachers at the elementary and lower-secondary levels As the first attempt to systematically investigate both the knowledge and skills of future teachers in an international setting the study faced significant challenges in several countries In Canada given the structure of our education systems provinces and territories individually determined whether they wished to be involved in such an endeavour Four provinces (Ontario Quebec Nova Scotia and Newfoundland and Labrador) elected to participate and in each province the participation of individual institutions individual educators and individual future teachers was completely voluntary The very low response rates obtained in Canada and the ensuing non-inclusion in the international data set are indeed disappointing mdash but also very informative mdash should such an initiative be repeated in the future Conducting such an ambitious assessment project is possible but would require engaging all parties early on and throughout the implementation of the project
We are grateful to the ministriesdepartments of education institutions faculties of education educators and future teachers who did participate in this TEDS-M 2008 assessment project It is hoped that the project will yield useful information to guide teacher education in the future
Keeping in mind the serious limitations of the data gathered from TEDS-M there are a few conclusions from the study that may help elicit further discussion among policy-makers and educators
bull IngeneralCanadianinstitutionsdonotseemtohaveverystrongrequirementsin mathematics for individuals wishing to enter into teacher-education programs Other than assessments to meet the requirements for a course in mathematics or in mathematics education there is no formal test of the mathematical knowledge or skills of future teachers at the completion of their program of study
bull Mosteducatorsofmathematicsorofmathematicspedagogyforfutureteachersin Canadian universities are specialized in areas other than mathematics and few hold a doctorate in the discipline At the international level about one-quarter of educators who participated in the TEDS-M study held a doctorate in mathematics with a higher proportion in higher-performing countries In Canada 10 per cent of participating educators held a doctorate in mathematics
bull WithregardtoknowledgeofmathematicsandofmathematicspedagogyCanadianfuture teachers at the elementary and lower-secondary levels performed above the international average Although Canadian 15-year-olds have performed among the top-ranking countries in mathematics since the inception of PISA in 2000 it appears that there is potential for further improvement by possibly providing future teachers at the elementary level with more advanced training in mathematics that covers elements beyond the school curriculum and by providing future teachers at the lower-secondary level with more advanced training in testing- and assessment-related topics
31
ReferencesAtlantic Evaluation and Research Consultants (2007) Kndash12 mathematics curriculum review Final report Retrieved from httpwwwedgovnlcaedupublicationsk12NLMathReportpdf
Bloumlmeke S Kaiser G amp Lehmann R (Eds) (2010) TEDS-M 2008 Professional Competences and Opportunities to Learn of Future Mathematics Teachers at Lower-Secondary Schools in the International Context Muumlnster Waxmann
Bloumlmeke S Kaiser G amp Lehmann R (Eds) (2010) TEDS-M 2008 Professional Competences and Opportunities to Learn of Future Primary Teachers in the International Context Muumlnster Waxmann
Carnoy M Beteille T Brodziak I Loyalka P amp Luschei T (2009) Do countries paying teachers higher relative salaries have higher student mathematics achievement Palo Alto CA StanfordUniversityRetrievedfromhttpstedseducmsueduTEDS_CostsStudyzip
Council of Ministers of Education Canada (2009) PCAP-13 2007 Contextual Report on Student Achievement in Reading Toronto Author
Crocker R amp Dibbon D (2008) Teacher education in Canada a baseline study Kelowna BC Society for the Advancement of Excellence in Education
Dibbon D amp Sheppard B (2001) Teacher demand supply and retention in Newfoundland and LabradorMemorialUniversityofNewfoundlandRetrievedfromhttpwwwmuncaeducpeoplefacultyddibbonpdfFinal20reportchapter1-Introductionpdf
Feng-JuiHTing-YingWChia-JuiHShu-JyhTGuohengCChiu-KeungLet al (2010) A milestone of an international study in Taiwan teacher education National Research Center of Taiwan Teacher Education and Development Study in Mathematics in Taiwan
Ministegravere de lrsquoEacuteducation du Queacutebec (2004) Surplus ou peacutenurie de personnel enseignant qualifieacute au Queacutebec situation actuelle et perspectives agrave court et moyen terme pour le secteur francophone Retrieved from httpwwwmelsgouvqccadftpsinterieurpdfpers_emploi_prevision_nov04pdf
Mullis IVS Martin MO Kennedy AM amp Foy P (2007) PIRLS 2006 International ReportChestnutHillMABostonCollege
Mullis I Martin M Ruddock G OrsquoSullivan C Arora A amp Erberber E (2005) TIMSS 2007 assessment frameworks International Association for the Evaluation of Educational Achievement Retrieved from httptimssbceduTIMSS2007PDFT07_AFpdf
Nova Scotia Department of Education (2007) Nova Scotia public education teacher supply and demand Retrieved from httpwwwednetnscapdfdocsreportsteacher_supply_and_demand_reportpdf
32
Nova Scotia Department of Education (2008) Report and recommendations of the review panel on teacher education in Nova Scotia Retrieved from httpwwwednetnscaeventsteacher_education_reviewdocumentsreview_panel_report_web_epdf
Ontario College of Teachers (2001) Teacher supply and demand Report on the consultation Retrieved from httpwwwoctcapublicationspdftsd_epdf
Ontario College of Teachers (2007) State of the teaching profession 2007 Annual Ontario College of Teachers survey of teachers Retrieved from httpwwwoctcapublicationsPDFsurvey07_epdf
Ontario College of Teachers (2009) Transition to teaching 2009 Retrieved from httpwwwoctcapublicationsPDFtransitions09_epdf
Statistics Canada (2008) CANSIM Table 477-0014 mdash University degrees diplomas and certificates granted by program level Classification of Instructional Programs Primary Grouping (CIP_PG) and sex annual (number) Retrieved from httpdc2chassutorontoca
Tatto MT Ingvarson L Schwille J Peck R Senk SL amp Rowley G (2008) Teacher Education and Development Study in Mathematics (TEDS-M) Policy practice and readiness to teach primary and secondary mathematics Conceptual framework East Lansing MITEDS-MInternationalStudyCenteratMichiganStateUniversityRetrievedfromhttpstedseducmsueduTEDS_FrameworkFinalzip
33
APPENDIX I
sample syllabus Coding
math 250 probability and statistics for elementary middle-school teachers
Instructor Dr KP Lee Office 456HonorsTower
Phone 789-0123 E-mail kpleestandarduedu
Office hours 350ndash450 pm on Mondays and by appointment
COurse prereQuisitesCompletion of Math 125 or equivalent with a C grade or higher Those not meeting the course prerequisites will be automatically dropped from the course by the Department of Mathematics
COurse materialsText Probability and Statistics for ElementaryMiddle-School Teachers
A TI-73 graphing calculator (other models such as the TI-83 and TI-86 will not have the features needed for this course and will not be sufficient)
COurse Overview anD ObjeCtivesThis course is designed to provide pre-service elementary and middle-school teachers with
[laboratory-based experiences designed to teach and reinforce basic statistics and probability concepts often situated in the core tasks of teaching including the examination and critiquing of the statistical thinking and arguments of others]
[opportunities to demonstrate their understanding of statistics and probability concepts in meaningful constructive and alternative ways]
[activities involving the use of calculator technology (this course is usedtosatisfypartoftheUniversityComputerUsagerequirementfor students in elementary teacher education)]
[experiences that model techniques for use in their future elementarymiddle-school classrooms]
U1 T24
B1 T2117331332
B2 T2
117
B3 T2
117355356
34
[The majority of class time will be devoted to small-group exploration and class discussion with an emphasis on reasoning and communication of statistics and probability ideas rather than on rote memorization Students will be expected to demonstrate that they are prepared for class each day by bringing course materials and completed homework assignments Students will be asked to work cooperatively in groups and participate in whole-class discussions Studentsrsquo consistent engagement in these activities will be reflected in their participation grade]
Codes Used in this Excerpt
U1 Sequentialunitnumberofthecodeddocument
T2 An objective of the course
T24 A course that covers specialized mathematics knowledge needed for teaching mathematics
B1 B2 B3 and B4 Each block of information being coded
117 Mathematics block on data representation probability and statistics
331 Mathematics education block on developing mathematical concepts
332 Mathematics education block on reasoning argumentation and proving
355 Mathematics instruction block on using calculators
356 Mathematics instruction block on using computers
117
B4 T2
35
APPENDIX II
examples of assessment items in the primary general pedagogy Knowledge for teaching section of the future teacher Questionnaire
Example 1
Label MFC106Item type Multiple choiceDimension Mathematics Content KnowledgeDomain DataSub-domain Applying
Two fair six-sided number cubes are thrown in a probability game and the two numbers at the top are recorded
Josie wins if the difference between the two numbers is 0 1 or 2 Farid wins if the difference between the two numbers is 3 4 or 5
The students discuss whether the game is fair
Which of the following statements is correct
Check one box
A Both have an equal chance of winning
33
B Josie has the greater chance of winning
50
C Farid has the greater chance of winning
12
D As the game involves number cubes itrsquos not possible to say who has the greater chance of winning
05
For this probability question only half of the future teachers responded correctly that Josie had a greater chance of winning One-third of the respondents were incorrectly drawn to the first option thinking that both Josie and Farid had an equal chance of winning
36
Example 2
Label MFC108Item type Multiple choiceDimension Mathematics Pedagogical Content KnowledgeDomain AlgebraSub-domain Enacting
Amy is building a sequence of geometric figures with toothpicks by following the pattern shown below Each new figure has one extra triangle
Variable t denotes the position of a figure in the sequence
In finding a mathematical description of the pattern Amy explains her thinking by saying I use three sticks for each triangle
Then I see that I am counting one stick twice for each triangle except the last one so I have to remove those
Variable n represents the total number of toothpicks used in a figure
Which of the equations below best represent Amyrsquos statement in algebraic notation
Check one box
A n = 2t + 1 29
B n = 2(t + 1) ndash 1
26
C n = 3t ndash (t ndash1)
36
D n = 3t + 1 ndash t
08
This question was difficult for Canadian future teachers with almost two-thirds of the respondents unable to identify the correct algebraic notation for this pattern
t = 1 t = 2 t = 3
hellip
37
Example 3
Label MFC202Item type Multiple choiceDimension Mathematics Content KnowledgeDomain AlgebraSub-domain Knowing
Indicate whether each of the following statements is true for the set of all whole numbers a b and c greater than zero
Check one box in each row
True Not True
A a ndash b = b ndash a
16
84
B a divide b = b divide a
06
95
C (a + b) + c = a + (b + c)
93
07
D (a ndash b) ndash c = a ndash (b ndash c)
23
77
ThisalgebraquestionwasrelativelyeasyforCanadianfutureteachersHoweveralmostone-quarter of the respondents did not know that the fourth statement was not true even though the question appeared to be relatively easy to solve with whole numbers
38
Example 4
Label MFC203Item type Multiple choiceDimension Mathematics Content Knowledge Domain GeometrySub-domain Applying
A rectangular-shaped swimming pool has a paved walkway (shaded) around it as shown
What is the area of the walkway
Check one box
A 100 m2
04
B 161 m2
06
C 710 m2
78
D 1610 m2
12
This question was relatively easy for Canadian respondents with 78 getting the correctanswerHowever12calculatedtheentireareabutfailedtosubtractthearea of the swimming pool
70 m
50 m
18 m 23 mPool
not to scale
Walkway
39
Example 5
Label MFC206Item type Constructed responseDimension Mathematics Content Knowledge Domain NumberSub-domains Applying Planning
a) Amachineuses24litresoffuelforevery30hoursofoperationHowmanylitresoffuel will the machine use in 100 hours if it continues to use fuel at the same rate
Check one box
A 72
11
B 80
79
C 84
08
D 96
02
This question was relatively easy for Canadian respondents with almost 80 getting thecorrectresponseHoweveroneinfiverespondentsdidmakeacalculationerrorwhen solving this simple problem
b) Create a different problem of the same type as the problem in (a) (same processesoperations) that is EASIER for primary children to solve
40
Scoring Guide
Code Response Item MFC206B
Correct Response
10
A different problem of the same type (same processesoperations) but easier to solveExamples
bull Amachineuses3litresoffuelforevery30hoursofoperationHowmanylitres of fuel will the machine use in 100 hours
bull Acaruses24litresoffuelforevery50kmHowmanylitresoffuelwillthe car use in 100 km
Incorrect Response
70
A different problem of the same type (same processesoperations) but NOT easier to solve (Note Items judged to be of the same level of difficulty are NOT easier)Examples
bull Amachineuses2litresoffuelforevery30hoursofoperationHowmanylitres of fuel will the machine use in 100 hours (2 is not divisible by 3)
bull Atapdrips2litresofwatereverydayHowmanymlisthispersecond(The metric knowledge required and the computational load are significantly higher)
79
Other incorrect response (including crossed out erased illegible or off-task responses and stray marks)Examples
bull questionsthatarenotmeaningfulorhavenoanswer
No Response
99 Blank
About 84 of Canadian future teachers were able to create a problem of the same type but that was easier to solve Nine per cent of respondents created a similar problem but that was not easier to solve
41
examples of assessment items in the secondary general pedagogy Knowledge for teaching section of the future teacher Questionnaire
Example 1
Label MFC604Item type Constructed responseDimension Mathematics Content KnowledgeDomain AlgebraSub-doman Applying
The following problems appear in a mathematics textbook for lower secondary schools
1 Peter David and James play a game with marbles They have 198 marbles altogether Peter has 6 times as many marbles as David and James has 2 times as many marbles asDavidHowmanymarblesdoeseachboyhave
2 Three children Wendy Joyce and Gabriela have 198 zeds altogether Wendy has 6timesasmuchmoneyasJoyceand3timesasmuchasGabrielaHowmanyzedsdoes each child have
(a) Solve each problem
Solution to Problem 1
Solution to Problem 2
42
Scoring Guide
Note The correct answers to MFC604A1 and MFC604A2 are as follows
Problem 1 David has 22 marbles Peter has 132 marbles and James has 44 marbles
Problem 2 Wendy has 132 zeds Joyce has 22 zeds and Gabriela has 44 zeds
The following methods are considered in the scoring guide
1) Usingone variable setting up one equation and solving
Example (Problem 1) Let m = the number of marbles that David has Then Peter has 6m and James has 2m Therefore 6m + 2m + m = 198 and m = 22
2) Usingmore than one variable establishing a system of equations performing substitutions and solving
Example (Problem 1) Let p = the number of marbles that Peter has d = the number of marbles that David has and j = the number of marbles that James has Therefore p = 6d and j = 2d p + d + j = 198
3) Trial and error or guess and check
4) Ratio or other arithmetic methods
5) Representationdiagram
Code Response Item ID MFC604A1
Correct Response
11 Response uses Method 1 correctly to solve Problem 1 and get the correct answers
12 Response uses Method 2 correctly to solve Problem 1 and get the correct answers
13 Response uses Method 3 correctly to solve Problem 1 and get the correct answers
14 Response uses Method 4 correctly to solve Problem 1 and get the correct answers
15 Response uses Method 5 correctly to solve Problem 1 and get the correct answers
19Response uses a correct but different method from those listed above to solve Problem 1 and get the correct answers
Incorrect Response
70Response uses one of Methods 1 to 5 to solve Problem 1 but arrives at an incorrect answer or cannot complete the solution because of a computation or algebra error
71Response uses a correct but different method from those listed above to solve Problem 1 but arrives at an incorrect answer or cannot complete the solution because of a computation or algebra error
79 Other incorrect response (including crossed out erased illegible or off-task responses and stray marks)
No Response
99 Blank
43
Code Response Item ID MFC604A2
Correct Response
11 Response uses Method 1 to solve Problem 2
12 Response uses Method 2 to solve Problem 2
13 Response uses Method 3 to solve Problem 2
14 Response uses Method 4 to solve Problem 2
15 Response uses Method 5 to solve Problem 2
19Response uses a correct but different method from those listed above to solve Problem 2 and get the correct answers
Incorrect Response
70Response uses one of Methods 1 to 5 to solve Problem 2 but arrives at an incorrect answer or cannot complete the solution because of a computation or algebra error
71Response uses a correct but different method from those listed above to solve Problem 2 but arrives at an incorrect answer or cannot complete the solution because of a computation or algebra error
79 Other incorrect response (including crossed out erased illegible or off-task responses and stray marks)
No Response
99 Blank
Overall Problem 1 was easy to solve for Canadian future teachers with 85 getting the correct response The majority of respondents (53) used Method 1 to solve Problem 1 and 29 used Method 2 Problem 2 was of medium difficulty for Canadian future teachers with 65 getting a right answer Sixteen per cent of future teachers used one of the five methods listed to solve Problem 2 but made a computation or algebra error (code 70)
44
Example 2
Label MFC610Item type Multiple choiceDimension Mathematics Content KnowledgeDomain NumberSub-domain Knowing
Determine whether each of the following is an irrational number always sometimes or never
Check one box in each row
Always Sometimes Never
A The result of dividing the circumference of a circle by its diameter
65 26 09
B The diagonal of a square with side of length 1
75 11 14
C Result of dividing 22 by 7 66 06 28
Canadian future teachers had some difficulty identifying the characteristics of irrational numbers Only 28 of respondents knew that dividing 22 by 7 never results in an irrational number possibly confusing this fraction with π which is irrational
45
Example 3
Label MFC704Item type Constructed responseDimension Mathematics Content KnowledgeDomain GeometrySub-domain Applying
On the figure ABCD is a parallelogram ang BAD = 60˚ AM and BM are angle bisectors of angles BAD and ABC respectively If the perimeter of ABCD is 6 cm find the sides of triangle ABM
Write your answers on the lines below
AB = _______ cm
AM = _______ cm
BM = _______ cm
Scoring Guide
Code Response Item ID MFC704
Correct Response
20
Response indicates all three correct entries belowAB = 2 cmAM = radic3 cm or equivalentBM = 1 cm
Partially Correct Response
10 Response indicates any two correct entries and one incorrect (or blank) entry
11 Response indicates any one correct entry and two incorrect (or blank) entries
Incorrect Response
79 Incorrect mathematical statements or statements of no value (including crossed out erased illegible or off-task responses and stray marks)
No Response
99 Blank
This was a difficult question for Canadian future teachers with only 41 giving all three correct responses Another 14 had two correct responses and 8 had one correct response This means that 37 of respondents could not find any of the three measures of the triangle
D
A B
M C
46
Example 4
Label MFC705Item type Multiple choiceDimension Mathematics Content KnowledgeDomain GeometrySub-domain Knowing
We know that there is only one point on the real line that satisfies the equation 3x = 6 namely x = 2
Suppose now that we consider this same equation in the plane with coordinates x and y and then in space with coordinates x y and z What does the set of points that satisfy the equation 3x = 6 look like in these settings
Check one box in each row
One point One line One plane Other
A The solution to 3x = 6 in the plane 22 69 08 01
B The solution to 3x = 6 in space 14 09 71 07
This geometry question was moderately difficult for Canadian future teachers with about 70 of respondents knowing that the proposed solution would look like one line in the plane and one plane in space
- Table of Contents
- List of Figures
- What is TEDS-M 2008
- Research design and methodology for TEDS-M
- What is to be learned from TEDS-M
- What value will TEDS-M add to existing research on teacher education
- Target populations
- Components of TEDS-M
-
- Component 1 studies of teacher-education policies for elementary and lower-secondary mathematics teachers and their cultural and social contexts
- Component 2 studies of elementary and lower-secondary mathematics teacher-preparation routes programs standards and expectations for teacher learning
- Component 3 studies of the mathematics and related teaching knowledge of future elementary and lower-secondary school teachers
-
- Participating countries in TEDS-M
- The Canadian administration
- Structure and organization of teacher education in Canada
- Programs in specific jurisdictions
-
- Ontario
- Quebec
- Nova Scotia
- Newfoundland and Labrador
-
- The administration of the TEDS-M survey in Canada
-
- Representation at international meetings
- Adaptation translation and approval of assessment and questionnaire materials
-
- Sampling institutions
-
- Contacting institutions and sending and collecting materials
- Quality monitoring
- Coding
-
- Description of teacher-education courses and collection and coding of syllabi
- Coding of mathematics content knowledge and mathematics pedagogical content knowledge
-
- Results
-
- Institutional Program Questionnaire
- Survey for Mathematics Mathematics Pedagogy and General Pedagogy Educators
- Survey for Future Teachers of Lower-Secondary Mathematics
- Survey for Future Teachers of Primary Elementary Mathematics
-
- Conclusion
- References
- Figures
-
- Figure 1enspMean scores and confidence intervals for participating countriesmdashElementary-level future teachers mathematics content knowledge
- Figure 2enspMean scores and confidence intervals for participating countriesmdashElementary-level future teachers pedagogy content knowledge
- Figure 3enspMean scores and confidence intervals for participating countriesmdashLower-secondary-level future teachers mathematics content knowledge
- Figure 4enspMean scores and confidence intervals for participating countriesmdashLower-secondary-level future teachers pedagogy content knowledge
- Figure 5enspMean scores and confidence intervals by gender primary mathematics knowledge
- Figure 6enspMean scores and confidence intervals by gender primary pedagogical knowledge
- Figure 7enspMean scores and confidence intervals by gender lower-secondary mathematics knowledge
- Figure 8enspMean scores and confidence intervals by gender lower-secondary mathematics knowledge
-
- Appendices
-
- APPENDIX I
-
- Sample Syllabus Coding
-
- APPENDIX II
-
- Examples of assessment items in the Primary General Pedagogy Knowledge for Teaching section of the Future Teacher Questionnaire
- Examples of assessment items in the Secondary General Pedagogy Knowledge for Teaching section of the Future Teacher Questionnaire
-
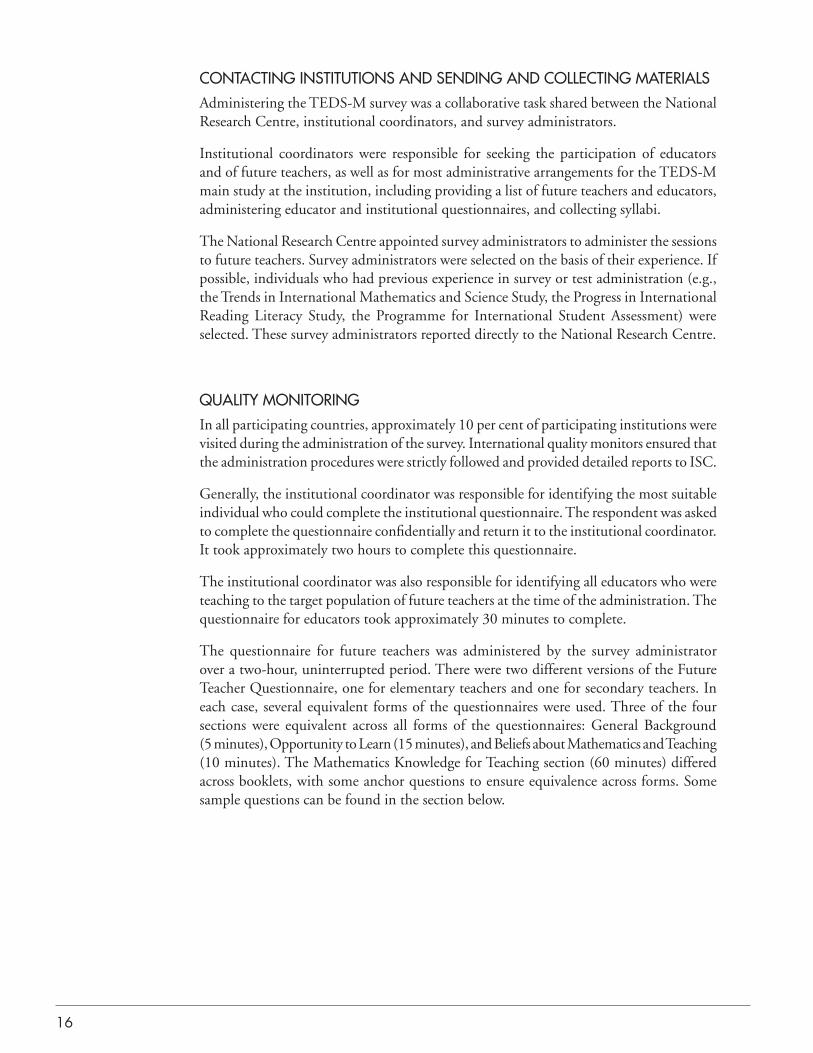

20
bull Oftheseeducators27hadadegreeineducation14inmathematicseducationand 10 in mathematics at the doctoral level or higher These figures should be interpreted with caution As stated above a large number of respondents to the survey were likely to be sessional appointees
bull Fifty-twopercentofrespondentsheldateachingcertificateatthetimeofthestudy one-third has never held a teaching certificate
bull Onaveragetheseeducatorshavespentapproximately10yearsattheircurrentinstitutions and about seven years in their teacher-preparation role They teach mostly at the undergraduate level (93) but also at the masterrsquos level (48) and in some cases at the doctoral level (18) In terms of experience 30 have been involved in instructing or supervising future teachers for over 10 years but 37 have done this for three years or less suggesting the existence of a cadre of educators with relatively little experience at least when considering the general profile of the respondents
bull Overthepast12monthsmorethanhalfoftheseeducatorshavenotparticipatedin any professional-development activities related to mathematics or mathematics pedagogyHoweverover60hadparticipatedinatleastsixhoursofprofessionaldevelopment in general pedagogy
bull In thepastyear respondentshavespentabout30of theirworkingtimeonresearch and research-related activities
bull Whenaskedtoconsiderallcoursesintheteacher-educationprogramsofferedattheir institutions about 80 of these educators felt that each stage seemed to be planned to meet the main needs of future teachers at each stage of their preparation and that the programs were organized in a way that covered what future teachers needed tobecomeeffective teachersHowever30disagreed that therewereclear links between most of the courses in the program of study
bull When asked to describe future teachersrsquo level of preparedness for teachingmathematics as they complete the teacher-education program and start their teaching careers 80 or more of these educators felt that future teachers were prepared to a moderate or major extent to clearly communicate ideas and information about mathematics to students that they could establish appropriate learning goals in mathematics for students and that they could set up mathematics learning activities to help students achieve learning goals Conversely over a third of these educators felt that future teachers were not at all or just to a minor extent prepared to use computers and information and communication technology (ICT) to aid in teaching mathematics and to provide parents with useful information about studentsrsquo progress in mathematics Further research would be useful to compare the views of teachers principals and faculties regarding the level of preparedness in using ICT to teach mathematics
bull Finally almost 80 of educators felt that their pre-service teacher-educationprograms were effective or very effective in preparing future teachers of mathematics
21
survey for future teachers of lower-secondary mathematicsOverall 282 questionnaires were distributed to future teachers at the secondary level and 155 were completed
bull Themedianageofrespondentswas24yearsand61werefemalesAbout86of respondents always or almost always spoke the language of the questionnaire at home Eighty-three per cent had taken a calculus or pre-calculus course in high school When comparing themselves to other students at the same grade level in their schools 82 saw themselves as being at the top or near the top of their class in terms of marks
bull Whenaskedtoidentifythemainreasonswhytheydecidedtobecometeachersthese future teachers at the secondary level mentioned their perception of teaching as a challenging job their desire to have an influence on the next generation their desire to work with young people their belief that they have a talent for teaching and their love of mathematics as the most significant reasons For the most part they were not influenced by teacher salaries the availability of teaching positions or the fact that they had always been good students in school
bull Almosthalf(47)ofthesefutureteacherssaidthatneedingtoborrowmoneyhindered their studies during their teacher-preparation programs
bull Almostallfutureteachersatthesecondarylevel(95)thoughtthattheywouldor could possibly spend their entire career as a teacher
bull Theserespondentswereaskedtoconsideranumberofmathematicstopicsandtoindicate which ones they had or had never studied Over 80 stated that they had studied calculus linear algebra probability and theoretical or applied statistics Fifty per cent or more stated that they had never studied topology differential geometry theory of real or complex functions or functional analysis or abstract algebra In the context of their teacher-education programs more than half also said that they had not studied validation structuring and abstracting or calculus In terms of emphasis three-quarters said that in their programs they studied mathematics at the level of the school curriculum
bull Intermsofmathematicspedagogyover80saidthattheirprogramscoveredmathematics instruction mathematics standards and curriculum and the development of teaching plans Their programs allowed them to engage in the following activities most often accommodating a wide range of abilities in each lesson exploring how to use manipulatives and creating learning experiences that make central concepts under study meaningful to students The activities that were mentioned the least often were using standardized tests to guide decisions about what and how to teach using assessment to give feedback to parents or guardians and helping students learn how to assess their own learning
bull Whenlookingateducationandpedagogytopicsoverathirdofthesecondary-levelfuture teachers said that they had not studied methods of educational research or the history of education and educational systems
22
bull Withregardtotheirpracticaover60agreedthatthefeedbacktheyreceivedfromtheir mentors helped them to improve their teaching methods that this feedback helped them to improve their understanding of their students and that they had a clear understanding of what their mentors expected of them as teachers in order to pass the practica
bull Regardingtheperceivedoveralleffectivenessoftheirpre-serviceteacher-educationprograms almost a quarter of these future teachers at the secondary level felt that the programs were not effective in preparing them to teach mathematics
survey for future teachers of elementary mathematicsOverall 580 questionnaires were distributed to future teachers at the elementary level and 183 were completed Although the number of respondents is quite substantial the response rate is below the international standard therefore any generalization to the population of future elementary teachers should be made with extreme caution
bull Eighty-sevenpercentofrespondentsofthisquestionnairewerefemaleThismaybe slightly higher than the overall population of elementary teachers Based on the Progress in International Reading Literacy Study (2006) data in which five provinces participated the figures would vary between 72 and 86 for female teachersattheelementarylevelUnfortunatelynoofficialdataareavailableatthepan-Canadian level for this aspect
bull About95alwaysoralmostalwaysspokethelanguageofthequestionnaireathome Only 40 had taken a calculus or pre-calculus course in high school which is much lower than for future teachers at the lower-secondary level When comparing themselves to other students at the same grade level in their schools about half of the respondents saw themselves as being at the top or near the top of their class in terms of marks again a much lower percentage than for the lower-secondary level
bull Whenaskedtoidentifythemainreasonswhytheydecidedtobecometeachersthese future teachers at the elementary level had very similar response patterns to those at the lower-secondary level They mentioned their talent for teaching their perception of teaching as a challenging job and their desire to work with young people and to have an influence on the next generation as the most significant reasons For the most part they were not influenced by teacher salaries the availability of teaching positions or their love of mathematics (which is logical since elementary-level teachers are normally generalists)
bull Theserespondentswereaskedtoconsideranumberofmathematicstopicsandtoindicate which ones they had or had never studied As can be expected the vast majority had not studied many advanced topics in mathematics with over 90 not having studied advanced calculus abstract or linear algebra or theory of real or complex functions or functional analysis In fact the only advanced topics
23
studied by more than half of these respondents were probability and number theory In the context of their teacher-education programs over 85 said that they had not studied calculus validation or structuring and abstracting In terms of emphasis almost 90 said that in their programs they studied mathematics at the level of the school curriculum and 63 said that their learning was at a deeper or more conceptual level than that of the school curriculum
bull Intermsofmathematicspedagogyover80saidthattheirprogramscoveredmathematics instruction mathematics standards and curriculum and mathematics teaching per se Their programs allowed them to engage in the following activities most often exploring how to use manipulatives creating learning experiences that make central concepts under study meaningful to students locating suitable curriculum materials and teaching resources and developing games or puzzles accommodating a wide range of abilities in each lesson and building on studentsrsquo existing mathematics knowledge and thinking skills The activities that were mentioned the least often were using standardized tests to guide decisions about what and how to teach using assessment to give feedback to parents or guardians and helping students learn how to assess their own learning (similar to lower-secondary respondents)
bull Whenlookingateducationandpedagogytopicsoverathirdoftheelementary-level future teachers said that they had not studied methods of educational research or the history of education and educational systems
bull Withregardtotheirpracticaaswasthecaseforthelower-secondarylevelover60 agreed that they had a clear understanding of what their mentors expected of them as teachers in order to pass the practica that the feedback they received from their mentors helped them to improve their teaching methods and that this feedback helped them to improve their understanding of their students A large proportion of these respondents also felt that their mentors valued the ideas and approaches they brought from their teacher-education programs
bull Regardingtheperceivedoveralleffectivenessoftheirpre-serviceteacher-educationprograms elementary-level future teachers were generally more pleased than secondary-level future teachers with their programs in preparing them to teach mathematics
An important contribution of TEDS-M is the assessment of participating future teachers with regard to their knowledge of mathematics of mathematics pedagogy and of general pedagogy The design of TEDS-M lends itself to the ranking of countries according to theirmeanscoresonthesethreeareasHoweverinternationalcomparisonsbasedontheserankings are not desirable because these mean scores are relatively unstable due to the small number of respondents in several participating countries Moreover since Canada did not meet the sampling requirements the Canadian data must be treated with extreme caution For the same reason no results are provided by province although ministries and departments of education have access to their own data in order to analyze their results according to their own contexts
24
What may be most useful in the Canadian context is to look at countries that tend to perform better on this knowledge component and to analyze their contextual factors which may help to explain their results Furthermore it should be kept in mind that teacher-education programs in Canada are far from homogeneous mdash even within a province mdash and that it may be more useful to analyze the contextual factors in each province taking into account the limitations of the study
Results are presented separately for teachers at the elementary level and teachers at the lower-secondary level and are broken down for mathematics content knowledge and mathematics pedagogical content knowledge Results are scaled with an international mean of 500 and a standard deviation of 100
Figure 1 Mean scores and confidence intervals for participating countriesmdash Elementary-level future teachersrsquo mathematics content knowledge
Note The Canadian average score is not part of the international average score due to Canadas low response rates
Poland (490)
Malaysia (488)
Spain (481)
Canada (522)
Georgia (345)
Chile (413)
Botswana (441)
Philippines (440)
International (500)
Germany (510)
Thailand (528)
Norway (519)
United States (518)
Russian Federation (535)
Singapore (590)
Switzerland (543)
Chinese Taipei (623)
Below the international average
At the international average
Above the international average
330 350 370 390 410 430 450 470 490 510 530 550 570 590 610 630
95 Confidence interval
Estimated mean score
25
Figure 2 Mean scores and confidence intervals for participating countriesmdash Elementary-level future teachersrsquo pedagogy content knowledge
Note The Canadian average score is not part of the international average score due to Canadas low response rates
Among the other 15 countries participating in the study elementary-level future teachers from Chinese Taipei and from Singapore outperformed those from other countries in both mathematics content knowledge and mathematics pedagogical content knowledge Another groupofcountriescomprisingSwitzerlandNorwayandtheUnitedStateshadresultsabove the international average in both mathematics and pedagogical content knowledge as did Canada A group of six countries (Georgia Chile the Philippines Botswana Spain and Poland) performed below the international average in both components
International (500)
Spain (492)
Poland (478)
Canada (541)
Georgia (345)
Chile (425)
Philippines (457)
Botswana (448)
Germany (502)
Malaysia (503)
Switzerland (537)
Russian Federation (512)
Thailand (506)
United States (544)
Chinese Taipei (592)
Norway (545)
Singapore (593)
Below the international average
At the international average
Above the international average
330 350 370 390 410 430 450 470 490 510 530 550 570 590 610 630
95 Confidence interval
Estimated mean score
26
Figure 3 Mean scores and confidence intervals for participating countriesmdash Lower-secondary-level future teachersrsquo mathematics content knowledge
Note The Canadian average score is not part of the international average score due to Canadas low response rates
Thailand (479)
Oman (472)
Norway (444)
Canada (516)
Chile (354)
Georgia (424)
Philippines (442)
Botswana (441)
Malaysia (493)
International (500)
Switzerland (531)
Germany (519)
United States (505)
Poland (540)
Russian Federation (594)
Singapore (570)
Chinese Taipei (667)
Below the international average
At the international average
Above the international average
340 360 380 400 420 440 460 480 500 520 540 560 580 600 620 640 660 680
95 Confidence interval
Estimated mean score
27
Figure 4 Mean scores and confidence intervals for participating countriesmdash Lower-secondary-level future teachersrsquo pedagogy content knowledge
Note The Canadian average score is not part of the international average score due to Canadas low response rates
The results are quite similar at the lower-secondary level however future teachers from Chinese Taipei significantly outperformed all other countries in both mathematics and pedagogical content knowledge This is not surprising considering that on the PISA 2006 mathematics assessment 15-year-old students from Chinese Taipei outperformed students from all other countries Interestingly future teachers from the Russian Federation had a much stronger performance in both aspects at the lower-secondary level compared to the elementary level This also holds true for German future teachers although to a lesser extent Conversely future teachers from Norway performed below the international average at the lower-secondary level even though they performed above the international average at the elementary level
Keeping in mind the serious data limitations for Canada it is worth noting that our future teachers performed above the international average in both mathematics and pedagogical content knowledge at both the elementary and lower-secondary levels
Oman (474)
Malaysia (472)
Norway (463)
Canada (513)
Chile (394)
Botswana (425)
Philippines (450)
Georgia (443)
Thailand (476)
International (500)
Germany (540)
Poland (524)
United States (502)
Switzerland (549)
Russian Federation (566)
Singapore (553)
Chinese Taipei (649)
Below the international average
At the international average
Above the international average
380 400 420 440 460 480 500 520 540 560 580 600 620 640 660 680
95 Confidence interval
Estimated mean score
28
Figure 5 Mean scores and confidence intervals by gender primary mathematics knowledge
Figure 6 Mean scores and confidence intervals by gender primary pedagogical knowledge
Among Canadian future teachers at the elementary level there was no statistical difference between their mathematics and pedagogical content knowledge Although the mean score for female future teachers was higher than that for males in pedagogical content knowledge the difference was not statistically significant Of note is the large imbalance intheproportionofmaleteachersinthesample(1in7)Howeverthisisafairlyaccuratereflection of the situation in the population which sees about 80 of teachers in elementary schools in Canada being female (Mullis et al 2007)
524
521Female
Male
400 450 500 550 600
528
543Female
Male
400 450 500 550 600
29
Figure 7 Mean scores and confidence intervals by gender lower-secondary mathematics knowledge
Figure 8 Mean scores and confidence intervals by gender lower-secondary pedagogical knowledge
At the lower-secondary level male future teachers had higher mean scores in both mathematics and pedagogical content knowledge than did females but the differences were not statistically significant The gender imbalance in the sample was not as pronounced at this level as at the elementary level (three female future teachers for every two males at the lower-secondary level) Overall in Canada this is a fair reflection of the situation at the lower-secondary level which sees approximately 70 of teachers being female2
527
509Female
Male
400 450 500 550 600
526
505Female
Male
400 450 500 550 600
2 According to the Pan-Canadian Assessment Program 2007 across all provinces and territories between 50 and 87 of teachers of 13-year-olds are females
30
ConclusionTEDS-M is a comparative study of teacher education with a focus on the preparation of mathematics teachers at the elementary and lower-secondary levels As the first attempt to systematically investigate both the knowledge and skills of future teachers in an international setting the study faced significant challenges in several countries In Canada given the structure of our education systems provinces and territories individually determined whether they wished to be involved in such an endeavour Four provinces (Ontario Quebec Nova Scotia and Newfoundland and Labrador) elected to participate and in each province the participation of individual institutions individual educators and individual future teachers was completely voluntary The very low response rates obtained in Canada and the ensuing non-inclusion in the international data set are indeed disappointing mdash but also very informative mdash should such an initiative be repeated in the future Conducting such an ambitious assessment project is possible but would require engaging all parties early on and throughout the implementation of the project
We are grateful to the ministriesdepartments of education institutions faculties of education educators and future teachers who did participate in this TEDS-M 2008 assessment project It is hoped that the project will yield useful information to guide teacher education in the future
Keeping in mind the serious limitations of the data gathered from TEDS-M there are a few conclusions from the study that may help elicit further discussion among policy-makers and educators
bull IngeneralCanadianinstitutionsdonotseemtohaveverystrongrequirementsin mathematics for individuals wishing to enter into teacher-education programs Other than assessments to meet the requirements for a course in mathematics or in mathematics education there is no formal test of the mathematical knowledge or skills of future teachers at the completion of their program of study
bull Mosteducatorsofmathematicsorofmathematicspedagogyforfutureteachersin Canadian universities are specialized in areas other than mathematics and few hold a doctorate in the discipline At the international level about one-quarter of educators who participated in the TEDS-M study held a doctorate in mathematics with a higher proportion in higher-performing countries In Canada 10 per cent of participating educators held a doctorate in mathematics
bull WithregardtoknowledgeofmathematicsandofmathematicspedagogyCanadianfuture teachers at the elementary and lower-secondary levels performed above the international average Although Canadian 15-year-olds have performed among the top-ranking countries in mathematics since the inception of PISA in 2000 it appears that there is potential for further improvement by possibly providing future teachers at the elementary level with more advanced training in mathematics that covers elements beyond the school curriculum and by providing future teachers at the lower-secondary level with more advanced training in testing- and assessment-related topics
31
ReferencesAtlantic Evaluation and Research Consultants (2007) Kndash12 mathematics curriculum review Final report Retrieved from httpwwwedgovnlcaedupublicationsk12NLMathReportpdf
Bloumlmeke S Kaiser G amp Lehmann R (Eds) (2010) TEDS-M 2008 Professional Competences and Opportunities to Learn of Future Mathematics Teachers at Lower-Secondary Schools in the International Context Muumlnster Waxmann
Bloumlmeke S Kaiser G amp Lehmann R (Eds) (2010) TEDS-M 2008 Professional Competences and Opportunities to Learn of Future Primary Teachers in the International Context Muumlnster Waxmann
Carnoy M Beteille T Brodziak I Loyalka P amp Luschei T (2009) Do countries paying teachers higher relative salaries have higher student mathematics achievement Palo Alto CA StanfordUniversityRetrievedfromhttpstedseducmsueduTEDS_CostsStudyzip
Council of Ministers of Education Canada (2009) PCAP-13 2007 Contextual Report on Student Achievement in Reading Toronto Author
Crocker R amp Dibbon D (2008) Teacher education in Canada a baseline study Kelowna BC Society for the Advancement of Excellence in Education
Dibbon D amp Sheppard B (2001) Teacher demand supply and retention in Newfoundland and LabradorMemorialUniversityofNewfoundlandRetrievedfromhttpwwwmuncaeducpeoplefacultyddibbonpdfFinal20reportchapter1-Introductionpdf
Feng-JuiHTing-YingWChia-JuiHShu-JyhTGuohengCChiu-KeungLet al (2010) A milestone of an international study in Taiwan teacher education National Research Center of Taiwan Teacher Education and Development Study in Mathematics in Taiwan
Ministegravere de lrsquoEacuteducation du Queacutebec (2004) Surplus ou peacutenurie de personnel enseignant qualifieacute au Queacutebec situation actuelle et perspectives agrave court et moyen terme pour le secteur francophone Retrieved from httpwwwmelsgouvqccadftpsinterieurpdfpers_emploi_prevision_nov04pdf
Mullis IVS Martin MO Kennedy AM amp Foy P (2007) PIRLS 2006 International ReportChestnutHillMABostonCollege
Mullis I Martin M Ruddock G OrsquoSullivan C Arora A amp Erberber E (2005) TIMSS 2007 assessment frameworks International Association for the Evaluation of Educational Achievement Retrieved from httptimssbceduTIMSS2007PDFT07_AFpdf
Nova Scotia Department of Education (2007) Nova Scotia public education teacher supply and demand Retrieved from httpwwwednetnscapdfdocsreportsteacher_supply_and_demand_reportpdf
32
Nova Scotia Department of Education (2008) Report and recommendations of the review panel on teacher education in Nova Scotia Retrieved from httpwwwednetnscaeventsteacher_education_reviewdocumentsreview_panel_report_web_epdf
Ontario College of Teachers (2001) Teacher supply and demand Report on the consultation Retrieved from httpwwwoctcapublicationspdftsd_epdf
Ontario College of Teachers (2007) State of the teaching profession 2007 Annual Ontario College of Teachers survey of teachers Retrieved from httpwwwoctcapublicationsPDFsurvey07_epdf
Ontario College of Teachers (2009) Transition to teaching 2009 Retrieved from httpwwwoctcapublicationsPDFtransitions09_epdf
Statistics Canada (2008) CANSIM Table 477-0014 mdash University degrees diplomas and certificates granted by program level Classification of Instructional Programs Primary Grouping (CIP_PG) and sex annual (number) Retrieved from httpdc2chassutorontoca
Tatto MT Ingvarson L Schwille J Peck R Senk SL amp Rowley G (2008) Teacher Education and Development Study in Mathematics (TEDS-M) Policy practice and readiness to teach primary and secondary mathematics Conceptual framework East Lansing MITEDS-MInternationalStudyCenteratMichiganStateUniversityRetrievedfromhttpstedseducmsueduTEDS_FrameworkFinalzip
33
APPENDIX I
sample syllabus Coding
math 250 probability and statistics for elementary middle-school teachers
Instructor Dr KP Lee Office 456HonorsTower
Phone 789-0123 E-mail kpleestandarduedu
Office hours 350ndash450 pm on Mondays and by appointment
COurse prereQuisitesCompletion of Math 125 or equivalent with a C grade or higher Those not meeting the course prerequisites will be automatically dropped from the course by the Department of Mathematics
COurse materialsText Probability and Statistics for ElementaryMiddle-School Teachers
A TI-73 graphing calculator (other models such as the TI-83 and TI-86 will not have the features needed for this course and will not be sufficient)
COurse Overview anD ObjeCtivesThis course is designed to provide pre-service elementary and middle-school teachers with
[laboratory-based experiences designed to teach and reinforce basic statistics and probability concepts often situated in the core tasks of teaching including the examination and critiquing of the statistical thinking and arguments of others]
[opportunities to demonstrate their understanding of statistics and probability concepts in meaningful constructive and alternative ways]
[activities involving the use of calculator technology (this course is usedtosatisfypartoftheUniversityComputerUsagerequirementfor students in elementary teacher education)]
[experiences that model techniques for use in their future elementarymiddle-school classrooms]
U1 T24
B1 T2117331332
B2 T2
117
B3 T2
117355356
34
[The majority of class time will be devoted to small-group exploration and class discussion with an emphasis on reasoning and communication of statistics and probability ideas rather than on rote memorization Students will be expected to demonstrate that they are prepared for class each day by bringing course materials and completed homework assignments Students will be asked to work cooperatively in groups and participate in whole-class discussions Studentsrsquo consistent engagement in these activities will be reflected in their participation grade]
Codes Used in this Excerpt
U1 Sequentialunitnumberofthecodeddocument
T2 An objective of the course
T24 A course that covers specialized mathematics knowledge needed for teaching mathematics
B1 B2 B3 and B4 Each block of information being coded
117 Mathematics block on data representation probability and statistics
331 Mathematics education block on developing mathematical concepts
332 Mathematics education block on reasoning argumentation and proving
355 Mathematics instruction block on using calculators
356 Mathematics instruction block on using computers
117
B4 T2
35
APPENDIX II
examples of assessment items in the primary general pedagogy Knowledge for teaching section of the future teacher Questionnaire
Example 1
Label MFC106Item type Multiple choiceDimension Mathematics Content KnowledgeDomain DataSub-domain Applying
Two fair six-sided number cubes are thrown in a probability game and the two numbers at the top are recorded
Josie wins if the difference between the two numbers is 0 1 or 2 Farid wins if the difference between the two numbers is 3 4 or 5
The students discuss whether the game is fair
Which of the following statements is correct
Check one box
A Both have an equal chance of winning
33
B Josie has the greater chance of winning
50
C Farid has the greater chance of winning
12
D As the game involves number cubes itrsquos not possible to say who has the greater chance of winning
05
For this probability question only half of the future teachers responded correctly that Josie had a greater chance of winning One-third of the respondents were incorrectly drawn to the first option thinking that both Josie and Farid had an equal chance of winning
36
Example 2
Label MFC108Item type Multiple choiceDimension Mathematics Pedagogical Content KnowledgeDomain AlgebraSub-domain Enacting
Amy is building a sequence of geometric figures with toothpicks by following the pattern shown below Each new figure has one extra triangle
Variable t denotes the position of a figure in the sequence
In finding a mathematical description of the pattern Amy explains her thinking by saying I use three sticks for each triangle
Then I see that I am counting one stick twice for each triangle except the last one so I have to remove those
Variable n represents the total number of toothpicks used in a figure
Which of the equations below best represent Amyrsquos statement in algebraic notation
Check one box
A n = 2t + 1 29
B n = 2(t + 1) ndash 1
26
C n = 3t ndash (t ndash1)
36
D n = 3t + 1 ndash t
08
This question was difficult for Canadian future teachers with almost two-thirds of the respondents unable to identify the correct algebraic notation for this pattern
t = 1 t = 2 t = 3
hellip
37
Example 3
Label MFC202Item type Multiple choiceDimension Mathematics Content KnowledgeDomain AlgebraSub-domain Knowing
Indicate whether each of the following statements is true for the set of all whole numbers a b and c greater than zero
Check one box in each row
True Not True
A a ndash b = b ndash a
16
84
B a divide b = b divide a
06
95
C (a + b) + c = a + (b + c)
93
07
D (a ndash b) ndash c = a ndash (b ndash c)
23
77
ThisalgebraquestionwasrelativelyeasyforCanadianfutureteachersHoweveralmostone-quarter of the respondents did not know that the fourth statement was not true even though the question appeared to be relatively easy to solve with whole numbers
38
Example 4
Label MFC203Item type Multiple choiceDimension Mathematics Content Knowledge Domain GeometrySub-domain Applying
A rectangular-shaped swimming pool has a paved walkway (shaded) around it as shown
What is the area of the walkway
Check one box
A 100 m2
04
B 161 m2
06
C 710 m2
78
D 1610 m2
12
This question was relatively easy for Canadian respondents with 78 getting the correctanswerHowever12calculatedtheentireareabutfailedtosubtractthearea of the swimming pool
70 m
50 m
18 m 23 mPool
not to scale
Walkway
39
Example 5
Label MFC206Item type Constructed responseDimension Mathematics Content Knowledge Domain NumberSub-domains Applying Planning
a) Amachineuses24litresoffuelforevery30hoursofoperationHowmanylitresoffuel will the machine use in 100 hours if it continues to use fuel at the same rate
Check one box
A 72
11
B 80
79
C 84
08
D 96
02
This question was relatively easy for Canadian respondents with almost 80 getting thecorrectresponseHoweveroneinfiverespondentsdidmakeacalculationerrorwhen solving this simple problem
b) Create a different problem of the same type as the problem in (a) (same processesoperations) that is EASIER for primary children to solve
40
Scoring Guide
Code Response Item MFC206B
Correct Response
10
A different problem of the same type (same processesoperations) but easier to solveExamples
bull Amachineuses3litresoffuelforevery30hoursofoperationHowmanylitres of fuel will the machine use in 100 hours
bull Acaruses24litresoffuelforevery50kmHowmanylitresoffuelwillthe car use in 100 km
Incorrect Response
70
A different problem of the same type (same processesoperations) but NOT easier to solve (Note Items judged to be of the same level of difficulty are NOT easier)Examples
bull Amachineuses2litresoffuelforevery30hoursofoperationHowmanylitres of fuel will the machine use in 100 hours (2 is not divisible by 3)
bull Atapdrips2litresofwatereverydayHowmanymlisthispersecond(The metric knowledge required and the computational load are significantly higher)
79
Other incorrect response (including crossed out erased illegible or off-task responses and stray marks)Examples
bull questionsthatarenotmeaningfulorhavenoanswer
No Response
99 Blank
About 84 of Canadian future teachers were able to create a problem of the same type but that was easier to solve Nine per cent of respondents created a similar problem but that was not easier to solve
41
examples of assessment items in the secondary general pedagogy Knowledge for teaching section of the future teacher Questionnaire
Example 1
Label MFC604Item type Constructed responseDimension Mathematics Content KnowledgeDomain AlgebraSub-doman Applying
The following problems appear in a mathematics textbook for lower secondary schools
1 Peter David and James play a game with marbles They have 198 marbles altogether Peter has 6 times as many marbles as David and James has 2 times as many marbles asDavidHowmanymarblesdoeseachboyhave
2 Three children Wendy Joyce and Gabriela have 198 zeds altogether Wendy has 6timesasmuchmoneyasJoyceand3timesasmuchasGabrielaHowmanyzedsdoes each child have
(a) Solve each problem
Solution to Problem 1
Solution to Problem 2
42
Scoring Guide
Note The correct answers to MFC604A1 and MFC604A2 are as follows
Problem 1 David has 22 marbles Peter has 132 marbles and James has 44 marbles
Problem 2 Wendy has 132 zeds Joyce has 22 zeds and Gabriela has 44 zeds
The following methods are considered in the scoring guide
1) Usingone variable setting up one equation and solving
Example (Problem 1) Let m = the number of marbles that David has Then Peter has 6m and James has 2m Therefore 6m + 2m + m = 198 and m = 22
2) Usingmore than one variable establishing a system of equations performing substitutions and solving
Example (Problem 1) Let p = the number of marbles that Peter has d = the number of marbles that David has and j = the number of marbles that James has Therefore p = 6d and j = 2d p + d + j = 198
3) Trial and error or guess and check
4) Ratio or other arithmetic methods
5) Representationdiagram
Code Response Item ID MFC604A1
Correct Response
11 Response uses Method 1 correctly to solve Problem 1 and get the correct answers
12 Response uses Method 2 correctly to solve Problem 1 and get the correct answers
13 Response uses Method 3 correctly to solve Problem 1 and get the correct answers
14 Response uses Method 4 correctly to solve Problem 1 and get the correct answers
15 Response uses Method 5 correctly to solve Problem 1 and get the correct answers
19Response uses a correct but different method from those listed above to solve Problem 1 and get the correct answers
Incorrect Response
70Response uses one of Methods 1 to 5 to solve Problem 1 but arrives at an incorrect answer or cannot complete the solution because of a computation or algebra error
71Response uses a correct but different method from those listed above to solve Problem 1 but arrives at an incorrect answer or cannot complete the solution because of a computation or algebra error
79 Other incorrect response (including crossed out erased illegible or off-task responses and stray marks)
No Response
99 Blank
43
Code Response Item ID MFC604A2
Correct Response
11 Response uses Method 1 to solve Problem 2
12 Response uses Method 2 to solve Problem 2
13 Response uses Method 3 to solve Problem 2
14 Response uses Method 4 to solve Problem 2
15 Response uses Method 5 to solve Problem 2
19Response uses a correct but different method from those listed above to solve Problem 2 and get the correct answers
Incorrect Response
70Response uses one of Methods 1 to 5 to solve Problem 2 but arrives at an incorrect answer or cannot complete the solution because of a computation or algebra error
71Response uses a correct but different method from those listed above to solve Problem 2 but arrives at an incorrect answer or cannot complete the solution because of a computation or algebra error
79 Other incorrect response (including crossed out erased illegible or off-task responses and stray marks)
No Response
99 Blank
Overall Problem 1 was easy to solve for Canadian future teachers with 85 getting the correct response The majority of respondents (53) used Method 1 to solve Problem 1 and 29 used Method 2 Problem 2 was of medium difficulty for Canadian future teachers with 65 getting a right answer Sixteen per cent of future teachers used one of the five methods listed to solve Problem 2 but made a computation or algebra error (code 70)
44
Example 2
Label MFC610Item type Multiple choiceDimension Mathematics Content KnowledgeDomain NumberSub-domain Knowing
Determine whether each of the following is an irrational number always sometimes or never
Check one box in each row
Always Sometimes Never
A The result of dividing the circumference of a circle by its diameter
65 26 09
B The diagonal of a square with side of length 1
75 11 14
C Result of dividing 22 by 7 66 06 28
Canadian future teachers had some difficulty identifying the characteristics of irrational numbers Only 28 of respondents knew that dividing 22 by 7 never results in an irrational number possibly confusing this fraction with π which is irrational
45
Example 3
Label MFC704Item type Constructed responseDimension Mathematics Content KnowledgeDomain GeometrySub-domain Applying
On the figure ABCD is a parallelogram ang BAD = 60˚ AM and BM are angle bisectors of angles BAD and ABC respectively If the perimeter of ABCD is 6 cm find the sides of triangle ABM
Write your answers on the lines below
AB = _______ cm
AM = _______ cm
BM = _______ cm
Scoring Guide
Code Response Item ID MFC704
Correct Response
20
Response indicates all three correct entries belowAB = 2 cmAM = radic3 cm or equivalentBM = 1 cm
Partially Correct Response
10 Response indicates any two correct entries and one incorrect (or blank) entry
11 Response indicates any one correct entry and two incorrect (or blank) entries
Incorrect Response
79 Incorrect mathematical statements or statements of no value (including crossed out erased illegible or off-task responses and stray marks)
No Response
99 Blank
This was a difficult question for Canadian future teachers with only 41 giving all three correct responses Another 14 had two correct responses and 8 had one correct response This means that 37 of respondents could not find any of the three measures of the triangle
D
A B
M C
46
Example 4
Label MFC705Item type Multiple choiceDimension Mathematics Content KnowledgeDomain GeometrySub-domain Knowing
We know that there is only one point on the real line that satisfies the equation 3x = 6 namely x = 2
Suppose now that we consider this same equation in the plane with coordinates x and y and then in space with coordinates x y and z What does the set of points that satisfy the equation 3x = 6 look like in these settings
Check one box in each row
One point One line One plane Other
A The solution to 3x = 6 in the plane 22 69 08 01
B The solution to 3x = 6 in space 14 09 71 07
This geometry question was moderately difficult for Canadian future teachers with about 70 of respondents knowing that the proposed solution would look like one line in the plane and one plane in space
- Table of Contents
- List of Figures
- What is TEDS-M 2008
- Research design and methodology for TEDS-M
- What is to be learned from TEDS-M
- What value will TEDS-M add to existing research on teacher education
- Target populations
- Components of TEDS-M
-
- Component 1 studies of teacher-education policies for elementary and lower-secondary mathematics teachers and their cultural and social contexts
- Component 2 studies of elementary and lower-secondary mathematics teacher-preparation routes programs standards and expectations for teacher learning
- Component 3 studies of the mathematics and related teaching knowledge of future elementary and lower-secondary school teachers
-
- Participating countries in TEDS-M
- The Canadian administration
- Structure and organization of teacher education in Canada
- Programs in specific jurisdictions
-
- Ontario
- Quebec
- Nova Scotia
- Newfoundland and Labrador
-
- The administration of the TEDS-M survey in Canada
-
- Representation at international meetings
- Adaptation translation and approval of assessment and questionnaire materials
-
- Sampling institutions
-
- Contacting institutions and sending and collecting materials
- Quality monitoring
- Coding
-
- Description of teacher-education courses and collection and coding of syllabi
- Coding of mathematics content knowledge and mathematics pedagogical content knowledge
-
- Results
-
- Institutional Program Questionnaire
- Survey for Mathematics Mathematics Pedagogy and General Pedagogy Educators
- Survey for Future Teachers of Lower-Secondary Mathematics
- Survey for Future Teachers of Primary Elementary Mathematics
-
- Conclusion
- References
- Figures
-
- Figure 1enspMean scores and confidence intervals for participating countriesmdashElementary-level future teachers mathematics content knowledge
- Figure 2enspMean scores and confidence intervals for participating countriesmdashElementary-level future teachers pedagogy content knowledge
- Figure 3enspMean scores and confidence intervals for participating countriesmdashLower-secondary-level future teachers mathematics content knowledge
- Figure 4enspMean scores and confidence intervals for participating countriesmdashLower-secondary-level future teachers pedagogy content knowledge
- Figure 5enspMean scores and confidence intervals by gender primary mathematics knowledge
- Figure 6enspMean scores and confidence intervals by gender primary pedagogical knowledge
- Figure 7enspMean scores and confidence intervals by gender lower-secondary mathematics knowledge
- Figure 8enspMean scores and confidence intervals by gender lower-secondary mathematics knowledge
-
- Appendices
-
- APPENDIX I
-
- Sample Syllabus Coding
-
- APPENDIX II
-
- Examples of assessment items in the Primary General Pedagogy Knowledge for Teaching section of the Future Teacher Questionnaire
- Examples of assessment items in the Secondary General Pedagogy Knowledge for Teaching section of the Future Teacher Questionnaire
-

23
studied by more than half of these respondents were probability and number theory In the context of their teacher-education programs over 85 said that they had not studied calculus validation or structuring and abstracting In terms of emphasis almost 90 said that in their programs they studied mathematics at the level of the school curriculum and 63 said that their learning was at a deeper or more conceptual level than that of the school curriculum
bull Intermsofmathematicspedagogyover80saidthattheirprogramscoveredmathematics instruction mathematics standards and curriculum and mathematics teaching per se Their programs allowed them to engage in the following activities most often exploring how to use manipulatives creating learning experiences that make central concepts under study meaningful to students locating suitable curriculum materials and teaching resources and developing games or puzzles accommodating a wide range of abilities in each lesson and building on studentsrsquo existing mathematics knowledge and thinking skills The activities that were mentioned the least often were using standardized tests to guide decisions about what and how to teach using assessment to give feedback to parents or guardians and helping students learn how to assess their own learning (similar to lower-secondary respondents)
bull Whenlookingateducationandpedagogytopicsoverathirdoftheelementary-level future teachers said that they had not studied methods of educational research or the history of education and educational systems
bull Withregardtotheirpracticaaswasthecaseforthelower-secondarylevelover60 agreed that they had a clear understanding of what their mentors expected of them as teachers in order to pass the practica that the feedback they received from their mentors helped them to improve their teaching methods and that this feedback helped them to improve their understanding of their students A large proportion of these respondents also felt that their mentors valued the ideas and approaches they brought from their teacher-education programs
bull Regardingtheperceivedoveralleffectivenessoftheirpre-serviceteacher-educationprograms elementary-level future teachers were generally more pleased than secondary-level future teachers with their programs in preparing them to teach mathematics
An important contribution of TEDS-M is the assessment of participating future teachers with regard to their knowledge of mathematics of mathematics pedagogy and of general pedagogy The design of TEDS-M lends itself to the ranking of countries according to theirmeanscoresonthesethreeareasHoweverinternationalcomparisonsbasedontheserankings are not desirable because these mean scores are relatively unstable due to the small number of respondents in several participating countries Moreover since Canada did not meet the sampling requirements the Canadian data must be treated with extreme caution For the same reason no results are provided by province although ministries and departments of education have access to their own data in order to analyze their results according to their own contexts
24
What may be most useful in the Canadian context is to look at countries that tend to perform better on this knowledge component and to analyze their contextual factors which may help to explain their results Furthermore it should be kept in mind that teacher-education programs in Canada are far from homogeneous mdash even within a province mdash and that it may be more useful to analyze the contextual factors in each province taking into account the limitations of the study
Results are presented separately for teachers at the elementary level and teachers at the lower-secondary level and are broken down for mathematics content knowledge and mathematics pedagogical content knowledge Results are scaled with an international mean of 500 and a standard deviation of 100
Figure 1 Mean scores and confidence intervals for participating countriesmdash Elementary-level future teachersrsquo mathematics content knowledge
Note The Canadian average score is not part of the international average score due to Canadas low response rates
Poland (490)
Malaysia (488)
Spain (481)
Canada (522)
Georgia (345)
Chile (413)
Botswana (441)
Philippines (440)
International (500)
Germany (510)
Thailand (528)
Norway (519)
United States (518)
Russian Federation (535)
Singapore (590)
Switzerland (543)
Chinese Taipei (623)
Below the international average
At the international average
Above the international average
330 350 370 390 410 430 450 470 490 510 530 550 570 590 610 630
95 Confidence interval
Estimated mean score
25
Figure 2 Mean scores and confidence intervals for participating countriesmdash Elementary-level future teachersrsquo pedagogy content knowledge
Note The Canadian average score is not part of the international average score due to Canadas low response rates
Among the other 15 countries participating in the study elementary-level future teachers from Chinese Taipei and from Singapore outperformed those from other countries in both mathematics content knowledge and mathematics pedagogical content knowledge Another groupofcountriescomprisingSwitzerlandNorwayandtheUnitedStateshadresultsabove the international average in both mathematics and pedagogical content knowledge as did Canada A group of six countries (Georgia Chile the Philippines Botswana Spain and Poland) performed below the international average in both components
International (500)
Spain (492)
Poland (478)
Canada (541)
Georgia (345)
Chile (425)
Philippines (457)
Botswana (448)
Germany (502)
Malaysia (503)
Switzerland (537)
Russian Federation (512)
Thailand (506)
United States (544)
Chinese Taipei (592)
Norway (545)
Singapore (593)
Below the international average
At the international average
Above the international average
330 350 370 390 410 430 450 470 490 510 530 550 570 590 610 630
95 Confidence interval
Estimated mean score
26
Figure 3 Mean scores and confidence intervals for participating countriesmdash Lower-secondary-level future teachersrsquo mathematics content knowledge
Note The Canadian average score is not part of the international average score due to Canadas low response rates
Thailand (479)
Oman (472)
Norway (444)
Canada (516)
Chile (354)
Georgia (424)
Philippines (442)
Botswana (441)
Malaysia (493)
International (500)
Switzerland (531)
Germany (519)
United States (505)
Poland (540)
Russian Federation (594)
Singapore (570)
Chinese Taipei (667)
Below the international average
At the international average
Above the international average
340 360 380 400 420 440 460 480 500 520 540 560 580 600 620 640 660 680
95 Confidence interval
Estimated mean score
27
Figure 4 Mean scores and confidence intervals for participating countriesmdash Lower-secondary-level future teachersrsquo pedagogy content knowledge
Note The Canadian average score is not part of the international average score due to Canadas low response rates
The results are quite similar at the lower-secondary level however future teachers from Chinese Taipei significantly outperformed all other countries in both mathematics and pedagogical content knowledge This is not surprising considering that on the PISA 2006 mathematics assessment 15-year-old students from Chinese Taipei outperformed students from all other countries Interestingly future teachers from the Russian Federation had a much stronger performance in both aspects at the lower-secondary level compared to the elementary level This also holds true for German future teachers although to a lesser extent Conversely future teachers from Norway performed below the international average at the lower-secondary level even though they performed above the international average at the elementary level
Keeping in mind the serious data limitations for Canada it is worth noting that our future teachers performed above the international average in both mathematics and pedagogical content knowledge at both the elementary and lower-secondary levels
Oman (474)
Malaysia (472)
Norway (463)
Canada (513)
Chile (394)
Botswana (425)
Philippines (450)
Georgia (443)
Thailand (476)
International (500)
Germany (540)
Poland (524)
United States (502)
Switzerland (549)
Russian Federation (566)
Singapore (553)
Chinese Taipei (649)
Below the international average
At the international average
Above the international average
380 400 420 440 460 480 500 520 540 560 580 600 620 640 660 680
95 Confidence interval
Estimated mean score
28
Figure 5 Mean scores and confidence intervals by gender primary mathematics knowledge
Figure 6 Mean scores and confidence intervals by gender primary pedagogical knowledge
Among Canadian future teachers at the elementary level there was no statistical difference between their mathematics and pedagogical content knowledge Although the mean score for female future teachers was higher than that for males in pedagogical content knowledge the difference was not statistically significant Of note is the large imbalance intheproportionofmaleteachersinthesample(1in7)Howeverthisisafairlyaccuratereflection of the situation in the population which sees about 80 of teachers in elementary schools in Canada being female (Mullis et al 2007)
524
521Female
Male
400 450 500 550 600
528
543Female
Male
400 450 500 550 600
29
Figure 7 Mean scores and confidence intervals by gender lower-secondary mathematics knowledge
Figure 8 Mean scores and confidence intervals by gender lower-secondary pedagogical knowledge
At the lower-secondary level male future teachers had higher mean scores in both mathematics and pedagogical content knowledge than did females but the differences were not statistically significant The gender imbalance in the sample was not as pronounced at this level as at the elementary level (three female future teachers for every two males at the lower-secondary level) Overall in Canada this is a fair reflection of the situation at the lower-secondary level which sees approximately 70 of teachers being female2
527
509Female
Male
400 450 500 550 600
526
505Female
Male
400 450 500 550 600
2 According to the Pan-Canadian Assessment Program 2007 across all provinces and territories between 50 and 87 of teachers of 13-year-olds are females
30
ConclusionTEDS-M is a comparative study of teacher education with a focus on the preparation of mathematics teachers at the elementary and lower-secondary levels As the first attempt to systematically investigate both the knowledge and skills of future teachers in an international setting the study faced significant challenges in several countries In Canada given the structure of our education systems provinces and territories individually determined whether they wished to be involved in such an endeavour Four provinces (Ontario Quebec Nova Scotia and Newfoundland and Labrador) elected to participate and in each province the participation of individual institutions individual educators and individual future teachers was completely voluntary The very low response rates obtained in Canada and the ensuing non-inclusion in the international data set are indeed disappointing mdash but also very informative mdash should such an initiative be repeated in the future Conducting such an ambitious assessment project is possible but would require engaging all parties early on and throughout the implementation of the project
We are grateful to the ministriesdepartments of education institutions faculties of education educators and future teachers who did participate in this TEDS-M 2008 assessment project It is hoped that the project will yield useful information to guide teacher education in the future
Keeping in mind the serious limitations of the data gathered from TEDS-M there are a few conclusions from the study that may help elicit further discussion among policy-makers and educators
bull IngeneralCanadianinstitutionsdonotseemtohaveverystrongrequirementsin mathematics for individuals wishing to enter into teacher-education programs Other than assessments to meet the requirements for a course in mathematics or in mathematics education there is no formal test of the mathematical knowledge or skills of future teachers at the completion of their program of study
bull Mosteducatorsofmathematicsorofmathematicspedagogyforfutureteachersin Canadian universities are specialized in areas other than mathematics and few hold a doctorate in the discipline At the international level about one-quarter of educators who participated in the TEDS-M study held a doctorate in mathematics with a higher proportion in higher-performing countries In Canada 10 per cent of participating educators held a doctorate in mathematics
bull WithregardtoknowledgeofmathematicsandofmathematicspedagogyCanadianfuture teachers at the elementary and lower-secondary levels performed above the international average Although Canadian 15-year-olds have performed among the top-ranking countries in mathematics since the inception of PISA in 2000 it appears that there is potential for further improvement by possibly providing future teachers at the elementary level with more advanced training in mathematics that covers elements beyond the school curriculum and by providing future teachers at the lower-secondary level with more advanced training in testing- and assessment-related topics
31
ReferencesAtlantic Evaluation and Research Consultants (2007) Kndash12 mathematics curriculum review Final report Retrieved from httpwwwedgovnlcaedupublicationsk12NLMathReportpdf
Bloumlmeke S Kaiser G amp Lehmann R (Eds) (2010) TEDS-M 2008 Professional Competences and Opportunities to Learn of Future Mathematics Teachers at Lower-Secondary Schools in the International Context Muumlnster Waxmann
Bloumlmeke S Kaiser G amp Lehmann R (Eds) (2010) TEDS-M 2008 Professional Competences and Opportunities to Learn of Future Primary Teachers in the International Context Muumlnster Waxmann
Carnoy M Beteille T Brodziak I Loyalka P amp Luschei T (2009) Do countries paying teachers higher relative salaries have higher student mathematics achievement Palo Alto CA StanfordUniversityRetrievedfromhttpstedseducmsueduTEDS_CostsStudyzip
Council of Ministers of Education Canada (2009) PCAP-13 2007 Contextual Report on Student Achievement in Reading Toronto Author
Crocker R amp Dibbon D (2008) Teacher education in Canada a baseline study Kelowna BC Society for the Advancement of Excellence in Education
Dibbon D amp Sheppard B (2001) Teacher demand supply and retention in Newfoundland and LabradorMemorialUniversityofNewfoundlandRetrievedfromhttpwwwmuncaeducpeoplefacultyddibbonpdfFinal20reportchapter1-Introductionpdf
Feng-JuiHTing-YingWChia-JuiHShu-JyhTGuohengCChiu-KeungLet al (2010) A milestone of an international study in Taiwan teacher education National Research Center of Taiwan Teacher Education and Development Study in Mathematics in Taiwan
Ministegravere de lrsquoEacuteducation du Queacutebec (2004) Surplus ou peacutenurie de personnel enseignant qualifieacute au Queacutebec situation actuelle et perspectives agrave court et moyen terme pour le secteur francophone Retrieved from httpwwwmelsgouvqccadftpsinterieurpdfpers_emploi_prevision_nov04pdf
Mullis IVS Martin MO Kennedy AM amp Foy P (2007) PIRLS 2006 International ReportChestnutHillMABostonCollege
Mullis I Martin M Ruddock G OrsquoSullivan C Arora A amp Erberber E (2005) TIMSS 2007 assessment frameworks International Association for the Evaluation of Educational Achievement Retrieved from httptimssbceduTIMSS2007PDFT07_AFpdf
Nova Scotia Department of Education (2007) Nova Scotia public education teacher supply and demand Retrieved from httpwwwednetnscapdfdocsreportsteacher_supply_and_demand_reportpdf
32
Nova Scotia Department of Education (2008) Report and recommendations of the review panel on teacher education in Nova Scotia Retrieved from httpwwwednetnscaeventsteacher_education_reviewdocumentsreview_panel_report_web_epdf
Ontario College of Teachers (2001) Teacher supply and demand Report on the consultation Retrieved from httpwwwoctcapublicationspdftsd_epdf
Ontario College of Teachers (2007) State of the teaching profession 2007 Annual Ontario College of Teachers survey of teachers Retrieved from httpwwwoctcapublicationsPDFsurvey07_epdf
Ontario College of Teachers (2009) Transition to teaching 2009 Retrieved from httpwwwoctcapublicationsPDFtransitions09_epdf
Statistics Canada (2008) CANSIM Table 477-0014 mdash University degrees diplomas and certificates granted by program level Classification of Instructional Programs Primary Grouping (CIP_PG) and sex annual (number) Retrieved from httpdc2chassutorontoca
Tatto MT Ingvarson L Schwille J Peck R Senk SL amp Rowley G (2008) Teacher Education and Development Study in Mathematics (TEDS-M) Policy practice and readiness to teach primary and secondary mathematics Conceptual framework East Lansing MITEDS-MInternationalStudyCenteratMichiganStateUniversityRetrievedfromhttpstedseducmsueduTEDS_FrameworkFinalzip
33
APPENDIX I
sample syllabus Coding
math 250 probability and statistics for elementary middle-school teachers
Instructor Dr KP Lee Office 456HonorsTower
Phone 789-0123 E-mail kpleestandarduedu
Office hours 350ndash450 pm on Mondays and by appointment
COurse prereQuisitesCompletion of Math 125 or equivalent with a C grade or higher Those not meeting the course prerequisites will be automatically dropped from the course by the Department of Mathematics
COurse materialsText Probability and Statistics for ElementaryMiddle-School Teachers
A TI-73 graphing calculator (other models such as the TI-83 and TI-86 will not have the features needed for this course and will not be sufficient)
COurse Overview anD ObjeCtivesThis course is designed to provide pre-service elementary and middle-school teachers with
[laboratory-based experiences designed to teach and reinforce basic statistics and probability concepts often situated in the core tasks of teaching including the examination and critiquing of the statistical thinking and arguments of others]
[opportunities to demonstrate their understanding of statistics and probability concepts in meaningful constructive and alternative ways]
[activities involving the use of calculator technology (this course is usedtosatisfypartoftheUniversityComputerUsagerequirementfor students in elementary teacher education)]
[experiences that model techniques for use in their future elementarymiddle-school classrooms]
U1 T24
B1 T2117331332
B2 T2
117
B3 T2
117355356
34
[The majority of class time will be devoted to small-group exploration and class discussion with an emphasis on reasoning and communication of statistics and probability ideas rather than on rote memorization Students will be expected to demonstrate that they are prepared for class each day by bringing course materials and completed homework assignments Students will be asked to work cooperatively in groups and participate in whole-class discussions Studentsrsquo consistent engagement in these activities will be reflected in their participation grade]
Codes Used in this Excerpt
U1 Sequentialunitnumberofthecodeddocument
T2 An objective of the course
T24 A course that covers specialized mathematics knowledge needed for teaching mathematics
B1 B2 B3 and B4 Each block of information being coded
117 Mathematics block on data representation probability and statistics
331 Mathematics education block on developing mathematical concepts
332 Mathematics education block on reasoning argumentation and proving
355 Mathematics instruction block on using calculators
356 Mathematics instruction block on using computers
117
B4 T2
35
APPENDIX II
examples of assessment items in the primary general pedagogy Knowledge for teaching section of the future teacher Questionnaire
Example 1
Label MFC106Item type Multiple choiceDimension Mathematics Content KnowledgeDomain DataSub-domain Applying
Two fair six-sided number cubes are thrown in a probability game and the two numbers at the top are recorded
Josie wins if the difference between the two numbers is 0 1 or 2 Farid wins if the difference between the two numbers is 3 4 or 5
The students discuss whether the game is fair
Which of the following statements is correct
Check one box
A Both have an equal chance of winning
33
B Josie has the greater chance of winning
50
C Farid has the greater chance of winning
12
D As the game involves number cubes itrsquos not possible to say who has the greater chance of winning
05
For this probability question only half of the future teachers responded correctly that Josie had a greater chance of winning One-third of the respondents were incorrectly drawn to the first option thinking that both Josie and Farid had an equal chance of winning
36
Example 2
Label MFC108Item type Multiple choiceDimension Mathematics Pedagogical Content KnowledgeDomain AlgebraSub-domain Enacting
Amy is building a sequence of geometric figures with toothpicks by following the pattern shown below Each new figure has one extra triangle
Variable t denotes the position of a figure in the sequence
In finding a mathematical description of the pattern Amy explains her thinking by saying I use three sticks for each triangle
Then I see that I am counting one stick twice for each triangle except the last one so I have to remove those
Variable n represents the total number of toothpicks used in a figure
Which of the equations below best represent Amyrsquos statement in algebraic notation
Check one box
A n = 2t + 1 29
B n = 2(t + 1) ndash 1
26
C n = 3t ndash (t ndash1)
36
D n = 3t + 1 ndash t
08
This question was difficult for Canadian future teachers with almost two-thirds of the respondents unable to identify the correct algebraic notation for this pattern
t = 1 t = 2 t = 3
hellip
37
Example 3
Label MFC202Item type Multiple choiceDimension Mathematics Content KnowledgeDomain AlgebraSub-domain Knowing
Indicate whether each of the following statements is true for the set of all whole numbers a b and c greater than zero
Check one box in each row
True Not True
A a ndash b = b ndash a
16
84
B a divide b = b divide a
06
95
C (a + b) + c = a + (b + c)
93
07
D (a ndash b) ndash c = a ndash (b ndash c)
23
77
ThisalgebraquestionwasrelativelyeasyforCanadianfutureteachersHoweveralmostone-quarter of the respondents did not know that the fourth statement was not true even though the question appeared to be relatively easy to solve with whole numbers
38
Example 4
Label MFC203Item type Multiple choiceDimension Mathematics Content Knowledge Domain GeometrySub-domain Applying
A rectangular-shaped swimming pool has a paved walkway (shaded) around it as shown
What is the area of the walkway
Check one box
A 100 m2
04
B 161 m2
06
C 710 m2
78
D 1610 m2
12
This question was relatively easy for Canadian respondents with 78 getting the correctanswerHowever12calculatedtheentireareabutfailedtosubtractthearea of the swimming pool
70 m
50 m
18 m 23 mPool
not to scale
Walkway
39
Example 5
Label MFC206Item type Constructed responseDimension Mathematics Content Knowledge Domain NumberSub-domains Applying Planning
a) Amachineuses24litresoffuelforevery30hoursofoperationHowmanylitresoffuel will the machine use in 100 hours if it continues to use fuel at the same rate
Check one box
A 72
11
B 80
79
C 84
08
D 96
02
This question was relatively easy for Canadian respondents with almost 80 getting thecorrectresponseHoweveroneinfiverespondentsdidmakeacalculationerrorwhen solving this simple problem
b) Create a different problem of the same type as the problem in (a) (same processesoperations) that is EASIER for primary children to solve
40
Scoring Guide
Code Response Item MFC206B
Correct Response
10
A different problem of the same type (same processesoperations) but easier to solveExamples
bull Amachineuses3litresoffuelforevery30hoursofoperationHowmanylitres of fuel will the machine use in 100 hours
bull Acaruses24litresoffuelforevery50kmHowmanylitresoffuelwillthe car use in 100 km
Incorrect Response
70
A different problem of the same type (same processesoperations) but NOT easier to solve (Note Items judged to be of the same level of difficulty are NOT easier)Examples
bull Amachineuses2litresoffuelforevery30hoursofoperationHowmanylitres of fuel will the machine use in 100 hours (2 is not divisible by 3)
bull Atapdrips2litresofwatereverydayHowmanymlisthispersecond(The metric knowledge required and the computational load are significantly higher)
79
Other incorrect response (including crossed out erased illegible or off-task responses and stray marks)Examples
bull questionsthatarenotmeaningfulorhavenoanswer
No Response
99 Blank
About 84 of Canadian future teachers were able to create a problem of the same type but that was easier to solve Nine per cent of respondents created a similar problem but that was not easier to solve
41
examples of assessment items in the secondary general pedagogy Knowledge for teaching section of the future teacher Questionnaire
Example 1
Label MFC604Item type Constructed responseDimension Mathematics Content KnowledgeDomain AlgebraSub-doman Applying
The following problems appear in a mathematics textbook for lower secondary schools
1 Peter David and James play a game with marbles They have 198 marbles altogether Peter has 6 times as many marbles as David and James has 2 times as many marbles asDavidHowmanymarblesdoeseachboyhave
2 Three children Wendy Joyce and Gabriela have 198 zeds altogether Wendy has 6timesasmuchmoneyasJoyceand3timesasmuchasGabrielaHowmanyzedsdoes each child have
(a) Solve each problem
Solution to Problem 1
Solution to Problem 2
42
Scoring Guide
Note The correct answers to MFC604A1 and MFC604A2 are as follows
Problem 1 David has 22 marbles Peter has 132 marbles and James has 44 marbles
Problem 2 Wendy has 132 zeds Joyce has 22 zeds and Gabriela has 44 zeds
The following methods are considered in the scoring guide
1) Usingone variable setting up one equation and solving
Example (Problem 1) Let m = the number of marbles that David has Then Peter has 6m and James has 2m Therefore 6m + 2m + m = 198 and m = 22
2) Usingmore than one variable establishing a system of equations performing substitutions and solving
Example (Problem 1) Let p = the number of marbles that Peter has d = the number of marbles that David has and j = the number of marbles that James has Therefore p = 6d and j = 2d p + d + j = 198
3) Trial and error or guess and check
4) Ratio or other arithmetic methods
5) Representationdiagram
Code Response Item ID MFC604A1
Correct Response
11 Response uses Method 1 correctly to solve Problem 1 and get the correct answers
12 Response uses Method 2 correctly to solve Problem 1 and get the correct answers
13 Response uses Method 3 correctly to solve Problem 1 and get the correct answers
14 Response uses Method 4 correctly to solve Problem 1 and get the correct answers
15 Response uses Method 5 correctly to solve Problem 1 and get the correct answers
19Response uses a correct but different method from those listed above to solve Problem 1 and get the correct answers
Incorrect Response
70Response uses one of Methods 1 to 5 to solve Problem 1 but arrives at an incorrect answer or cannot complete the solution because of a computation or algebra error
71Response uses a correct but different method from those listed above to solve Problem 1 but arrives at an incorrect answer or cannot complete the solution because of a computation or algebra error
79 Other incorrect response (including crossed out erased illegible or off-task responses and stray marks)
No Response
99 Blank
43
Code Response Item ID MFC604A2
Correct Response
11 Response uses Method 1 to solve Problem 2
12 Response uses Method 2 to solve Problem 2
13 Response uses Method 3 to solve Problem 2
14 Response uses Method 4 to solve Problem 2
15 Response uses Method 5 to solve Problem 2
19Response uses a correct but different method from those listed above to solve Problem 2 and get the correct answers
Incorrect Response
70Response uses one of Methods 1 to 5 to solve Problem 2 but arrives at an incorrect answer or cannot complete the solution because of a computation or algebra error
71Response uses a correct but different method from those listed above to solve Problem 2 but arrives at an incorrect answer or cannot complete the solution because of a computation or algebra error
79 Other incorrect response (including crossed out erased illegible or off-task responses and stray marks)
No Response
99 Blank
Overall Problem 1 was easy to solve for Canadian future teachers with 85 getting the correct response The majority of respondents (53) used Method 1 to solve Problem 1 and 29 used Method 2 Problem 2 was of medium difficulty for Canadian future teachers with 65 getting a right answer Sixteen per cent of future teachers used one of the five methods listed to solve Problem 2 but made a computation or algebra error (code 70)
44
Example 2
Label MFC610Item type Multiple choiceDimension Mathematics Content KnowledgeDomain NumberSub-domain Knowing
Determine whether each of the following is an irrational number always sometimes or never
Check one box in each row
Always Sometimes Never
A The result of dividing the circumference of a circle by its diameter
65 26 09
B The diagonal of a square with side of length 1
75 11 14
C Result of dividing 22 by 7 66 06 28
Canadian future teachers had some difficulty identifying the characteristics of irrational numbers Only 28 of respondents knew that dividing 22 by 7 never results in an irrational number possibly confusing this fraction with π which is irrational
45
Example 3
Label MFC704Item type Constructed responseDimension Mathematics Content KnowledgeDomain GeometrySub-domain Applying
On the figure ABCD is a parallelogram ang BAD = 60˚ AM and BM are angle bisectors of angles BAD and ABC respectively If the perimeter of ABCD is 6 cm find the sides of triangle ABM
Write your answers on the lines below
AB = _______ cm
AM = _______ cm
BM = _______ cm
Scoring Guide
Code Response Item ID MFC704
Correct Response
20
Response indicates all three correct entries belowAB = 2 cmAM = radic3 cm or equivalentBM = 1 cm
Partially Correct Response
10 Response indicates any two correct entries and one incorrect (or blank) entry
11 Response indicates any one correct entry and two incorrect (or blank) entries
Incorrect Response
79 Incorrect mathematical statements or statements of no value (including crossed out erased illegible or off-task responses and stray marks)
No Response
99 Blank
This was a difficult question for Canadian future teachers with only 41 giving all three correct responses Another 14 had two correct responses and 8 had one correct response This means that 37 of respondents could not find any of the three measures of the triangle
D
A B
M C
46
Example 4
Label MFC705Item type Multiple choiceDimension Mathematics Content KnowledgeDomain GeometrySub-domain Knowing
We know that there is only one point on the real line that satisfies the equation 3x = 6 namely x = 2
Suppose now that we consider this same equation in the plane with coordinates x and y and then in space with coordinates x y and z What does the set of points that satisfy the equation 3x = 6 look like in these settings
Check one box in each row
One point One line One plane Other
A The solution to 3x = 6 in the plane 22 69 08 01
B The solution to 3x = 6 in space 14 09 71 07
This geometry question was moderately difficult for Canadian future teachers with about 70 of respondents knowing that the proposed solution would look like one line in the plane and one plane in space
- Table of Contents
- List of Figures
- What is TEDS-M 2008
- Research design and methodology for TEDS-M
- What is to be learned from TEDS-M
- What value will TEDS-M add to existing research on teacher education
- Target populations
- Components of TEDS-M
-
- Component 1 studies of teacher-education policies for elementary and lower-secondary mathematics teachers and their cultural and social contexts
- Component 2 studies of elementary and lower-secondary mathematics teacher-preparation routes programs standards and expectations for teacher learning
- Component 3 studies of the mathematics and related teaching knowledge of future elementary and lower-secondary school teachers
-
- Participating countries in TEDS-M
- The Canadian administration
- Structure and organization of teacher education in Canada
- Programs in specific jurisdictions
-
- Ontario
- Quebec
- Nova Scotia
- Newfoundland and Labrador
-
- The administration of the TEDS-M survey in Canada
-
- Representation at international meetings
- Adaptation translation and approval of assessment and questionnaire materials
-
- Sampling institutions
-
- Contacting institutions and sending and collecting materials
- Quality monitoring
- Coding
-
- Description of teacher-education courses and collection and coding of syllabi
- Coding of mathematics content knowledge and mathematics pedagogical content knowledge
-
- Results
-
- Institutional Program Questionnaire
- Survey for Mathematics Mathematics Pedagogy and General Pedagogy Educators
- Survey for Future Teachers of Lower-Secondary Mathematics
- Survey for Future Teachers of Primary Elementary Mathematics
-
- Conclusion
- References
- Figures
-
- Figure 1enspMean scores and confidence intervals for participating countriesmdashElementary-level future teachers mathematics content knowledge
- Figure 2enspMean scores and confidence intervals for participating countriesmdashElementary-level future teachers pedagogy content knowledge
- Figure 3enspMean scores and confidence intervals for participating countriesmdashLower-secondary-level future teachers mathematics content knowledge
- Figure 4enspMean scores and confidence intervals for participating countriesmdashLower-secondary-level future teachers pedagogy content knowledge
- Figure 5enspMean scores and confidence intervals by gender primary mathematics knowledge
- Figure 6enspMean scores and confidence intervals by gender primary pedagogical knowledge
- Figure 7enspMean scores and confidence intervals by gender lower-secondary mathematics knowledge
- Figure 8enspMean scores and confidence intervals by gender lower-secondary mathematics knowledge
-
- Appendices
-
- APPENDIX I
-
- Sample Syllabus Coding
-
- APPENDIX II
-
- Examples of assessment items in the Primary General Pedagogy Knowledge for Teaching section of the Future Teacher Questionnaire
- Examples of assessment items in the Secondary General Pedagogy Knowledge for Teaching section of the Future Teacher Questionnaire
-

26
Figure 3 Mean scores and confidence intervals for participating countriesmdash Lower-secondary-level future teachersrsquo mathematics content knowledge
Note The Canadian average score is not part of the international average score due to Canadas low response rates
Thailand (479)
Oman (472)
Norway (444)
Canada (516)
Chile (354)
Georgia (424)
Philippines (442)
Botswana (441)
Malaysia (493)
International (500)
Switzerland (531)
Germany (519)
United States (505)
Poland (540)
Russian Federation (594)
Singapore (570)
Chinese Taipei (667)
Below the international average
At the international average
Above the international average
340 360 380 400 420 440 460 480 500 520 540 560 580 600 620 640 660 680
95 Confidence interval
Estimated mean score
27
Figure 4 Mean scores and confidence intervals for participating countriesmdash Lower-secondary-level future teachersrsquo pedagogy content knowledge
Note The Canadian average score is not part of the international average score due to Canadas low response rates
The results are quite similar at the lower-secondary level however future teachers from Chinese Taipei significantly outperformed all other countries in both mathematics and pedagogical content knowledge This is not surprising considering that on the PISA 2006 mathematics assessment 15-year-old students from Chinese Taipei outperformed students from all other countries Interestingly future teachers from the Russian Federation had a much stronger performance in both aspects at the lower-secondary level compared to the elementary level This also holds true for German future teachers although to a lesser extent Conversely future teachers from Norway performed below the international average at the lower-secondary level even though they performed above the international average at the elementary level
Keeping in mind the serious data limitations for Canada it is worth noting that our future teachers performed above the international average in both mathematics and pedagogical content knowledge at both the elementary and lower-secondary levels
Oman (474)
Malaysia (472)
Norway (463)
Canada (513)
Chile (394)
Botswana (425)
Philippines (450)
Georgia (443)
Thailand (476)
International (500)
Germany (540)
Poland (524)
United States (502)
Switzerland (549)
Russian Federation (566)
Singapore (553)
Chinese Taipei (649)
Below the international average
At the international average
Above the international average
380 400 420 440 460 480 500 520 540 560 580 600 620 640 660 680
95 Confidence interval
Estimated mean score
28
Figure 5 Mean scores and confidence intervals by gender primary mathematics knowledge
Figure 6 Mean scores and confidence intervals by gender primary pedagogical knowledge
Among Canadian future teachers at the elementary level there was no statistical difference between their mathematics and pedagogical content knowledge Although the mean score for female future teachers was higher than that for males in pedagogical content knowledge the difference was not statistically significant Of note is the large imbalance intheproportionofmaleteachersinthesample(1in7)Howeverthisisafairlyaccuratereflection of the situation in the population which sees about 80 of teachers in elementary schools in Canada being female (Mullis et al 2007)
524
521Female
Male
400 450 500 550 600
528
543Female
Male
400 450 500 550 600
29
Figure 7 Mean scores and confidence intervals by gender lower-secondary mathematics knowledge
Figure 8 Mean scores and confidence intervals by gender lower-secondary pedagogical knowledge
At the lower-secondary level male future teachers had higher mean scores in both mathematics and pedagogical content knowledge than did females but the differences were not statistically significant The gender imbalance in the sample was not as pronounced at this level as at the elementary level (three female future teachers for every two males at the lower-secondary level) Overall in Canada this is a fair reflection of the situation at the lower-secondary level which sees approximately 70 of teachers being female2
527
509Female
Male
400 450 500 550 600
526
505Female
Male
400 450 500 550 600
2 According to the Pan-Canadian Assessment Program 2007 across all provinces and territories between 50 and 87 of teachers of 13-year-olds are females
30
ConclusionTEDS-M is a comparative study of teacher education with a focus on the preparation of mathematics teachers at the elementary and lower-secondary levels As the first attempt to systematically investigate both the knowledge and skills of future teachers in an international setting the study faced significant challenges in several countries In Canada given the structure of our education systems provinces and territories individually determined whether they wished to be involved in such an endeavour Four provinces (Ontario Quebec Nova Scotia and Newfoundland and Labrador) elected to participate and in each province the participation of individual institutions individual educators and individual future teachers was completely voluntary The very low response rates obtained in Canada and the ensuing non-inclusion in the international data set are indeed disappointing mdash but also very informative mdash should such an initiative be repeated in the future Conducting such an ambitious assessment project is possible but would require engaging all parties early on and throughout the implementation of the project
We are grateful to the ministriesdepartments of education institutions faculties of education educators and future teachers who did participate in this TEDS-M 2008 assessment project It is hoped that the project will yield useful information to guide teacher education in the future
Keeping in mind the serious limitations of the data gathered from TEDS-M there are a few conclusions from the study that may help elicit further discussion among policy-makers and educators
bull IngeneralCanadianinstitutionsdonotseemtohaveverystrongrequirementsin mathematics for individuals wishing to enter into teacher-education programs Other than assessments to meet the requirements for a course in mathematics or in mathematics education there is no formal test of the mathematical knowledge or skills of future teachers at the completion of their program of study
bull Mosteducatorsofmathematicsorofmathematicspedagogyforfutureteachersin Canadian universities are specialized in areas other than mathematics and few hold a doctorate in the discipline At the international level about one-quarter of educators who participated in the TEDS-M study held a doctorate in mathematics with a higher proportion in higher-performing countries In Canada 10 per cent of participating educators held a doctorate in mathematics
bull WithregardtoknowledgeofmathematicsandofmathematicspedagogyCanadianfuture teachers at the elementary and lower-secondary levels performed above the international average Although Canadian 15-year-olds have performed among the top-ranking countries in mathematics since the inception of PISA in 2000 it appears that there is potential for further improvement by possibly providing future teachers at the elementary level with more advanced training in mathematics that covers elements beyond the school curriculum and by providing future teachers at the lower-secondary level with more advanced training in testing- and assessment-related topics
31
ReferencesAtlantic Evaluation and Research Consultants (2007) Kndash12 mathematics curriculum review Final report Retrieved from httpwwwedgovnlcaedupublicationsk12NLMathReportpdf
Bloumlmeke S Kaiser G amp Lehmann R (Eds) (2010) TEDS-M 2008 Professional Competences and Opportunities to Learn of Future Mathematics Teachers at Lower-Secondary Schools in the International Context Muumlnster Waxmann
Bloumlmeke S Kaiser G amp Lehmann R (Eds) (2010) TEDS-M 2008 Professional Competences and Opportunities to Learn of Future Primary Teachers in the International Context Muumlnster Waxmann
Carnoy M Beteille T Brodziak I Loyalka P amp Luschei T (2009) Do countries paying teachers higher relative salaries have higher student mathematics achievement Palo Alto CA StanfordUniversityRetrievedfromhttpstedseducmsueduTEDS_CostsStudyzip
Council of Ministers of Education Canada (2009) PCAP-13 2007 Contextual Report on Student Achievement in Reading Toronto Author
Crocker R amp Dibbon D (2008) Teacher education in Canada a baseline study Kelowna BC Society for the Advancement of Excellence in Education
Dibbon D amp Sheppard B (2001) Teacher demand supply and retention in Newfoundland and LabradorMemorialUniversityofNewfoundlandRetrievedfromhttpwwwmuncaeducpeoplefacultyddibbonpdfFinal20reportchapter1-Introductionpdf
Feng-JuiHTing-YingWChia-JuiHShu-JyhTGuohengCChiu-KeungLet al (2010) A milestone of an international study in Taiwan teacher education National Research Center of Taiwan Teacher Education and Development Study in Mathematics in Taiwan
Ministegravere de lrsquoEacuteducation du Queacutebec (2004) Surplus ou peacutenurie de personnel enseignant qualifieacute au Queacutebec situation actuelle et perspectives agrave court et moyen terme pour le secteur francophone Retrieved from httpwwwmelsgouvqccadftpsinterieurpdfpers_emploi_prevision_nov04pdf
Mullis IVS Martin MO Kennedy AM amp Foy P (2007) PIRLS 2006 International ReportChestnutHillMABostonCollege
Mullis I Martin M Ruddock G OrsquoSullivan C Arora A amp Erberber E (2005) TIMSS 2007 assessment frameworks International Association for the Evaluation of Educational Achievement Retrieved from httptimssbceduTIMSS2007PDFT07_AFpdf
Nova Scotia Department of Education (2007) Nova Scotia public education teacher supply and demand Retrieved from httpwwwednetnscapdfdocsreportsteacher_supply_and_demand_reportpdf
32
Nova Scotia Department of Education (2008) Report and recommendations of the review panel on teacher education in Nova Scotia Retrieved from httpwwwednetnscaeventsteacher_education_reviewdocumentsreview_panel_report_web_epdf
Ontario College of Teachers (2001) Teacher supply and demand Report on the consultation Retrieved from httpwwwoctcapublicationspdftsd_epdf
Ontario College of Teachers (2007) State of the teaching profession 2007 Annual Ontario College of Teachers survey of teachers Retrieved from httpwwwoctcapublicationsPDFsurvey07_epdf
Ontario College of Teachers (2009) Transition to teaching 2009 Retrieved from httpwwwoctcapublicationsPDFtransitions09_epdf
Statistics Canada (2008) CANSIM Table 477-0014 mdash University degrees diplomas and certificates granted by program level Classification of Instructional Programs Primary Grouping (CIP_PG) and sex annual (number) Retrieved from httpdc2chassutorontoca
Tatto MT Ingvarson L Schwille J Peck R Senk SL amp Rowley G (2008) Teacher Education and Development Study in Mathematics (TEDS-M) Policy practice and readiness to teach primary and secondary mathematics Conceptual framework East Lansing MITEDS-MInternationalStudyCenteratMichiganStateUniversityRetrievedfromhttpstedseducmsueduTEDS_FrameworkFinalzip
33
APPENDIX I
sample syllabus Coding
math 250 probability and statistics for elementary middle-school teachers
Instructor Dr KP Lee Office 456HonorsTower
Phone 789-0123 E-mail kpleestandarduedu
Office hours 350ndash450 pm on Mondays and by appointment
COurse prereQuisitesCompletion of Math 125 or equivalent with a C grade or higher Those not meeting the course prerequisites will be automatically dropped from the course by the Department of Mathematics
COurse materialsText Probability and Statistics for ElementaryMiddle-School Teachers
A TI-73 graphing calculator (other models such as the TI-83 and TI-86 will not have the features needed for this course and will not be sufficient)
COurse Overview anD ObjeCtivesThis course is designed to provide pre-service elementary and middle-school teachers with
[laboratory-based experiences designed to teach and reinforce basic statistics and probability concepts often situated in the core tasks of teaching including the examination and critiquing of the statistical thinking and arguments of others]
[opportunities to demonstrate their understanding of statistics and probability concepts in meaningful constructive and alternative ways]
[activities involving the use of calculator technology (this course is usedtosatisfypartoftheUniversityComputerUsagerequirementfor students in elementary teacher education)]
[experiences that model techniques for use in their future elementarymiddle-school classrooms]
U1 T24
B1 T2117331332
B2 T2
117
B3 T2
117355356
34
[The majority of class time will be devoted to small-group exploration and class discussion with an emphasis on reasoning and communication of statistics and probability ideas rather than on rote memorization Students will be expected to demonstrate that they are prepared for class each day by bringing course materials and completed homework assignments Students will be asked to work cooperatively in groups and participate in whole-class discussions Studentsrsquo consistent engagement in these activities will be reflected in their participation grade]
Codes Used in this Excerpt
U1 Sequentialunitnumberofthecodeddocument
T2 An objective of the course
T24 A course that covers specialized mathematics knowledge needed for teaching mathematics
B1 B2 B3 and B4 Each block of information being coded
117 Mathematics block on data representation probability and statistics
331 Mathematics education block on developing mathematical concepts
332 Mathematics education block on reasoning argumentation and proving
355 Mathematics instruction block on using calculators
356 Mathematics instruction block on using computers
117
B4 T2
35
APPENDIX II
examples of assessment items in the primary general pedagogy Knowledge for teaching section of the future teacher Questionnaire
Example 1
Label MFC106Item type Multiple choiceDimension Mathematics Content KnowledgeDomain DataSub-domain Applying
Two fair six-sided number cubes are thrown in a probability game and the two numbers at the top are recorded
Josie wins if the difference between the two numbers is 0 1 or 2 Farid wins if the difference between the two numbers is 3 4 or 5
The students discuss whether the game is fair
Which of the following statements is correct
Check one box
A Both have an equal chance of winning
33
B Josie has the greater chance of winning
50
C Farid has the greater chance of winning
12
D As the game involves number cubes itrsquos not possible to say who has the greater chance of winning
05
For this probability question only half of the future teachers responded correctly that Josie had a greater chance of winning One-third of the respondents were incorrectly drawn to the first option thinking that both Josie and Farid had an equal chance of winning
36
Example 2
Label MFC108Item type Multiple choiceDimension Mathematics Pedagogical Content KnowledgeDomain AlgebraSub-domain Enacting
Amy is building a sequence of geometric figures with toothpicks by following the pattern shown below Each new figure has one extra triangle
Variable t denotes the position of a figure in the sequence
In finding a mathematical description of the pattern Amy explains her thinking by saying I use three sticks for each triangle
Then I see that I am counting one stick twice for each triangle except the last one so I have to remove those
Variable n represents the total number of toothpicks used in a figure
Which of the equations below best represent Amyrsquos statement in algebraic notation
Check one box
A n = 2t + 1 29
B n = 2(t + 1) ndash 1
26
C n = 3t ndash (t ndash1)
36
D n = 3t + 1 ndash t
08
This question was difficult for Canadian future teachers with almost two-thirds of the respondents unable to identify the correct algebraic notation for this pattern
t = 1 t = 2 t = 3
hellip
37
Example 3
Label MFC202Item type Multiple choiceDimension Mathematics Content KnowledgeDomain AlgebraSub-domain Knowing
Indicate whether each of the following statements is true for the set of all whole numbers a b and c greater than zero
Check one box in each row
True Not True
A a ndash b = b ndash a
16
84
B a divide b = b divide a
06
95
C (a + b) + c = a + (b + c)
93
07
D (a ndash b) ndash c = a ndash (b ndash c)
23
77
ThisalgebraquestionwasrelativelyeasyforCanadianfutureteachersHoweveralmostone-quarter of the respondents did not know that the fourth statement was not true even though the question appeared to be relatively easy to solve with whole numbers
38
Example 4
Label MFC203Item type Multiple choiceDimension Mathematics Content Knowledge Domain GeometrySub-domain Applying
A rectangular-shaped swimming pool has a paved walkway (shaded) around it as shown
What is the area of the walkway
Check one box
A 100 m2
04
B 161 m2
06
C 710 m2
78
D 1610 m2
12
This question was relatively easy for Canadian respondents with 78 getting the correctanswerHowever12calculatedtheentireareabutfailedtosubtractthearea of the swimming pool
70 m
50 m
18 m 23 mPool
not to scale
Walkway
39
Example 5
Label MFC206Item type Constructed responseDimension Mathematics Content Knowledge Domain NumberSub-domains Applying Planning
a) Amachineuses24litresoffuelforevery30hoursofoperationHowmanylitresoffuel will the machine use in 100 hours if it continues to use fuel at the same rate
Check one box
A 72
11
B 80
79
C 84
08
D 96
02
This question was relatively easy for Canadian respondents with almost 80 getting thecorrectresponseHoweveroneinfiverespondentsdidmakeacalculationerrorwhen solving this simple problem
b) Create a different problem of the same type as the problem in (a) (same processesoperations) that is EASIER for primary children to solve
40
Scoring Guide
Code Response Item MFC206B
Correct Response
10
A different problem of the same type (same processesoperations) but easier to solveExamples
bull Amachineuses3litresoffuelforevery30hoursofoperationHowmanylitres of fuel will the machine use in 100 hours
bull Acaruses24litresoffuelforevery50kmHowmanylitresoffuelwillthe car use in 100 km
Incorrect Response
70
A different problem of the same type (same processesoperations) but NOT easier to solve (Note Items judged to be of the same level of difficulty are NOT easier)Examples
bull Amachineuses2litresoffuelforevery30hoursofoperationHowmanylitres of fuel will the machine use in 100 hours (2 is not divisible by 3)
bull Atapdrips2litresofwatereverydayHowmanymlisthispersecond(The metric knowledge required and the computational load are significantly higher)
79
Other incorrect response (including crossed out erased illegible or off-task responses and stray marks)Examples
bull questionsthatarenotmeaningfulorhavenoanswer
No Response
99 Blank
About 84 of Canadian future teachers were able to create a problem of the same type but that was easier to solve Nine per cent of respondents created a similar problem but that was not easier to solve
41
examples of assessment items in the secondary general pedagogy Knowledge for teaching section of the future teacher Questionnaire
Example 1
Label MFC604Item type Constructed responseDimension Mathematics Content KnowledgeDomain AlgebraSub-doman Applying
The following problems appear in a mathematics textbook for lower secondary schools
1 Peter David and James play a game with marbles They have 198 marbles altogether Peter has 6 times as many marbles as David and James has 2 times as many marbles asDavidHowmanymarblesdoeseachboyhave
2 Three children Wendy Joyce and Gabriela have 198 zeds altogether Wendy has 6timesasmuchmoneyasJoyceand3timesasmuchasGabrielaHowmanyzedsdoes each child have
(a) Solve each problem
Solution to Problem 1
Solution to Problem 2
42
Scoring Guide
Note The correct answers to MFC604A1 and MFC604A2 are as follows
Problem 1 David has 22 marbles Peter has 132 marbles and James has 44 marbles
Problem 2 Wendy has 132 zeds Joyce has 22 zeds and Gabriela has 44 zeds
The following methods are considered in the scoring guide
1) Usingone variable setting up one equation and solving
Example (Problem 1) Let m = the number of marbles that David has Then Peter has 6m and James has 2m Therefore 6m + 2m + m = 198 and m = 22
2) Usingmore than one variable establishing a system of equations performing substitutions and solving
Example (Problem 1) Let p = the number of marbles that Peter has d = the number of marbles that David has and j = the number of marbles that James has Therefore p = 6d and j = 2d p + d + j = 198
3) Trial and error or guess and check
4) Ratio or other arithmetic methods
5) Representationdiagram
Code Response Item ID MFC604A1
Correct Response
11 Response uses Method 1 correctly to solve Problem 1 and get the correct answers
12 Response uses Method 2 correctly to solve Problem 1 and get the correct answers
13 Response uses Method 3 correctly to solve Problem 1 and get the correct answers
14 Response uses Method 4 correctly to solve Problem 1 and get the correct answers
15 Response uses Method 5 correctly to solve Problem 1 and get the correct answers
19Response uses a correct but different method from those listed above to solve Problem 1 and get the correct answers
Incorrect Response
70Response uses one of Methods 1 to 5 to solve Problem 1 but arrives at an incorrect answer or cannot complete the solution because of a computation or algebra error
71Response uses a correct but different method from those listed above to solve Problem 1 but arrives at an incorrect answer or cannot complete the solution because of a computation or algebra error
79 Other incorrect response (including crossed out erased illegible or off-task responses and stray marks)
No Response
99 Blank
43
Code Response Item ID MFC604A2
Correct Response
11 Response uses Method 1 to solve Problem 2
12 Response uses Method 2 to solve Problem 2
13 Response uses Method 3 to solve Problem 2
14 Response uses Method 4 to solve Problem 2
15 Response uses Method 5 to solve Problem 2
19Response uses a correct but different method from those listed above to solve Problem 2 and get the correct answers
Incorrect Response
70Response uses one of Methods 1 to 5 to solve Problem 2 but arrives at an incorrect answer or cannot complete the solution because of a computation or algebra error
71Response uses a correct but different method from those listed above to solve Problem 2 but arrives at an incorrect answer or cannot complete the solution because of a computation or algebra error
79 Other incorrect response (including crossed out erased illegible or off-task responses and stray marks)
No Response
99 Blank
Overall Problem 1 was easy to solve for Canadian future teachers with 85 getting the correct response The majority of respondents (53) used Method 1 to solve Problem 1 and 29 used Method 2 Problem 2 was of medium difficulty for Canadian future teachers with 65 getting a right answer Sixteen per cent of future teachers used one of the five methods listed to solve Problem 2 but made a computation or algebra error (code 70)
44
Example 2
Label MFC610Item type Multiple choiceDimension Mathematics Content KnowledgeDomain NumberSub-domain Knowing
Determine whether each of the following is an irrational number always sometimes or never
Check one box in each row
Always Sometimes Never
A The result of dividing the circumference of a circle by its diameter
65 26 09
B The diagonal of a square with side of length 1
75 11 14
C Result of dividing 22 by 7 66 06 28
Canadian future teachers had some difficulty identifying the characteristics of irrational numbers Only 28 of respondents knew that dividing 22 by 7 never results in an irrational number possibly confusing this fraction with π which is irrational
45
Example 3
Label MFC704Item type Constructed responseDimension Mathematics Content KnowledgeDomain GeometrySub-domain Applying
On the figure ABCD is a parallelogram ang BAD = 60˚ AM and BM are angle bisectors of angles BAD and ABC respectively If the perimeter of ABCD is 6 cm find the sides of triangle ABM
Write your answers on the lines below
AB = _______ cm
AM = _______ cm
BM = _______ cm
Scoring Guide
Code Response Item ID MFC704
Correct Response
20
Response indicates all three correct entries belowAB = 2 cmAM = radic3 cm or equivalentBM = 1 cm
Partially Correct Response
10 Response indicates any two correct entries and one incorrect (or blank) entry
11 Response indicates any one correct entry and two incorrect (or blank) entries
Incorrect Response
79 Incorrect mathematical statements or statements of no value (including crossed out erased illegible or off-task responses and stray marks)
No Response
99 Blank
This was a difficult question for Canadian future teachers with only 41 giving all three correct responses Another 14 had two correct responses and 8 had one correct response This means that 37 of respondents could not find any of the three measures of the triangle
D
A B
M C
46
Example 4
Label MFC705Item type Multiple choiceDimension Mathematics Content KnowledgeDomain GeometrySub-domain Knowing
We know that there is only one point on the real line that satisfies the equation 3x = 6 namely x = 2
Suppose now that we consider this same equation in the plane with coordinates x and y and then in space with coordinates x y and z What does the set of points that satisfy the equation 3x = 6 look like in these settings
Check one box in each row
One point One line One plane Other
A The solution to 3x = 6 in the plane 22 69 08 01
B The solution to 3x = 6 in space 14 09 71 07
This geometry question was moderately difficult for Canadian future teachers with about 70 of respondents knowing that the proposed solution would look like one line in the plane and one plane in space
- Table of Contents
- List of Figures
- What is TEDS-M 2008
- Research design and methodology for TEDS-M
- What is to be learned from TEDS-M
- What value will TEDS-M add to existing research on teacher education
- Target populations
- Components of TEDS-M
-
- Component 1 studies of teacher-education policies for elementary and lower-secondary mathematics teachers and their cultural and social contexts
- Component 2 studies of elementary and lower-secondary mathematics teacher-preparation routes programs standards and expectations for teacher learning
- Component 3 studies of the mathematics and related teaching knowledge of future elementary and lower-secondary school teachers
-
- Participating countries in TEDS-M
- The Canadian administration
- Structure and organization of teacher education in Canada
- Programs in specific jurisdictions
-
- Ontario
- Quebec
- Nova Scotia
- Newfoundland and Labrador
-
- The administration of the TEDS-M survey in Canada
-
- Representation at international meetings
- Adaptation translation and approval of assessment and questionnaire materials
-
- Sampling institutions
-
- Contacting institutions and sending and collecting materials
- Quality monitoring
- Coding
-
- Description of teacher-education courses and collection and coding of syllabi
- Coding of mathematics content knowledge and mathematics pedagogical content knowledge
-
- Results
-
- Institutional Program Questionnaire
- Survey for Mathematics Mathematics Pedagogy and General Pedagogy Educators
- Survey for Future Teachers of Lower-Secondary Mathematics
- Survey for Future Teachers of Primary Elementary Mathematics
-
- Conclusion
- References
- Figures
-
- Figure 1enspMean scores and confidence intervals for participating countriesmdashElementary-level future teachers mathematics content knowledge
- Figure 2enspMean scores and confidence intervals for participating countriesmdashElementary-level future teachers pedagogy content knowledge
- Figure 3enspMean scores and confidence intervals for participating countriesmdashLower-secondary-level future teachers mathematics content knowledge
- Figure 4enspMean scores and confidence intervals for participating countriesmdashLower-secondary-level future teachers pedagogy content knowledge
- Figure 5enspMean scores and confidence intervals by gender primary mathematics knowledge
- Figure 6enspMean scores and confidence intervals by gender primary pedagogical knowledge
- Figure 7enspMean scores and confidence intervals by gender lower-secondary mathematics knowledge
- Figure 8enspMean scores and confidence intervals by gender lower-secondary mathematics knowledge
-
- Appendices
-
- APPENDIX I
-
- Sample Syllabus Coding
-
- APPENDIX II
-
- Examples of assessment items in the Primary General Pedagogy Knowledge for Teaching section of the Future Teacher Questionnaire
- Examples of assessment items in the Secondary General Pedagogy Knowledge for Teaching section of the Future Teacher Questionnaire
-

33
APPENDIX I
sample syllabus Coding
math 250 probability and statistics for elementary middle-school teachers
Instructor Dr KP Lee Office 456HonorsTower
Phone 789-0123 E-mail kpleestandarduedu
Office hours 350ndash450 pm on Mondays and by appointment
COurse prereQuisitesCompletion of Math 125 or equivalent with a C grade or higher Those not meeting the course prerequisites will be automatically dropped from the course by the Department of Mathematics
COurse materialsText Probability and Statistics for ElementaryMiddle-School Teachers
A TI-73 graphing calculator (other models such as the TI-83 and TI-86 will not have the features needed for this course and will not be sufficient)
COurse Overview anD ObjeCtivesThis course is designed to provide pre-service elementary and middle-school teachers with
[laboratory-based experiences designed to teach and reinforce basic statistics and probability concepts often situated in the core tasks of teaching including the examination and critiquing of the statistical thinking and arguments of others]
[opportunities to demonstrate their understanding of statistics and probability concepts in meaningful constructive and alternative ways]
[activities involving the use of calculator technology (this course is usedtosatisfypartoftheUniversityComputerUsagerequirementfor students in elementary teacher education)]
[experiences that model techniques for use in their future elementarymiddle-school classrooms]
U1 T24
B1 T2117331332
B2 T2
117
B3 T2
117355356
34
[The majority of class time will be devoted to small-group exploration and class discussion with an emphasis on reasoning and communication of statistics and probability ideas rather than on rote memorization Students will be expected to demonstrate that they are prepared for class each day by bringing course materials and completed homework assignments Students will be asked to work cooperatively in groups and participate in whole-class discussions Studentsrsquo consistent engagement in these activities will be reflected in their participation grade]
Codes Used in this Excerpt
U1 Sequentialunitnumberofthecodeddocument
T2 An objective of the course
T24 A course that covers specialized mathematics knowledge needed for teaching mathematics
B1 B2 B3 and B4 Each block of information being coded
117 Mathematics block on data representation probability and statistics
331 Mathematics education block on developing mathematical concepts
332 Mathematics education block on reasoning argumentation and proving
355 Mathematics instruction block on using calculators
356 Mathematics instruction block on using computers
117
B4 T2
35
APPENDIX II
examples of assessment items in the primary general pedagogy Knowledge for teaching section of the future teacher Questionnaire
Example 1
Label MFC106Item type Multiple choiceDimension Mathematics Content KnowledgeDomain DataSub-domain Applying
Two fair six-sided number cubes are thrown in a probability game and the two numbers at the top are recorded
Josie wins if the difference between the two numbers is 0 1 or 2 Farid wins if the difference between the two numbers is 3 4 or 5
The students discuss whether the game is fair
Which of the following statements is correct
Check one box
A Both have an equal chance of winning
33
B Josie has the greater chance of winning
50
C Farid has the greater chance of winning
12
D As the game involves number cubes itrsquos not possible to say who has the greater chance of winning
05
For this probability question only half of the future teachers responded correctly that Josie had a greater chance of winning One-third of the respondents were incorrectly drawn to the first option thinking that both Josie and Farid had an equal chance of winning
36
Example 2
Label MFC108Item type Multiple choiceDimension Mathematics Pedagogical Content KnowledgeDomain AlgebraSub-domain Enacting
Amy is building a sequence of geometric figures with toothpicks by following the pattern shown below Each new figure has one extra triangle
Variable t denotes the position of a figure in the sequence
In finding a mathematical description of the pattern Amy explains her thinking by saying I use three sticks for each triangle
Then I see that I am counting one stick twice for each triangle except the last one so I have to remove those
Variable n represents the total number of toothpicks used in a figure
Which of the equations below best represent Amyrsquos statement in algebraic notation
Check one box
A n = 2t + 1 29
B n = 2(t + 1) ndash 1
26
C n = 3t ndash (t ndash1)
36
D n = 3t + 1 ndash t
08
This question was difficult for Canadian future teachers with almost two-thirds of the respondents unable to identify the correct algebraic notation for this pattern
t = 1 t = 2 t = 3
hellip
37
Example 3
Label MFC202Item type Multiple choiceDimension Mathematics Content KnowledgeDomain AlgebraSub-domain Knowing
Indicate whether each of the following statements is true for the set of all whole numbers a b and c greater than zero
Check one box in each row
True Not True
A a ndash b = b ndash a
16
84
B a divide b = b divide a
06
95
C (a + b) + c = a + (b + c)
93
07
D (a ndash b) ndash c = a ndash (b ndash c)
23
77
ThisalgebraquestionwasrelativelyeasyforCanadianfutureteachersHoweveralmostone-quarter of the respondents did not know that the fourth statement was not true even though the question appeared to be relatively easy to solve with whole numbers
38
Example 4
Label MFC203Item type Multiple choiceDimension Mathematics Content Knowledge Domain GeometrySub-domain Applying
A rectangular-shaped swimming pool has a paved walkway (shaded) around it as shown
What is the area of the walkway
Check one box
A 100 m2
04
B 161 m2
06
C 710 m2
78
D 1610 m2
12
This question was relatively easy for Canadian respondents with 78 getting the correctanswerHowever12calculatedtheentireareabutfailedtosubtractthearea of the swimming pool
70 m
50 m
18 m 23 mPool
not to scale
Walkway
39
Example 5
Label MFC206Item type Constructed responseDimension Mathematics Content Knowledge Domain NumberSub-domains Applying Planning
a) Amachineuses24litresoffuelforevery30hoursofoperationHowmanylitresoffuel will the machine use in 100 hours if it continues to use fuel at the same rate
Check one box
A 72
11
B 80
79
C 84
08
D 96
02
This question was relatively easy for Canadian respondents with almost 80 getting thecorrectresponseHoweveroneinfiverespondentsdidmakeacalculationerrorwhen solving this simple problem
b) Create a different problem of the same type as the problem in (a) (same processesoperations) that is EASIER for primary children to solve
40
Scoring Guide
Code Response Item MFC206B
Correct Response
10
A different problem of the same type (same processesoperations) but easier to solveExamples
bull Amachineuses3litresoffuelforevery30hoursofoperationHowmanylitres of fuel will the machine use in 100 hours
bull Acaruses24litresoffuelforevery50kmHowmanylitresoffuelwillthe car use in 100 km
Incorrect Response
70
A different problem of the same type (same processesoperations) but NOT easier to solve (Note Items judged to be of the same level of difficulty are NOT easier)Examples
bull Amachineuses2litresoffuelforevery30hoursofoperationHowmanylitres of fuel will the machine use in 100 hours (2 is not divisible by 3)
bull Atapdrips2litresofwatereverydayHowmanymlisthispersecond(The metric knowledge required and the computational load are significantly higher)
79
Other incorrect response (including crossed out erased illegible or off-task responses and stray marks)Examples
bull questionsthatarenotmeaningfulorhavenoanswer
No Response
99 Blank
About 84 of Canadian future teachers were able to create a problem of the same type but that was easier to solve Nine per cent of respondents created a similar problem but that was not easier to solve
41
examples of assessment items in the secondary general pedagogy Knowledge for teaching section of the future teacher Questionnaire
Example 1
Label MFC604Item type Constructed responseDimension Mathematics Content KnowledgeDomain AlgebraSub-doman Applying
The following problems appear in a mathematics textbook for lower secondary schools
1 Peter David and James play a game with marbles They have 198 marbles altogether Peter has 6 times as many marbles as David and James has 2 times as many marbles asDavidHowmanymarblesdoeseachboyhave
2 Three children Wendy Joyce and Gabriela have 198 zeds altogether Wendy has 6timesasmuchmoneyasJoyceand3timesasmuchasGabrielaHowmanyzedsdoes each child have
(a) Solve each problem
Solution to Problem 1
Solution to Problem 2
42
Scoring Guide
Note The correct answers to MFC604A1 and MFC604A2 are as follows
Problem 1 David has 22 marbles Peter has 132 marbles and James has 44 marbles
Problem 2 Wendy has 132 zeds Joyce has 22 zeds and Gabriela has 44 zeds
The following methods are considered in the scoring guide
1) Usingone variable setting up one equation and solving
Example (Problem 1) Let m = the number of marbles that David has Then Peter has 6m and James has 2m Therefore 6m + 2m + m = 198 and m = 22
2) Usingmore than one variable establishing a system of equations performing substitutions and solving
Example (Problem 1) Let p = the number of marbles that Peter has d = the number of marbles that David has and j = the number of marbles that James has Therefore p = 6d and j = 2d p + d + j = 198
3) Trial and error or guess and check
4) Ratio or other arithmetic methods
5) Representationdiagram
Code Response Item ID MFC604A1
Correct Response
11 Response uses Method 1 correctly to solve Problem 1 and get the correct answers
12 Response uses Method 2 correctly to solve Problem 1 and get the correct answers
13 Response uses Method 3 correctly to solve Problem 1 and get the correct answers
14 Response uses Method 4 correctly to solve Problem 1 and get the correct answers
15 Response uses Method 5 correctly to solve Problem 1 and get the correct answers
19Response uses a correct but different method from those listed above to solve Problem 1 and get the correct answers
Incorrect Response
70Response uses one of Methods 1 to 5 to solve Problem 1 but arrives at an incorrect answer or cannot complete the solution because of a computation or algebra error
71Response uses a correct but different method from those listed above to solve Problem 1 but arrives at an incorrect answer or cannot complete the solution because of a computation or algebra error
79 Other incorrect response (including crossed out erased illegible or off-task responses and stray marks)
No Response
99 Blank
43
Code Response Item ID MFC604A2
Correct Response
11 Response uses Method 1 to solve Problem 2
12 Response uses Method 2 to solve Problem 2
13 Response uses Method 3 to solve Problem 2
14 Response uses Method 4 to solve Problem 2
15 Response uses Method 5 to solve Problem 2
19Response uses a correct but different method from those listed above to solve Problem 2 and get the correct answers
Incorrect Response
70Response uses one of Methods 1 to 5 to solve Problem 2 but arrives at an incorrect answer or cannot complete the solution because of a computation or algebra error
71Response uses a correct but different method from those listed above to solve Problem 2 but arrives at an incorrect answer or cannot complete the solution because of a computation or algebra error
79 Other incorrect response (including crossed out erased illegible or off-task responses and stray marks)
No Response
99 Blank
Overall Problem 1 was easy to solve for Canadian future teachers with 85 getting the correct response The majority of respondents (53) used Method 1 to solve Problem 1 and 29 used Method 2 Problem 2 was of medium difficulty for Canadian future teachers with 65 getting a right answer Sixteen per cent of future teachers used one of the five methods listed to solve Problem 2 but made a computation or algebra error (code 70)
44
Example 2
Label MFC610Item type Multiple choiceDimension Mathematics Content KnowledgeDomain NumberSub-domain Knowing
Determine whether each of the following is an irrational number always sometimes or never
Check one box in each row
Always Sometimes Never
A The result of dividing the circumference of a circle by its diameter
65 26 09
B The diagonal of a square with side of length 1
75 11 14
C Result of dividing 22 by 7 66 06 28
Canadian future teachers had some difficulty identifying the characteristics of irrational numbers Only 28 of respondents knew that dividing 22 by 7 never results in an irrational number possibly confusing this fraction with π which is irrational
45
Example 3
Label MFC704Item type Constructed responseDimension Mathematics Content KnowledgeDomain GeometrySub-domain Applying
On the figure ABCD is a parallelogram ang BAD = 60˚ AM and BM are angle bisectors of angles BAD and ABC respectively If the perimeter of ABCD is 6 cm find the sides of triangle ABM
Write your answers on the lines below
AB = _______ cm
AM = _______ cm
BM = _______ cm
Scoring Guide
Code Response Item ID MFC704
Correct Response
20
Response indicates all three correct entries belowAB = 2 cmAM = radic3 cm or equivalentBM = 1 cm
Partially Correct Response
10 Response indicates any two correct entries and one incorrect (or blank) entry
11 Response indicates any one correct entry and two incorrect (or blank) entries
Incorrect Response
79 Incorrect mathematical statements or statements of no value (including crossed out erased illegible or off-task responses and stray marks)
No Response
99 Blank
This was a difficult question for Canadian future teachers with only 41 giving all three correct responses Another 14 had two correct responses and 8 had one correct response This means that 37 of respondents could not find any of the three measures of the triangle
D
A B
M C
46
Example 4
Label MFC705Item type Multiple choiceDimension Mathematics Content KnowledgeDomain GeometrySub-domain Knowing
We know that there is only one point on the real line that satisfies the equation 3x = 6 namely x = 2
Suppose now that we consider this same equation in the plane with coordinates x and y and then in space with coordinates x y and z What does the set of points that satisfy the equation 3x = 6 look like in these settings
Check one box in each row
One point One line One plane Other
A The solution to 3x = 6 in the plane 22 69 08 01
B The solution to 3x = 6 in space 14 09 71 07
This geometry question was moderately difficult for Canadian future teachers with about 70 of respondents knowing that the proposed solution would look like one line in the plane and one plane in space
- Table of Contents
- List of Figures
- What is TEDS-M 2008
- Research design and methodology for TEDS-M
- What is to be learned from TEDS-M
- What value will TEDS-M add to existing research on teacher education
- Target populations
- Components of TEDS-M
-
- Component 1 studies of teacher-education policies for elementary and lower-secondary mathematics teachers and their cultural and social contexts
- Component 2 studies of elementary and lower-secondary mathematics teacher-preparation routes programs standards and expectations for teacher learning
- Component 3 studies of the mathematics and related teaching knowledge of future elementary and lower-secondary school teachers
-
- Participating countries in TEDS-M
- The Canadian administration
- Structure and organization of teacher education in Canada
- Programs in specific jurisdictions
-
- Ontario
- Quebec
- Nova Scotia
- Newfoundland and Labrador
-
- The administration of the TEDS-M survey in Canada
-
- Representation at international meetings
- Adaptation translation and approval of assessment and questionnaire materials
-
- Sampling institutions
-
- Contacting institutions and sending and collecting materials
- Quality monitoring
- Coding
-
- Description of teacher-education courses and collection and coding of syllabi
- Coding of mathematics content knowledge and mathematics pedagogical content knowledge
-
- Results
-
- Institutional Program Questionnaire
- Survey for Mathematics Mathematics Pedagogy and General Pedagogy Educators
- Survey for Future Teachers of Lower-Secondary Mathematics
- Survey for Future Teachers of Primary Elementary Mathematics
-
- Conclusion
- References
- Figures
-
- Figure 1enspMean scores and confidence intervals for participating countriesmdashElementary-level future teachers mathematics content knowledge
- Figure 2enspMean scores and confidence intervals for participating countriesmdashElementary-level future teachers pedagogy content knowledge
- Figure 3enspMean scores and confidence intervals for participating countriesmdashLower-secondary-level future teachers mathematics content knowledge
- Figure 4enspMean scores and confidence intervals for participating countriesmdashLower-secondary-level future teachers pedagogy content knowledge
- Figure 5enspMean scores and confidence intervals by gender primary mathematics knowledge
- Figure 6enspMean scores and confidence intervals by gender primary pedagogical knowledge
- Figure 7enspMean scores and confidence intervals by gender lower-secondary mathematics knowledge
- Figure 8enspMean scores and confidence intervals by gender lower-secondary mathematics knowledge
-
- Appendices
-
- APPENDIX I
-
- Sample Syllabus Coding
-
- APPENDIX II
-
- Examples of assessment items in the Primary General Pedagogy Knowledge for Teaching section of the Future Teacher Questionnaire
- Examples of assessment items in the Secondary General Pedagogy Knowledge for Teaching section of the Future Teacher Questionnaire
-

36
Example 2
Label MFC108Item type Multiple choiceDimension Mathematics Pedagogical Content KnowledgeDomain AlgebraSub-domain Enacting
Amy is building a sequence of geometric figures with toothpicks by following the pattern shown below Each new figure has one extra triangle
Variable t denotes the position of a figure in the sequence
In finding a mathematical description of the pattern Amy explains her thinking by saying I use three sticks for each triangle
Then I see that I am counting one stick twice for each triangle except the last one so I have to remove those
Variable n represents the total number of toothpicks used in a figure
Which of the equations below best represent Amyrsquos statement in algebraic notation
Check one box
A n = 2t + 1 29
B n = 2(t + 1) ndash 1
26
C n = 3t ndash (t ndash1)
36
D n = 3t + 1 ndash t
08
This question was difficult for Canadian future teachers with almost two-thirds of the respondents unable to identify the correct algebraic notation for this pattern
t = 1 t = 2 t = 3
hellip
37
Example 3
Label MFC202Item type Multiple choiceDimension Mathematics Content KnowledgeDomain AlgebraSub-domain Knowing
Indicate whether each of the following statements is true for the set of all whole numbers a b and c greater than zero
Check one box in each row
True Not True
A a ndash b = b ndash a
16
84
B a divide b = b divide a
06
95
C (a + b) + c = a + (b + c)
93
07
D (a ndash b) ndash c = a ndash (b ndash c)
23
77
ThisalgebraquestionwasrelativelyeasyforCanadianfutureteachersHoweveralmostone-quarter of the respondents did not know that the fourth statement was not true even though the question appeared to be relatively easy to solve with whole numbers
38
Example 4
Label MFC203Item type Multiple choiceDimension Mathematics Content Knowledge Domain GeometrySub-domain Applying
A rectangular-shaped swimming pool has a paved walkway (shaded) around it as shown
What is the area of the walkway
Check one box
A 100 m2
04
B 161 m2
06
C 710 m2
78
D 1610 m2
12
This question was relatively easy for Canadian respondents with 78 getting the correctanswerHowever12calculatedtheentireareabutfailedtosubtractthearea of the swimming pool
70 m
50 m
18 m 23 mPool
not to scale
Walkway
39
Example 5
Label MFC206Item type Constructed responseDimension Mathematics Content Knowledge Domain NumberSub-domains Applying Planning
a) Amachineuses24litresoffuelforevery30hoursofoperationHowmanylitresoffuel will the machine use in 100 hours if it continues to use fuel at the same rate
Check one box
A 72
11
B 80
79
C 84
08
D 96
02
This question was relatively easy for Canadian respondents with almost 80 getting thecorrectresponseHoweveroneinfiverespondentsdidmakeacalculationerrorwhen solving this simple problem
b) Create a different problem of the same type as the problem in (a) (same processesoperations) that is EASIER for primary children to solve
40
Scoring Guide
Code Response Item MFC206B
Correct Response
10
A different problem of the same type (same processesoperations) but easier to solveExamples
bull Amachineuses3litresoffuelforevery30hoursofoperationHowmanylitres of fuel will the machine use in 100 hours
bull Acaruses24litresoffuelforevery50kmHowmanylitresoffuelwillthe car use in 100 km
Incorrect Response
70
A different problem of the same type (same processesoperations) but NOT easier to solve (Note Items judged to be of the same level of difficulty are NOT easier)Examples
bull Amachineuses2litresoffuelforevery30hoursofoperationHowmanylitres of fuel will the machine use in 100 hours (2 is not divisible by 3)
bull Atapdrips2litresofwatereverydayHowmanymlisthispersecond(The metric knowledge required and the computational load are significantly higher)
79
Other incorrect response (including crossed out erased illegible or off-task responses and stray marks)Examples
bull questionsthatarenotmeaningfulorhavenoanswer
No Response
99 Blank
About 84 of Canadian future teachers were able to create a problem of the same type but that was easier to solve Nine per cent of respondents created a similar problem but that was not easier to solve
41
examples of assessment items in the secondary general pedagogy Knowledge for teaching section of the future teacher Questionnaire
Example 1
Label MFC604Item type Constructed responseDimension Mathematics Content KnowledgeDomain AlgebraSub-doman Applying
The following problems appear in a mathematics textbook for lower secondary schools
1 Peter David and James play a game with marbles They have 198 marbles altogether Peter has 6 times as many marbles as David and James has 2 times as many marbles asDavidHowmanymarblesdoeseachboyhave
2 Three children Wendy Joyce and Gabriela have 198 zeds altogether Wendy has 6timesasmuchmoneyasJoyceand3timesasmuchasGabrielaHowmanyzedsdoes each child have
(a) Solve each problem
Solution to Problem 1
Solution to Problem 2
42
Scoring Guide
Note The correct answers to MFC604A1 and MFC604A2 are as follows
Problem 1 David has 22 marbles Peter has 132 marbles and James has 44 marbles
Problem 2 Wendy has 132 zeds Joyce has 22 zeds and Gabriela has 44 zeds
The following methods are considered in the scoring guide
1) Usingone variable setting up one equation and solving
Example (Problem 1) Let m = the number of marbles that David has Then Peter has 6m and James has 2m Therefore 6m + 2m + m = 198 and m = 22
2) Usingmore than one variable establishing a system of equations performing substitutions and solving
Example (Problem 1) Let p = the number of marbles that Peter has d = the number of marbles that David has and j = the number of marbles that James has Therefore p = 6d and j = 2d p + d + j = 198
3) Trial and error or guess and check
4) Ratio or other arithmetic methods
5) Representationdiagram
Code Response Item ID MFC604A1
Correct Response
11 Response uses Method 1 correctly to solve Problem 1 and get the correct answers
12 Response uses Method 2 correctly to solve Problem 1 and get the correct answers
13 Response uses Method 3 correctly to solve Problem 1 and get the correct answers
14 Response uses Method 4 correctly to solve Problem 1 and get the correct answers
15 Response uses Method 5 correctly to solve Problem 1 and get the correct answers
19Response uses a correct but different method from those listed above to solve Problem 1 and get the correct answers
Incorrect Response
70Response uses one of Methods 1 to 5 to solve Problem 1 but arrives at an incorrect answer or cannot complete the solution because of a computation or algebra error
71Response uses a correct but different method from those listed above to solve Problem 1 but arrives at an incorrect answer or cannot complete the solution because of a computation or algebra error
79 Other incorrect response (including crossed out erased illegible or off-task responses and stray marks)
No Response
99 Blank
43
Code Response Item ID MFC604A2
Correct Response
11 Response uses Method 1 to solve Problem 2
12 Response uses Method 2 to solve Problem 2
13 Response uses Method 3 to solve Problem 2
14 Response uses Method 4 to solve Problem 2
15 Response uses Method 5 to solve Problem 2
19Response uses a correct but different method from those listed above to solve Problem 2 and get the correct answers
Incorrect Response
70Response uses one of Methods 1 to 5 to solve Problem 2 but arrives at an incorrect answer or cannot complete the solution because of a computation or algebra error
71Response uses a correct but different method from those listed above to solve Problem 2 but arrives at an incorrect answer or cannot complete the solution because of a computation or algebra error
79 Other incorrect response (including crossed out erased illegible or off-task responses and stray marks)
No Response
99 Blank
Overall Problem 1 was easy to solve for Canadian future teachers with 85 getting the correct response The majority of respondents (53) used Method 1 to solve Problem 1 and 29 used Method 2 Problem 2 was of medium difficulty for Canadian future teachers with 65 getting a right answer Sixteen per cent of future teachers used one of the five methods listed to solve Problem 2 but made a computation or algebra error (code 70)
44
Example 2
Label MFC610Item type Multiple choiceDimension Mathematics Content KnowledgeDomain NumberSub-domain Knowing
Determine whether each of the following is an irrational number always sometimes or never
Check one box in each row
Always Sometimes Never
A The result of dividing the circumference of a circle by its diameter
65 26 09
B The diagonal of a square with side of length 1
75 11 14
C Result of dividing 22 by 7 66 06 28
Canadian future teachers had some difficulty identifying the characteristics of irrational numbers Only 28 of respondents knew that dividing 22 by 7 never results in an irrational number possibly confusing this fraction with π which is irrational
45
Example 3
Label MFC704Item type Constructed responseDimension Mathematics Content KnowledgeDomain GeometrySub-domain Applying
On the figure ABCD is a parallelogram ang BAD = 60˚ AM and BM are angle bisectors of angles BAD and ABC respectively If the perimeter of ABCD is 6 cm find the sides of triangle ABM
Write your answers on the lines below
AB = _______ cm
AM = _______ cm
BM = _______ cm
Scoring Guide
Code Response Item ID MFC704
Correct Response
20
Response indicates all three correct entries belowAB = 2 cmAM = radic3 cm or equivalentBM = 1 cm
Partially Correct Response
10 Response indicates any two correct entries and one incorrect (or blank) entry
11 Response indicates any one correct entry and two incorrect (or blank) entries
Incorrect Response
79 Incorrect mathematical statements or statements of no value (including crossed out erased illegible or off-task responses and stray marks)
No Response
99 Blank
This was a difficult question for Canadian future teachers with only 41 giving all three correct responses Another 14 had two correct responses and 8 had one correct response This means that 37 of respondents could not find any of the three measures of the triangle
D
A B
M C
46
Example 4
Label MFC705Item type Multiple choiceDimension Mathematics Content KnowledgeDomain GeometrySub-domain Knowing
We know that there is only one point on the real line that satisfies the equation 3x = 6 namely x = 2
Suppose now that we consider this same equation in the plane with coordinates x and y and then in space with coordinates x y and z What does the set of points that satisfy the equation 3x = 6 look like in these settings
Check one box in each row
One point One line One plane Other
A The solution to 3x = 6 in the plane 22 69 08 01
B The solution to 3x = 6 in space 14 09 71 07
This geometry question was moderately difficult for Canadian future teachers with about 70 of respondents knowing that the proposed solution would look like one line in the plane and one plane in space
- Table of Contents
- List of Figures
- What is TEDS-M 2008
- Research design and methodology for TEDS-M
- What is to be learned from TEDS-M
- What value will TEDS-M add to existing research on teacher education
- Target populations
- Components of TEDS-M
-
- Component 1 studies of teacher-education policies for elementary and lower-secondary mathematics teachers and their cultural and social contexts
- Component 2 studies of elementary and lower-secondary mathematics teacher-preparation routes programs standards and expectations for teacher learning
- Component 3 studies of the mathematics and related teaching knowledge of future elementary and lower-secondary school teachers
-
- Participating countries in TEDS-M
- The Canadian administration
- Structure and organization of teacher education in Canada
- Programs in specific jurisdictions
-
- Ontario
- Quebec
- Nova Scotia
- Newfoundland and Labrador
-
- The administration of the TEDS-M survey in Canada
-
- Representation at international meetings
- Adaptation translation and approval of assessment and questionnaire materials
-
- Sampling institutions
-
- Contacting institutions and sending and collecting materials
- Quality monitoring
- Coding
-
- Description of teacher-education courses and collection and coding of syllabi
- Coding of mathematics content knowledge and mathematics pedagogical content knowledge
-
- Results
-
- Institutional Program Questionnaire
- Survey for Mathematics Mathematics Pedagogy and General Pedagogy Educators
- Survey for Future Teachers of Lower-Secondary Mathematics
- Survey for Future Teachers of Primary Elementary Mathematics
-
- Conclusion
- References
- Figures
-
- Figure 1enspMean scores and confidence intervals for participating countriesmdashElementary-level future teachers mathematics content knowledge
- Figure 2enspMean scores and confidence intervals for participating countriesmdashElementary-level future teachers pedagogy content knowledge
- Figure 3enspMean scores and confidence intervals for participating countriesmdashLower-secondary-level future teachers mathematics content knowledge
- Figure 4enspMean scores and confidence intervals for participating countriesmdashLower-secondary-level future teachers pedagogy content knowledge
- Figure 5enspMean scores and confidence intervals by gender primary mathematics knowledge
- Figure 6enspMean scores and confidence intervals by gender primary pedagogical knowledge
- Figure 7enspMean scores and confidence intervals by gender lower-secondary mathematics knowledge
- Figure 8enspMean scores and confidence intervals by gender lower-secondary mathematics knowledge
-
- Appendices
-
- APPENDIX I
-
- Sample Syllabus Coding
-
- APPENDIX II
-
- Examples of assessment items in the Primary General Pedagogy Knowledge for Teaching section of the Future Teacher Questionnaire
- Examples of assessment items in the Secondary General Pedagogy Knowledge for Teaching section of the Future Teacher Questionnaire
-
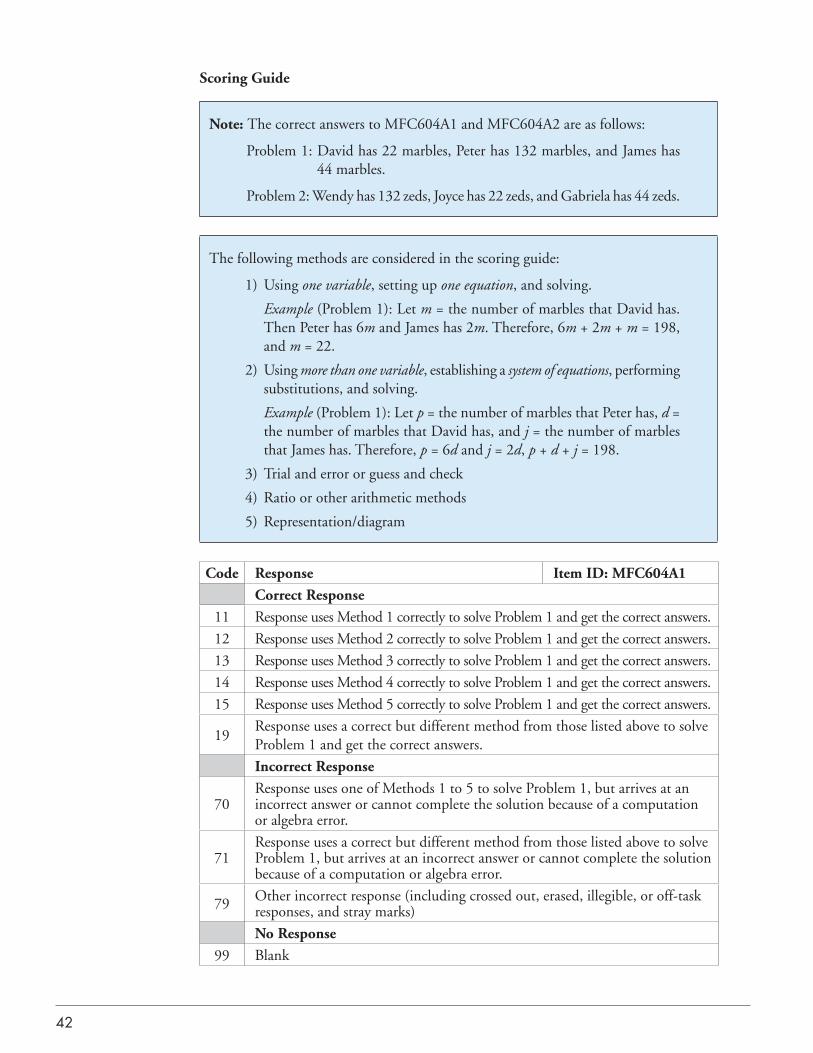