teacher education accreditation council (teac)epp.byu.edu/standards-pdfs/2009/2-teac audit report...
TRANSCRIPT

Teacher Education Accreditation Council (TEAC)
©TEAC One Dupont Circle Suite 320 Washington, DC 20036 202/466-7236 www.teac.org
1
TEAC Audit Report Brigham Young University
Educator Preparation Program Provo, Utah
April 7-10, 2009
Audit team members: Diana W. Rigden, Executive Vice President, Teacher Education Accreditation
Council, Washington, DC Jerusalem Rivera-Wilson, Senior Faculty Associate and Director of Clinical Training
and Field Experiences, University at Albany, SUNY, Albany, NY Nedra Call, Curriculum Director, Nebo School District, Springville, Utah Linda Alder, Education Specialist, Educator Quality and Licensing, Utah Office of
Education, Salt Lake City, UT Observer: Sydnee Dickson, Director, Educator Quality and Licensing, Utah Office of Education,
Salt Lake City, UT Brief authors: Members of the Education Preparation Program:
Nancy Wentworth, Associate Dean Marie Tuttle, Professor Al Merkley, Assistant Dean/Controller M. Winston Egan, Chair, Teacher Education Janet Young, Associate Chair, Teacher Education Kendra Hall, Director, Early Childhood Tina Dyches, Director, Special Ed
Charles Graham, Assistant Professor, IP&T Aaron Popham, Technical & Data Policy Development Coordinator Gary Kramer, Director, Data Analysis Coral Hansen, Measurement Specialist Jay Oliver, Director, MSE Student Services
Faculty approval of the Inquiry Brief: EPP faculty who teach education licensure courses in any relevant college and department were emailed this version of the Brief on March 18, 2009 and asked to read it and sign an approval statement located in their Dean’s Office before April 1, 2009.
Teacher Education Accreditation Council (TEAC)
©TEAC One Dupont Circle Suite 320 Washington, DC 20036 202/466-7236 www.teac.org
2
I. Introduction
Summary of the Case Brigham Young University
Educator Preparation Program1 April 7-10, 2009
The Summary of the Case is written by the auditors and approved by program faculty. The Summary reflects the auditors’ understanding of the case the faculty makes for accreditation.
Authorship and approval of the Inquiry Brief: The Inquiry Brief was prepared by members of the Educator Preparation Committee (Nancy Wentworth, Marie Tuttle, Al Merkley, M. Winston Egan, Janet Young, Kendra Hall, Tina Dyches, Charles Graham, Aaron Popham, Gary Kramer, Coral Hansen, and Jay Oliver). It was approved by the University Committee on Teacher Education on January 15, 2009; the Secondary Education Committee on January 23, 2009; the Department of Counseling, Psychology and Special Education on February 10, 2009; and the Department of Teacher Education on February 12, 2009. On March 18, 2009, the Inquiry Brief was emailed to all EPP faculty who teach educator licensure courses and they were asked to sign an approval statement before April 1, 2009. Introduction: Brigham Young University (BYU), a private institution sponsored by The Church of Jesus Christ of Latter-day Saints, is located 45 miles south of Salt Lake City, on a 600-acre campus in Provo, Utah. Founded under the direction of Brigham Young in 1875 as a small parochial normal school, BYU has since grown into the largest privately owned church-related university in the United States, with approximately 33,000 students, 1,300 full-time faculty, and 900 part-time faculty2. Initially accredited by NCATE in 1954 as the “College of Education,” the name and many administrative aspects of the college were changed to the David O. McKay School of Education (MSE) in 1996. In 2003, the Educator Preparation Program (EPP) was formed to build strong collaboration among the School of Education, the public schools, and the arts and sciences departments of the university, and to serve as the accreditation unit. One of the largest teacher preparation programs in the nation, the EPP consists of eight colleges and 21 departments, only three of which are under the umbrella of the School of Education. (These are licensure areas in Early Childhood Education, Elementary Education, and Special Education.) The governing body of the EPP is the University Council on Teacher Education (UCOTE), led by the Associate Academic Vice President for Undergraduate Studies and the Dean of Education and consisting of deans or associate deans of nine colleges at BYU, the executive director of the BYU/public school partnership, and the chair of the department of teacher education.
1The Educator Preparation Program includes undergraduate options in early childhood, elementary,
secondary, and special education, and Utah, following to its own policies and regulations, may grant teaching licenses in these areas to the program’s graduates. 2Demographic information comes from “Y Facts” on the www.BYU.edu website, 3/23/09.

Teacher Education Accreditation Council (TEAC)
©TEAC One Dupont Circle Suite 320 Washington, DC 20036 202/466-7236 www.teac.org
3
The EPP Executive Council meets twice a month to monitor program quality. The Inquiry Brief includes undergraduate educator preparation in Early Childhood Education, Elementary Education, and Special Education (in the McKay School of Education) and Secondary Education (with majors or minors from 32 different academic disciplines). In the 2007-08 academic year, there were 85 full-time tenure-track faculty, 21 clinical faculty, and 24 instructors and adjunct faculty (for a total of 130 faculty); 107 students majored in Early Childhood Education; 507 majored in Elementary Education; and 110-111 majored in Special Education. In Secondary Education, there are 1,219 students with a major in an academic discipline (history has 203; mathematics has 189; and English has 171), and 324 students with a minor in an academic discipline. A total of 2,267 or 2,268 students are currently in EPP. The program had 1,110 graduates in 2007-08: 42 in Early Childhood Education, 262 in Elementary Education, 55 in Special Education, and 751 in Secondary Education. The educational goal of the Educator Preparation Program, like that of the university, is to blend academic excellence and moral/ethical character development. The program has adopted the framework of the four moral dimensions of teaching as defined by John Goodlad and others (1990, 1994) to help it meet this goal: (a) enculturation for democracy, (b) access to knowledge, (c) nurturing pedagogy, and (d) stewardship of schools. Program claims: The program’s four claims are embedded in the four Moral Dimensions of Teaching with expectations for how students will demonstrate their mastery of these broad goals.
1. Enculturation for democracy: Candidates design instruction and create learning environments to engage students in critical thinking, problem solving, communicating respectfully, and modeling civility.
2. Access to knowledge: Candidates know the subject(s) they will teach and design instruction to promote learning for all students.
3. Nurturing pedagogy: Candidates know how to design and implement lessons to support the intellectual, social, and personal development of students; how to assess students on their learning and progress; and how teach in a caring manner.
4. Stewardship for schools: Candidates collaborate with colleagues, parents, and community representatives to improve teaching and learning.
The program claims align with TEAC’s quality principles and cross-cutting themes, the INTASC standards, and Utah licensure requirements. Evidence supporting the claims: Evidence that candidates meet the EPP claims comes from five sources. (1) Clinical Practice Assessment System (CPAS) Claims 1, 2, 3, and 4; QP1.1, 1.2,
1.3, Learning How to Learn, Multicultural Perspectives, and Technology Based on the 10 INTASC standards, the Clinical Practice Assessment System is used by university supervisors and mentor teachers to rank candidates on a

Teacher Education Accreditation Council (TEAC)
©TEAC One Dupont Circle Suite 320 Washington, DC 20036 202/466-7236 www.teac.org
4
1 (emerging) to 5 (exceptional) scale and to write a narrative description of the candidate’s strengths and weaknesses. In a comprehensive set of eleven tables, faculty reported means that ranged between 3.13 to 5.00 on various CPAS elements related to the program’s claims.
(2) Teacher Work Samples (TWS) Claims 2, 3, and 4, QP1.1,1.2, 1.3, Learning How
to Learn, Multicultural Perspectives, Technology The Teacher Work Sample is the capstone assignment for all candidates except special education and is assessed by faculty teams, using rubrics adapted from the Renaissance Partnership for Improving Teacher Quality (2001), in terms of seven elements: contextual factors, learning goal and objectives, assessment plan, design for instruction, instructional decision-making, report of student learning, and reflection and self-evaluation. In a comprehensive set of eleven tables, faculty reported means that ranged between 2.33 to 5.00 on various TWS elements related to the program’s claims. Students in Special Education Mild/Moderate and Severe have been assessed by a teaching portfolio and that data is unavailable in the Inquiry Brief. Beginning with the Fall 2009 students, Special Education will report results from the Teacher Work Sample assessment.
(3) Candidate Disposition Scales (CDS) Claims 2 and 4, QP1.3, Multicultural
Perspectives The Candidate Disposition Scale is administered to students at entry into the program and asks them to report on their responsibility to develop as a candidate and improve the learning of their students, their aspirations and commitment to teaching, and their views regarding diverse students. In a comprehensive set of eleven tables, faculty reported means that ranged between 2.34 to 4.82 on the three CDS elements related to the program’s claims.
(4) Praxis II licensure tests Claim 2, QP 1.1
Students applying for teaching licenses in four program options take Praxis II licensure tests, and faculty report that mean scores meet or exceed the Utah passing scores for all tests.
(5) GPA in the major Claim 2, QP1.1
Students are required to have a 2.85 GPA when they apply for student teaching. The major GPA does not include grades from general education courses. Faculty report means for students in all program options that range from 3.21-3.87.
Indirect measures of candidate work include completion of program requirements, responses to the BYU Senior Survey, BYU Alumni Survey, and the Employer Survey created by Educational Benchmarks Inc. (EBI). In addition, the Professional and

Teacher Education Accreditation Council (TEAC)
©TEAC One Dupont Circle Suite 320 Washington, DC 20036 202/466-7236 www.teac.org
5
Interpersonal Behavior Scale (PIBS) is required in some classes and alerts faculty to potential problems that may initiate remediation. Internal audit: Members of the EPP Executive Committee designed the Quality Control System map and conducted an internal academic audit to review program requirements, policies, and practices. Reviewing material from at least 10% of the candidates in each program option, they examined:
the syllabi and assignments in courses required for licensure;
faculty hiring and promotion, evaluation, and professional development;
candidate files with admission, advising, and assessment data;
facilities and resources. The faculty determined through their internal audit that there was a lack of continuity between the candidates’ hard copy folder and the various databases used by the various departments of the EPP. The program is in the process of exporting data to a new database that will allow better access. Plan for program improvement: The faculty has begun to track students who express an early interest in education and determine ways to encourage them to enter the program. The EPP Executive Committee will continue to review program data and refine the assessment system on a regular basis and is in the process of revising the disposition instruments. In addition, BYU is working with other educator licensure programs in Utah to create a uniform instrument to be used by principals to evaluate teachers in their first, third, and fifth years of teaching. Evidence of commitment and capacity 4.1 Curriculum: All program options are state-approved, and the number of credits
required for a degree is slightly higher than those required by other majors because of the professional education component that includes student teaching hours.
4.2 Faculty: The faculty have approved the Inquiry Brief and accepted the goals described therein; faculty are appropriately qualified for their instructional assignments.
4.3 Facilities: Classrooms, faculty offices, and college equipment and supplies are sufficient and adequate.
4.4 Fiscal & Administrative Capacity: The financial condition of the university is sound and the institution is financially viable. The EPP invests in faculty support and development and EPP faculty’s workload obligations are commensurate with those at the university.
4.5 Student Support Services: Services particular to program students include department and college advisement centers, and career placement advisors. BYU provides additional services including technology support in every classroom, computer labs, library and media services, college store, dining hall, health and medical services, center for conflict resolution, international and multicultural services, tutoring, among others.

Teacher Education Accreditation Council (TEAC)
©TEAC One Dupont Circle Suite 320 Washington, DC 20036 202/466-7236 www.teac.org
6
4.6 Recruiting and admissions practices, academic calendars, catalogs, publications, grading and advertising: The program actively recruits students to select teaching as a profession, assigning mentors who are juniors or seniors in the program to incoming freshman interested in education. Calendars, grading policies, charges and refund policies, and academic credentials of faculty and administrators are reported in the catalog and on the website.
4.7 Student Feedback: The university has a formal grievance procedure, and each department and college is required to keep a file of student feedback and complaints.
The faculty concluded that Brigham Young University and the McKay School of Education are committed to the Educator Preparation Program. Acceptance of the Summary of the Case The Brigham Young University education faculty approved the TEAC team’s summary of the Inquiry Brief on April 9, 2009. Audit logistics The audit team met with the authors of the Inquiry Brief in McKay School of Education, Room 305; conducted its work in the Document Room; and held interviews in the McKay School of Education, the Hinckley Conference Center, and the Smoot Administration Building. Audit Opinion: The Inquiry Brief from Brigham Young University was accurate with 97% of the targets investigated verified and only 20% of the targets overall containing trivial and inconsequential errors. Owing to 97% verified targets, the Brief received a clean audit opinion and was found to be accurate and trustworthy. The auditors also concluded that the evidence supports the view that Brigham Young University is committed to the Educator Preparation Program.
Teacher Education Accreditation Council (TEAC)
©TEAC One Dupont Circle Suite 320 Washington, DC 20036 202/466-7236 www.teac.org
7
II. Method of the Audit
The TEAC staff and the auditors selected a number of targets in the Inquiry Brief and crafted tasks that were designed to verify these targets. (A target is any aspect of the Brief, such as text, data, or a figure, which is related to any of TEAC’s principles and standards.) The auditors also had instructions from the TEAC staff to corroborate some of the evidence in the Brief. In addition, while on site, the auditors created other audit tasks and follow-up audit tasks. With regard to any one component of the TEAC system, the auditors employ a range of tasks. Typically, the auditors will attempt to clarify the meaning of targets in the Brief that are unclear to them and to examine the precision of targets that they may suspect are unclear to the Brief’s authors. Most tasks are straightforward probes designed to verify or confirm the target (e.g. recalculating figures, interviewing informants, examining catalogs, policy manuals). Some tasks reconcile other representations of the same target in the Brief for internal consistency (e.g., the figures in two tables on the same point, restatements of the target in other places of the Brief). A few audit tasks seek to corroborate (or in some cases disconfirm) the target by examination of evidence not cited in the Brief, but could be thought to be related to what was cited in the Brief. Typically the auditors corroborate the evidence in the Brief by new or extended statistical analyses of the evidence cited in the Brief and related evidence outside the Brief (e.g., on-site and on-line surveys of key informants). The auditors will also, whenever it is possible and feasible, examine the primary source for any target (e.g., the actual rating or survey forms, formal documents, student portfolios, artifacts, roll & grade books, classroom facilities, budgets, correspondence, etc).
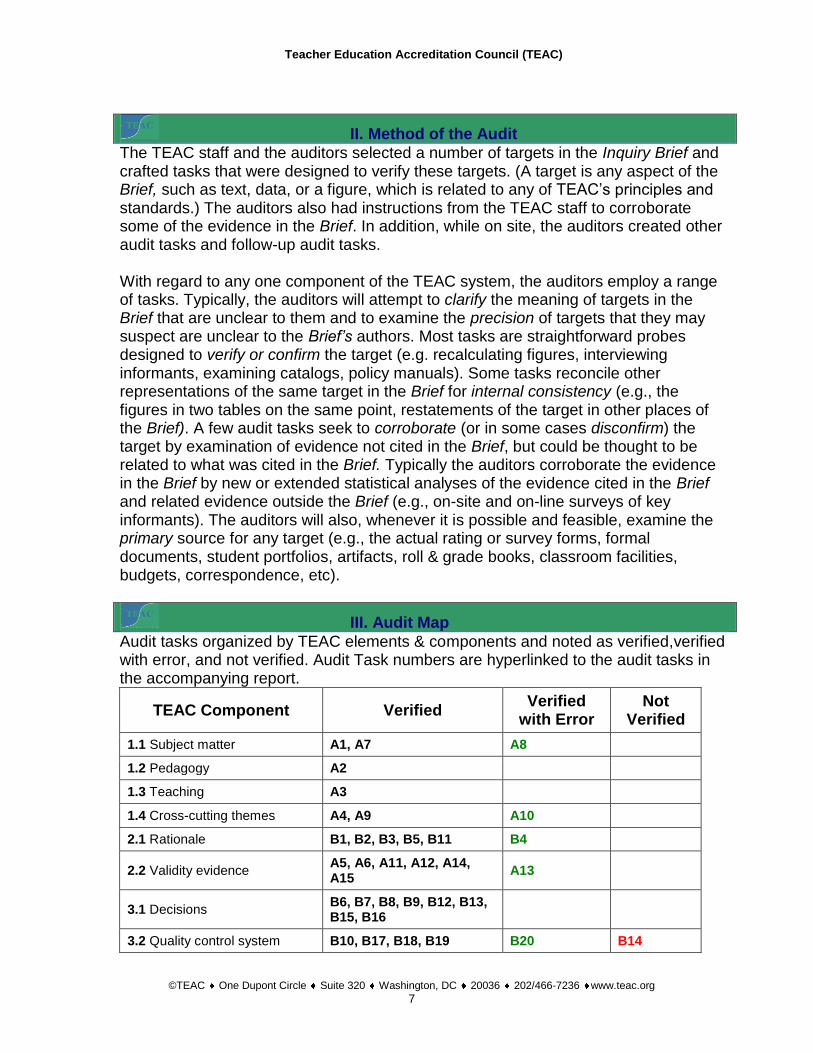
III. Audit Map
Audit tasks organized by TEAC elements & components and noted as verified,verified with error, and not verified. Audit Task numbers are hyperlinked to the audit tasks in the accompanying report.
TEAC Component Verified Verified
with Error Not
Verified
1.1 Subject matter A1, A7 A8
1.2 Pedagogy A2
1.3 Teaching A3
1.4 Cross-cutting themes A4, A9 A10
2.1 Rationale B1, B2, B3, B5, B11 B4
2.2 Validity evidence A5, A6, A11, A12, A14, A15
A13
3.1 Decisions B6, B7, B8, B9, B12, B13, B15, B16
3.2 Quality control system B10, B17, B18, B19 B20 B14

Teacher Education Accreditation Council (TEAC)
©TEAC One Dupont Circle Suite 320 Washington, DC 20036 202/466-7236 www.teac.org
8
IV. Audit Findings
The audit findings consist of clarification task responses and audit task findings. Both clarification tasks and audit tasks consist of a target from the Brief and a probe about that target. Clarification tasks are questions asked prior to the audit so that the audit team has a clear understanding of those aspects of the program that needed information supplementary to the Brief. The audit tasks are associated with specific components of the TEAC system, which are denoted in parentheses following the task number.
Clarification Tasks
The tasks with italicized findings were sent to the program before the audit visit, with these instructions: Please respond to the questions and comments below as if you were responding orally upon hearing them. Only a sentence or two should be needed to clarify the point being raised in the item. In some cases only word or two, or a number or two, are needed. The program’s responses to these clarification questions are in italics. If the auditors followed up with additional probes, the citation for the follow-up task is noted. Clarification Question 1a: Tables 12-22 in the Results section of the Inquiry Brief (pages 38-59) report means from the Clinical Practice Assessment System (CPAS), Teacher Work Sample (TWS) and Candidate Disposition Scale (CDS). In Appendix F, only the CPAS assessment has a 1-5 scale, and it is unclear how the means were figured for both the TWS and the CDS. The reported means (in all the tables) range from 3.13-5.0 for the CPAS on a 1-5 scale. The reported means range from 2.33-5.0 for the TWS, but the rubric scales are 1 (indicator not met) to 3 (indicator met (see pages 136-149). Campus Response: TWS had a 1-5 point scale until Fall of 2008 when it went to a 1-3 point scale. I put the most recent TWS rubric in Appendix F not thinking that it had a different scale. Clarification Question 1b:The reported means range from 2.34-4.52 for the CDS, but the three sections of the form that appear in Appendix F (pages 150-152) do not include any rating scale at all. Campus Response:
Section 1 of the CDS has a 1-4 point scale: 1-Strongly disagree, 2-disagree, 3-agree, 4-strongly agree.
Section 2 has a 1-4 point scale: 1-never, 2-sometimes, 3-usually, 4-always
Section 3 has a 1-5 point scale with definitions at 1 and 5 only: 1-not competent, 5-very competent.
Clarification Question 1c:Please explain how the reported means were reached for the TWS and the CDS in these tables. Campus Response: The means were based on the scales described above.

Teacher Education Accreditation Council (TEAC)
©TEAC One Dupont Circle Suite 320 Washington, DC 20036 202/466-7236 www.teac.org
9
Clarification Question 2: The ranges described on pages 61-64 in Section 5 of the Inquiry Brief differ from those reported in the 11 tables. Were the ranges given in Section 5 reached from an alternate data set? Do the ranges for secondary education students reported in Tables 12-15 include the data reported in Tables 16-22? Please describe the relationship of data for secondary education students in the two sets of tables. Campus Response: The Sc Ed [secondary education] data in Tables 12-15 are summary tables calculated for all Sc Ed students as a whole. The data in Tables 16-22 are each done separately for the content area list. Tables 12-15 are a better representation of the averages because the individual areas often have an n=1. If the single student earns a 5.00 on a scale that score becomes the average. The ranges listed in [Section 5 are] for Tables 12-15 in the Brief. Clarification Question 3: No Teacher Work Sample (TWS) data is reported in 2006-07 for Social Science/History, Family/Consumer Science, Art, Theater, Health, PE, French, German, or Biology; and unavailable, or were students in these disciplines not required to complete the Teacher Work Sample? Campus Response: The majority of the TWS samples that are missing were not made available electronically so the stats were not generated automatically by the data team. The PE department sent their hard copy scores to the team and they are in the updated Brief. We will request the hard copy scores from the other content areas and have them for you by the visit. Some content areas had no students where data is missing. See Dance Fall ’06 and Fall ’07, French Fall ’07, and German Fall ’06 and Fall ’07. The good news is that by Winter ’08 all but two programs were reported data in LiveText.™ Art and Math did not report Winter ’08 but Art reported the semester before that and Math only missed Winter ’08. We fell we are data collection for all instruments is improving. Clarification Question 4: Table 6, Key Assessment Implementation, lists the Technology Skills Assessment as a “key assessment,” and Table 11, Program Assessments (page 36), lists the Technology Skills Assessment as an entry-level assessment. Why is the assessment not mentioned in terms of assessing the cross-cutting theme of technology on page 18, and why are no results in the Inquiry Brief? Campus Response: The Technology Skills Assessment is a set of four tasks completed by the candidates as they enter the program. It includes work processing, spreadsheets, presentations, and Internet & communication. See http://education.byu.edu/technology/tsa.html. The candidates must successfully complete each task so that they are ready to take the technology course. The Technology Lab keeps track of the number of times it takes for candidates to successfully complete each task – but it has been only once nearly 100% of the time. Candidate scores are available but we don’t use them to assess the candidates at the end of their program. Clarification Question 5: On page 31, the Inquiry Brief states that “data collected from the assignments and assessment instruments through the LiveText™ system will

Teacher Education Accreditation Council (TEAC)
©TEAC One Dupont Circle Suite 320 Washington, DC 20036 202/466-7236 www.teac.org
10
be examined on a regular basis.” A list the assessment instruments described in the Inquiry Brief appears below. Please indicate whether data from these assessments is recorded in LiveText.™
Table CQ6: Data Recorded in LiveText™
Assessment Recorded in LiveText™ Yes No
Praxis II licensing exam X This is listed in the student File Maker Pro data base.
Clinical Practice Assessment System (CPAS) X
Teacher Work Sample (TWS) X
Teaching Portfolio (Special Ed students) X This fall when Sp Ed starts using the common TWS they will submit it on
LiveText™. Candidate Dispositional Scales (CDS) X
Professional Interpersonal Behavior Scales (PIBS)
X We have put this in LiveText but now that it is used for a red flag only
we don’t require it on LiveText™.
Technology Skills Assessment (TSA) X Not reported in student files.
Field Experience Demographics (FED) X
CPSE 400 Case Study (Special Ed students) X This was a key assessment for Sp Ed but not across the whole EPP program so it was not required to be
submitted in LiveText.™
[See Audit Task B1 for more on LiveText.] Clarification Question 6: Table 23 (page 62) presents the frequency of percentages of candidates passing Praxis II. The explanation cites individuals who scored in the three lowest ranges (history and art in the 50-59% range; physical science and theater and media arts in the 60-69% range; and exercise science in the 70-79% range). Is it correct to read this table as meaning that only 56 students took the Praxis II test since 2006? Campus Response: The 56 does not represent individuals. It is the number of programs in the four semesters of data represented in Tables 12-22 that had the percent pass rate range listed in the Table. Tables 12-22 give the number of students each semester that took the PRAXIS. [See Audit Task A8.] Clarification Question 7: What is the relationship between the EPP Executive Committee and the Secondary Education Committee? Campus Response: Here’s our take on the structure. Sec Ed Committee is at a level equal to the Teacher Ed and Special Ed departments. The chairs and co-chairs of all three are represented on the EPP Exec Committee.
UCOTE ↕
EPP Executive Committee Secondary Committee -- Teacher Ed Department -- Special Ed Department
↕ Assess. Dev. & Adv. Data Mngt…..Assess. & Anal.
Teacher Education Accreditation Council (TEAC)
©TEAC One Dupont Circle Suite 320 Washington, DC 20036 202/466-7236 www.teac.org
11
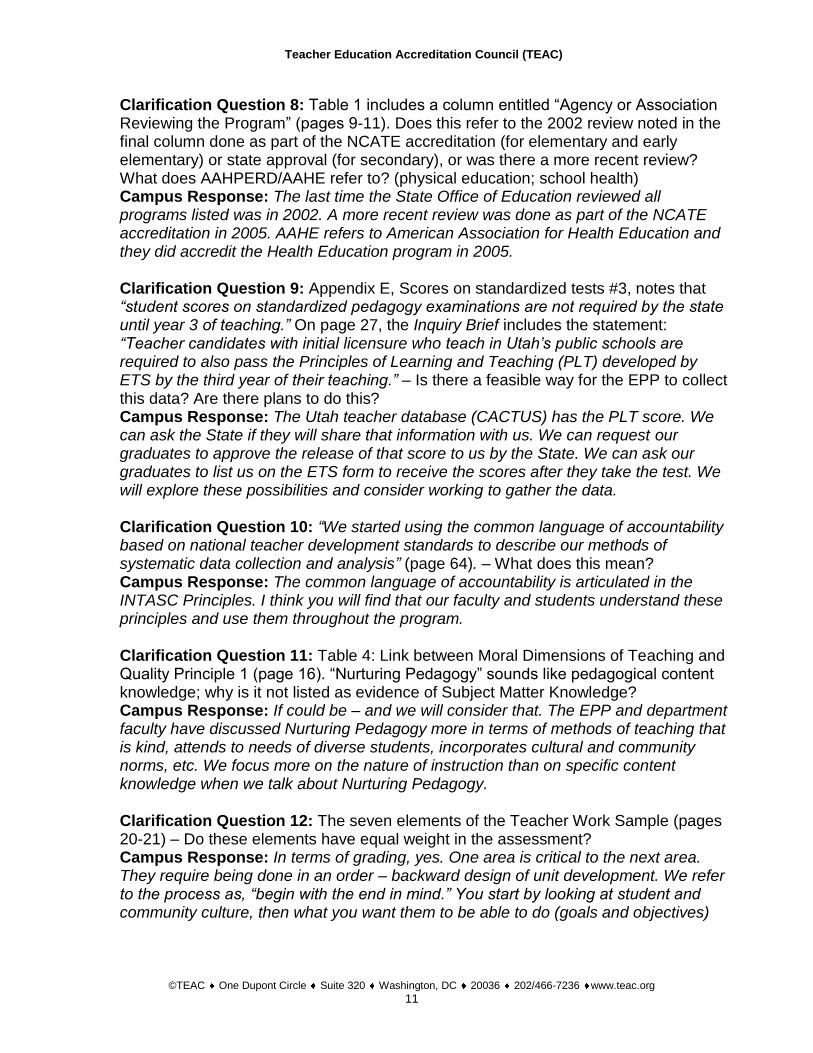
Clarification Question 8: Table 1 includes a column entitled “Agency or Association Reviewing the Program” (pages 9-11). Does this refer to the 2002 review noted in the final column done as part of the NCATE accreditation (for elementary and early elementary) or state approval (for secondary), or was there a more recent review? What does AAHPERD/AAHE refer to? (physical education; school health) Campus Response: The last time the State Office of Education reviewed all programs listed was in 2002. A more recent review was done as part of the NCATE accreditation in 2005. AAHE refers to American Association for Health Education and they did accredit the Health Education program in 2005. Clarification Question 9: Appendix E, Scores on standardized tests #3, notes that “student scores on standardized pedagogy examinations are not required by the state until year 3 of teaching.” On page 27, the Inquiry Brief includes the statement: “Teacher candidates with initial licensure who teach in Utah’s public schools are required to also pass the Principles of Learning and Teaching (PLT) developed by ETS by the third year of their teaching.” – Is there a feasible way for the EPP to collect this data? Are there plans to do this? Campus Response: The Utah teacher database (CACTUS) has the PLT score. We can ask the State if they will share that information with us. We can request our graduates to approve the release of that score to us by the State. We can ask our graduates to list us on the ETS form to receive the scores after they take the test. We will explore these possibilities and consider working to gather the data. Clarification Question 10: “We started using the common language of accountability based on national teacher development standards to describe our methods of systematic data collection and analysis” (page 64). – What does this mean? Campus Response: The common language of accountability is articulated in the INTASC Principles. I think you will find that our faculty and students understand these principles and use them throughout the program. Clarification Question 11: Table 4: Link between Moral Dimensions of Teaching and Quality Principle 1 (page 16). “Nurturing Pedagogy” sounds like pedagogical content knowledge; why is it not listed as evidence of Subject Matter Knowledge? Campus Response: If could be – and we will consider that. The EPP and department faculty have discussed Nurturing Pedagogy more in terms of methods of teaching that is kind, attends to needs of diverse students, incorporates cultural and community norms, etc. We focus more on the nature of instruction than on specific content knowledge when we talk about Nurturing Pedagogy. Clarification Question 12: The seven elements of the Teacher Work Sample (pages 20-21) – Do these elements have equal weight in the assessment? Campus Response: In terms of grading, yes. One area is critical to the next area. They require being done in an order – backward design of unit development. We refer to the process as, “begin with the end in mind.” You start by looking at student and community culture, then what you want them to be able to do (goals and objectives)

Teacher Education Accreditation Council (TEAC)
©TEAC One Dupont Circle Suite 320 Washington, DC 20036 202/466-7236 www.teac.org
12
and how those will be assessed. Then you plan instruction and evaluate student learning. Clarification Question 13: Figure A2: Audit Trail (page 77) – How do the “course evaluation by students” and the “instructor evaluation by students” differ? Are these university-wide evaluations? What happens to the responses? Campus Response: Students are asked to complete evaluations on each course and instructor at the end of the semester on-line. Questions about the course and the instructor are on the same evaluation. Faculty receive the scores electronically on the Faculty Profile System. Their department chairs receive them as well and review the scores with the faculty during their annual stewardship interviews. Clarification Question 14: Table A3: Teaching hours for types of faculty (page 81) – Who supervises secondary student teachers when only one clinical faculty members is listed in the table? Campus Response: Most of the Sec Ed faculty teach methods courses and supervise student teachers. They are not equivalent to the Clinical Faculty in Early Childhood and Elementary Education who are on staff here for a 2-3 year period from the public schools. The Sec Ed faculty are generally full time professorial track (teaching and research responsibilities), full time professional track (only teaching responsibilities), or adjunct faculty who are not full time. Clarification Question 15: Table A4: Number of students for each percentage of categories of instructor (page 84) –How does one read this table? Campus Response: The table was figured on the 62 students used in the internal audit. For example, there were 3 ECE students in the audit. In reading each line of the table, 1 student had 50-59% of tenure track faculty; 2 had 60-69% of tenure track faculty. 1 student had 10-19% clinical faculty; 2 had 20-29% clinical faculty. 2 had 20-29% instructor; 1 had 30-39% instructors. All 3 had 0-9% graduate student instructors. The following four sections of the table report the same type of information for the audited students from Elementary Education (El Ed), Secondary Education (Sc Ed), Special Education (Sp Ed), and total number of students. Clarification Question 16: 4.7 Student Feedback in Table A6: “Reviewed all candidate complaints for the past three years” (page 87) –How many candidate complaints were there? What was the nature of these complaints? What was done in response to them? Campus Response: This information is in the evidence drawer. There were 6 complaints – some related to taking a final early, others about being allowed to remain in the program. All letters and recommendations are included in the records. Clarification Question 17: Page 118: Why is “Secondary Social Science” considered separately from other secondary options? Campus Response: About 12 years ago all secondary programs had faculty in a Secondary Ed department. These faculty taught the Sc Ed 276 class, some of the methods courses, and did the majority of student teaching supervision. The decision

Teacher Education Accreditation Council (TEAC)
©TEAC One Dupont Circle Suite 320 Washington, DC 20036 202/466-7236 www.teac.org
13
to move the education courses into content departments began around 1996-1997 and the Sec Ed department was blended with the El Ed and ECE department into the Teacher Education department. This began the movement of methods courses to the content departments. Some service courses (Sc Ed 350 – Adolescent Development, Sc Ed 353 – Multicultural Students, Sc Ed 359 – Discipline and Management, and CPSE 402 - Special Needs Students) are still in the MSE. Secondary Social Science has been the last to move but it will be in the History department starting Fall 2009.
A. Tasks Related to the Evidence of Student Learning
This section of the report addresses targets associated with Quality Principle I, which has the following requirements: 1.1 Subject matter knowledge. The program candidates must learn and understand the subject matter they will teach. 1.2 Pedagogical knowledge. The program candidates must be able to convert their knowledge of subject matter into compelling lessons that meet the needs of a wide range of pupils and students. 1.3 Teaching skill. The program candidates must be able to teach caringly and effectively and to act on their knowledge in a professional manner. 1.4 Cross-cutting liberal education program content themes For each component of element 1.0, the program must also address three cross-cutting liberal education themes: o Learning how to learn. Candidates must demonstrate that they have learned how to learn
information on their own, that they can transfer what they have learned to new situations, and that they have acquired the dispositions and skills that will support lifelong learning in their field.
o Multicultural perspectives and accuracy. Candidates must demonstrate that they have learned accurate and sound information on matters of race, gender, individual differences, and ethnic and cultural perspectives.
o Technology. Candidates must be able to use classroom technologies that enhance students’ learning. TEAC requires evidence that graduates have acquired the basic productivity tools of the profession.
2.2 Evidence of valid assessment. The program must provide evidence regarding the trustworthiness, reliability and validity of the evidence produced from the assessment method or methods that it has adopted.
Each audit task has two numbers – the one in bold simply refers to the sequence of the tasks within the section and the one in parenthesis refers to the aspect of the TEAC system the task seeks to verify or corroborate and is hyper-linked to a description of the element. Targets in italics are quotations from the Inquiry Brief and text in italics in a finding refers to a quotation from a program informant. Audit Task A1 (1.1) Target: Table 13 (pages 40-41); Tables 16-22 (pages 46-59) Probe: Corroborate the program’s assessment results with on-site surveys of convenience samples of program students, faculty, and cooperating teachers. Finding: Auditors distributed a TEAC survey to students, faculty (full and part-time), and mentor teachers/university supervisors at the end of interview sessions. The results from the convenience samples are in the table below:

Teacher Education Accreditation Council (TEAC)
©TEAC One Dupont Circle Suite 320 Washington, DC 20036 202/466-7236 www.teac.org
14
Table A1
Student, Faculty and Mentor Teacher/University Supervisor Mean Ratings (1-5) on the Adequacy of the Students’ Accomplishments in Subject Matter Knowledge
N Mean Rating
STD
Student ratings of own subject matter knowledge 58 4.66 .54
Student ratings of adequacy of courses 57 4.49 .65
Student ratings of adequacy of faculty 59 4.60 .07
Faculty ratings of student subject matter knowledge 61 4.53 .56
Mentor teacher / university supervisor ratings of student subject matter knowledge
42 4.36 .57
The scale is: 1. Inadequate, 2. Barely Adequate, 3. Adequate, 4. More than Adequate, and 5. Excellent.
The program’s rationale for its assessments is based on assumption that its graduates have acquired the knowledge and skills in the four moral dimensions of teaching (the program’s claims) that the program assesses. The survey results indicate that students, faculty, and mentor teachers/university supervisors believe that the students have a more than adequate grasp of their subject matter knowledge and that the courses and faculty were also more than adequate. (It should be noted that only 59 students were surveyed out of 2,553.) Verified Audit Task A2 (1.2) Target: Table 14 (pages 42-43); Tables 16-22 (pages 46-59) Probe: Corroborate the program’s assessment results with on-site and off-site surveys of convenience samples of program students, faculty, and cooperating teachers. Finding: Auditors distributed a TEAC survey to students, faculty (full and part-time), and mentor teachers/university supervisors at the end of interview sessions. The results from the convenience samples are in the table below:
Table A2 Students, Faculty and Mentor Teacher/University Supervisor Mean Ratings (1-5) on the Adequacy of the Students’ Accomplishments in Pedagogical Knowledge
N Mean Rating
STD
Student ratings of own pedagogical knowledge 58 4.36 .64
Student ratings of adequacy of courses 59 4.37 .73
Student ratings of adequacy of faculty 59 4.56 .67
Faculty ratings of student pedagogical knowledge 60 4.42 .63
Mentor teacher /university supervisor ratings of student pedagogical knowledge
41 4.37 .53
The scale is: 1. Inadequate, 2. Barely Adequate, 3. Adequate, 4. More than Adequate, and 5. Excellent.

Teacher Education Accreditation Council (TEAC)
©TEAC One Dupont Circle Suite 320 Washington, DC 20036 202/466-7236 www.teac.org
15
The program’s rationale for its assessments is based on assumption that its graduates have acquired the knowledge and skills in the four moral dimensions of teaching (the program’s claims) that the program assesses. The survey results indicate that students, faculty, and mentor teachers/university supervisors believe that the students have a more than adequate grasp of their pedagogical knowledge and that the courses and faculty were also more than adequate. (It should be noted that only 59 students were surveyed out of 2,553.) Verified Audit Task A3 (1.3) Target: Table 15 (page 44); Tables 16-22 (pages 46-59) Probe: Corroborate the program’s assessment results with on-site and off-site surveys of convenience samples of program students, faculty, and cooperating teachers. Finding: Auditors distributed a TEAC survey to students, faculty (full and part-time), and mentor teachers/university supervisors at the end of interview sessions. The results from the convenience samples are in the table below:
Table A3 Student, Faculty and Mentor Teacher/University Supervisor Mean Ratings (1-5) on the Adequacy of the Students’ Accomplishments in Caring Teaching Skill
N Mean Rating
STD
Student ratings of own caring teaching skill 58 4.83 .38
Student ratings of adequacy of courses 59 4.25 .77
Student ratings of adequacy of faculty 58 4.62 .58
Faculty ratings of student caring teaching skill 61 4.77 .42
Mentor teacher / university supervisor ratings of student caring teaching skill
42 4.69 .56
The scale is: 1. Inadequate, 2. Barely Adequate, 3. Adequate, 4. More than Adequate, and 5. Excellent.
The program’s rationale for its assessments is based on assumption that its graduates have acquired the knowledge and skills in the four moral dimensions of teaching (the program’s claims) that the program assesses. The survey results indicate that students, faculty, and mentor teachers/university supervisors believe that the students have a more than adequate grasp of caring teaching skills and that the courses and faculty were also more than adequate. (It should be noted that only 59 students were surveyed out of 2,553.) Verified Audit Task A4 (1.4) Target: Table 4 (page 16) showing the relationship of the assessments to the cross-cutting themes; Tables 12-22 (pages 38-59) showing results linked to claims

Teacher Education Accreditation Council (TEAC)
©TEAC One Dupont Circle Suite 320 Washington, DC 20036 202/466-7236 www.teac.org
16
Probe: Corroborate the program’s assessments with on-site surveys of convenience samples of program students, faculty, and cooperating teachers. Finding: Auditors distributed a TEAC survey to students, faculty (full and part-time), and mentor teachers/university supervisors at the end of interview sessions. The results from the convenience samples are in the table below.
Table A4
Student, Faculty and Mentor Teacher/University Supervisor Mean Ratings (1-5) on the Adequacy of the Students’ Accomplishments in the Cross-Cutting Themes
Learning How
to Learn (Mean Rating)
SD Multicultural
Understanding (Mean Rating)
SD Technology
(Mean Rating)
SD
Student ratings of own knowledge /
skill
4.53 (n=59)
.59 3.92
(n=59) .89
4.03 (n=58)
.83
Faculty ratings of student knowledge /
skill
4.51 (n=60)
.54 3.74
(n=59) .69
4.21 (n=60)
.75
Mentor teacher ratings of student knowledge/skill
4.31 (n=42)
.64 3.62
(n=42) .65
4.23 (n=42)
1.04
The scale is: 1. Inadequate, 2. Barely Adequate, 3. Adequate, 4. More than Adequate, and 5. Excellent.
The ratings for multicultural understanding are somewhat lower than they are for the other two cross-cutting themes or the ratings for subject matter, pedagogy and teaching skill. In the Inquiry Brief (pages 68-70) and in written comments on the surveys, students and faculty describe efforts to improve students’ knowledge of and experience with diversity in a distinctly homogeneous environment. Students and mentor teachers described positive experiences in urban field placements in Salt Lake City, Washington, DC, and Houston. (It should be noted that only 59 students were surveyed out of 2,553.) (See Audit Task A9.) Verified Campus response: The Audit Report task A4 verified our finding that multicultural understanding is an area that can be improved in our program. The auditors found that our candidates, while ranking their multicultural understanding in the adequate to more than adequate range (p. 16), scored this as the lowest area of expertise. We will continue to use this information to plan professional development for our faculty that will help them include pedagogy in courses that supports improved diversity education. TEAC response: TEAC appreciates learning of the program’s plans for continued improvement. Audit Task A5 (2.2) Target: The reliability and validity of the TEAC surveys above.

Teacher Education Accreditation Council (TEAC)
©TEAC One Dupont Circle Suite 320 Washington, DC 20036 202/466-7236 www.teac.org
17
Probe: Calculate correlations among the adequacy of the students’ understanding of each areas and their rating of the adequacy of the area’s courses and faculty and their reported GPAs. Finding: The table below gives the correlations mentioned above:
Table A5 Correlations between the Program Students’ Rating of the Adequacy of Understanding of Each
Area of Program Claim and their Ratings of the Adequacy of the Courses, Faculty, and GPA
Area Courses Faculty Reported GPA
Subject Matter .36(*) .38(**) -.10
Pedagogy .13 .22 .13
Teaching Skill .32(*) .09 -.01
** Correlation is significant at the 0.01 level (2-tailed). * Correlation is significant at the 0.05 level (2-tailed).
A correlation exists between the students’ rating of their subject matter knowledge and their ratings of both the courses and faculty related to subject matter knowledge, but the reported GPA is unrelated. The GPA is also unrelated to ratings of courses and faculty in terms of teaching skills. (It should be noted that only 59 students were surveyed out of 2,553.) Verified Audit Task A6 (2.2) Target: The students’ mean ratings for pedagogical knowledge (4.36) and for caring teaching skill (4.83) from the TEAC survey results (Audit Tasks A2 and A3 above). Probe: Conduct a t-test analysis to determine if the means are truly different from each other Finding: The auditors ran a paired samples t-test to determine whether the teaching skill ratings and pedagogical knowledge ratings were statistically different from each other. They computer a t value of -5.651 for the 58 pairs, which has a 2-tailed significance of below 0.0005 (df = 57), so they concluded that the students did in fact perceive themselves as stronger in teaching skill than in pedagogical knowledge. Verified Audit Task A7 (1.1) Target: “The Major GPAs of EPP candidates must be at least 2.85 in order to apply for student teaching. The average GPA scores for the individual areas for Winter Semester, 2008, range from 3.49 (Technology Teacher Education) to 3.86 (German Teaching). The range of Major GPA scores of our audited students range is 2.90 (history student) to 3.96 (El Ed and mathematics student)” (page 62). Probe: Review the data to verify the statement.

Teacher Education Accreditation Council (TEAC)
©TEAC One Dupont Circle Suite 320 Washington, DC 20036 202/466-7236 www.teac.org
18
Finding: Using data files supplied for the audit, auditors examined the reported GPA in the major for all candidates in the four program options for Winter 2008, as well as the GPA scores in the major for Fall 2006, Winter 2007, and Fall 2007 with the following results:
Winter 2008 Fall 2007 Winter 2007 Fall 2006
N=461 N=179 N=510 N=215
3.64 mean 3.61 mean 3.62 mean 3.62 mean
.27 sd .30 sd .27 sd .29 sd
Three students had less than 2.85: 2.81 (math), two at 2.78 (both TTE).
Two students had less than 2.85: 2.54 and 2.64 (both math).
Five students had less than 2.85: 2.59 (TTE), 2.68 (spec ed), 2.70 (chem.), 2.80 (FACS), 2.82 (spec ed), and 2.84 (spec ed).
Three students had less than 2.85: 2.82 (math), 2.77 (health), and 2.68 (spec ed).
The average GPA scores for Winter 2008 are as reported in the IB. Because auditors reviewed all students (and not just those audited), the range of GPA differed with three students in Winter 2008 reported with a major GPA that fell below the program’s 2.85 requirement. In each of the four semesters analyzed, a very few students were reported with major GPAs below 2.85 (.65% in W08; 1.1% in F07; 1.0% in W07; and 1.3% in F06). The mean GPA for each semester exceeded the 2.85 requirement. Verified Campus response: In audit task A7 the auditors found 13 candidates who had GPAs below 2.85 over the four semesters of the Brief, none of the GPAs was below 2.54 and all of these exceptions were reviewed by the content area directors or department chairs. In future TEAC Briefs we will make it clear how exceptions are made. TEAC response: TEAC appreciates learning of the program’s plans for future Briefs. Audit Task A8 (1.1) Target: Table 23: Frequency of Percentages of Candidates Passing Praxis II (page 62) Probe: Review the data in Tables 12-22 and recalculate the percentages of candidates passing the licensure test to confirm the rates reported in Table 23. [See Clarification Question 6.] Finding: Table 23 reports the combined percentages of candidates passing Praxis II within each program option for each of four semesters, organizing the percentages according to various rates of passing. (So, the “2” noted in 50-59% means that in Fall/Winter 06-07 and Fall/Winter 07-08, two program options reported only 50-59% of their students passing Praxis II.) Auditors recalculated the data reported in Tables 12-22 and found results that differed from those reported in Table 23.
Table A6 Recalculated Frequency of Percentages of Candidates Passing PRAXIS II
Range of Percentages 50-59% 60-69% 70-79% 80-89% 90-100%
Frequency (as reported in IB) 2 2 1 11 40
Frequency (as figured by auditor) 2 3 2 14 47

Teacher Education Accreditation Council (TEAC)
©TEAC One Dupont Circle Suite 320 Washington, DC 20036 202/466-7236 www.teac.org
19
Table 13 (page 40) ECE = 3 semesters @ 90-100%; 1 semester @ 80-89% ElEd = 3 semesters @ 90-100%; 1 semester @ 80-89% Sp Ed mld/md = 4 semesters @ 90-100% Sp Ed severe= 1 semester @ 90-100%; 2 semesters @ 80-89%; 1 semester @ 60-69%
Table 16 (page 46) TTE = 3 semesters @ 90-100%; 1 semester @ 80-89%
Table 17 (page 48) Fam & Con Sci = 2 semester @ 90-100%; 1 semester @ 80-89%; 1 semester @ 70-79% Soc Sci = 3 semesters @ 80-89%; 1 semester @ 50-59% His = 4 semesters @ 90-100%
Table 18 (page 50) Art = 1 semester @ 90-100%; 1 semester @ 50-59% Music = 1 semester @ 90-100%; 1 semester @ 80-89% Theater = 1 semester @ 90-100%; 1 semester @ 60-69%
Table 19 (page 52) Health = 2 semesters @ 90-100%; 2 semesters @ 80-89% Ex Sci = 2 semesters @ 90-100%; 1 semester @ 80-89%; 1 semester@ 70-79%
Table 20 (page 54) English = 4 semesters @ 90-100% French = 2 semesters @ 90-100% Spanish = 4 semesters @ 90-100%
Table 21 (page 56) Biology = 4 semesters @ 90-100%
Table 22 (page 58) Math = 4 semesters @ 90-100% Physical Sci = 2 semesters @ 90-100%; 1 semester @ 80-89%; 1 semester @ 60-69%
Verified with error (because the results of the analysis differed in all but one category) Campus response: Audit task A8 involved the frequency of percentages of candidates passing PRAXIS II scores and was verified with error. We acknowledge that we missed 12 program semesters in our count. We will be more accurate in future TEAC Briefs. TEAC response: TEAC appreciates learning of the program’s plans for future Briefs. Audit Task A9 (1.4) Target: “As part of the annual McKay School of Education fall faculty retreat in 2006, each department engaged in discussions around a series of questions regarding recruitment and retention of candidates and faculty of color. The initiatives agreed upon in each department were recorded and have been discussed and implemented in recent years. These include improvement in helping faculty understand diversity issues and address them in their courses and in the Field Experience Demographic (FED) form. Another improvement has been the recruiting and hiring of qualified faculty who can improve the multicultural courses in our program. Additionally we are working to improving the support of diverse candidates in our program” (page 68). Probe: Review agenda and meeting notes to verify the content of the fall faculty retreat in 2006; interview faculty and students. Finding: Auditors reviewed two CD’s of teacher education faculty meetings and agenda. One CD of faculty meetings of the elementary and early childhood options

Teacher Education Accreditation Council (TEAC)
©TEAC One Dupont Circle Suite 320 Washington, DC 20036 202/466-7236 www.teac.org
20
included a file entitled “recruitment summary from the faculty meeting August 31, 2006” and the CD from special education option faculty meetings included a file entitled “faculty retreat minutes 2006.” Both of these files described a wide range of ideas and strategies from the participating faculty on how the program could recruit faculty and students from diverse populations and support candidates as they learn about culture and class issues related to K-12 teaching. Auditors reviewed the FED form which is used by students to note of the diversity of students and cooperating teachers in the classrooms during field experiences and student teaching and is available on-line for students. Students told auditors that they filled out the FED form each time they go to a school setting and understood that it was preparation for the developing the context piece of their Teacher Work Sample (TWS). Faculty described their commitment to increase opportunities for students to work with students in urban settings, students for whom English is not their native language, students from different ethnicities and cultures, and students with special needs. The program offers student teaching placements in Salt Lake City, Washington, DC, and Houston, TX, as well as in New Zealand and Mexico. Auditors spoke with the directors of the Washington, DC placement about student experiences in the DC schools. Verified Audit Task A10 (1.4) Target: “The primary focus of technology use in our program is that the technology enhances instruction, that the subject matter content is the focus of learning – not the technology and that the public school students – not just the teacher – use the technology as they learn” (page 18). Probe: Interview students to determine their understanding of this statement and the evidence they would put forward to demonstrate meeting this goal. Review assignments to verify its veracity. Finding: Auditors reviewed a CD with 63 course syllabi from Fall 2008. Most of the courses included course expectations related to the use of technology including video demonstrations, using Blackboard for class discussions and posting assignments and responses, posting assignments on LiveText, and using the internet to locate articles, etc. More specifically, Technology Teacher Education 377 and 378 both require adept use of the internet in designing and demonstrating technology-rich classroom experiences and Sec Ed 276R Exploration of Secondary Teaching included assignments using wikis, blogs, posting “moodles,” video reflections, etc. On the whole interviews with faculty, students, mentor teachers, and university supervisors revealed that candidates were highly competent in using technology appropriately in teaching and learning (“very strong,” “skilled at incorporating technology into the lesson,” “better skills than veteran teachers”). A few contradictory comments included:
I believe the use of technology is a foundational part of literacy in the 21st century. Although our students have basic skills, I do not feel that they are sufficient to allow them to prepare their own students to consume and create with emerging technologies in ethical, safe, creative, and thoughtful ways. (Secondary and Special Education faculty)

Teacher Education Accreditation Council (TEAC)
©TEAC One Dupont Circle Suite 320 Washington, DC 20036 202/466-7236 www.teac.org
21
I would like to see the students go beyond PowerPoint and use the tech in authentic reading and writing activities. (Elementary and Early Childhood faculty)
This is an area of mixed messages. Yes, our students are excellent at using technology in teaching, but in using it to enhance learning is adequate and could improve. (Elementary and Early Childhood faculty)
Students need to use much more technology in their pre-service experiences in order to become comfortable, and understand the value it plays in the classroom. (mentor teacher / university supervisor)
Sometimes students know more general technology, but not how to use it in their teaching. (mentor teacher / university supervisor)
Even those who are familiar with a wide range of tools do not have a solid understanding of how to use those tools in pedagogically sound ways that are developmentally appropriate for their students. (mentor teacher / university supervisor)
Three students said they wished they were better prepared for integrating technology into teaching and another said, “Instructed on use of technology, but not assistive technology in Special Ed.”
Verified with error (because of the 38 who wrote comments specific to the use of technology to enhance instruction, 63% were positive, 24% were negative, and 13% were mixed) Campus response: Audit task A10 indicated mixed reviews of candidates and faculty concerning how our program integrates technology throughout the program. The verified with error finding is helpful to us as we continue to improve our candidates’ pedagogy and their use of technology to improve student learning and enhance teaching. We have conducted some professional development for our faculty in this area and we will continue to explore how our faculty can model appropriate uses of technology in their pedagogy. TEAC response: TEAC appreciates learning of the program’s plans for continued improvement. Audit Task A11 (2.2) Target: “Statistical analysis suggested that, though many of the items [of the Candidate Dispositional Scale] individually provided interesting insights into the attitudes and beliefs of the candidates, they were not homogeneous and did not constitute a single scale. Furthermore, there were not enough items in categories that factored out to provide reliable information.” “Statistical testing was applied to each of the Candidate Dispositional Scales to refine the items and determine their predictive validity with regard to candidate success. … Data have been gathered and compared over time to determine the relationship between various levels of response on these scales and ultimate candidate success in the workplace” (page 35). Probe: Review the analysis done by the measurement class, the redesigned instrument that was piloted, and the analysis reported with .70 reliability.

Teacher Education Accreditation Council (TEAC)
©TEAC One Dupont Circle Suite 320 Washington, DC 20036 202/466-7236 www.teac.org
22
Finding: Faculty described the process by which students in IP&T 652, Assessing Learner Outcomes, completed an assignment as a class project to evaluate the draft version of the Teaching Dispositions Scale and make recommendations for changes. Auditors reviewed the report, “Analysis of the Draft Version of a Measure of Teacher Aspirations for the David O. McKay School of Education,” that describes the development of the scale, its administration, and the changes made to the scale. Students conducted an item analysis using the Rasch Rating Scale and Partial Credit Models, explored whether there was internal consistency among the items and whether the response categories for the items function as intended, and determined the dimensionality of the items. As a result of this study, several items were revised.
The assessment has been renamed the Candidate Dispositional Scales (CDS) and is used at the beginning of the program and after student teaching to focus candidates on the program’s values and to monitor changes in candidates’ attitudes. Verified Audit Task A12 (2.2) Target: “The PIBS [Professional and Interpersonal Behavior Scale] is required in some key courses but any instructor may submit a PIBS report to a department associate chair when the candidate’s behavior falls below program standards” (page 24). “The Professional and Interpersonal Behavior Scale (PIBS) is used to evaluate candidate dispositions and behavior in our program. … When a student is failing on a PIBS item a statement is sent to the Associate Chair of the Department of Teacher Education for counseling” (page 31). Probe: Determine the nature of this assessment and its use in the program to verify statements from the IB. Finding: Auditors reviewed both the Professional and Interpersonal Behaviors Rating Scale (PIBS) Self-Evaluation and the Instructions for Using the Instrument. The PIBS identifies ten professional and personal behaviors (personal integrity, respect for authority, learning community, responsibility, attendance, punctuality, flexibility, initiative, commitment/loyalty, and dress and grooming). The student and/or supervisor assigns a 1-5 rating (from 1 – unacceptable to 5 – exceed expectations). The purpose of the PIBS is to provide feedback to students of how others’ perceive them and their performance. The results are shared with the student and posted in LiveText™. Although none of the 64 students whose data was analyzed during the internal audit was noted with a “PIBS red flag”, faculty described the PIBS as resulting in productive feedback that is discussed at faculty meetings and used as a way to shape the program’s response to unprofessional student behaviors. (See Audit Task B17.) Verified Audit Task A13 (2.2) Target: “When the instrument [Clinical Practice Assessment System] was completed, school and university clinical facilitators as well as public school teachers were trained

Teacher Education Accreditation Council (TEAC)
©TEAC One Dupont Circle Suite 320 Washington, DC 20036 202/466-7236 www.teac.org
23
on how to use it and subsequently provided preliminary feedback” (page 30). See also pages 67-68. Probe: Look at training materials and interview school and university clinical facilitators about their training. Finding: Auditors reviewed the PowerPoint, “Using the CPAS,” that was presented at the training workshop for mentor teachers, university supervisors, and clinical facilitators. The presentation begins with an overview of the CPAS and the INTASC standards on which it is based. Each of the 10 standards (called principles in the CPAS system) is explicated before a detailed (6-slide) overview on how to use the CPAS for formative and summative assessment and how to ensure inter-rater reliability. In addition, the McKay School of Education website provides Guidelines for Mentor Teachers which includes strategies, guidance, ways to address concerns, stages of student teaching, and links to the assessment tools and rubrics (http://education.byu.edu/fieldservices/mentoring.html). In interviews with the mentor teachers and university supervisors, auditors learned that training for using the CPAS is generally included in a general orientation to the program and specific examples of how to use the assessment is discussed with experienced mentor teachers and (sometimes) professors who attend the training. University supervisors also described viewing videos with faculty and mentor teachers to learn how to use the CPAS assessment.
The mean rating response of the 42 mentor teachers and university supervisors to survey question 8, “The training you received for the evaluation of student teachers,” was 3.79 (5-pt scale with 1=inadequate and 5=excellent) with a standard deviation of 1.25 and the written responses on the survey forms offered auditors different views of the availability of training they received in administering the CPAS assessment. The written responses appear below with the rating assigned to the training appearing in parenthesis:
A lot of it is on the job. (3); I had several years of job experience as a facilitator evaluating students and BYU students. But not a lot of training at the university once getting the job. (2); I did not receive any training for the evaluation of student teachers. It was “on-the-job” training. (1); There wasn’t specific training for using CPAS to evaluate. It’s basically use what you know, ask questions, and learn as you go – I’ve gotten much better through my own inquiry. (2); Because I was a facilitator first, it trained me to be ready to evaluate the student teachers. (4); Monthly meeting with professional development. (5); Could be more specific and directed. (3); I think this is an area for improvement. It would be nice to collaborate with mentors and get more training. Our mentors in the school need better training. (3); It helped to create and edit the CPAS form and I’ve been trained on the TWS and evaluate them yearly. (5); This reflects the status of how supervision and training looked when I arrived 10 years ago. My personal training for my doctorate was excellent. I believe our training has improved and is adequate to more than adequate now. (1); My experience came from previously being a facilitator. Many years ago BYU offered an actual 1 credit class we were expected to take to be a mentor / cooperating teacher. (3); Through the facilitator meetings with BYU we were

Teacher Education Accreditation Council (TEAC)
©TEAC One Dupont Circle Suite 320 Washington, DC 20036 202/466-7236 www.teac.org
24
trained how to use the evaluation. (5); Yearly. (5); Received 2 hours of training on the 1st or 2nd day. (4); I think both mentors and university supervisors would benefit from practical training in this – especially in providing observation and feedback effectively. (3); I received training from my district, but not much training for CPAS or other evaluation strategies from BYU. (3)
Verified with error (because the training is not systematic for all mentor teachers and university supervisors across the program options) Campus response: Audit tasks A13 and B4 suggest improvement we can make in the ways our university supervisors and mentor teachers complete and use the CPAS instrument. Probe A13 recommends that we make the training of university supervisors and mentor teachers on how to complete the CPAS instrument more systematic. We will begin training all new university supervisors and will work to improve the training of our mentor teachers. TEAC response: TEAC appreciates learning of the program’s plans for continued improvement. Audit Task A14 (2.2) Target: “Selected faculty were placed in groups, shown avideotape of a teaching episode, and asked to use the instrument [Clinical Practice Assessment System] to evaluate the teaching situation. … From this discussion came considerable feedback on the validity and design of the instrument and on the process for its administration” (page 30). Probe: Interview faculty about this event and review minutes of discussion. Finding: Faculty described using a videotape of teaching as a way to understand how they were using the CPAS to judge teaching and to help them refine the assessment instrument. They also described using videotapes of teaching with students to help them learn to analyze teaching, to apply the CPAS as a self-analysis, and to understand the assessment tool. University supervisors described their training experience of viewing videos with faculty and mentor teachers to learn how to use the CPAS assessment. In the September 17, 2004, faculty meeting minutes for Secondary Education recorded a discussion about one-hour and two-hour training sessions to use the assessment with videos. Verified Audit Task A15 (2.2) Target: “CPAS 3 (Diverse Learner) [from the Clinical Practice Assessment System] is generally one of the lowest average score[s], statistically lower than other scores. This is true in all of the EPP [Educator Preparation Program] areas and has been addressed through several EPP initiatives discussed in the next section” (pages 61-62). Probe: Verify that CPAS 3, Diverse Learner, has the lowest average score of the 10 CPAS areas.

Teacher Education Accreditation Council (TEAC)
©TEAC One Dupont Circle Suite 320 Washington, DC 20036 202/466-7236 www.teac.org
25
Finding: Auditors used data provided in two files, Fall 2006-Winter 2007 CPAS and Fall 2007-Winter 2008 CPAS, to compute means for each of the ten principles for students in secondary education, with results show in Tables B13a and B13b.
Table A15a
Mean scores for the 10 Principles in the CPAS assessment for
secondary education students, Fall 2006-Winter 2007
N Minimum Maximum Mean Std. Deviation
Principle 1: Content Knowl. 1674 1.67 5.00 3.15 .778
Principle 2: Student Learning 1672 1.50 5.00 3.11 .800
Principle 3: Diverse Learners 1672 .00 5.00 2.90 .835
Principle 4: Instr. Strategies 1670 1.25 5.00 3.23 .833
Principle 5: Mgt & Motivation 1673 1.50 5.00 3.17 .795
Principle 6: Comm. & Tech. 1673 1.25 5.00 3.15 .790
Principle 7: Planning 1673 1.00 5.00 3.12 .833
Principle 8: Assessment 1672 .33 5.00 3.11 .821
Principle 9: Reflective Pract. 1672 1.00 5.00 3.38 .899
Principle10: Professionalism 1673 1.00 5.00 3.28 .842
Valid N (listwise) 1667
Table A15b
Mean scores for the 10 Principles in the CPAS assessment for
secondary education students, Fall 2007-Winter 2008
N Minimum Maximum Mean Std. Deviation
Principle 1: Content Knowl. 912 2 5 4.19 .808
Principle 2: Student Learning 914 2 5 3.97 .806
Principle 3: Diverse Learners 914 1 5 3.76 .827
Principle 4: Instr. Strategies 914 1 5 4.13 .857
Principle 5: Mgt & Motivation 914 1 5 3.91 .875
Principle 6: Comm. & Tech. 912 1 5 4.07 .899
Principle 7: Planning 913 1 5 4.09 .878
Principle 8: Assessment 913 1 5 3.87 .821
Principle 9: Reflective Pract. 912 2 5 4.22 .860
Principle 10: Professionalism 912 1 5 4.17 .879
Valid N (Listwise) 908

Teacher Education Accreditation Council (TEAC)
©TEAC One Dupont Circle Suite 320 Washington, DC 20036 202/466-7236 www.teac.org
26
For Table A15a, they ran a paired-samples t test to compare the means for Principle 3 and for the principle with the next lower mean, Principle 2, and found that they were in fact different (N = 1667, p<0.000). For Table A15b, they ran a paired-samples t test to compare the means for Principle 3 and for the principle with the next lower mean, Principle 8, and found that they were in fact different (N = 914, p<0.000). They also compared the means for Principle 3 and Principle 5 (since the standard deviation for Principle 5 was higher than that of Principle 8), and again found that they were different (N = 914, p<0.000). Verified
Summary of Tasks Related to the Evidence of Student Learning
On the whole the auditors verified the evidence cited in the Inquiry Brief for the assessments associated with the program’s claims. The auditors also verified the program’s history of collecting and analyzing the data of students’ progress. The faculty’s conclusions about student outcomes were corroborated by the TEAC survey data. In addition, the faculty’s database was accurate with respect to student records, and the auditors were able to re-compute the statistics reported in the Brief.
B. Tasks Related to the Program’s Quality Control System
The next section of the audit report addresses targets that are associated with the program’s control and enhancement of program quality. The following components are treated: 2.1 Rationale for the assessments. There must be a rationale for the program’s assessment methods that shows the links between the assessment and (1) the program’s goals, (2) the claims made about student learning, and (3) the program’s requirements. 3.1 Program decisions and planning based on evidence. Where appropriate, the program must base decisions to modify its assessment systems, pedagogical approaches, and curriculum and program requirements on evidence of student learning. 3.2 Influential quality control system. The program must provide evidence, based on an internal audit conducted by the program faculty, that the quality control system functions as it was designed and that it promotes the program’s continual improvement.
Audit Task B1 (2.1) Target: “Data are collected for all candidates throughout the program using LiveText™ and analyzed at the end of each semester” (page 25). Probe: Review LiveText™ files; interview faculty, mentor teachers, university supervisors, and students; review analysis. Finding: Auditors confirmed that data from the Teacher Work Sample (TWS), Clinical Practice Assessment System (CPAS), GPA, Professional and Interpersonal Behavior Scale (PIBS), Candidate Dispositions Scale (CDS), Praxis, and other sources are recorded and analyzed on LiveText™ through (1) a review of a print-out of LiveText™ data for the students audited in the internal audit for Appendix A and (2) through multiple interviews with faculty, university supervisors, and students. The students told auditors that they didn’t get timely feedback because of late postings on LiveText™, and faculty explained in a subsequent interview that students had not yet met with
Teacher Education Accreditation Council (TEAC)
©TEAC One Dupont Circle Suite 320 Washington, DC 20036 202/466-7236 www.teac.org
27
faculty for their final post-student teaching interview at which time the TWS LiveText™ data is discussed. In written comments and verbally, virtually every group interviewed during the sight visit described some frustration in using LiveText™. For example,
“The one area I have noticed to be a weak spot is the LiveText™ tool that is currently being used to collect evaluations on the students from mentoring teachers and university supervisors. It has been a difficult process for many of the mentoring teachers to do the evaluations for our students. It is not user friendly and is difficult to navigate, which causes frustration for them.” (call-for-comment response)
“LiveText™ is a very hard platform to use.” (comment during interview with adjunct faculty)
“It [LiveText™] is very difficult, and we need more training in using it.” (comment during interview with adjunct faculty)
“LiveText™ is a mess.” (comment during interview with university supervisors) Verified (because, although there are problems with the LiveText™ system, there is no question that data is collected using LiveText™ and analyzed each semester) Audit Task B2 (2.1) Target: “Faculty members at BYU model lifelong learning as researchers and as partners in public school and teacher education renewal” (page 17). Probe: Review faculty credentials; interview faculty and students Finding: The McKay School of Education encourages faculty research through its Educational Research Committee and individual research awards, and faculty described their research of the various assessment tools. Auditors reviewed website postings of BYU faculty research and presentations related to the program’s 24-year old partnership with five local school districts, supported through its involvement in the National Network for Educational Renewal (NNER); the university hosted the 2003 NNER national conference; research on the partnership has been features at NNER, AERA, and other conferences. The Center for the Improvement of Teacher Education and Schooling (CITES) at BYU hosts conferences and workshops for local districts, A&S and McKay school faculty, and BYU students. Verified Audit Task B3 (2.1) Target: The EPP … “prepares education professionals who understand and apply the Moral Dimensions of Teaching” (page 14). Probe: Interview faculty and students to determine their understanding of the four Moral Dimensions of Teaching. Review syllabi from courses in the various program options. Finding: In interviews with education and arts and sciences faculty, part-time faculty, and mentor teachers and university supervisors, auditors verified the centrality of the Moral Dimensions of Teaching in the program and that faculty were knowledgeable about the program’s claims and described students in terms of the four claims (four

Teacher Education Accreditation Council (TEAC)
©TEAC One Dupont Circle Suite 320 Washington, DC 20036 202/466-7236 www.teac.org
28
dimensions). Auditors reviewed syllabi from eleven courses (secondary education, elementary education, special education, and early childhood) and discovered both specific references to the Moral Dimensions of Teaching and assignments linked to the four dimensions.
In addition, auditors observed ELED 340, Children’s Literature, in which the professor spoke of how some controversial children’s books can be used to create inclusive learning environments (enculturation for democracy) and their role as vehicles to enhance collaboration with parents and community members (stewardship). Verified Audit Task B4 (2.1) Target: “Narrative for the Clinical Practice Assessment System: “(assesses all claims). The university supervisor and the public school mentor teacher write a narrative describing the strengths and weaknesses of the candidates during their student teaching. Language from these narratives is reviewed to assess their relationship to each of the EPP [Educator Preparation Program] claims” (page 20). Probe: Verify that the narratives exist and interview students to determine how they receive feedback on their demonstration of the EPP claims. Finding: Students described a variety of ways that the CPAS assessment is used during student teaching. Some students spoke of the narrative serving as the basis for frequent conversations with mentor teachers and university supervisors, a few other students said they had never received any narrative feedback. In an interview with the auditors, university supervisors and mentor teachers suggested changing the deadline for administering the CPAS assessment because the mentor teacher is required to turn it in two weeks prior to the end of student teaching. When the student teacher exhibited difficulties at the end of the semester, the CPAS assessment did not reflect the problem. The mentor teacher said that she was not allowed to modify the CPAS assessment because it had already been turned in and gave the program and the student an inaccurate evaluation. Verified with error (because the use of the narrative to provide feedback varies considerably among the various program options) Campus response: Audit tasks A13 and B4 suggest improvement we can make in the ways our university supervisors and mentor teachers complete and use the CPAS instrument….Task B4 indicates that the CPAS narrative could be used to provide feedback to our candidates more consistently. We will share this information with our faculty and work to improve our feedback. We should point out that most faculty complete formative CPAS forms at each student teaching observation. These reviews are shared with the student teacher in brief conversations after the observation and in a mid-term evaluation. As we improve the training of our faculty we will include how the CPAS can be used as a formative evaluation as well as a summative one. We will also discuss this process more thoroughly in future TEAC Briefs. TEAC response: TEAC appreciates learning of the program’s plans for continued improvement.

Teacher Education Accreditation Council (TEAC)
©TEAC One Dupont Circle Suite 320 Washington, DC 20036 202/466-7236 www.teac.org
29
Audit Task B5 (2.1) Target: “The TWSs [Teacher Work Samples] are assessed by faculty teams using rubrics adapted from the Renaissance Partnership for Improving Teacher Quality” (page 20). Probe: Interview faculty to determine the nature of the faculty teams. Finding: Faculty in the Early Childhood and Elementary options described being randomly paired initially for reviews of the Teacher Work Samples; teams were kept together in subsequent semesters if they worked well together. The teams included tenured faculty, CFAs, and sometimes (depending upon the number of TWS assessments requiring review) school personnel. If a TWS is given widely divergent scores, it is assigned to a third reader who does not see either of the previous two assessments. Out of about 140 TWS, two might need to go to a third reader. Students are offered the opportunity to rework a weak section for a new assessment of it. Faculty from these two options described the TWS as “valuable to the department. It shines a spotlight on faculty and course; provides information on specifics, trends, and generalities; and has sparked a discussion about the nature of the TWS as a proxy for what the program can be and how we can improve the program.” Faculty in the Secondary and Special Education options said that sometimes the TWS is assessed by a faculty member and the student teaching supervisor and, in some instances, only one faculty member assesses the TWS. Some faculty thought the TWS worked well as an “instructional unit” and one member said that “the inquiry-based nature of the TWS brings faculty together across subject areas because it helps us better understand what each content area is concerned about.” Several other faculty in the Secondary/Special Education interview described the TWS negatively, as “not a useful document. There is a lack of transfer between the TWS and their future jobs. Students hate the TWS and don’t want to do it anymore.”
The BYU Teacher Work Sample rubric (on pages 140-149 of the IB) was adapted from the TWS material developed by the Renaissance Partnership. (See Audit Task B8.) Verified Audit Task B6 (3.1) Target: “An EPP Assessment Team completes an annual comprehensive data analysis report (self study) on all digitized data. … An interpretive analysis report is completed including unit strengths and areas needing improvement” (page 24). Probe: Examine the annual comprehensive data analysis reports listing strengths and areas for improvement. Finding: Auditors reviewed several binders of analyses from the annual data reports. The data is reported to faculty by program option, so that special education, for example, reviews progress of their students in the program. Auditors reviewed CDs of faculty meetings from each program option. A review of minutes from Special Education faculty meetings included several specific instances of program changes based on data: 2/10/09: “Two areas that may need improvement in the department,

Teacher Education Accreditation Council (TEAC)
©TEAC One Dupont Circle Suite 320 Washington, DC 20036 202/466-7236 www.teac.org
30
based upon data from the recent CPAS analysis for CEC Approval are: (1) Assessments and (2) Direct Observation”; 7/1/08 includes a discussion about the special education faculty decision to adopt the CPAS assessment of student teaching and internships; 10/21/08 includes plans to revise the optional cooperating teacher evaluation form and both 10/21/08 and 11/18/08 include discussions and plans for developing a rubric for the Teacher Work Sample instructional strategies section to reflect INTASC Standard 4 and posting it in LiveText™. As noted in the Inquiry Brief, the EPP teacher education faculty identified issues related to both diversity and assessment as areas needing improvement and this discussion is recorded in the 2/12/09 minutes. At the 8/30/07 meeting faculty discussed what they were learning by conducting a thorough examination of the Teacher Work Sample and its overarching principles and the way the assessment guides students in their student teaching performances; they discussed concerns about how well students perform on the various sections and the process they need to follow to make changes to the TWS and its implementation. Verified Audit Task B7 (3.1) Target: “Changes and refinements [to the Clinical Practice Assessment System] were made each time [faculty discussed the results of their training exercise], thus improving the quality of the instrument and addressing inter-rater reliability” (page 30). Probe: Review minutes of these discussions to determine what issues were raised and changes were made as a consequence. Finding: Auditors reviewed the minutes of the University Council on Teacher Education (UCOTE) from 2005-2008, the Educator Preparation Program (EPP) faculty meetings from 1997-1009, the Special Education faculty meetings from 2004-2009, and the Secondary Education committee agenda and minutes from 2003-2009. In the minutes for each of these groups there is evidence of faculty consideration and discussion of findings from the data collected with CPAS (and other assessments) and of proposed concerns and changes. For example, UCOTE members discussed the annual data reports prepared for each program option and raised concerns that the EPP program needed to work on issues related to diversity and technology (3/4/05). The Secondary Education committee discussed revised drafts of the CPAS assessment in 2004 and 2006, training sessions with CPAS in 2004 (with videos), training sessions in 2006 to help ensure consistency in marking, and the new scale introduced in 2006 for assessing students with CPAS. On 2/10/09, minutes from the Special Education faculty contain the statement: “Two areas that may need improvement in the department, based upon data from the recent CPAS analysis for CEC Approval are: Assessments and Direct Observation,” and on 2/12/09 Teacher Education faculty discussed diversity and assessment as two areas requiring improvement. Verified Audit Task B8 (3.1)

Teacher Education Accreditation Council (TEAC)
©TEAC One Dupont Circle Suite 320 Washington, DC 20036 202/466-7236 www.teac.org
31
Target: “A great deal of work was done to modify the document [the Teacher Work Sample] that would be given to our candidates to guide them. This included work on the item prompts, rubrics, and scoring processes” (page 30). See description on page 68. Probe: Compare the BYU Teacher Work Sample instructions and rubric with that of the Renaissance Group model to verify differences. Finding: Auditors reviewed the Renaissance Partnership for Improving Teacher Quality, Teacher Work Sample Performance Prompt, Teaching Process Standards, and Scoring Rubrics (http://edtech.wku.edu/rtwsc/documents/Prompt-and-Rubric.pdf). Among adaptations made by the BYU faculty are the addition of appropriate INTASC principles and standards in each step of the TWS process; an overview of the TWS assignment; changes to some of the indicators for the seven teaching processes; and the addition of both an assessment plan template and an overall unit plan template. Students in the Early Childhood Education option described how they were assigned to do a modified TWS in groups and that this experience was invaluable when they began student teaching. “Faculty helped us learn to approach the TWS in parts and this allowed us to balance what was expected. Seminars on each part provided understanding of the expectations and how to plan.” Another student said that “everything you do in the TWS is improbably for daily teaching, but you learn the structure of how you should use assessment to guide instruction. The TWS gives you a good overview of the process of teaching.” On the other hand, students in the Secondary and Special Education options were less enthusiastic about the experience: “TWS is hoop-jumping. You just have to manipulate stuff to get it done.” “It’s really just busy-work. Professors say, “just get it done and don’t worry about it.” Verified Audit Task B9 (3.1) Target: “Secondary Education content specialists have created variations in the Teacher Work Sample (mathematics, English, and dance) to align the assessment more accurately with their areas” (page 68). Probe: Interview faculty about their adaptations of the TWS. Finding: Faculty in the Secondary option described a number of ways that they have adapted both the document and the implementation of the TWS to their program options. For example, in the Art methods course students create a mini-TWS so they are prepared for the experience when they begin student teaching; Theater has modified the TWS to include drama elements; students in the English option complete the first four parts in their methods course and the final three parts during student teaching; PE and Health students are incorporating the TWS into their portfolios for use when they interview for jobs. Verified Audit Task B10 (3.2) Target: “… the Educator Preparation Program (EPP) draws on the expertise of field-based instructors: district liaisons (DLs) and clinical faculty associates (CFAs). The

Teacher Education Accreditation Council (TEAC)
©TEAC One Dupont Circle Suite 320 Washington, DC 20036 202/466-7236 www.teac.org
32
full-time CFAs are experienced teachers on a two- or three-year leave of absence from their districts who are paid by the university during this time. CFAs co-teach university courses, supervise candidates in practicum experiences, and work with other K-12 teachers. District liaisons are permanent clinical faculty hired specifically as supervisors for student teachers and interns” (page 11). Probe: Verify the nature of assignments made to field-based instructors. Finding: Auditors interviewed program administrators and faculty and confirmed the role of Clinical Faculty Associates and District Liaisons in the program. A review of faculty vitae revealed that the field-based instructors had significant experience teaching in the schools. Verified Audit Task B11 (2.1) Target: “Each teacher licensure program at BYU has a Learning Outcomes Webpage where these assessments are listed as either direct or indirect measures of student learning” (page 24). Probe: Look at the Learning Outcomes Web pages for Early Childhood Education, Elementary Education, Secondary Education, and Special Education. Finding: Auditors reviewed the university website: https://learningoutcomes.byu.edu/wiki/index.php/Expected_Learning_Outcomes%2C_Evidence_and_Assessment and found the following learning outcomes:
ECE lists five learning outcomes (promoting child development and learning;, building family and community relationships; observing, documenting, and assessing to support young children and families; teaching and learning; and becoming a professional), aligned to the INTASC and National Association for the Education of Young Children (NAEYC) standards, and assessed by the CPAS, TWS, Praxis II, TSA, and PIBS.
Elementary Education and Teaching Social Science each list ten learning outcomes (subject matter; student learning; diverse learners; instructional strategies; learning environments; communication and technology; planning instruction; assessment; reflection and professional development; and collaboration, ethics, and relationships), aligned to the INTASC standards, and assessed by the CPAS, TWS, Praxis II, TSA, and PIBS. Elementary education is also aligned to the Association for Childhood Education International (ACEI) standards.
Special Education mild and moderate and Special Education severe each list six learning outcomes (assessment, behavior, collaboration, teaching, interpersonal relations, professional practice), aligned to the INTASC and Council for Exceptional Children (CEC) standards, and assessed by the CPAS, TWS, Praxis II, TSA, and PIBS.
Verified with error (because there are no learning outcomes listed for secondary education other than Teaching Social Science) Campus response: Probe B11 refers to Learning Outcomes on the McKay School of Education webpage and that the only secondary education area listed is Social

Teacher Education Accreditation Council (TEAC)
©TEAC One Dupont Circle Suite 320 Washington, DC 20036 202/466-7236 www.teac.org
33
Science. Each secondary education program has their own set of learning outcomes on the BYU Learning Outcomes webpage. The Brigham Young University Learning Outcomes website is organized by college, department, and program offering. Since each of the secondary education areas is housed in an academic department and college, individual learning outcomes for each respective preparation area can be found in the department-related website. Teaching Social Sciences is part of the David O. McKay School of Education thus part of the Department of Teacher Education like Early Childhood Education, and Elementary Education. The following table has links to all of the Educator Preparation Program licensure options: Department / Program Learning Outcomes Webpage URL
Art Education K-12 https://learningoutcomes.byu.edu/wiki/index.php/Art_Education_BA
Biological Science Education https://learningoutcomes.byu.edu/wiki/index.php/Biological_Science_Education_BS
Chemistry Education https://learningoutcomes.byu.edu/wiki/index.php/Chemistry_Education_BS
Dance Education https://learningoutcomes.byu.edu/wiki/index.php/Dance_Education_BA_with_Secondary_Teacher_Certification
Earth and Space Science Education
https://learningoutcomes.byu.edu/wiki/index.php/Earth_and_Space_Science_Education_BS
English Teaching https://learningoutcomes.byu.edu/wiki/index.php/English_Teaching_BA
Family and Consumer Sciences Education
https://learningoutcomes.byu.edu/wiki/index.php/Family_and_Consumer_Sciences_Education
French Teaching https://learningoutcomes.byu.edu/wiki/index.php/French_Teaching_BA
Geography Teaching https://learningoutcomes.byu.edu/wiki/index.php/Geography_Teaching_BS_and_Minor
German Teaching https://learningoutcomes.byu.edu/wiki/index.php/German_Teaching_BA
Health Education https://learningoutcomes.byu.edu/wiki/index.php/Health_Education_Minor
History Teaching https://learningoutcomes.byu.edu/wiki/index.php/History_Teaching_BA
Latin Teaching https://learningoutcomes.byu.edu/wiki/index.php/Latin_Teaching_BA
Mathematics Education https://learningoutcomes.byu.edu/wiki/index.php/Mathematics_Education_BS
Music Education: K-12 Choral Emphasis
https://learningoutcomes.byu.edu/wiki/index.php/Music_Education_BM
Music Education: K-12 Instrumental Emphasis
https://learningoutcomes.byu.edu/wiki/index.php/Music_Education_BM
Music Education: Elementary Music Specialist Emphasis
https://learningoutcomes.byu.edu/wiki/index.php/Music_Education_BM
Physical Education Teaching/Coaching
https://learningoutcomes.byu.edu/wiki/index.php/Physical_Education_Teaching/Coaching_%28K-12%29_BS
Physics Teaching https://learningoutcomes.byu.edu/wiki/index.php/Physics_Teaching_BS
School Health Education https://learningoutcomes.byu.edu/wiki/index.php/School_Health_Education_BS
Spanish Teaching https://learningoutcomes.byu.edu/wiki/index.php/Spanish_Teaching_BA
Teaching Exercise Science Not Available
Teaching Social Science https://learningoutcomes.byu.edu/wiki/index.php/Teaching_Social_Science_BS
Technology and Engineering Education
https://learningoutcomes.byu.edu/wiki/index.php/Technology_Teacher_Education_BS
Technology Teacher Education https://learningoutcomes.byu.edu/wiki/index.php/Technology_Teacher_Education_BS
Theatre Arts Education https://learningoutcomes.byu.edu/wiki/index.php/Theatre_Arts_Education_BA
TEAC Response: Thank you for this clarification. Obviously, the audit team missed this information which changes the outcome of the finding from Verified with Error to Verified. Audit Task B12 (3.1) Target: “CPAS 3 (Diverse Learner) [from the Clinical Practice Assessment System] is generally one of the lowest average score[s], statistically lower than other scores. This is true in all of the EPP [Educator Preparation Program] areas and has been addressed through several EPP initiatives discussed in the next section” (pages 61-62)

Teacher Education Accreditation Council (TEAC)
©TEAC One Dupont Circle Suite 320 Washington, DC 20036 202/466-7236 www.teac.org
34
Probe: Interview faculty to determine their response to this finding. Finding: As noted in Audit Task B7, issues related to diversity of students and faculty have been identified in faculty meetings of the various program options over the past several years. Audit Task A15 verified that secondary education student mean scores for Principle 3, Diverse Learners, in the CPAS assessment are lower than the scores for the other nine principles. Faculty are engaged in strategies to attract diverse faculty and students, support students from other cultures who are in the program, expand students’ field experiences in schools serving diverse students, and strengthen preparation in working with students with special needs. In addition, the McKay School of Education has promoted the Educator Growth and Unity Association, formed to support student efforts to “understand and appreciate human diversity” through monthly meetings on topics related to multiculturalism and education, providing opportunities for community service and outreach, and building connections to university-wide efforts to promote diversity (the Multicultural Student Services, for example). Verified Audit Task B13 (3.1) Target: “The Utah State Office of Education changed the PRAXIS II exam required for special education candidates (mild/moderate) from the Special Education Content Exam 0542 to the Elementary Content Exam 0014. Special education faculty members do not agree with this change, and candidate scores on the Elementary Content Exam are lower than the previous scores on the Special Education Exam” (page 62). Probe: Review assessment data and minutes of the Special Education Faculty meetings to verify concerns and plans. Finding: Auditors reviewed the Excel file of Praxis data for special education students from Fall 2006-Winter 2008 with the following results:
Table B13 Special Education Students’ Praxis Scores
Praxis test
Number of students
Utah cut score
Average score
Range of scores
Number of scores below the cut score
% of students scoring below
cut score
0014 18 150 169 133-200 2 (133 each) 11%
0511 8 161 175 134-191 2 (134; 160) 25%
0542 30 155 179 153-200 1 (153) 3%
0544 32 159 172 150-193 5 (139; 150; 151; 2 at 158)
16%
Auditors also reviewed the minutes of the Special Education faculty meetings (2007-2009) and the Special Education Partnership Advisory Council meetings (2007-2009) and verified faculty concern about the state’s decision to require Praxis 0014 licensure test (elementary education content) for special education students. In both 2008 and 2009 faculty meetings plans were made to schedule Praxis preparation sessions,

Teacher Education Accreditation Council (TEAC)
©TEAC One Dupont Circle Suite 320 Washington, DC 20036 202/466-7236 www.teac.org
35
inviting students who had scored well on the exam to advise students who had registered for the test. Verified (because the number of scores below the cut score on Praxis 0014 was slightly higher than the number of scores below the cut score on Praxis 0542; the number of scores below the cut score for Praxis 0544 was higher than for 0014; the number of scores below the cut score for Praxis 0511 and 0014 was the same) Audit Task B14 (3.2) Target: “The secondary areas have the lowest CPAS [Clinical Practice Assessment System] scores in these areas [Nurturing Pedagogy]. One explanation might be that the general language on the CPAS form does not use specific learning objectives and assessment methodologies stressed in the content area courses. Some of the content area faculty have worked with the EPP executive committee to include more content specific language on the CPAS form” (page 63). See also, “Many content areas did not easily align with the CPAS instrument based on the INTASC Principles. … Faculty and administrators with these concerns requested that they be allowed to modify indicators and prompts to better reflect what they wanted their candidates to know and be able to do” (page 66). Probe: Verify that the CPAS scores for secondary students in the Nurturing Pedagogy area (CPAS2, CPAS 4, CPAS 7, and CPAS 8) are the lowest of all the principles and verify that faculty are including more content specific language in the CPAS form. Finding: Auditors used data provided in the data files, Fall 2006-Winter 2007 CPAS and Fall 2007-Winter 2008 CPAS, and were unable to verify the statement that the lowest CPAS scores were those in the areas measured for Nurturing Pedagogy. As noted in Audit Task A15, CPAS 3 (with mean scores of 2.90 and 3.76) is lower than any of the four areas related to the Nurturing Pedagogy claim (CPAS 2, CPAS 4, CPAS 7, and CPAS 8).
Table B14 Average Scores for Each of the Ten CPAS Sections
CPAS 1
CPAS 2
CPAS 3
CPAS 4
CPAS 5
CPAS 6
CPAS 7
CPAS 8
CPAS 9
CPAS 10
06-07 n=1667
3.15 3.11 2.90 3.23 3.17 3.15 3.12 3.11 3.38 3.28
07-08 n=908
4.19 3.97 3.76 4.13 3.91 4.07 4.09 3.87 4.22 4.17
Auditors interviewed EPP leaders as well as arts and sciences faculty about the nature of items on the CPAS and were told that secondary faculty were involved in the development of the assessment (and its rubric) from the beginning. Some faculty told of how they were able to adapt items to the needs of different discipline areas; others felt unsatisfied with the assessment because CPAS does not specifically address a candidate’s content knowledge.

Teacher Education Accreditation Council (TEAC)
©TEAC One Dupont Circle Suite 320 Washington, DC 20036 202/466-7236 www.teac.org
36
Verified with error (because the means for these four principles are not lowest and several faculty expressed concern about how well the assessment measures content requirements expected of secondary students) Campus response: In probe B14 the authors of the TEAC Audit Report quote the statement from our TEAC Brief, “The secondary areas have the lowest CPAS [Clinical Practice Assessment System] scores in these areas [Nurturing Pedagogy]” (page 63). The probe and finding are:
Probe: Verify that the CPAS scores for secondary students in the Nurturing Pedagogy area (CPAS2, CPAS 4, CPAS 7, and CPAS 8) are the lowest of all the principles and verify that faculty are including more content specific language in the CPAS form. Finding: Auditors used data provided in the data files, Fall 2006-Winter 2007 CPAS and Fall 2007-Winter 2008 CPAS, and were unable to verify the statement that the lowest CPAS scores were those in the areas measured for Nurturing Pedagogy. As noted in Audit Task A15, CPAS 3 (with mean scores of 2.90 and 3.76) is lower than any of the four areas related to the Nurturing Pedagogy claim (CPAS 2, CPAS 4, CPAS 7, and CPAS 8).
Our statement in the Brief is not that the CPAS scores for secondary students in the Nurturing Pedagogy area (CPAS 2, CPAS 4, CPAS 7, and CPAS 8) are the lowest scores of all the principles. Rather the Brief reports that of all areas (early childhood, elementary education, secondary education and special education) the secondary education areas’ Nurturing Pedagogy scores are the lowest scores reported. TEAC response: TEAC apologizes for misunderstanding the statement in the Brief. Following receipt of this correction, the auditors used data provided in the data files, Fall 2006-Winter 2007 CPAS and Fall 2007-Winter 2008 CPAS to compare the means of the four program options (early childhood, elementary education, secondary education, and special education) for each of the four CPAS areas related to the Nurturing Pedagogy claim (CPAS 2, CPAS 4, CPAS 7, and CPAS 8) with the following results:
Table B14a Mean scores of students in four program options
on the 4 CPAS areas measuring Nurturing Pedagogy
Program option and year CPAS 2 CPAS 4 CPAS 7 CPAS 8
Early Childhood, 2006-07 3.05 N=574
2.92 N=574
2.86 N=574
2.82 N=273
Early Childhood, 2007-08 4.15 N=165
4.08 N=165
4.44 N=165
3.77 N=164
Elementary Education, 2006-07 3.13 N=2193
3.19 N=2193
3.26 N=2188
3.07 N=2188
Elementary Education, 2007-08 3.78 N=940
3.76 N=940
3.95 N=940
3.46 N=940
Secondary Education, 2006-07 3.11 N=1667
3.23 N=1667
3.12 N=1667
3.11 N=1667
Secondary Education, 2007-08 3.97 N=908
4.13 N=908
4.09 N=908
3.87 N=908
Special Education, 2006-07 3.28 3.25 3.39 3.20
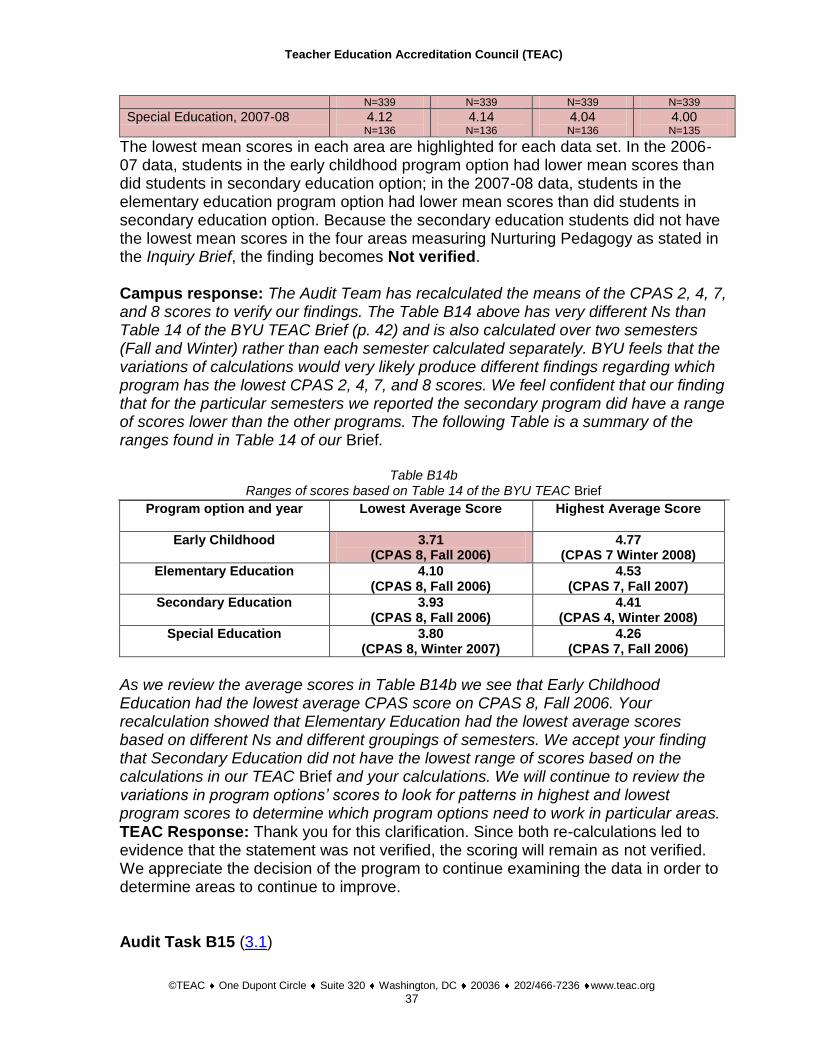
Teacher Education Accreditation Council (TEAC)
©TEAC One Dupont Circle Suite 320 Washington, DC 20036 202/466-7236 www.teac.org
37
N=339 N=339 N=339 N=339
Special Education, 2007-08 4.12 N=136
4.14 N=136
4.04 N=136
4.00 N=135
The lowest mean scores in each area are highlighted for each data set. In the 2006-07 data, students in the early childhood program option had lower mean scores than did students in secondary education option; in the 2007-08 data, students in the elementary education program option had lower mean scores than did students in secondary education option. Because the secondary education students did not have the lowest mean scores in the four areas measuring Nurturing Pedagogy as stated in the Inquiry Brief, the finding becomes Not verified. Campus response: The Audit Team has recalculated the means of the CPAS 2, 4, 7, and 8 scores to verify our findings. The Table B14 above has very different Ns than Table 14 of the BYU TEAC Brief (p. 42) and is also calculated over two semesters (Fall and Winter) rather than each semester calculated separately. BYU feels that the variations of calculations would very likely produce different findings regarding which program has the lowest CPAS 2, 4, 7, and 8 scores. We feel confident that our finding that for the particular semesters we reported the secondary program did have a range of scores lower than the other programs. The following Table is a summary of the ranges found in Table 14 of our Brief.
Table B14b Ranges of scores based on Table 14 of the BYU TEAC Brief
Program option and year Lowest Average Score
Highest Average Score
Early Childhood 3.71 (CPAS 8, Fall 2006)
4.77 (CPAS 7 Winter 2008)
Elementary Education 4.10 (CPAS 8, Fall 2006)
4.53 (CPAS 7, Fall 2007)
Secondary Education 3.93 (CPAS 8, Fall 2006)
4.41 (CPAS 4, Winter 2008)
Special Education 3.80 (CPAS 8, Winter 2007)
4.26 (CPAS 7, Fall 2006)
As we review the average scores in Table B14b we see that Early Childhood Education had the lowest average CPAS score on CPAS 8, Fall 2006. Your recalculation showed that Elementary Education had the lowest average scores based on different Ns and different groupings of semesters. We accept your finding that Secondary Education did not have the lowest range of scores based on the calculations in our TEAC Brief and your calculations. We will continue to review the variations in program options’ scores to look for patterns in highest and lowest program scores to determine which program options need to work in particular areas. TEAC Response: Thank you for this clarification. Since both re-calculations led to evidence that the statement was not verified, the scoring will remain as not verified. We appreciate the decision of the program to continue examining the data in order to determine areas to continue to improve. Audit Task B15 (3.1)

Teacher Education Accreditation Council (TEAC)
©TEAC One Dupont Circle Suite 320 Washington, DC 20036 202/466-7236 www.teac.org
38
Target: “Program faculty continually assess program content and practices” (page 8); “By tracking indications of strength and weakness in specific licensure areas, we are able to find aspects of our program that need revision. … We recognize the importance of building on these strengths as well as correcting weaknesses, and our data help us to reveal and prioritize areas that need immediate attention” (page 65); “The EPP Executive Committee is committed in philosophy and practice to purposeful, systematic, and ongoing evaluation, not only of candidate performance but also of the effectiveness of the EPP itself” (page 72). Probe: Review data reports, interview faculty, and check minutes of faculty meetings to verify the program’s use of assessment data in improving program quality to verify this commitment to self-analysis and improvement. Finding: Auditors reviewed binders of program data, re-computed data files, reviewed several CDs of minutes of faculty meetings from the various program options, interviewed faculty (full-time and adjunct), reviewed LiveText™ data and verified that from UCOTE to subcommittees at the program option level, faculty collect, analyze, and review data to determine ways to improve the preparation program. (See Audit Task B7.) Verified Audit Task B16 (3.1) Target: “Ratings below 3 on any PIBS [Professional and Interpersonal Behavior Scale] trigger a review by the department, using the referral process outlined below [on page 116].” Probe: Check to see if the sequence of events described in the Inquiry Brief is followed. Finding: In the minutes from the 4/8/08 Special Education faculty meeting the following discussion about the PIBS assessment is recorded: Here are the answers to the questions concerning the PIBS and professionalism:
1) How should it be used? Each instructor can do what they want. Some instructors use the PIBS at
midterm and final. Some just use it at the final. If there is a concern with a student be sure to do a midterm PIBS, so it doesn’t come as a surprise to the student at the final. It’s fine if instructors use the PIBS differently in each class.
2) When should it be used? Turn them into Tina if there are concerns with students at midterm and at
the end of the semester. 3) Are points from professionalism appropriate or not?
That is up to the instructor. This conversation conforms to the auditors’ understanding of how the PIBS is implemented and used through the Educator Preparation Program. Auditors reviewed the PIBS assessment form and, during interviews with the faculty, were told that the PIBS is routinely assigned to all students in practicum courses. When a faculty member is concerned about any professional or personal behaviors of an individual student, the PIBS self-assessment is assigned as a “red flag” and the assessment is

Teacher Education Accreditation Council (TEAC)
©TEAC One Dupont Circle Suite 320 Washington, DC 20036 202/466-7236 www.teac.org
39
posted on the student’s LiveText and subsequent conversations with the student occur. Each program option has assigned a “point person” with whom students meet to discuss the nature of the PIBS red flag and the process for self-improvement. (See Audit Task A12.) Verified Audit Task B17 (3.2) Target: Table D2: Requirements for Admission to EPP area (page 117) Probe: Check 5 student files in each of the four options to see if they have required evidence. (Identify students by initials and year) Finding: Auditors reviewed the FileMaker Pro admissions screen for the first five students who graduated from each option in April 2008. Two items listed in Table D2 – the Technology Skills Assessment (required for all four options) and the Exploratory Experience (required for Early Childhood and Special Education) – are incorporated in the application and not noted separately in student files. If a student has successfully completed the application, these items are included. If the items are missing, the student has not successfully completed the application and that is noted in the system. The TOEFL scores (noted for the Early Elementary and Elementary Education options) are not a requirement; none of the files reviewed by the auditors included TOEFL scores.
Table B17 Evidence that Students in the Different Program Options Met
Admissions Requirements EARLY CHILDHOOD
Requirement 1 ea 2 kc 3 rd 4 kd 5 hf
Application YES YES YES YES YES
2.85 GPA 3.74 3.50 3.13 3.59 3.23
Background check YES YES YES YES YES
TOEFL Scores no no no no No
ELEMENTARY EDUCATION
Requirement 1 ba 2 aa 3 ka 4 sa 5 ma
Application YES YES YES YES YES
2.85 GPA 3.74 3.18 3.59 3.63 3.69
Background check YES YES YES YES YES
TOEFL Scores no no no no no
SECONDARY EDUCATION
Requirement 1 mc 2 ah 3 bk 4 lr 5 cr
Application YES YES YES YES YES
2.85 GPA 3.81 3.95 3.91 3.42 3.24
Background check YES YES YES YES YES
SPECIAL EDUCATION
Requirement 1 aa 2 ka 3 af 4 mf 5 cm
Application YES YES YES YES YES
2.85 GPA 3.91 3.77 3.82 3.57 3.70
Background check YES YES YES YES YES

Teacher Education Accreditation Council (TEAC)
©TEAC One Dupont Circle Suite 320 Washington, DC 20036 202/466-7236 www.teac.org
40
Verified Audit Task B18 (3.2) Target: “The primary purpose of the reorganization of the Educator Preparation Program at BYU was to strengthen long-standing collaboration of the MSE [McKay School of Education], cross-campus colleges and departments, and public school colleagues to ensure that candidates are highly qualified and meet the program standards” (page 6). Probe: Interview administrators about the reorganization of the educator preparation program. Finding: The current organization of the Educator Preparation Program (illustrated in Clarification Question 7) brings together representatives from across the colleges and departments at the university. The University Council for Teacher Education (UCOTE) governs administration and oversight of the EPP and is comprised of the BYU associate academic vice president for undergraduate studies, the dean of the McKay School of Education, and a representative from each participating college. (Auditors met with the leadership of UCOTE.)
The Brigham Young University-Public School Partnership (BYU-PSP) is a joint venture between the McKay School of Education and five local school districts (Alpine, Jordan, Nebo, Provo and Wasatch). This 24-year-old partnership is a setting of the National Network for Educational Renewal (NNER) and is based on the foundational principle that the improvement of public education requires teacher training institutions and public schools to work collaboratively to affect positive change in teacher education and K-12 student learning. The Center for the Improvement of Teacher Education and Schooling (CITES) manages initiatives of the BYU-PSP, including the Leaders Associates Group which brings together university faculty and school practitioners for day-and-a-half meetings twice a year around education issues such as assisting the increasing Hispanic population better access to schools, poverty and its implications for schools, the importance of the arts, establishing Professional Learning Communities, and assessment of student learning. Verified Audit Task B19 (3.2) Target: “The financial condition of BYU is sound, and BYU is financially viable” (page 91). Probe: Determine the basis for these statements. Finding: Auditors spoke with Al Merkley, assistant dean and controller for the McKay School of Education, who described the process by which each department requests and is assigned its annual budget. Because the support BYU receives from the Church of the Latter Day Saints is not publicly disclosed, financial information is highly guarded. Merkley provided auditors with a copy of an April 28, 2008, letter from Deloitte & Touche, the university’s auditors, that stated that the financial position of Brigham Young University is in conformity with generally accepting accounting principles. At an interview with President Cecil Samuelson, Vice President John
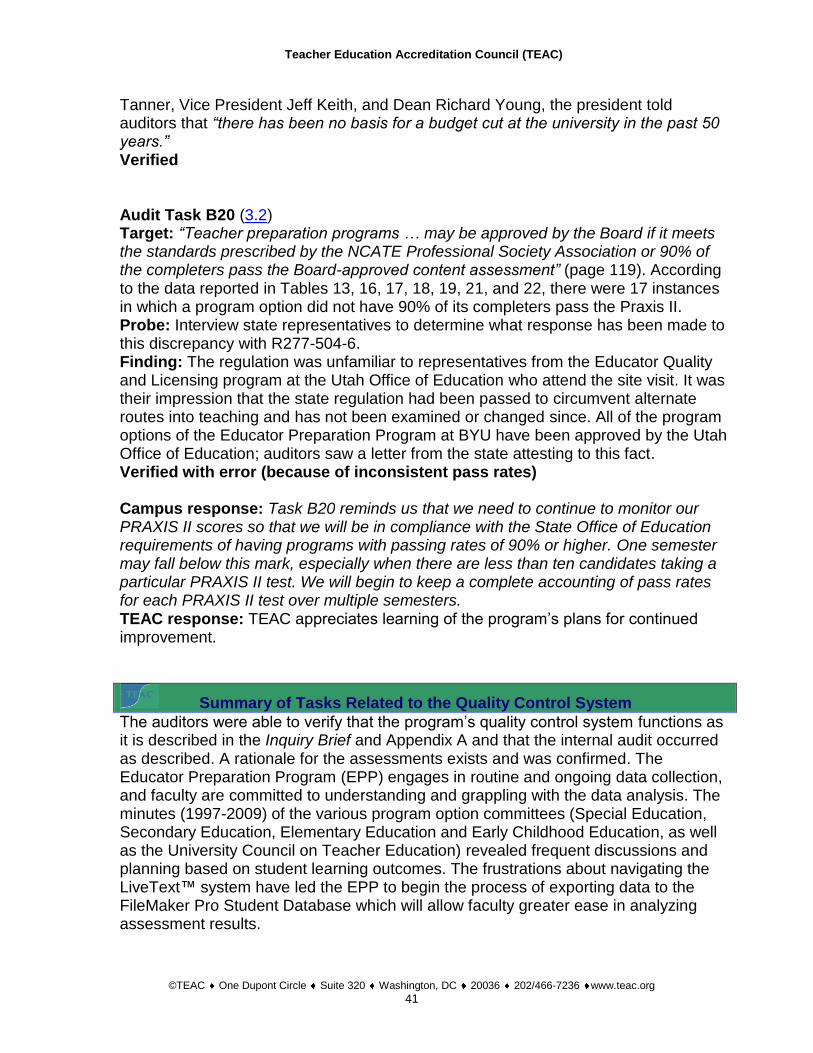
Teacher Education Accreditation Council (TEAC)
©TEAC One Dupont Circle Suite 320 Washington, DC 20036 202/466-7236 www.teac.org
41
Tanner, Vice President Jeff Keith, and Dean Richard Young, the president told auditors that “there has been no basis for a budget cut at the university in the past 50 years.” Verified Audit Task B20 (3.2) Target: “Teacher preparation programs … may be approved by the Board if it meets the standards prescribed by the NCATE Professional Society Association or 90% of the completers pass the Board-approved content assessment” (page 119). According to the data reported in Tables 13, 16, 17, 18, 19, 21, and 22, there were 17 instances in which a program option did not have 90% of its completers pass the Praxis II. Probe: Interview state representatives to determine what response has been made to this discrepancy with R277-504-6. Finding: The regulation was unfamiliar to representatives from the Educator Quality and Licensing program at the Utah Office of Education who attend the site visit. It was their impression that the state regulation had been passed to circumvent alternate routes into teaching and has not been examined or changed since. All of the program options of the Educator Preparation Program at BYU have been approved by the Utah Office of Education; auditors saw a letter from the state attesting to this fact. Verified with error (because of inconsistent pass rates) Campus response: Task B20 reminds us that we need to continue to monitor our PRAXIS II scores so that we will be in compliance with the State Office of Education requirements of having programs with passing rates of 90% or higher. One semester may fall below this mark, especially when there are less than ten candidates taking a particular PRAXIS II test. We will begin to keep a complete accounting of pass rates for each PRAXIS II test over multiple semesters. TEAC response: TEAC appreciates learning of the program’s plans for continued improvement.
Summary of Tasks Related to the Quality Control System
The auditors were able to verify that the program’s quality control system functions as it is described in the Inquiry Brief and Appendix A and that the internal audit occurred as described. A rationale for the assessments exists and was confirmed. The Educator Preparation Program (EPP) engages in routine and ongoing data collection, and faculty are committed to understanding and grappling with the data analysis. The minutes (1997-2009) of the various program option committees (Special Education, Secondary Education, Elementary Education and Early Childhood Education, as well as the University Council on Teacher Education) revealed frequent discussions and planning based on student learning outcomes. The frustrations about navigating the LiveText™ system have led the EPP to begin the process of exporting data to the FileMaker Pro Student Database which will allow faculty greater ease in analyzing assessment results.

Teacher Education Accreditation Council (TEAC)
©TEAC One Dupont Circle Suite 320 Washington, DC 20036 202/466-7236 www.teac.org
42
III. Documentation of Commitment and Capacity
Table III.1
Documents were Found, Partially Found, Not Found, Not Checked or Not Available for Inspection with Regard to Program Commitment
in each Area of TEAC’s Requirements In Table III.1, the auditors have indicated whether they have found evidence that satisfies each requirement for commitment as judged with respect to parity between the program and the institution. Commitment is confirmed when the preponderance (at least 75%) of the supporting documents are found and/or further audit tasks verify associated commitment targets.
TEAC Sub-component
Status TEAC Requirements for
Commitment (4.0) Citation in
Brief Probe
4.1 Curriculum
4.1.3 Parity
Found
The number of credits required for a degree at the institution and in the program show parity. The number of credits required for a degree in other professional fields and in the program show parity. The range of credits required for academic minors in the institution show parity with the number of credits required for the teacher education minor.
p. 86 Catalog / website
4.2 Faculty
4.2.4 Parity
Found
The proportions of full, associate, and assistant professors at the institution and in the program show parity. The proportion of courses taught by temporary faculty at the institution and in the program shows parity. The percentage of faculty with terminal degrees at the institution and in the program shows parity. The percentage of faculty on tenure track at the institution and in the program shows parity. The faculty-student ratios at the institution and in the program show parity. The proportions of gender and race of the faculty at the institution and in the program show parity.
p. 11 p. 79 p. 85 p. 90 p. 95
Website / Administrators
4.3 Facilities, Equipment and Supplies
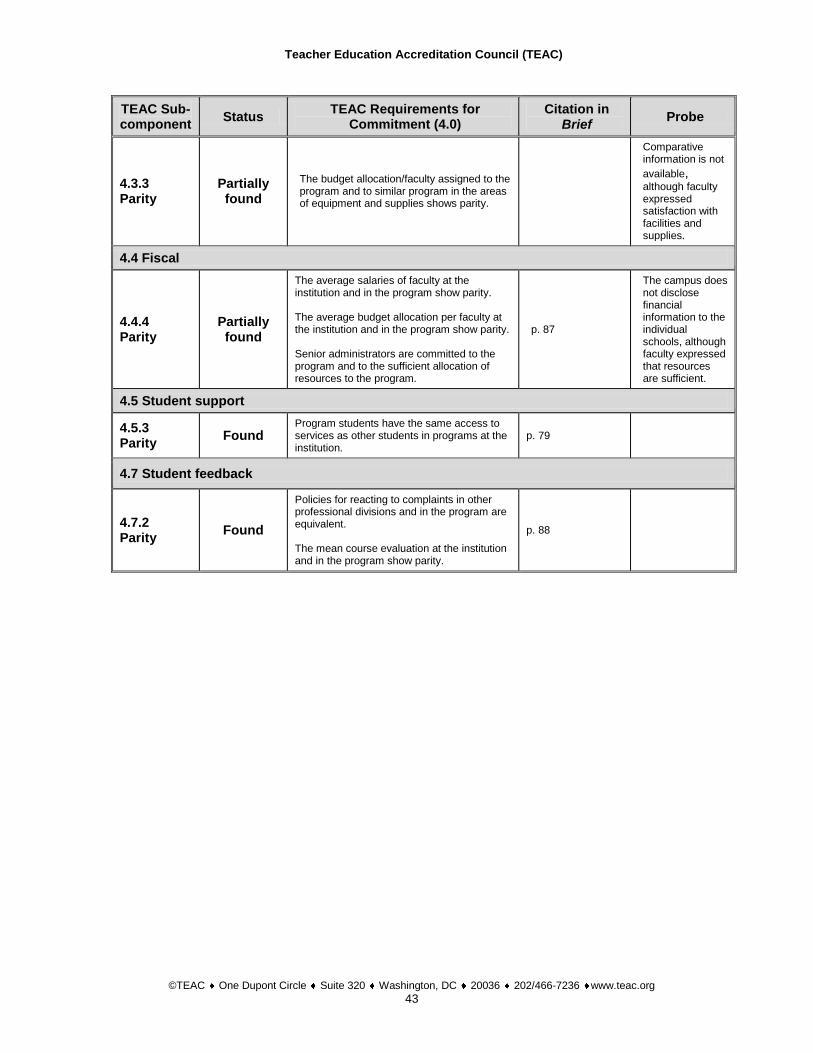
Teacher Education Accreditation Council (TEAC)
©TEAC One Dupont Circle Suite 320 Washington, DC 20036 202/466-7236 www.teac.org
43
TEAC Sub-component
Status TEAC Requirements for
Commitment (4.0) Citation in
Brief Probe
4.3.3 Parity
Partially found
The budget allocation/faculty assigned to the program and to similar program in the areas of equipment and supplies shows parity.
Comparative information is not
available, although faculty expressed satisfaction with facilities and supplies.
4.4 Fiscal
4.4.4 Parity
Partially found
The average salaries of faculty at the institution and in the program show parity. The average budget allocation per faculty at the institution and in the program show parity. Senior administrators are committed to the program and to the sufficient allocation of resources to the program.
p. 87
The campus does not disclose financial information to the individual schools, although faculty expressed that resources are sufficient.
4.5 Student support
4.5.3 Parity
Found Program students have the same access to services as other students in programs at the institution.
p. 79
4.7 Student feedback
4.7.2 Parity
Found
Policies for reacting to complaints in other professional divisions and in the program are equivalent. The mean course evaluation at the institution and in the program show parity.
p. 88

Teacher Education Accreditation Council (TEAC)
©TEAC One Dupont Circle Suite 320 Washington, DC 20036 202/466-7236 www.teac.org
44
Table III.2 Documents were Found, Partially Found, Not Found, Not Checked or
Not Available for Inspection with Regard to Program Capacity in each Area of TEAC’s Requirements
In Table III.2 below the auditors have indicated whether they have found evidence that satisfies each requirement for program capacity. Capacity is confirmed when the preponderance (at least 75%) of the supporting documents are found and/or further audit tasks verify associated capacity targets.
TEAC Sub-component
Status TEAC Requirements for
Commitment (4.0) Citation in Brief
Probe
4.1 Curriculum
4.1.1 Major & Minor
Found
Credit hours required in pedagogical subjects are tantamount to an academic minor. Credit hours required in the subject matter are tantamount to an academic major.
pp. 89-90
http://saas.byu.edu/catalog/2008-2009ucat/departments/TeacherEduc/ScEdMain.php Undergraduate 2008-2009 Catalog
4.1.2 State license
Found
Statement from the state liaison officer to verify that the program graduates are entitled to state licensure. Formal notification from the state that it has approved the program.
p. 90
Copy of 3/23/09 letter from Sydnee Dickson, Utah State Office of Ed., received with Brief
4.2 Faculty
4.2.1 IB & goal Endorsed
Found Minutes of a meeting show that the Brief was considered and approved by the faculty.
Front cover, p. 91
Reviewed minutes from 1/15, 1/23, 2/10, 2/12
4.2.2 Balanced under-standing
Found
The Brief demonstrates the faculty’s accurate and balanced understanding of the disciplines that are connected to the program.
Confirmed during discussion with authors, full-time faculty, and part-time faculty on April 8 and 9, 2009.
4.2.3 Qualified
Partially found
Faculty selected at random have a doctorate (major or minor) in areas of the course subjects they teach. Adjunct faculty selected at random have a terminal degree (major or minor) in the areas of course subjects they teach. Courses selected at random taught in the current semester by part-time faculty whose assignment and degree field align. Randomly selected courses are taught by the regular faculty whose vita indicates qualifications to teach courses to which the person was assigned.
p. 91
Reviewed vitae from possible classes to visit. Only 7 out of 12 had a terminal degree. Two of the 12 had a MA. Three vitae were missing. All 9 had degrees in the appropriate teaching areas. Not all were full-time faculty. In the brief (p. 11), only “All full-time faculty hold PhD or EdD degrees.” This statement was verified. Of the adjunct faculty names listed, two were graduate students, one had a masters in the appropriate area, and one is unknown.
4.3 Facilities, Equipment and Supplies

Teacher Education Accreditation Council (TEAC)
©TEAC One Dupont Circle Suite 320 Washington, DC 20036 202/466-7236 www.teac.org
45
TEAC Sub-component
Status TEAC Requirements for
Commitment (4.0) Citation in Brief
Probe
4.3.1 Sufficient
Found Satisfactory survey results from faculty & students.
4.3.2 Quality control
Found Internal audit indicates sufficient quality control in the area of space, supplies and expenses, and facilities.
p. 91
Classroom visits Physical Facilities Policy, dated 11/10/01 See http://plantwo.byu.edu/ Furnishings Standards for BYU, May 2008
4.4 Fiscal
4.4.1 Sound
Partially found
Satisfactory institution bond rating. Statement from financial auditor attesting to the financial health of the institution. Regional accreditor’s finding of financial soundness.
p. 92
The campus does not disclose financial information to the individual schools. Interviewed the controller for the McKay School of Education; reviewed 4/28/08 cover letter from Deloitte & Touche for the independent auditor’s report. Did not review report itself.
4.4.2 Faculty develop-ment
Partially found
Policies that support professional travel in the program and the rate of faculty participation.
pp. 82-83
Formal policies concerning travel were unavailable. In discussion with the faculty, President Samuelson, VP Tanner, VP Keith, and Dean Young learned that each school has its own process for supporting professional travel. Money is allocated by the campus to the departments. No physical data to verify interviews.
Found Satisfactory survey results from faculty.
Partially found
Education faculty teaching load aligns with the institution average.
4.4.3 Sufficient
Found Satisfactory survey results from faculty.
p. 92
This was confirmed by searching the Faculty Profile System. On an 8-point scale, faculty generally ranged between 6.5 and mid 7s. Vitae used to verify administrators’ qualifications.
Found Program administrators are qualified for their positions
Found Resources are adequate to administer the program
4.5 Student support
4.5.1 Sufficient
Found Satisfactory survey results from students and faculty.
4.5.2 Quality control
Found Internal audit indicates sufficient quality control in the area of student support services.
p. 93
McKay School Student Services Center (advising, field services, scholarships, career planning) in addition to BYU services. Student interviews (i.e., advisement, program satisfaction).
4.6 Policies

Teacher Education Accreditation Council (TEAC)
©TEAC One Dupont Circle Suite 320 Washington, DC 20036 202/466-7236 www.teac.org
46
TEAC Sub-component
Status TEAC Requirements for
Commitment (4.0) Citation in Brief
Probe
4.6.1 Admission
Found
Admissions policy of the program is published. Admissions policies encourage diversity and service in high demand areas.
p. 93 Saas.byu.edu/catalog/2008-2009ucat/departmenters/TeacherEduc/TEdMain.php
4.6.2 Calendar
Found An academic calendar is published. pp. 92-93
Education.byu.edu/calendar/ saas.byu.edu/calendar/2009.php
4.6.3 Accuracy
Found
Random selections of two pages in the catalog that deal with the program have no inaccurate statements about the program. Claims made in program Web site and catalog are consistent with claims made in the Brief.
Catalog and website
4.6.4 Fair grading policy
Found Grading policy of the program is published and is accurate.
p. 94 Appears on syllabi
4.7Student feedback
4.7.1 Record
Found
Program has procedures for student complaints. Program provides for student evaluations of courses.
p. 88; p. 94
Viewed policy and saw copies of correspondence with students regarding status of complaints. Reviewed online student rating reports on faculty.
Non-specific targets
Call for comment:
37 positive 2 mixed
1 negative
Call-for-comment to third parties was distributed to the parties required by TEAC policy (XXXV).
The auditors found no evidence that contradicted the faculty’s conclusion that Brigham Young University supports the Educator Preparation Program.
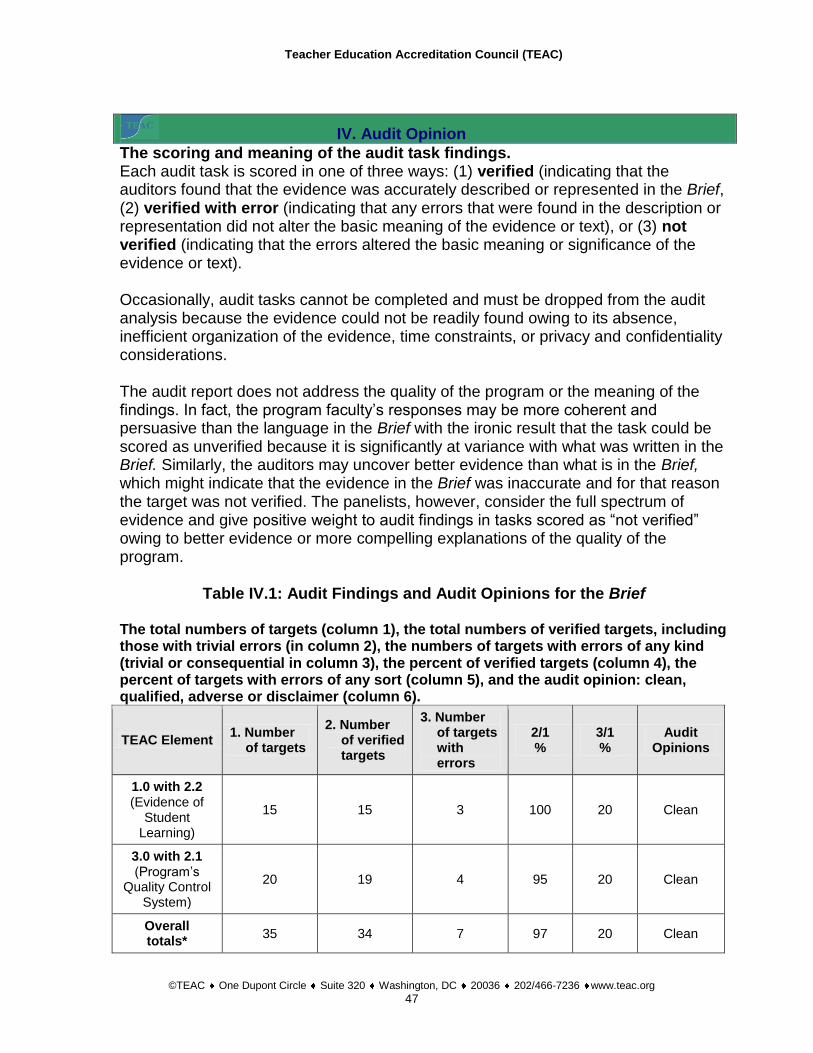
Teacher Education Accreditation Council (TEAC)
©TEAC One Dupont Circle Suite 320 Washington, DC 20036 202/466-7236 www.teac.org
47
IV. Audit Opinion
The scoring and meaning of the audit task findings. Each audit task is scored in one of three ways: (1) verified (indicating that the auditors found that the evidence was accurately described or represented in the Brief, (2) verified with error (indicating that any errors that were found in the description or representation did not alter the basic meaning of the evidence or text), or (3) not verified (indicating that the errors altered the basic meaning or significance of the evidence or text). Occasionally, audit tasks cannot be completed and must be dropped from the audit analysis because the evidence could not be readily found owing to its absence, inefficient organization of the evidence, time constraints, or privacy and confidentiality considerations. The audit report does not address the quality of the program or the meaning of the findings. In fact, the program faculty’s responses may be more coherent and persuasive than the language in the Brief with the ironic result that the task could be scored as unverified because it is significantly at variance with what was written in the Brief. Similarly, the auditors may uncover better evidence than what is in the Brief, which might indicate that the evidence in the Brief was inaccurate and for that reason the target was not verified. The panelists, however, consider the full spectrum of evidence and give positive weight to audit findings in tasks scored as “not verified” owing to better evidence or more compelling explanations of the quality of the program.
Table IV.1: Audit Findings and Audit Opinions for the Brief
The total numbers of targets (column 1), the total numbers of verified targets, including those with trivial errors (in column 2), the numbers of targets with errors of any kind (trivial or consequential in column 3), the percent of verified targets (column 4), the percent of targets with errors of any sort (column 5), and the audit opinion: clean, qualified, adverse or disclaimer (column 6).
TEAC Element 1. Number
of targets
2. Number of verified targets
3. Number of targets with errors
2/1 %
3/1 %
Audit Opinions
1.0 with 2.2 (Evidence of
Student Learning)
15 15 3 100 20 Clean
3.0 with 2.1 (Program’s
Quality Control System)
20 19 4 95 20 Clean
Overall totals*
35 34 7 97 20 Clean

Teacher Education Accreditation Council (TEAC)
©TEAC One Dupont Circle Suite 320 Washington, DC 20036 202/466-7236 www.teac.org
48
Audit Opinion: The Inquiry Brief from Brigham Young University was accurate with 97% of the targets investigated verified and only 20% of the targets overall containing trivial and inconsequential errors. Owing to 97% verified targets, the Brief received a clean audit opinion and was found to be accurate and trustworthy. The auditors are initially guided in their award of clean or qualified audit opinions by the following considerations: an element (1.0 –3.0) receives a clean opinion if at least 90% of its targets are confirmed. An element, etc., is given a qualified opinion when at least 75%, but less than 90%, of its targets are confirmed. An element that would otherwise receive a clean opinion is also given a qualified opinion if more than 25% of the targets reveal misstatements of any kind (that is, trivial or consequential). If more than 75% of the targets cannot be verified, the element or component receives an adverse opinion (or a disclaimer if more than 75% of the audit tasks cannot be performed or completed). These guidelines are not strict rules, because a simple counting of outcomes of probes may be misleading with regard to the trustworthiness of the Brief. Some audit tasks may be more revealing than others. For example, some may have targeted only minor points, and some may be merely following up on other audit tasks on a single point. Others may probe significant and central targets in the case for accreditation. The guidelines may prove unreliable in cases where the number of audit tasks is small. The audit team knows that they are not to treat the guidelines or heuristics as rules that can be mechanically applied. If the findings suggest anomalies that make the heuristic unworkable, the auditors rely on their good judgments, explaining in their audit report the difficulties they experienced and the reasons for their opinions. The auditors are also instructed to be alert to any event that is at variance with how the program is represented in the Brief. None were found. The auditors report events and experiences during the audit that were not fully consistent with the manner in which the program is portrayed in the Brief. Finally, it must be emphasized again that the audit opinion is not an opinion about the quality of the program or the degree to which the evidence in the Brief satisfies TEAC’s quality principles and capacity standards. It is solely an opinion about whether the Brief is accurate as written. The issue in the audit is only whether what was in the Brief was accurate, not whether it could be made, or was made, more accurate by additional work on the part of the program faculty or the TEAC auditors during or after the audit.

Teacher Education Accreditation Council (TEAC)
©TEAC One Dupont Circle Suite 320 Washington, DC 20036 202/466-7236 www.teac.org
49
VII. Audit Schedule
TEAC Visit Agenda Brigham Young University
April 7-9, 2009
Tuesday April 7
3:00 Arrival and check-in Courtyard Marriott Hotel
4:00-7:00 Work session Hotel
7:00 Dinner on own
Wednesday April 8
9:00-10:00 Meeting with Brief Authors 305 MCKB
(Nancy, Al, Winn, Tina, Rodney, Aaron, Gary, Roni Jo, Blair)
10:00-12:00 Work Session Document Room
12:00-1:00 Lunch (boxed lunches) Document Room
1:00-3:00 Work Session Document Room
3:00-4:00 Special Ed and Sec Ed Undergraduate Students 185 MCKB
4:00-5:00 El Ed and ECE Undergraduate Students 185 MCKB
5:00-6:00 Work Session
7:00 Dinner on own
Thursday April 9
9:00-10:00 Work Session Document Room
10:00-11:00 Full-time Arts & Sciences Faculty &Sp Ed Faculty Hinckley Center Conf Room
11:00-12:00 Full-time El Ed and ECE Faculty Hinckley Center Conf Room
12:00-1:00 Lunch (boxed lunches) Document Room
1:00-3:00 Work Session Document Room
1:30-2:30 ED340, Children’s Literature class observation MCKB
3:00-4:00 President Cecil O. Samuelson, VP John Tanner
VP Jeff Keith, Dean Richard Young D-346 ASB
4:00-5:00 Cooperating Teachers and University Supervisors 2295 Conf Center
5:00-6:00 Part-Time Faculty 2287 Conf Center
6:00-7:00 Work Session Document Room
7:00 Dinner on own
Friday
9:00-9:30 Next Steps Meeting 305 MCKB
(Nancy, Al, Winn, Tina, Rodney, Aaron, Gary, Roni Jo, Blair)
9:30-11:00 Additional Work Session (if needed) Document Room
NOTE: Schedule of classes provided for auditors to observe as appropriate.