teacher certification in indonesia: a confusion of means and … · 2015-02-19 · teacher...
TRANSCRIPT

Teacher Certification in Indonesia: A Confusion of Means and Ends
Mohamad Fahmi, Achmad Maulana and Arief Anshory Yusuf

Plan of the Talk
2

INTRODUCTION
3

Introduction
4

Introduction
5
Introduction
6

Purpose of Study
7

TEACHER CERTIFICATION IN INDONESIA
8
Teacher Certification: Rationale
9
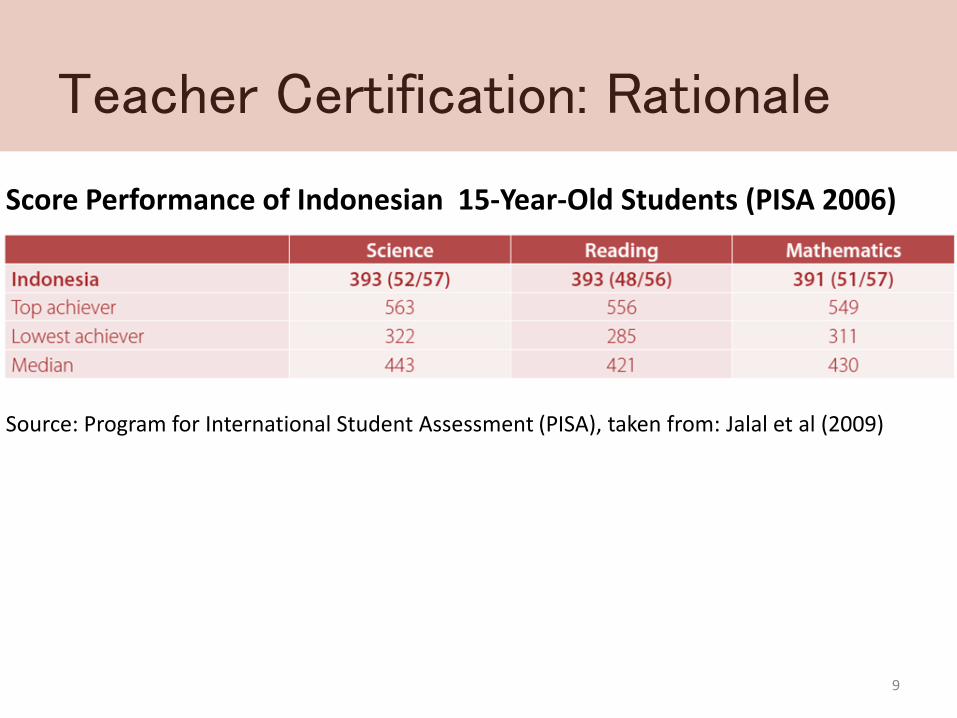
Source: Program for International Student Assessment (PISA), taken from: Jalal et al (2009)
Score Performance of Indonesian 15-Year-Old Students (PISA 2006)

Teacher Certification: Rationale
10
Primary Teacher Absence Rate in Public Schools 2002-2003
Taken from: Jalal et al (2009)

Teacher Certification: Rationale
11
Source: World Education Indicators 2007, Table 5.h.i., p. 144. Taken from: Jalal et al (2009)
Comparison of Teacher Salaries across Countries by Level of Education (in US Dollars)

Teacher Certification: Objective
12

Teacher Certification: Organization
13

Teacher Certification: Organization
14

Teacher Certification: Organization
Central Level
• A Consortium for Teacher Certification (KSG) : Directorate General of Higher Education, the Directorate General for PMPTK (Peningkatanmutu pendidik dan tenaga kependidikan), MoRA and LPTKs.
Provincial Level
• Provincial education office and Lembaga Penjaminan MutuPendidikan (LPMP)
Kabupaten/Kota Level
• Local education office
15
Coordinator in MoNE

Teacher Certification: Organization
Central Level
• Directorate General for Islamic Education: The Directorate of Islamic Schools, Directorate of Islamic Education and Directorate of Religious and Islamic Boarding Schools
Provincial Level
• MoRA’s provincial office
Kabupaten/Kota Level
• Local MoRA’s office
16
Coordinator in MoRA

Teacher Certification: Requirement
17

Teacher Certification: Selection Criteria
18

Teacher Certification: Assessment
19

Teacher Certification: Assessment
20

Teacher Certification: Cost
21
Cumulative Targets for Teacher Certification Program to 2015
Taken from Jalal et al (2009)
IDR MillionIDR Million

Teacher Certification: Funding
22

Teacher Certification: Challenge
23

Teacher Certification: Challenge
24

METHODOLOGY
25

Research Question
26

Research Methodology
27

Data Collection
28

Sampling Frame
We purposively choose teachers from both certified and non-certified based on :
1. Teachers must teach final year student in 2009 or earlier
2. They are class primary teacher
3. A teacher is included in the treatment if the application for the teacher certificate is approved prior to 2010
29

Summary Statistics
30
Variables Obs. mean s.d. Min. Max.
Already certified in 2009 290 0.321 0.468 0 1
Education and experience
Years of education 294 15.480 1.021 12 18
Teaching experience (years) 294 24.014 6.681 2 37
Teachers portfolio
Training experience (dummy)
on school management 294 0.323 0.468 0 1
on teaching 294 0.867 0.340 0 1
on specific subjects 294 0.820 0.385 0 1
Active in social organizations (dummy) 294 0.493 0.501 0 1
Ever received awards in teaching (dummy) 294 0.180 0.385 0 1
Other characteristics
Gender (female = 1, 0 otherwise) 294 0.571 0.496 0 1
School size (number of classrooms) 294 9.500 7.614 2 46
School area (urban=1, 0=rural) 294 0.531 0.500 0 1
Source: GDN-UNPAD 2010 Teachers survey

Estimating the Impact
31
Before certification (ex-ante)
After certification (ex-post)
Certified teachers A C Non-certified teachers B D
• Comparing C and D will be biased since the program participation is not
completely random. Teacher with better qualifications, hence more likely to participate,
• Acknowledging the above circumstance, Rosenbaum and Rubin (1983) developed Propensity Score Matching (PSM) that could minimize the endogenity problem to program participation.
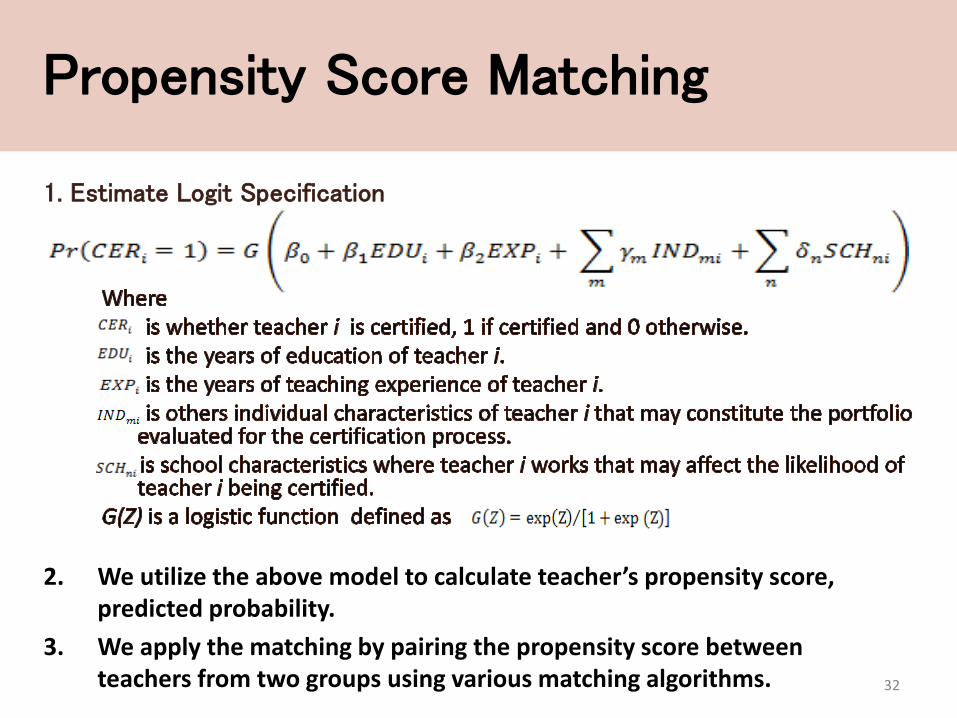
1. Estimate Logit Specification
32
2. We utilize the above model to calculate teacher’s propensity score, predicted probability.
3. We apply the matching by pairing the propensity score between teachers from two groups using various matching algorithms.
Propensity Score Matching

Illustration of Difference-in-Difference Method
33
Difference in Difference
• Student’s exam score of both certified and non-certified teachers improve. • The rate of the improvement is higher for the teachers who were certified in 2009. •The difference in the rate of improvement can be interpreted as the impact of the certification in 2009. This impact is called Difference-in-Difference

RESULTS AND DISCUSSIONS
34

Logistic Model of Certification
35
Variables Coef-
ficient standard
error
Marginal
effects standard
error
Education and experience
Years of education 0.975 0.222*** 0.167 0.034***
Teaching experience (years) 0.220 0.043*** 0.038 0.006***
Teachers portfolio
Training experience (dummy)
on school management 0.256 0.316 0.045 0.057
on teaching 0.377 0.458 0.060 0.067
on specific subjects 0.028 0.404 0.005 0.069
Active in social organizations (dummy) 0.043 0.306 0.007 0.053
Ever received awards in teaching (dummy) 0.561 0.369 0.106 0.075
Other characteristics
Gender (female = 1, 0 otherwise) 0.017 0.319 0.003 0.055
School size (number of classrooms) 0.037 0.020* 0.006 0.003*
School area (urban=1, 0=rural) -0.331 0.343 -0.057 0.059
Constant -22.395 3.966
Likelihood ratio 77.79***
Log likelihood -143.05
Pseudo R2 0.2138
Number of observation 290
Note: ***) is significant at 1%, **) is significant at 5%, *) is significant at 10%

What the logit tells us?
36

The Matched and unmatched difference in the student exam score in 2010 by various matching algorithm (1)
37
Note: ATT stands for Average Treatment Effect of the Treated. It is the estimated difference due to treatment, in this case, due to certification. *: Standard error for ATT is estimated using bootstrap with 1000 replications.Source: Author’s calculation
Math Sample Treated Controls Difference S.E.*
Nearest-neighbor Unmatched 7.438 7.386 0.052 0.137
ATT 7.449 7.571 -0.122 0.243
Caliper Unmatched 7.438 7.386 0.052 0.137
ATT 7.454 7.623 -0.169 0.237
Kernel Unmatched 7.438 7.386 0.052 0.137
ATT 7.449 7.446 0.003 0.182
Radius Unmatched 7.438 7.386 0.052 0.137
ATT 7.449 7.386 0.063 0.147
Ties Unmatched 7.438 7.386 0.052 0.137
ATT 7.449 7.565 -0.116 0.243

The Matched and unmatched difference in the student exam score in 2010 by various matching algorithm (2)
38
Bahasa Sample Treated Controls Difference S.E.*
Nearest-neighbor Unmatched 6.917 6.854 0.063 0.078
ATT 6.918 6.938 -0.020 0.138
Caliper Unmatched 6.917 6.854 0.063 0.078
ATT 6.931 6.951 -0.019 0.142
Kernel Unmatched 6.917 6.854 0.063 0.078
ATT 6.918 6.916 0.003 0.094
Radius Unmatched 6.917 6.854 0.063 0.078
ATT 6.918 6.854 0.064 0.084
Ties Unmatched 6.917 6.854 0.063 0.078
ATT 6.918 6.933 -0.015 0.131
Note: ATT stands for Average Treatment Effect of the Treated. It is the estimated difference due to treatment, in this case, due to certification. *: Standard error for ATT is estimated using bootstrap with 1000 replications.Source: Author’s calculation

The Matched and unmatched difference in the student exam score in 2010 by various matching algorithm (3)
39
Note: ATT stands for Average Treatment Effect of the Treated. It is the estimated difference due to treatment, in this case, due to certification. *: Standard error for ATT is estimated using bootstrap with 1000 replications.Source: Author’s calculation
Math & Bahasa Sample Treated Controls Difference S.E.*
Nearest-neighbor Unmatched 7.177 7.127 0.050 0.169
ATT 7.184 7.254 -0.071 0.161
Caliper Unmatched 7.177 7.127 0.050 0.100
ATT 7.193 7.287 -0.094 0.168
Kernel Unmatched 7.177 7.127 0.050 0.100
ATT 7.184 7.184 -0.001 0.126
Radius Unmatched 7.177 7.127 0.050 0.100
ATT 7.184 7.127 0.057 0.106
Ties Unmatched 7.177 7.127 0.050 0.100
ATT 7.184 7.249 -0.065 0.169

Matching results
40

Simple equation to estimate DiD:
41
is the student’s exam score of teacher i in period t (2008 and 2010)is whether teacher i was certified in 2009 (1 if certified and 0 otherwise)is the time period, 1 if 2010 and 0 if 2008.is the error term.

Difference in Difference Estimate
42
Math Bahasa Math & Bahasa
Constant 6.516*** 6.828*** 6.672***
(0.115) (0.077) (0.089)
Certified in 2009 (1 if yes, 0 otherwise) 0.088 -0.072 0.008
(0.336) (0.225) (0.261)
Period (1 if 2010, 0 if 2008) 0.871*** 0.027 0.456***
(0.146) (0.098) (0.114)
Certified Period -0.063 0.117 0.020
(0.428) (0.286) (0.333)
Note: ***) is significant at 1%, **) is significant at 5%, *) is significant at 10% Number in parentheses is standard error.

Result for DiD
43

Why the teacher certification does not have the expected impact?
44

Policy Recommendations
45
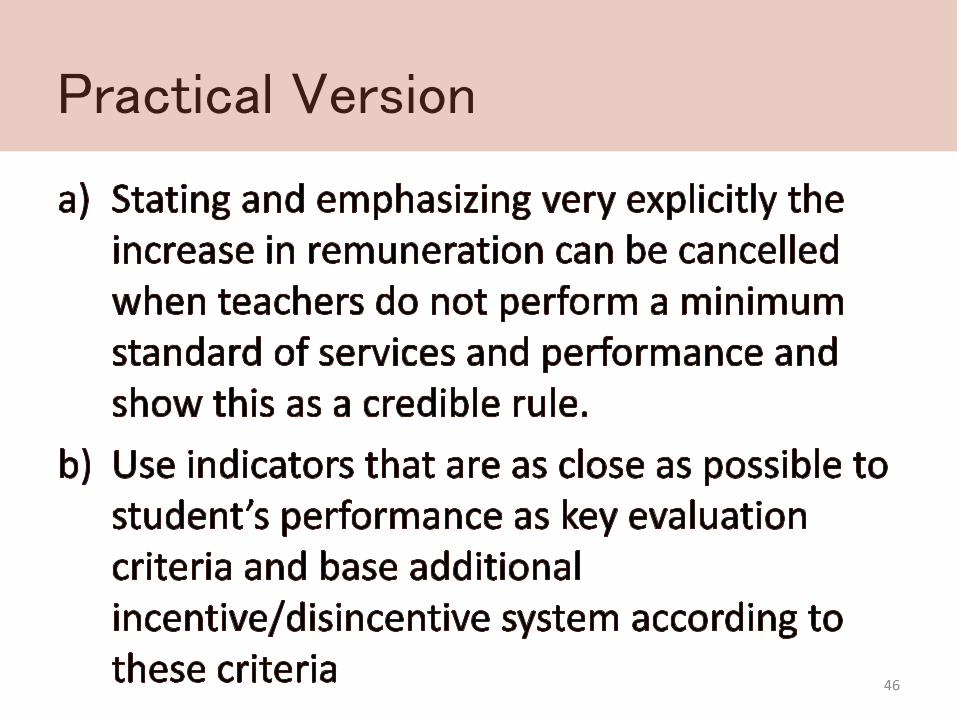
Practical Version
46

Practical Version
47

THE END - THANK YOU
48