teacher applicant hiring and teacher performance: … · teacher applicant hiring and teacher...
TRANSCRIPT

1
Teacher Applicant Hiring and Teacher Performance:
Evidence from DC Public Schools
Brian Jacob University of Michigan
Jonah Rockoff Columbia Business School
Eric Taylor Stanford University
Ben Lindy Teach for America
Rachel Rosen University of Michigan
DRAFT – NOT FOR GENERAL DISTRIBUTION – DO NOT CITE
February 2015
Abstract
Selecting more effective teachers among job applicants during the hiring process could be a highly cost-effective means of improving educational quality, but there is little research that links information gathered during the hiring process to subsequent teacher performance. We study the relationship among applicant characteristics, hiring outcomes, and teacher performance in Washington DC Public Schools (DCPS). We take advantage of detailed data on a multi-stage application process, which includes written assessments, a personal interview, and sample lessons, as well as the annual evaluations of all DCPS teachers, based on multiple criteria. We find that several background characteristics (e.g., undergraduate GPA) as well as screening measures (e.g., applicant performance on a mock teaching lesson) strongly predict teacher effectiveness. Interestingly, we find that these measures are only weakly, if at all, associated with the likelihood of being hired, suggesting considerable scope for improving teacher quality through the hiring process.

2
“The best means of improving a school system is to improve its teachers. One of the most effective means of improving the teacher corps is by wise selection.”
Ervin Eugene Lewis, Superintendent of Schools, Flint, Michigan, 1925
Improving selection at the hiring stage holds great potential for improving teacher quality
and raising educational achievement. This notion is quite old, as evidenced by the above
quotation, and continues to be motivated by findings from recent research. Teachers vary
substantially in their impacts on student outcomes in both the short and long run (Chetty et al.
2014a,b) and, given this variation in teacher performance, some have argued that the greatest
hiring cost faced by schools is the risk of exposing a group of students to a new teacher who
turns out to be highly ineffective (Staiger and Rockoff, 2010). In addition, collection of on-the-
job performance data on teachers (e.g. standardized student testing, collection of observation
data, portfolios of student work) requires significant public resources and often entails difficult
labor negotiations (Baker and Santora 2013) while schools and school districts have wide
freedom to require teaching applicants to submit information as part of the hiring process.
Nevertheless, despite many decades of research, little progress has been made in
establishing rigorous methods to select individuals likely to become successful teachers.
Selection based solely on basic credentials such as certification and graduate education résumés
is likely to yield few benefits. Economists, though latecomers to the issue of teacher quality,
have repeatedly found that these credentials have little or no power to explain variation in
performance across teachers. More recent research has shown some promising results regarding
the predictive power of indices of teacher characteristics, although these have included measures
collected in low-stakes research surveys (Rockoff et al. 2011) or administrative data unavailable
to schools and school districts (Boyd et al. 2008). Only one concurrent study (Goldhaber et al.

3
2014) examines the extent to which teacher performance can be predicted using data collected as
part of an actual hiring process.1
In this paper, we use three years of data on teacher applications, hiring, and performance
in the Washington DC Public Schools (hereafter DCPS) to gain insights into how various
measures might be used to improve teacher hiring. The DCPS setting presents several advantages
for this purpose. First, the district implements a centralized multi-stage application process. This
provides us with a number of applicant characteristics as well as evaluations on written
assessments, personal interviews, and teaching auditions. Second, passing each stage of the
application process was based on meeting a particular performance threshold. This allows us to
separate the impact of making it through the process (and into a recommended pool of
applicants) from the impact of having a high scoring application on the probability of being hired
into DCPS. Third, DCPS conducts annual evaluations of all of its teachers under its “IMPACT”
system, under which a wide variety of performance data is collected.2 This allows us to evaluate
the performance of teachers in all grades and subjects, as opposed to earlier work focusing on
teachers whose students take standardized tests – typically math and English teachers in grades 4
– 8.
We find that several background characteristics (e.g., undergraduate GPA) as well as
screening measures (e.g., applicant performance on a mock teaching lesson) strongly predict
teacher effectiveness. Interestingly, we find that these measures are only weakly, if at all,
1 Some suggestive evidence also comes from selection into two alternative certification programs in New York City. Rockoff and Speroni (2011) find that math teachers hired through the Teaching Fellows program were slightly more effective in their first year of teaching if they had a high rating during program selection. Dobbie (2011) finds that an index of eight criteria used to select applicants into the Teach for America (TFA) program are positively related to effectiveness among teachers during their first years of teaching. 2 Dee and Wyckoff (2013) describe IMPACT’s incentives in greater detail and demonstrate that the program affected teacher turnover and measured performance on various IMPACT components.

4
associated with the likelihood of being hired, suggesting considerable scope for improving
teacher quality through the hiring process.
The rest of the paper proceeds as follows. Section 2 describes the teacher application,
hiring, and evaluation processes in DCPS. In Sections 3 and 4, we present empirical findings
with regard to selection into DCPS and performance among those selected. Section 5 concludes.
2. Teacher Application, Hiring, and Performance Evaluation in DCPS
In this study, we analyze data from Teach DC, a multi-stage teacher application process
used in DCPS since 2009. Teach DC was developed as a means to centralize and formalize the
teacher application process, with two goals in mind. First, DCPS wanted to increase its
understanding of how applicant characteristics related to hiring and on-the-job performance, and
therefore needed to collect standardized data. Second, DCPS sought to streamline the hiring
process by screening out undesirable applicants and providing principals with a set of
“recommended” candidates on which they could focus their search efforts. Importantly,
successful completion of the Teach DC application process is not required for hiring into DCPS,
although, as we show below, recommended candidates are far more likely to be hired than the
average applicant.
We use data from applications made in the years 2011 through 2013, when the district
made several notable changes to expand and improve the program. We analyze subsequent hiring
and performance data from the school years 2011-12 through 2013-14. Thus, we have three
cohorts of candidates and new hires, and can observe retention and performance for the 2011
applicants for up to three years.

5
2.1 Teach DC Application Process and Data Collection
Teacher candidates submitted their application to the Teach DC system online during the
spring and summer. The initial application collected some basic background information such as
education history, employment experience, and eligibility for licensure.3 Following collection of
this preliminary information, district officials reviewed applications in several stages. At the end
of each stage, only applicants who pass a specified performance threshold were allowed to
proceed. Applicants who pass all stages (as well as a background check) are included in the
recommended pool seen online by principals.
In 2011, there were four stages of evaluation; two written evaluations (general essays
and subject-specific assessments), an interview, and a teaching audition. In 2012 and 2013, the
general essay was dropped, and applicants were assessed on the remaining three stages. Below
we briefly summarize the key aspects of the evaluation process. Appendix A provides a more
detailed explanation of the process each year. Appendix Table 1 summarizes the content of the
stages in each year.
During 2011, applicants first submitted online essays of 200-400 words: one essay on
instructional strategies for low-performing students, and one essay on the use of student
achievement data. These essays were scored by one of several district office reviewers for
content and writing quality on a 4 point scale (in 0.1 point increments), and a composite score
was calculated using weights of 40% for the content of each essay and 20% for overall writing
quality. As a general rule, applicants proceeded if they achieved a composite score of 2.0 or
higher.
3 Applicants deemed ineligible for a teaching license in DC are not allowed to proceed further, and we do not analyze these ineligible applications. To be licensed in DC, teachers must have a bachelor’s degree, complete a teacher preparation program (traditional or alternative), and pass both the PRAXIS I and relevant PRAXIS II exams (or substitute exams). Teachers licensed in another state are also generally eligible for a DC license.

6
In addition to the essays used for selection at this stage, applicants were asked additional
questions that were not used in the selection process and were not provided to principals that
hired new teachers. Importantly, applicants were not told that these items were different than the
essays or any other information that they submitted, so these data are likely indicative of
responses that DCPS would receive if they were to be used in the selection process.
Applicants answered multiple-choice questions to measure the “Big Five” personality
traits (Costa and McCrae, 1992) and Grit, defined as “the tendency to sustain interest in and
effort toward very long-term goals.” 4 In addition, applicants answered 50 multiple-choice
questions from the Haberman Star Teacher Pre-Screener (Haberman, 1993), a commercial
teacher applicant screening instrument. Used by a number of large urban school districts
throughout the U.S., the Haberman Pre-Screener is intended to provide school officials with
guidance on how effective a particular candidate is likely to be in an urban classroom.5
In the subject-specific written assessment, applicants were assessed on their content area
knowledge and knowledge of instructional practices. Applicants selected a subject area (e.g., art,
math, Biology, etc.) and level (i.e., elementary, middle, or high school) to which they were
applying, and then were asked to complete a subject- and level-specific task. Most applicants
were asked to read a case-study in which students demonstrate some misunderstanding about the
subject and to write a 300-400 word essay explaining the nature of the students’ misconceptions 4 Personality traits were measured using a shortened version of the Big Five Inventory (John, Donahue, and Kentle 1991) in which applicants expressed their degree of agreement with how a phrase (e.g., “I am talkative”) described themselves. The 16 items focused mostly on extroversion (5 questions) and conscientiousness (5 questions), two traits linked to job performance in earlier studies (Barrick and Mount, 1991; Rockoff et al., 2011), and less on measuring agreeableness (2 questions), neuroticism (2 questions), or openness to new experience (2 questions). Grit was measured using an eight item version of the instrument developed by Duckworth and Quinn (2009). Example items include “is not discouraged by setbacks” and “has difficulty maintaining focus on projects that take more than a few months”. The definition of Grit is provided at: https://sites.sas.upenn.edu/duckworth , accessed on March 17, 2014. 5 This assessment was developed by first interviewing teachers thought to be highly effective and designing questions to capture their attitudes and beliefs. The Haberman Foundation also produces an interview protocol and scoring rubric which is intended to assist district officials in identifying individuals likely to be effective urban school teachers, although this protocol was not used in DCPS during the period of our study.

7
and describing instructional strategies for resolving them. In 2011 and 2012, applicants for
elementary school teaching positions were required to write an essay assessing content
knowledge in English language arts and to complete the Knowledge of Mathematics for
Teaching (KMT) test, a multiple choice test intended to measure understanding and skills
distinctly valuable to teaching math (Hill et al. 2004). Applicants for middle school math
positions in these two years completed the KMT but did not have to complete an additional
essay. In 2013, DCPS did not administer the KMT assessment, instead relying on essays alone to
evaluate each candidate’s content knowledge.
The content and writing quality of these essays were scored by a team of about six DCPS
personnel in each year. Each essay was scored by one person on three dimensions, each with a
4-point-scale rubric. KMT test scores were also scaled to have a maximum of 4 points possible.
Essay scores and, when applicable, KMT scores were averaged to obtain a final score to
determine whether the applicant passed to the next stage. The passing threshold varied somewhat
across years and was altered within the year at certain points and for certain subject areas in
order to obtain enough qualified applicants.
The next stage in the application process consisted of a 30 minute interview and 10
minute demonstration lesson. Interviews were conducted by the same DCPS personnel who
scored the subject-specific essays, as well as several “Teacher Selection Ambassadors” (TSAs),
DCPS teachers rated Highly Effective or Effective who received training by DCPS staff in order
to assist with the Teach DC selection process. Interviews could be done in person or over the
phone, and applicants were asked to respond to a series of structured questions covering five
areas: track record of success, response to challenges, contribution to work environment,

8
ownership of high expectations, and continuous learning.6 Applicants’ responses were scored on
a 4-point scale using a detailed rubric.
The demonstration or “mini” lesson could be done in person or submitted by video.
Applicants were allowed to choose the topic for this self-contained 10 minute lesson and had the
option to provide lesson materials. DCPS officials scored applicant performance according to
selected dimensions of the Teaching and Learning Framework (TLF), the same rubric used to
measure classroom performance under the DCPS IMPACT teacher evaluation system, which we
describe in more detail below.7 Applicant performance on the mini-lesson and interview were
combined to yield a final score, and applicants scoring above a specified threshold were invited
to proceed to stage 4 (see Appendix A for details of the scoring and cutoffs). In 2013, the DCPS
did not require the mini-lesson and applicants proceeded to stage 4 on the basis of the interview
score alone. The final stage in the Teach DC process consisted of a teaching audition in which
the applicant taught a complete lesson of approximately 30 minutes. All auditions in 2011 were
conducted in DCPS classrooms but were videotaped for evaluation. In 2012, applicants were
permitted to submit a videotaped teaching lesson in lieu of the “live” audition, while in 2013
auditions were based completely on video submissions. In each year, DCPS staff and TSAs
evaluated the auditions using the same DCPS classroom observation protocol (i.e., the TLF
6 For example, under “response to challenges,” interviewees were asked, “tell me about the most significant behavior challenge that you’ve encountered with a student (or group),” with follow-up questions like “what did you do first to address the challenge,” “what was the result,” and “what ultimately happened.” 7 Applicants receive a score of 1-4 in five areas: lead well-organized objective-driven lessons, explain content clearly, engage students in learning at all levels, check for student understanding, and maximize instructional time. The scoring rubric is quite detailed and the current version can be found at: http://dcps.dc.gov/DCPS/Files/downloads/ABOUT%20DCPS/2013-2014%20TLF.pdf. To provide an example of how scores are anchored, some of the language describing a “4” in “maximize instructional time” includes “routines, procedures, and transitions are orderly, efficient, and systematic with minimal prompting from the teacher.” By contrast, a score of “1” is described by “routines or procedures are not evident or generally ineffective; the teacher heavily directs activities and transitions.”

9
rubric mentioned above), with each audition rated by one TSA.8 Applicants received scores
from 1-4 on several different elements, with all element scores combined to yield a final score.
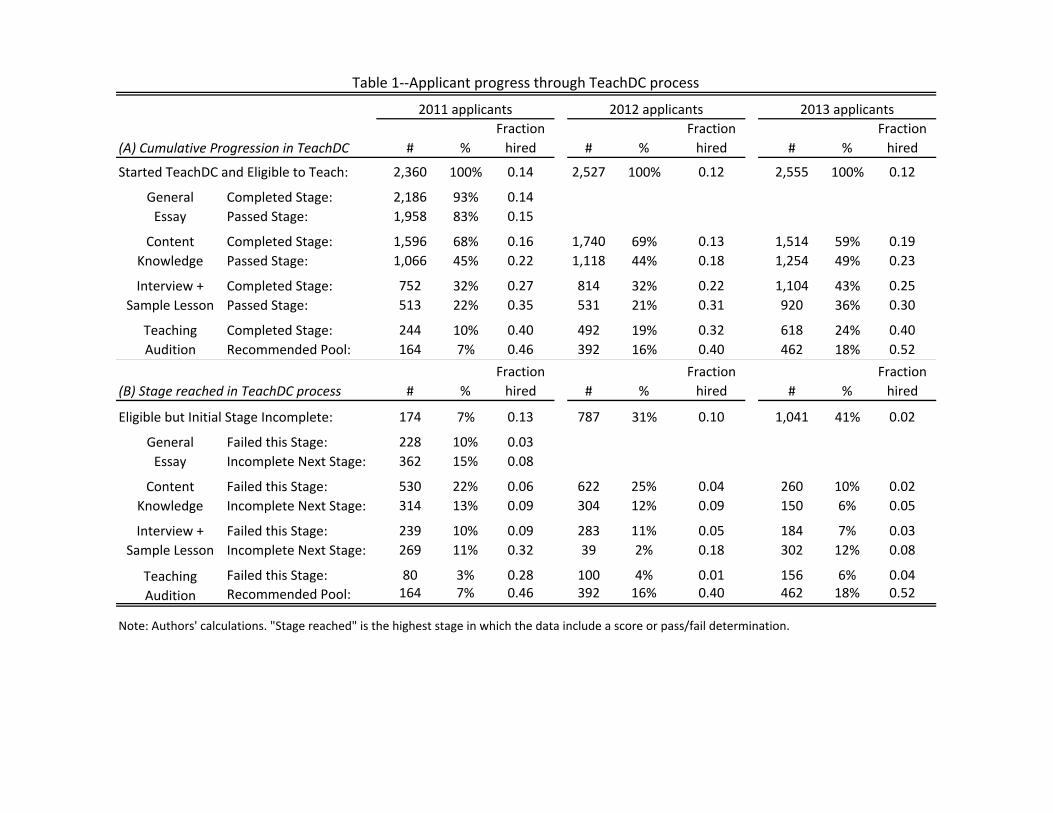
Table 1 shows the number of applicants evaluated in each recruiting year and each stage,
as well as whether or not they passed the stage and the fraction of applicants hired in each
possible stage outcome. There were roughly 2,500 applicants per year and 12-13 percent were
hired into DCPS. In each year, roughly 60-70% of applicants completed the subject-specific
written assessment and 30-40% of applicants completed the interview. However, the number of
applicants completing the audition rose significantly after 2011, in part due to the relative ease of
evaluating applicants’ submissions of video instead of arranging live auditions in DCPS
classrooms. Applicants did not have to make it into the Teach DC recommended pool in order to
be hired into DCPS, and, in panel B, we see that in both 2011 and 2012, the percentage of
applicants hired among those not even evaluated in the initial stage was only slightly below
average. However, among applicants who are evaluated in each stage, those who failed the
evaluation are less likely to be hired than those who passed. Among those applicants who passed
the final audition stage, the fraction hired was 46 percent, 39 percent, and 54 percent in years
2011, 2012, and 2013, respectively.
Our main analyses focus on applicants’ background characteristics and three composite
measures drawn from the application stages: (i) a pedagogical and content knowledge (PCK)
score, (ii) interview score, and (iii) audition score. Each of the three is a rescaled composite of
the scores collected by DCPS. To obtain the PCK score we first standardize (mean zero, standard
deviation one within years) the subject-specific essay scores on content and writing quality, as
8 In 2013, approximately 15% of interviews and 30% of the auditions were checked by a DCPS staff member as part of a “random audit” to assess the reliability of TSA ratings. The correlation between the average scores initially assigned and those after review was 0.87 for interviews, although 45% had at least one component score changed and 17% had the final recommendation overturned. Only 20% of reviewed auditions had any component score changed, leading to roughly 10% of reviewed auditions having the final recommendation overturned.

10
well as the KMT score. Our “PCK score” is the average of all standardized scores available for a
teacher. For 2011 and 2012 applicants, our “interview score” is the average of two component
scores, each standardized: (a) the mean of the applicant’s TLF scores for the mini-lesson, and (b)
the mean of the applicant’s behavioral interview questions scores. For 2013 applicants, we do not
have separate scores for the mini-lesson and interview questions, but we have scores on several
components (e.g., “instructional expertise,” “communication skills”) as well as several binary
judgments (i.e., “outstanding,” “no reservations,” “reservations”) which we combine using factor
analysis to create the 2013 interview score. For each of the three years, a factor analysis on the
components of the audition score yields just one factor, and we use the factor analysis weights in
each year to construct our audition score.9
2.2 Hiring Process
As in many large school districts, hiring in DCPS has always been (and continues to be) a
largely decentralized process, done by individual schools, with school principals making final
hiring decisions. To assist principals in hiring, DCPS provides an online database which lists all
license-eligible applicants who have passed all stages in the Teach DC process.10 These
recommended applicants can be filtered by subject area to help principals find candidates, and
principals can navigate through the online database to find out further information on how the
applicants scored in the Teach DC process. While we know that DCPS principals were made
aware of the online applicant database during a regularly occurring and mandatory meeting of
9 We get virtually identical results if we use a simple unweighted average of the component scores within the audition measure. 10 In addition to Teach DC, there are also two alternative certification programs, Teach for America and the DC Teaching Fellows, which help recruit new DCPS teachers. In the school year 2011-12, we observe over 300 new DCPS teachers in the Teach DC applicant data, while the DC Teaching Fellows program and Teach for America brought in, respectively, roughly 100 and 60 new DCPS teachers.

11
school administrators, the district does not track whether principals used the database, nor
whether they proceeded beyond the list of candidates to view applicants’ scores in any of the
hiring stages. As we show below, evidence suggests that principals made use of the list of
recommended candidates, but did not rely on the detailed application scores to select
applicants.11
2.3 Performance Evaluation Process and Scores
Every summer, each DCPS teacher’s performance evaluation for the previous school year
is summarized in a single “IMPACT” score. This high-stakes score directly determines personnel
decisions ranging from termination to significant salary increases. An IMPACT score is
composed of several performance measures, which vary depending on the grade(s) and subject(s)
the teacher is assigned. We observe final IMPACT scores and all component scores (described
below) for all district teachers in the years 2011-12 through 2013-14.
The first component of the IMPACT score is based on measures of student learning. For
teachers of math or reading in grades 4 through 8, this component includes an “individual value-
added score” (IVA) based on the DC Comprehensive Assessment System (DC-CAS)
standardized tests. These teachers, known as “Group 1”, represent about 15 percent of DCPS
teachers. All teachers are evaluated with a “Teacher-assessed Student-learning” score (TAS). At
the start of the school year each teacher sets student learning goals based on non-DC-CAS
assessments which are scored by the teacher, as well as weights if multiple assessments are used.
The principal must approve the assessments, weights, and learning goals. At the end of the year,
11 In personal correspondence, DCPS officials indicated their belief that few principals accessed information beyond examining teachers in the recommended pool for the subject in which they were interested in hiring. Also, it is important to note that the online database includes neither the personality measures nor the Haberman teacher screener score collected in 2011.

12
the principal validates the assessment scores and evaluates accomplishment of the learning goals
using a rubric.12 Additionally, in 2011-12 (and earlier years), 5 percent of all teachers’ final
IMPACT score is a measure of school value-added on DC-CAS tests.
The second component of all teachers’ evaluation is a classroom observation score. Each
teacher is typically observed five times during the year, three times by a school principal and
twice by a “master educator” (i.e., an experienced teacher whose conducts observations full-time
at many schools). Teachers’ performance during classroom observations is scored using the
district’s own Teaching and Learning Framework (TLF) rubric.13 Observers assign scores of 1-4
in several areas of practice which are averaged within observations, and then these composites
are averaged across observations.14
The remaining two evaluation components are assessed solely by the school principal.
Principals rate each teacher’s “commitment to the school community” (CSC) using a rubric that
covers partnerships with parents, collaboration with colleagues, and support for school-wide
initiatives and high expectations. Last, the school principal can deduct a certain number of points
from a teacher’s final IMPACT score on the basis of poor attendance, tardiness, disrespect of
others, or failure to follow policies and procedures. This last component is known as “core
professionalism” (CP).
Teachers’ final IMPACT scores are a weighted average of the various component scores;
Appendix Table 1 summarizes the weights, which changed between the school years 2011-12
and 2012-13. The final IMPACT score determines the teacher’s impact rating category, based
12 In the 2011-12 school year (and before) IVA was the only student learning component for Group 1 teachers even though these teachers do have TAS scores. 13 The TLF rubric is modified somewhat for teachers in kindergarten and younger classrooms, and teachers who work with special education or English language learner students in non-traditional settings. A separate rubric is used for teachers working with students with autism. 14 Examples of areas of practice include “explains content clearly”, “engages students at all learning levels”, “provides students multiple ways to move toward mastery”, “checks for student understanding”, “maximizes instructional time and builds a supportive”, and “learning-focused classroom.”

13
on pre-specified ranges. There are four possible ratings: ineffective, minimally effective,
effective, and highly effective.
Teachers in the ineffective category are immediately dismissed. Teachers are also
dismissed if they fall in the minimally effective category for two consecutive years. At the other
end of the distribution, teachers scoring in the highly effective category receive a one-time bonus
of as much as $25,000. If a teacher is rated “highly effective” for two consecutive years, she
received a substantial permanent increase in salary; Dee and Wyckoff (2013) estimate this could
be worth a 29 percent increase in current value of total earnings over a 15 year horizon.
Our primary measure of job performance combines the several IMPACT component
scores using weights determined by factor analysis. Specifically, we first conduct a factor
analysis of the scores: overall classroom observation, the individual value-added (if available),
the teacher-assessed student achievement (if available), commitment to school community, and
core professionalism. In every year, this analysis yields only one significant “performance
factor,” which we standardize (mean zero, standard deviation one) within school years. Using a
standardized version of the official, district-generated IMPACT score teachers actually received
yields similar results. We prefer the performance factor because the data indicate very similar
weights on each component across years, while there were considerable changes across years in
weights used by IMPACT (e.g., the TAS component score is completely omitted from the
calculation of IMPACT for Group 1 teachers in 2011).

14
2.4 Sample & Descriptive Statistics
We use data on 7,640 individuals who applied through Teach DC in the three years 2011-
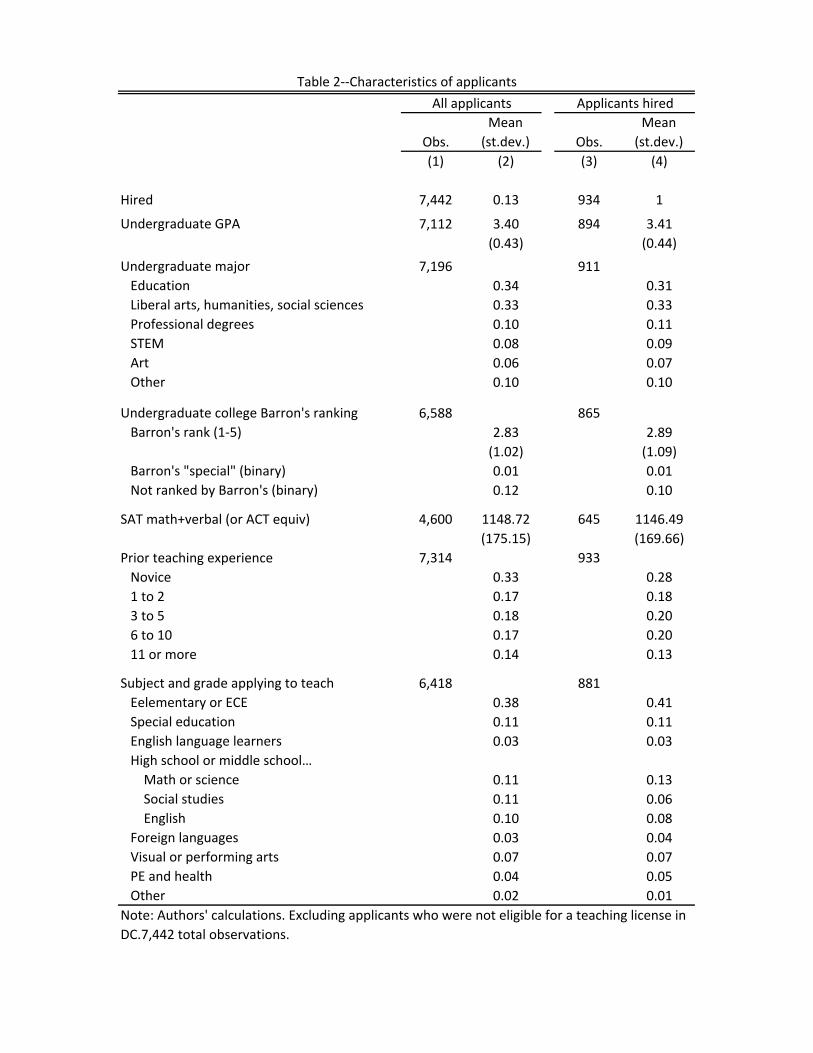
2013 and were eligible for a teaching license in DC.15 Table 2 presents summary statistics for
applicants’ SAT scores, undergraduate GPA and college selectivity (using a six category ranking
developed Barron’s Profiles of American Colleges (2009)), teaching experience, and other
background measures. Note that we do not have data on the applicant’s race or gender; the
district is not permitted to require that applicants provide this information.
Table 3 shows the pairwise correlations among several key background characteristics
and application performance scores. While every correlation is positive, they are all fairly low in
magnitude and some are not statistically significant. The highest correlations are between the
interview and audition scores, which are roughly 0.2. The PCK score is not significantly
correlated with either the interview or audition measures.16 These correlations suggest the
potential for each stage in the application process to be capturing distinct information about
teaching applicants, rather than repeatedly measuring the same characteristics and skills. Of
course, low correlations also may indicate a considerable amount of noise in each score. The
three measures of a candidate’s academic achievement (SAT score, undergraduate GPA, and
selectivity of undergraduate institution) are all modestly positively correlated, and are slightly
negatively correlated with a candidate’s prior experience in teaching. There are small positive
correlations between these academic achievement measures and application performance scores.
The bottom panel of Table 3 presents a correlation matrix for the 2011 application cohort
that includes the additional measures collected in that year. In general, these additional measures
15 We drop 198 applicants who participated in a Fast Track application option in 2011. Our results are not sensitive to including these applicants. 16 The magnitudes of the correlations vary somewhat across cohort, although the general pattern of strong vs. weak associations are similar.

15
are not at all highly correlated with any of the other application performance measures.
Exceptions include a modest correlation between extraversion and interview score (0.15) and
between the Haberman score and the PCK score (0.21).
3. Association between Applicant Characteristics and Likelihood of Being Hired
To examine the relationship between applicant characteristics and the likelihood of being
hired, we estimate a series of linear probability models of the form:
(1.1) Hi = Xi + ssDsi + i
where Hi is an indicator for hire into DCPS, Xi is a vector of teacher characteristics, and Dsi is an
indicator for the highest stage the individual reached in the Teach DC application. The
coefficients of interest are contained in the vector —to what extent do applicant characteristics
predict hire into DCPS, controlling for whether the applicant was listed in the recommended pool
of candidates (which we know strongly predicts hiring).
For ease of exposition, we present results separately for applicant background variables
(e.g., prior teaching experience, SAT/ACT score) and scores on the TeachDC assessments (e.g.,
interview). These variables are almost completely uncorrelated (as seen in Table 3), and
including controls for TeachDC assessment scores has no impact on the coefficients for applicant
background characteristics, or vice versa. Because the availability of teaching positions and the
supply of candidates may vary widely by subject area and over time, we present results that
include fixed effects for the subject area and grade level for which the applicant applied,
interacted with the application year. Not all candidates have complete data for all characteristics,
and we set missing values to zero and include a set of missing variable indicator flags into the
regression. We base our statistical inferences off of heteroskedasticity-robust standard errors.

16
Table 4 presents the results from regressions in which teacher background characteristics
are entered separately and then simultaneously. It is particularly interesting to compare the
results in column 3 and 4. The specification in column 4 includes controls for the highest stage
in the TeachDC process that applicants reached. For this reason, significant coefficients on these
background characteristics in column 4 reflect the importance that school principals place on
these characteristics or other unmeasured factors correlated with these factors. Several interesting
patterns emerge. Regardless of whether we control for the highest application stage reached,
applicants with some prior teaching experience are more likely to be hired than individuals with
no prior experience. For example, the coefficients on 3-5 and 6-10 prior years of experience in
column 4 indicate that these teachers are respectively 2.2 and 4 percentage points more likely to
be hired than their peers. In column 3, we see that applicants who attended more selective
undergraduate institutions are significantly more likely to be hired than those from non-selective
institutions. However, in column 4 we see that the influence of college selectivity operates
entirely by helping applicants proceed further through the TeachDC process.
Interestingly, neither undergraduate GPA nor SAT score is significantly associated with
hiring (columns 1 and 3). However, applicants with higher GPA and SAT scores made it further
through the TeachDC process, so that conditional on the stage reached these factors are
negatively associated with the likelihood of being hired (columns 2 and 4).
Table 5 presents estimates from equation (1.1) that includes applicant background
characteristics as well as application scores. The coefficients on applicant background
characteristics are not shown, but are virtually identical to those presented in the analogous
specification in Table 4. Each of the three application scores is positively associated with the

17
likelihood of being hired when they are entered separately (column 1). A one standard deviation
increase in the PCK written test is associated with a 5.5 percentage point increase in the
likelihood of being hired, which is quite large given the baseline rate of roughly 12 percent.
Interview and audition scores show an even stronger association. For example, a one standard
deviation increase in the audition score, conditional on the written test and interview scores
along with the background characteristics, is associated with a 12.7 percentage point increase in
the change of being hired. When all three scores are included simultaneously, the coefficients on
the PCK written test and the interview drop substantially but the coefficient on the audition score
remains virtually unchanged (column 3).
Importantly, in column 4 when we include fixed effects indicating the highest stage
reached by the applicant, the coefficients on the three application score measures drop by over 75
percent. Indeed, the PCK written test is no longer a significant predictor. This suggests that
principals did not rely heavily on the information collected in the application process beyond the
recommendation and that the factors that the principals did rely on were not highly correlated
with these scores (conditional on the other factors).
Table 6 presents regression results for 2011 alone that focus on the relationship between
the personality measures and Haberman index and hiring. Extraversion and the Haberman Index
are both positively associated with the likelihood of being hired, even after controlling for the
other personality measures and background characteristics. Importantly, the Haberman index is
not significantly related to hiring once we condition on the highest stage reached. This will make
us more confident in interpreting the coefficient on the Haberman Index in performance
regressions.
4. Association between Applicant Characteristics and Effectiveness as a Teacher
18
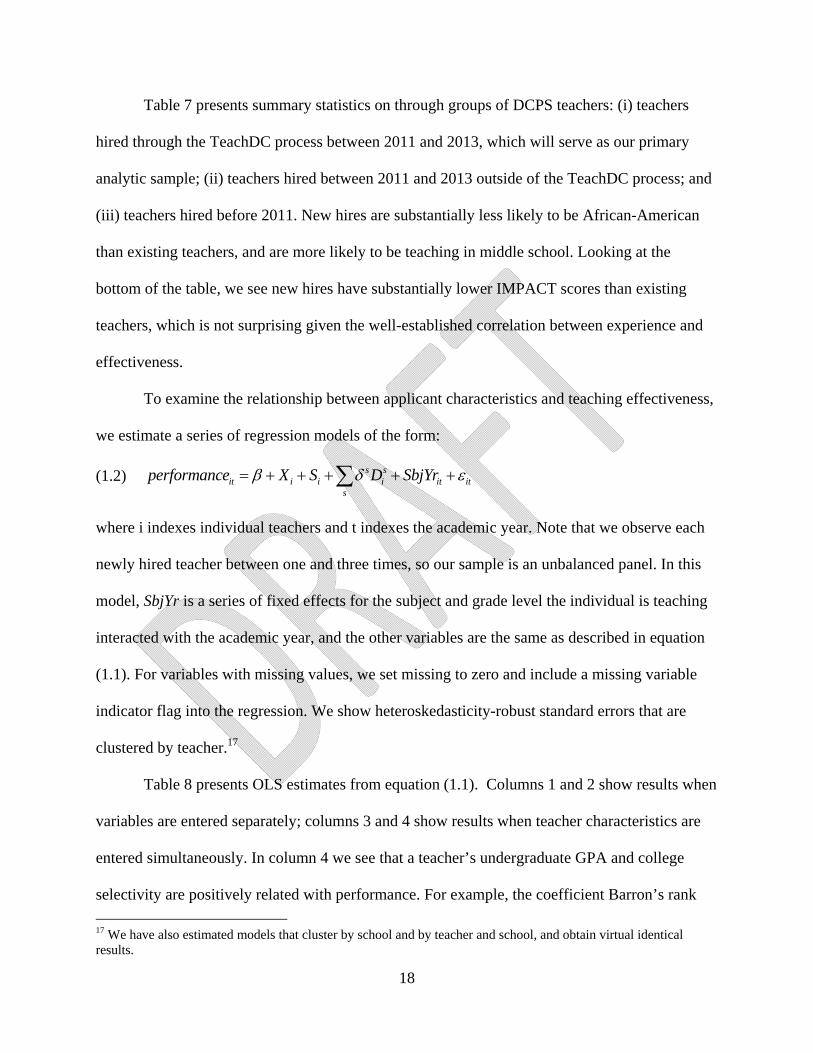
Table 7 presents summary statistics on through groups of DCPS teachers: (i) teachers
hired through the TeachDC process between 2011 and 2013, which will serve as our primary
analytic sample; (ii) teachers hired between 2011 and 2013 outside of the TeachDC process; and
(iii) teachers hired before 2011. New hires are substantially less likely to be African-American
than existing teachers, and are more likely to be teaching in middle school. Looking at the
bottom of the table, we see new hires have substantially lower IMPACT scores than existing
teachers, which is not surprising given the well-established correlation between experience and
effectiveness.
To examine the relationship between applicant characteristics and teaching effectiveness,
we estimate a series of regression models of the form:
(1.2) s sit i i i it it
s
performance X S D SbjYr
where i indexes individual teachers and t indexes the academic year. Note that we observe each
newly hired teacher between one and three times, so our sample is an unbalanced panel. In this
model, SbjYr is a series of fixed effects for the subject and grade level the individual is teaching
interacted with the academic year, and the other variables are the same as described in equation
(1.1). For variables with missing values, we set missing to zero and include a missing variable
indicator flag into the regression. We show heteroskedasticity-robust standard errors that are
clustered by teacher.17
Table 8 presents OLS estimates from equation (1.1). Columns 1 and 2 show results when
variables are entered separately; columns 3 and 4 show results when teacher characteristics are
entered simultaneously. In column 4 we see that a teacher’s undergraduate GPA and college
selectivity are positively related with performance. For example, the coefficient Barron’s rank
17 We have also estimated models that cluster by school and by teacher and school, and obtain virtual identical results.
19
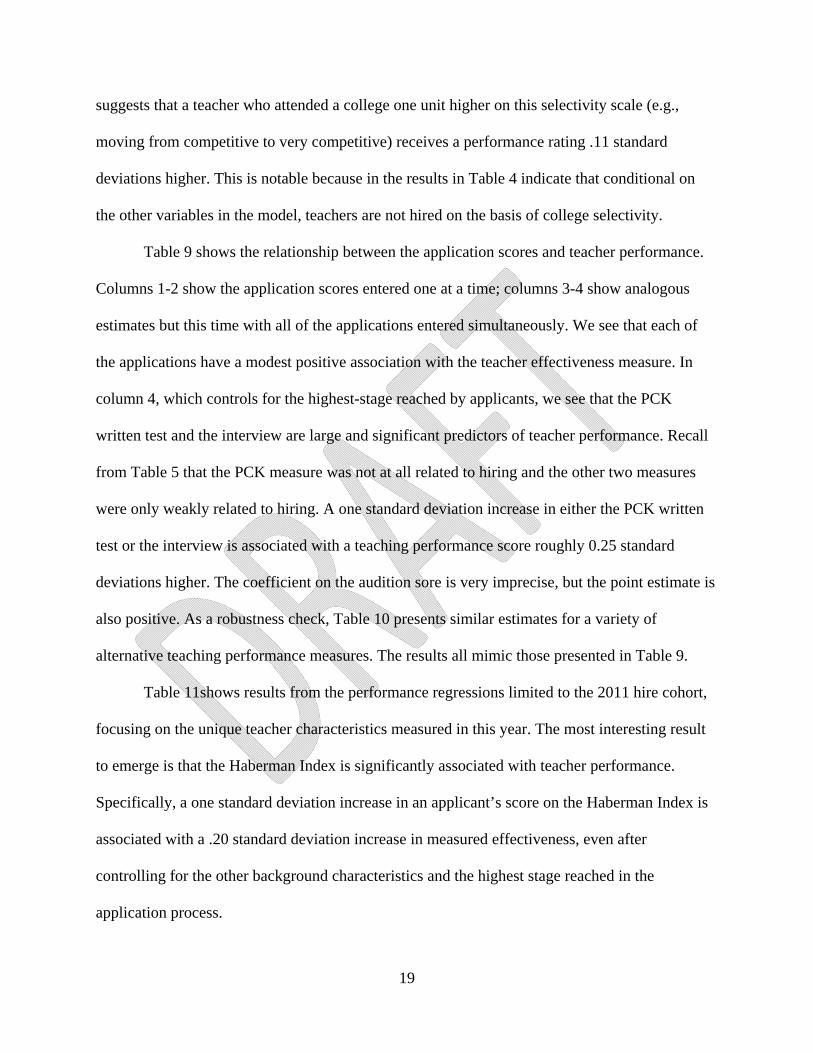
suggests that a teacher who attended a college one unit higher on this selectivity scale (e.g.,
moving from competitive to very competitive) receives a performance rating .11 standard
deviations higher. This is notable because in the results in Table 4 indicate that conditional on
the other variables in the model, teachers are not hired on the basis of college selectivity.
Table 9 shows the relationship between the application scores and teacher performance.
Columns 1-2 show the application scores entered one at a time; columns 3-4 show analogous
estimates but this time with all of the applications entered simultaneously. We see that each of
the applications have a modest positive association with the teacher effectiveness measure. In
column 4, which controls for the highest-stage reached by applicants, we see that the PCK
written test and the interview are large and significant predictors of teacher performance. Recall
from Table 5 that the PCK measure was not at all related to hiring and the other two measures
were only weakly related to hiring. A one standard deviation increase in either the PCK written
test or the interview is associated with a teaching performance score roughly 0.25 standard
deviations higher. The coefficient on the audition sore is very imprecise, but the point estimate is
also positive. As a robustness check, Table 10 presents similar estimates for a variety of
alternative teaching performance measures. The results all mimic those presented in Table 9.
Table 11shows results from the performance regressions limited to the 2011 hire cohort,
focusing on the unique teacher characteristics measured in this year. The most interesting result
to emerge is that the Haberman Index is significantly associated with teacher performance.
Specifically, a one standard deviation increase in an applicant’s score on the Haberman Index is
associated with a .20 standard deviation increase in measured effectiveness, even after
controlling for the other background characteristics and the highest stage reached in the
application process.

20
In order to assess how well these factors predict teacher effectiveness, we calculate the
predicted performance for each applicant based on a least squares regression where the
dependent variable is job performance measured by the first predicted factor from a factor
analysis of IMPACT evaluation component scores, standardized. The covariates include all of
the "background characteristics" covariates in table 8 and the "score" covariates in table 9. The
specification also includes highest-stage-reached by year fixed effects, subject-taught by year
fixed effects, and indicators for second year in the district and third year in the district. We do so
using a leave-one-out procedure so that the outcome for an individual teacher does not influence
his or her own predicted score.18 Figure 1 plots kernel densities estimated separately by quartile
of predicted performance using teacher-by-year observations. It appears that teachers in the top
quartile of predicted effectiveness score roughly 1 standard deviation higher in actual
effectiveness than their peer applicants who scored in the bottom quartile. This illustrates that
the predictions captured by the application measures incorporate considerable information
regarding actual effectiveness.
5. Conclusions
We study the relationship among applicant characteristics, hiring outcomes, and teacher
performance in Washington DC Public Schools (DCPS). We find that several background
characteristics (e.g., undergraduate GPA) as well as screening measures (e.g., applicant
performance on a mock teaching lesson) strongly predict teacher effectiveness. Interestingly, we
find that these measures are only weakly, if at all, associated with the likelihood of being hired,
suggesting considerable scope for improving teacher quality through the hiring process.
18 Specifically, to obtain the predicted value for teacher i, we estimate our model using all observations except for those from teacher i. Using the coefficients from this regression and teacher i’s Xs, we calculate the predicted value for teacher i.

21
References
Baker, A. and Santora, M. (2013, January 18). “No Deal on Teacher Evaluations; City Risks Losing $450 Million.” The New York Times, p. A1.
Barrick, M. R. and Mount, M. K. (1991) “The Big Five Personality Dimensions and Job Performance: A meta-analysis,” Personnel Psychology, 44(1), 1-26.
Barron’s Profiles of American Colleges (2009)
Boyd, Donald, et al. "The narrowing gap in New York City teacher qualifications and its implications for student achievement in high‐poverty schools." Journal of Policy Analysis and Management 27.4 (2008): 793-818.
Chetty, Raj, John N. Friedman & Jonah E. Rockoff, 2014. "Measuring the Impacts of Teachers I: Evaluating Bias in Teacher Value-Added Estimates," American Economic Review, 104(9), pages 2593-2632.
Chetty, Raj, John N. Friedman & Jonah E. Rockoff, 2014. "Measuring the Impacts of Teachers II: Teacher Value-Added and Student Outcomes in Adulthood," American Economic Review, 104(9), pages 2633-79
Costa, Paul T., and Robert R. McCrae. "Neo PI-R professional manual." (1992): 653-65.
Dee, Thomas, and James Wyckoff. Incentives, selection, and teacher performance: Evidence from IMPACT. No. w19529. National Bureau of Economic Research, 2013.
Dobbie W. 2011. Teacher Characteristics and Student Achievement: Evidence from Teach for America. Harvard University Working Paper.
Duckworth, Angela Lee, and Patrick D. Quinn. "Development and validation of the Short Grit Scale (GRIT–S)." Journal of personality assessment 91.2 (2009): 166-174.
Goldhaber, D., Grout, C., and Huntington-Klein, N. (2014). Screen Twice, Cut Once: Assessing the Predictive Validity of Teacher Selection Tools. CEDR Working Paper 2014-9. University of Washington, Seattle, WA.
Haberman, M. (1993). Predicting the Success of Urban Teachers (The Milwaukee Trials). Action in Teacher Education, 15(3), pp.1-5.
Hill, H. C., Schilling, S. G., & Ball, D. L. (2004). Developing measures of teachers’ mathematics knowledge for teaching. Elementary School Journal, 105, 11–30.
John, O.P., Donahue, E.M., and Kentle, R. L. (1991). The "Big Five" Inventory—Versions 4a and 54. Berkeley: University of California, Berkeley, Institute of Personality and Social Research.
Rockoff JE, Jacob B, Kane TJ, Staiger DO. 2011. Can You Recognize an Effective Teacher When You Recruit One? Education Finance and Policy. 6(1):43-74.
Rockoff JE, Speroni C. 2010. Subjective and Objective Evaluations of Teacher Effectiveness. American Economic Review 100(2): 261–66
Staiger DO, Rockoff JE. 2010. Searching for Effective Teachers with Imperfect Information. Journal of Economic Perspectives 24: 97-117
# %Fraction hired # %
Fraction hired # %
Fraction hired
2,360 100% 0.14 2,527 100% 0.12 2,555 100% 0.12
Completed Stage: 2,186 93% 0.14Passed Stage: 1,958 83% 0.15
Completed Stage: 1,596 68% 0.16 1,740 69% 0.13 1,514 59% 0.19Passed Stage: 1,066 45% 0.22 1,118 44% 0.18 1,254 49% 0.23
Completed Stage: 752 32% 0.27 814 32% 0.22 1,104 43% 0.25Passed Stage: 513 22% 0.35 531 21% 0.31 920 36% 0.30
Completed Stage: 244 10% 0.40 492 19% 0.32 618 24% 0.40Recommended Pool: 164 7% 0.46 392 16% 0.40 462 18% 0.52
# %Fraction hired # %
Fraction hired # %
Fraction hired
Eligible but Initial Stage Incomplete: 174 7% 0.13 787 31% 0.10 1,041 41% 0.02
Failed this Stage: 228 10% 0.03Incomplete Next Stage: 362 15% 0.08
Failed this Stage: 530 22% 0.06 622 25% 0.04 260 10% 0.02Incomplete Next Stage: 314 13% 0.09 304 12% 0.09 150 6% 0.05
Failed this Stage: 239 10% 0.09 283 11% 0.05 184 7% 0.03Incomplete Next Stage: 269 11% 0.32 39 2% 0.18 302 12% 0.08
Failed this Stage: 80 3% 0.28 100 4% 0.01 156 6% 0.04Recommended Pool: 164 7% 0.46 392 16% 0.40 462 18% 0.52
Note: Authors' calculations. "Stage reached" is the highest stage in which the data include a score or pass/fail determination.
(B) Stage reached in TeachDC process
Table 1‐‐Applicant progress through TeachDC process
(A) Cumulative Progression in TeachDC
GeneralEssay
Content Knowledge
GeneralEssay
Content Knowledge
Interview + Sample Lesson
Teaching Audition
2011 applicants 2012 applicants 2013 applicants
Started TeachDC and Eligible to Teach:
Interview + Sample Lesson
Teaching Audition
Obs.Mean(st.dev.) Obs.
Mean(st.dev.)
(1) (2) (3) (4)
Hired 7,442 0.13 934 1
Undergraduate GPA 7,112 3.40 894 3.41(0.43) (0.44)
Undergraduate major 7,196 911 Education 0.34 0.31 Liberal arts, humanities, social sciences 0.33 0.33 Professional degrees 0.10 0.11 STEM 0.08 0.09 Art 0.06 0.07 Other 0.10 0.10
Undergraduate college Barron's ranking 6,588 865 Barron's rank (1‐5) 2.83 2.89
(1.02) (1.09) Barron's "special" (binary) 0.01 0.01 Not ranked by Barron's (binary) 0.12 0.10
SAT math+verbal (or ACT equiv) 4,600 1148.72 645 1146.49(175.15) (169.66)
Prior teaching experience 7,314 933 Novice 0.33 0.28 1 to 2 0.17 0.18 3 to 5 0.18 0.20 6 to 10 0.17 0.20 11 or more 0.14 0.13
Subject and grade applying to teach 6,418 881 Eelementary or ECE 0.38 0.41 Special education 0.11 0.11 English language learners 0.03 0.03 High school or middle school… Math or science 0.11 0.13 Social studies 0.11 0.06 English 0.10 0.08 Foreign languages 0.03 0.04 Visual or performing arts 0.07 0.07 PE and health 0.04 0.05 Other 0.02 0.01
Table 2‐‐Characteristics of applicants
Note: Authors' calculations. Excluding applicants who were not eligible for a teaching license in DC.7,442 total observations.
All applicants Applicants hired

SAT GPA Barron's Exper. PCK Interv. Aud. Essay Extrov. Agree. Cons. Neuro. Open. GritHaber‐man
SAT math+verbal (or ACT equiv) 1Undergraduate GPA 0.32 1Undergraduate Barron's ranking 0.36 0.13 1Years of teaching experience ‐0.06 ‐0.11 ‐0.14 1PCK written test 0.21 0.15 0.19 ‐0.12 1Interview 0.15 0.12 0.1 ‐0.03 0.10 1Audition 0.09 0.06 0.04 0.04 0.10 0.22 1
Teaching essay 0.19 0.15 0.23 ‐0.18 0.21 0.17 0.04 1Big Five Index Extroversion 0.07 0.02 0.03 ‐0.12 0.07 0.15 0.13 0.07 1 Agreeableness 0.06 0.03 0.05 0.05 0.06 0.08 ‐0.08 0.08 0.11 1 Conscientiousness ‐0.04 0.04 ‐0.03 0.02 0.01 0.05 ‐0.03 0.02 0.24 0.31 1 Neuroticism 0.00 0.06 0.06 ‐0.04 0.03 ‐0.01 ‐0.03 ‐0.01 ‐0.25 ‐0.28 ‐0.46 1 Openness to experience ‐0.04 ‐0.01 ‐0.02 0.02 0.00 0.06 0.01 0.05 0.26 0.25 0.34 ‐0.27 1Grit index ‐0.06 0.00 ‐0.03 0.05 ‐0.05 0.02 ‐0.04 0.02 0.23 0.33 0.67 ‐0.43 0.3 1Haberman total score 0.21 0.20 0.21 ‐0.14 0.21 0.11 0.01 0.26 0.13 0.16 0.08 ‐0.05 0.12 0.06 1
Table 3‐‐Pairwise correlation of applicant characteristics and scores
Note: Pairwise correlations of applicant characteristics and scores. Maximum observations for a cell 7,442, see Table 1.
2011
‐201
3 applicants
2011
app
licants only
Big Five Index

(1) (2) (3) (4)Years prior experience, novice omitted 1 to 2 0.025* 0.017 0.027* 0.018+
(0.012) (0.010) (0.012) (0.010) 3 to 5 0.025* 0.021* 0.030** 0.022*
(0.011) (0.010) (0.011) (0.010) 6 to 10 0.037** 0.041** 0.048** 0.040**
(0.012) (0.010) (0.012) (0.011) 11 or more 0.004 0.024* 0.021+ 0.025*
(0.012) (0.011) (0.013) (0.012)Undergrad GPA (std) 0.005 ‐0.016** 0.004 ‐0.012**
(0.004) (0.004) (0.004) (0.004)SAT math+verbal (std) ‐0.001 ‐0.019** ‐0.005 ‐0.015**
(0.005) (0.005) (0.005) (0.005)Barron's rank (1‐5) 0.009* ‐0.004 0.008* ‐0.000
(0.004) (0.003) (0.004) (0.004)Barron's "special" (binary) ‐0.026 ‐0.024 ‐0.021 ‐0.026
(0.038) (0.034) (0.038) (0.034)Not ranked by Barron's (binary) ‐0.026* ‐0.008 ‐0.021+ ‐0.011
(0.012) (0.011) (0.013) (0.011)
Highest‐stage‐reached by year fixed effects √ √Adjusted R‐squared 0.024 0.206
Table 4‐‐Applicant background characteristics and hiring
Characteristics separately
Characteristics simultaneously
Note: Estimates from an LPM with 7,442 observations where being hired is the dependent variable. In columns 1‐2 each group of coefficients separated by a solid line are estimates from a separate regression. Columns 3‐4 each report estimates from a single regression. Each specification includes year‐by‐subject‐applied fixed effects. When a covariate is missing for an observation, we set the value to zero and include an indicator = 1 for anyone missing that covariate.+ indicates p < 0.10, * 0.05, and ** 0.01

(1) (2) (3) (4)
PCK written test (std) 0.054** 0.002 0.009+ 0.001(0.005) (0.006) (0.005) (0.006)
Interview (std) 0.097** 0.022** 0.053** 0.020**(0.006) (0.008) (0.006) (0.008)
Audition (std) 0.147** 0.037** 0.138** 0.032*(0.009) (0.013) (0.009) (0.013)
Highest‐stage‐reached by year fixed effects √ √Adjusted R‐squared 0.162 0.205
Scores separately
Scoressimultaneously
Table 5‐‐Application scores and hiring
Note: Estimates from an LPM with 7,442 observations where being hired is the dependent variable. In columns 1‐2 each group of coefficients separated by a solid line are estimates from a separate regression. Columns 3‐4 each report estimates from a single regression. Each specification includes year‐by‐subject‐applied fixed effects. When a covariate is missing for an observation, we set the value to zero and include an indicator = 1 for anyone missing that covariate.+ indicates p < 0.10, * 0.05, and ** 0.01

(1) (2) (3) (4) (5)
Positive spin factor (std) ‐0.018 ‐0.015 ‐0.019+ ‐0.016 ‐0.016(0.011) (0.011) (0.011) (0.011) (0.011)
Negative spin factor (std) 0.010 0.014 0.010 0.014 0.014(0.011) (0.011) (0.011) (0.011) (0.011)
Big Five Index: Extroversion 0.029** 0.018* 0.027** 0.017* 0.018*(0.008) (0.007) (0.008) (0.007) (0.007)
Haberman total score 0.019** 0.006 0.017* 0.004 0.008(0.007) (0.007) (0.007) (0.007) (0.007)
Highest‐stage‐reached by year fixed effects √ √ √Additional background characteristics controls √Adjusted R‐squared 0.027 0.127 0.133
Characteristics separately Characteristics simultaneously
Table 6‐‐Additional 2011 applicant background characteristics and hiring
Note: Estimates from an LPM with 2,360 observations (all from 2011) where being hired is the dependent variable. In columns 1‐2 each group of coefficients separated by a solid line are estimates from a separate regression. Columns 3‐5 each report estimates from a single regression. Each specification includes year‐by‐subject‐applied fixed effects. "Additional background characteristics" are the covariates shown in Table 4. When a covariate is missing for an observation, we set the value to zero and include an indicator = 1 for anyone missing that covariate.+ indicates p < 0.10, * 0.05, and ** 0.01

Obs.Mean(st.dev.) Obs.
Mean(st.dev.) Obs.
Mean(st.dev.)
(1) (2) (3) (4) (5) (6)
Female 2920 0.76 842 0.75 927 0.75
Race/ethnicity 2704 380 823 Black 0.60 0.39 0.44 White 0.32 0.42 0.47 Hispanic 0.04 0.11 0.05 Asian 0.04 0.08 0.01 Other 0.01 0.00 0.03
Age 2914 42.32 820 29.97 900 31.41
School type 2917 839 926 Education center 0.17 0.19 0.18 Elementary school 0.46 0.38 0.44 Middle school 0.09 0.17 0.15 High school 0.25 0.23 0.20 Other 0.03 0.03 0.03
Performance Overall performance factor score (std) 2817 0.09 806 ‐0.58 903 ‐0.39
(0.98) (1.03) (1.03) Final IMPACT score 2920 315.04 842 290.50 930 297.93
(45.36) (48.51) (46.88) Minimally effective or lower 2920 0.09 842 0.18 930 0.14 Highly effective or effective 2920 0.24 842 0.08 930 0.12 Math value‐added 253 0.04 87 ‐0.24 101 ‐0.15
(0.98) (1.11) (0.98) Reading value‐added 268 0.03 89 ‐0.15 130 ‐0.08
(1.00) (0.98) (0.98)
Table 7‐‐DCPS teacher characteristics
Note: Authors' calculations. Sample restricted to DCPS teachers with IMPACT scores. Calculations based on one observation per teacher, the first year they appear in the data.
Non TeachDCfirst year in dataNew hires, first year on the jobHired before 2011
TeachDC

(1) (2) (3) (4)Years prior experience, novice omitted 1 to 2 0.070 0.094 0.075 0.079
(0.089) (0.090) (0.085) (0.085) 3 to 5 0.106 0.118 0.185* 0.197*
(0.101) (0.097) (0.092) (0.089) 6 to 10 0.002 0.026 0.119 0.124
(0.093) (0.093) (0.087) (0.089) 11 or more ‐0.269* ‐0.206+ ‐0.125 ‐0.096
(0.116) (0.115) (0.111) (0.111)Undergrad GPA (std) 0.259** 0.247** 0.229** 0.226**
(0.035) (0.037) (0.035) (0.037)SAT math+verbal (std) 0.174** 0.147** 0.067+ 0.049
(0.040) (0.040) (0.039) (0.038)Barron's rank (1‐5) 0.155** 0.143** 0.113** 0.112**
(0.030) (0.030) (0.030) (0.030)Barron's "special" (binary) 0.022 0.070 0.137 0.137
(0.234) (0.248) (0.225) (0.234)Not ranked by Barron's (binary) 0.007 0.045 0.062 0.075
(0.107) (0.105) (0.105) (0.104)
Highest‐stage‐reached by year fixed effects √ √Adjusted R‐squared 0.128 0.147
Characteristics separately
Characteristics simultaneously
Table 8‐‐Job performance and background characteristics
Note: Estimates from least squares regressions with 1,581 teacher‐by‐year observations, and 917 unique teachers. The dependent variable is job performance measured by the first predicted factor from a factor analysis of IMPACT evaluation component scores, standardized. In columns 1‐2 each group of coefficients separated by a solid line are estimates from a separate regression. Columns 3‐4 each report estimates from a single regression. Each specification includes year‐by‐subject‐taught fixed effects, and indicators for second year in the district and third year in the district. When a covariate is missing for an observation, we set the value to zero and include an indicator = 1 for anyone missing that covariate. Clustered (teacher) standard errors in parentheses.+ indicates p < 0.10, * 0.05, and ** 0.01

(1) (2) (3) (4)
PCK written test (std) 0.264** 0.269** 0.244** 0.269**(0.053) (0.056) (0.051) (0.055)
Interview (std) 0.295** 0.276** 0.270** 0.257**(0.047) (0.054) (0.048) (0.054)
Audition (std) 0.163** 0.176* 0.114* 0.119+(0.060) (0.072) (0.058) (0.070)
Highest‐stage‐reached by year fixed effects √ √Adjusted R‐squared 0.120 0.132
Table 9‐‐Application scores and job performance
Note: Estimates from least squares regressions with 1,581 teacher‐by‐year observations, and 917 unique teachers. The dependent variable is job performance measured by the first predicted factor from a factor analysis of IMPACT evaluation component scores, standardized. In columns 1‐2 each group of coefficients separated by a solid line are estimates from a separate regression. Columns 3‐4 each report estimates from a single regression. Each specification includes year‐by‐subject‐taught fixed effects, and indicators for second year in the district and third year in the district. When a covariate is missing for an observation, we set the value to zero and include an indicator = 1 for anyone missing that covariate. Clustered (teacher) standard errors in parentheses.+ indicates p < 0.10, * 0.05, and ** 0.01
Scoresseparately Scores simultaneously

Bottom two
Toptwo Overall Principal Master ed CP CSC TAS Avg. Math Read
(5) (6) (7) (8) (9) (10) (11) (12) (13) (14) (15) (16)
PCK written test (std) 0.203** ‐0.031* 0.064** 0.171** 0.192** 0.099* 0.043** 0.272** 0.167** 0.054 0.258+ ‐0.036(0.055) (0.014) (0.017) (0.052) (0.053) (0.046) (0.015) (0.051) (0.048) (0.103) (0.143) (0.119)
Interview (std) 0.199** ‐0.061** 0.030 0.257** 0.256** 0.197** 0.033+ 0.203** 0.145** ‐0.043 0.116 ‐0.132(0.051) (0.015) (0.020) (0.049) (0.048) (0.048) (0.019) (0.054) (0.054) (0.096) (0.163) (0.116)
Audition (std) 0.086 ‐0.022 0.039 0.093 0.119+ 0.052 0.063** 0.148* ‐0.036 ‐0.160 ‐0.283 ‐0.179(0.066) (0.020) (0.026) (0.063) (0.065) (0.058) (0.021) (0.072) (0.075) (0.144) (0.204) (0.198)
Adjusted R‐squared 0.140 0.070 0.067 0.142 0.105 0.155 0.022 0.104 0.048 ‐0.071 ‐0.027 ‐0.073
Teacher‐year 1581 1581 1581 1581 1581 1574 1581 1581 1581 281 158 210Teacher observations 917 917 917 917 917 914 917 917 917 191 108 147
IMPACT score
Table 10‐‐Application scores and alternative measures of job performance
Note: Estimates from least squares regressions. The dependent variables are indicated in the column headers. Each column reports estimates from a single regression. Each specification includes year‐by‐subject‐taught fixed effects, highest‐stage‐reached by year fixed effects, and indicators for second year in the district and third year in the district. When a covariate is missing for an observation, we set the value to zero and include an indicator = 1 for anyone missing that covariate. Clustered (teacher) standard errors in parentheses.
d * d **
IMPACT rating TLF class observation Value‐added

(1) (2) (3) (4) (5)Positive spin factor (std) 0.030 0.002 0.012 ‐0.004 ‐0.023
(0.061) (0.060) (0.062) (0.060) (0.059)Negative spin factor (std) ‐0.002 0.028 ‐0.036 ‐0.012 ‐0.007
(0.073) (0.073) (0.073) (0.072) (0.074)Big Five Index: Extroversion ‐0.001 ‐0.008 ‐0.030 ‐0.030 ‐0.031
(0.059) (0.061) (0.055) (0.056) (0.056)Haberman total score 0.287** 0.269** 0.296** 0.276** 0.209**
(0.054) (0.055) (0.054) (0.055) (0.055)
Highest‐stage‐reached by year fixed effects √ √ √Additional background characteristics controls √Adjusted R‐squared 0.128 0.145 0.209
Characteristics separately
Characteristics simultaneously
Table 11‐‐Additional 2011 applicant background characteristics and job performance
Note: Estimates from least squares regressions with 744 teacher‐by‐year observations, and 314 unique teachers (hired in 2011 only). The dependent variable is job performance measured by the first predicted factor from a factor analysis of IMPACT evaluation component scores, standardized. In columns 1‐2 each group of coefficients separated by a solid line are estimates from a separate regression. Columns 3‐5 each report estimates from a single regression. Each specification includes year‐by‐subject‐taught fixed effects, and indicators for second year in the district and third year in the district. "Additional background characteristics" are the covariates shown in Table 8. When a covariate is missing for an observation, we set the value to zero and include an indicator = 1 for anyone missing that covariate. Clustered (teacher) standard errors in parentheses.+ indicates p < 0.10, * 0.05, and ** 0.01

Group 1 Group 2 Group 1 Group 2
Individual value‐added 0.50 0.35Teacher assessed student learning 0.10 0.15 0.15Teaching and learning framework 0.35 0.75 0.40 0.75Commitment to school community 0.10 0.10 0.10 0.10School value‐added 0.05 0.05
2012‐13 and 2013‐142011‐12
Table 1a‐‐IMPACT component weights

Figure 1 ‐ Relationship between screening measures and performance
Note: Kernel densities estimated separately by quartile of predicted performance using teacher‐by‐year observations. Predicted performance is estimated in a least squares regression where the dependent variable is job performance measured by the first predicted factor from a factor analysis of IMPACT evaluation component scores, standardized. The covariates include all of the "background characteristics" covariates in table 8 and the "score" covariates in table 9. The specification also includes highest‐stage‐reached by year fixed effects, subject‐taught by year fixed effects, and indicators for second year in the district and third year in the district.
0.1
.2.3
.4.5
Des
nity
-6 -4 -2 0 2Actual performance factor score
Bottom 2nd 3rd Top
Quartile of predicted performance: