tea flavonoids induced differentiation of peripheral blood … · 2016-07-22 · vol. 22, no. 2,...
TRANSCRIPT
Natural Product Sciences
22(2) : 87-92 (2016)
http://dx.doi.org/10.20307/nps.2016.22.2.87
87
Tea Flavonoids Induced Differentiation of Peripheral Blood-derived Mononuclear
Cells into Peripheral Blood-derived Endothelial Progenitor Cells and Suppressed
Intracellular Reactive Oxygen Species Level of Peripheral Blood-derived
Endothelial Progenitor Cells
Wahyu Widowati1,*, Laura Wijaya2, Dian Ratih Laksmitawati3, Rahma Micho Widyanto4,
Pande Putu Erawijantari5, Nurul Fauziah5, Indra Bachtiar2, and Ferry Sandra6,7,*
1Medical Research Center, Faculty of Medicine, Maranatha Christian University, Bandung 40164, Indonesia2Stem Cell and Cancer Institute, Jakarta 13210, Indonesia
3Faculty of Pharmacy, Pancasila University, Jakarta 12640, Indonesia4Faculty of Agricultural Technology, Brawijaya University, Malang 65145, Indonesia
5Biomolecular and Biomedical Research Center, Aretha Medika Utama, Bandung 40163, Indonesia6Faculty of Dentistry, Trisakti University, Jakarta 11440, Indonesia
7Prodia Clinical Laboratory, Jakarta 10430, Indonesia
Abstract − Endothelial dysfunction in atherosclerosis is associated with increasing oxidative stress that could bereversed by antioxidant. Therefore epigallocatechin gallate (EGCG), epicatechin gallate (ECG), epigallocatechin(EGC) and catechin (C) of tea flavonoids were investigated for their roles in regenerating endothelial cell. Peripheralblood mononuclear cells (PB-MNCs) were isolated, plated and cultured in medium with/without treatment ofEGCG, ECG, EGC and C. Results showed that among all EGCG, ECG, EGC and C concentrations tested, 12.5µmol/L was not cytotoxic for peripheral blood-derived endothelial progenitor cells (PB-EPCs). Treatment ofEGCG, ECG, EGC or C increased the percentages of CD34, CD133, VEGFR-2 expressions and suppressedhydrogen peroxide-induced percentages of reactive oxygen species (ROS) level in PB-EPCs. Taken together, ourcurrent results showed that EGCG, ECG, EGC or C of tea flavonoids could induce differentiation of PB-MNCsinto PB-EPCs as well as protect PB-EPCs from oxidative damage by suppresing the intracellular ROS levels.Keywords − Tea flavonoids, Antioxidant, Endothelial progenitor cell, Differentiation, ROS, Apoptosis
Introduction
Endothelial dysfunctions play a role in the pathogenesis
of atherosclerosis and its complications.1 Increasing oxidative
stress and disorder antioxidant mechanism, especially
inactivation of nitric oxide (NO) by reactive oxygen
species (ROS) such as superoxide anion radical (O2-),
hydrogen peroxide (H2O2), hydroxyl radical (HO⋅), and
lipid peroxides, may contribute to the endothelial
dysfunction, intact vessel wall, up to the rupture of a
lipid-rich atherosclerotic plaque.2 Endothelial dysfunction
in atherosclerosis is associated with increasing oxidative
stress that could be reversed by antioxidant therapy.3
Antioxidants counter-balance the ROS production in cells
and modify the regulatory pathways of cell growth.4
In several numbers of previous studies, tea consumption
as a source of flavonoids was associated with low cardio-
vascular disease (CVD) and stroke-related mortality.5 The
mortality was significantly decreased along with the
increase of tea flavonoids intake in a dose-dependent
manner.6 Some in vitro studies showed that flavonoids
have strong ROS scavenging activity and prevent low
density lipoprotein (LDL) to oxidize.1 Atherosclerotic
animal models study indicated that consuming dietary
flavonoids can reduce atherosclerotic plaque development.8
Flavonoids were reported to have anti-platelet, anti-
inflammatory, and antioxidant activities.9,10 In addition, an
epidemiological study reported that consuming flavonoid-
containing foods and beverages could reduce CVD risk,
*Author for correspondenceWahyu Widowati, Medical Research Center, Faculty of Medicine,Maranatha Christian University, Jl. Prof. drg. Surya Sumantri No.65, Bandung 40164, IndonesiaTel: +62-81910040010; E-mail: [email protected]
Ferry Sandra, Faculty of Dentistry, Trisakti University, Jl. Kyai TapaNo.260, Grogol, Jakarta 11440, IndonesiaTel: +62-81280777803; E-mail: [email protected]
88 Natural Product Sciences
as well as increase endothelial function.7
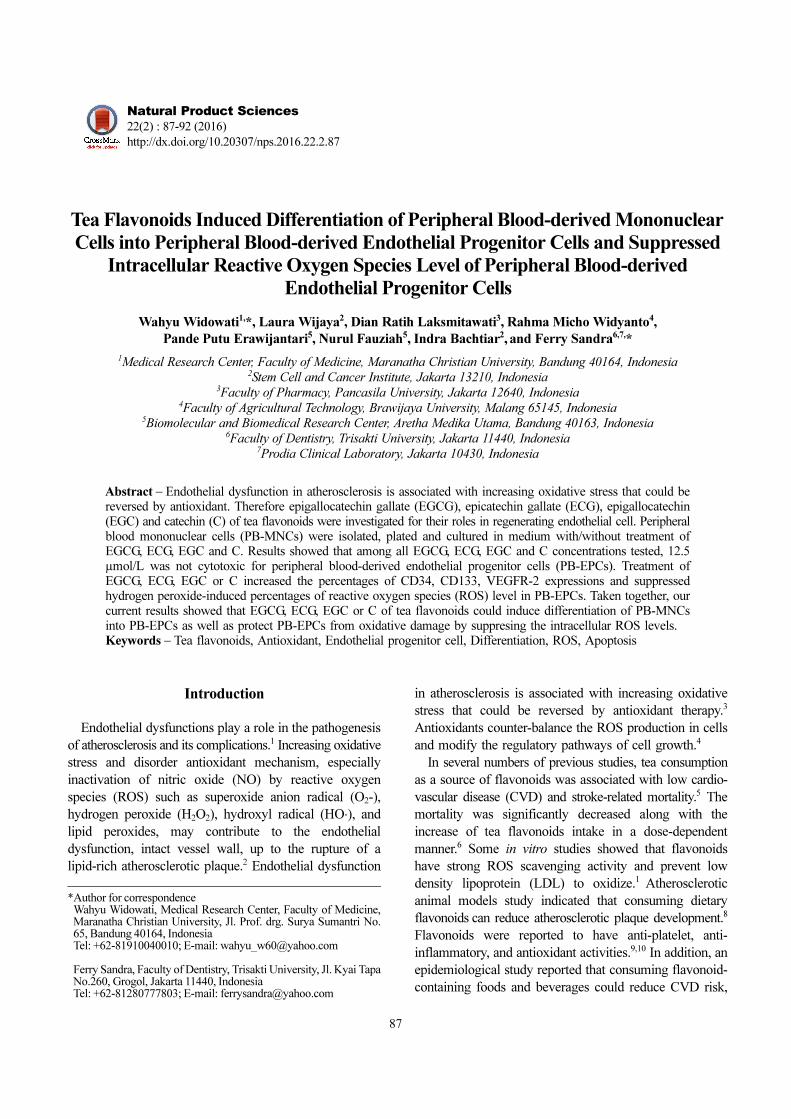
The effects of green tea are mainly associated with poly-
phenols content, especially flavonoids with approximately
30% of dry weight of leaves.11 Predominantly flavonoids
consist of epigallocatechin gallate (EGCG), epicatechin
gallate (ECG), epigallocatechin (EGC) and catechin (C).12,13
In our previous study, we found that EGCG enhanced
proliferation of adipose tissue-derived mesenchymal stem
cells (AD-MSCs) and differentiation of AD-MSCs into
endothelial progenitor cells (EPCs). Tea flavonoids including
EGCG, ECG, EGC and C could also have effects on
peripheral blood-derived EPCs (PB-EPCs). Therefore we
conducted a study in order to investigate proliferation and
differentiation inducing properties of EGCG, ECG, EGC,
and C (Fig. 1) on PB-EPCs.
Experimental
General Experimental Procedure − (−)-epigallocatechin
gallate (EGCG), (−)-epicatechin gallate (ECG), (−)-
epigallocatechin (EGC), and (+)-catechin (C) with purity
95-99% (Fig. 1.) were purchased from Biopurify Phyto-
chemical Ltd. (Chengdu, China). Human fibronectin was
purchased from Roche (Basel, Switzerland). VascGrowTM
medium was obtained from Stem Cell and Cancer
Institute (Jakarta, Indonesia). Ficoll-Paque reagent was
purchased from GE Healthcare (Uppsala, Sweden). Fluo-
rescein isothiocyanate (FITC)-conjugated ulex europaeus
agglutinin I (UEA-I), and 1,1-dioctadecyl-3,3,3,3-tetrame-
thylindo carbocyanine-labeled acetylated LDL (Dil-
acLDL) were purchased from Sigma-Aldrich (St. Louis,
MO, USA). The 4',6-diamidino-2-phenylindole (DAPI)
and 2'-7'-dichlorofluorescein diacetate (DCF-DA) were
purchased from Invitrogen (Carlsbad, CA, USA). FcR
Blocking and phycoerythrin (PE)-conjugated anti-CD133
antibodies were purchased from Miltenyi Biotec (Bergisch
Gladbach, Germany). FITC-conjugated anti-CD45/PE-
conjugated anti-CD34 antibody was purchased from Becton
Dickinson (Franklin Lakes, NJ, USA). PE-conjugated
anti-vascular endothelial growth factor (VEGFR)-2/Kinase
Domain Receptor (KDR) antibody was purchased from
R&D System (Minneapolis, MN, USA). The 3-(4,5-
dimethylthiazol-2-yl)-5-(3-carboxymethoxyphenyl)-2-(4-
sulfophenyl)-2H-tetrazolium (MTS) was purchased from
Promega (Madison, WI, USA). Fluorescence-activated
cell sorting (FACS) was performed using a FACS Calibur
Flow Cytometer Becton Dickinson (Franklin Lakes, NJ,
USA). Cells were observed using inverted fluorescent
microscope (Axiovert 40 CFL, Zeiss).
Isolation and Culture − Briefly, total PB-MNCs were
isolated from peripheral blood of healthy young human
volunteers with Ficoll density gradient centrifugation. PB-
MNCs were plated in human fibronectin-coated culture
dishes and cultured using VascGrowTM at 37 oC in a
humidified, 5% CO2 incubator. New media was applied
after 4 days of culture and the culture was maintained for
7 days. Prior to blood collection, all volunteers signed
informed consent. All procedures were approved by the
ethics committee of Stem Cell and Cancer Institute,
Jakarta and the joint ethics committee of Faculty of
Medicine, Maranatha Christian University, Bandung,
Indonesia and Immanuel Hospital, Bandung, Indonesia.
Fluorescent Staining−Fluorescent staining was performed
to detect FITC-UEA-I and Dil-acLDL. To identify the
uptake Dil-acLDL, adherent cells were incubated with 1
mg/mL Dil-acLDL at 37 oC for 4 hours. Cells were fixed
with 3% paraformaldehyde for 10 minutes. Soon after
cleansed, cells were incubated with 1 mg/mL FITC-UEA-
I at 37 oC for 1 hour, followed by nucleus staining using
DAPI. After staining, cells were observed using an Axiovert
40 CFL inverted fluorescent microscope from Carl Zeiss
(Jena, Germany). Cells with double positive for both Dil-
acLDL and FITC-UEA-I were defined as PB-EPCs.
MTS Assay − This assay was done to quantify viable
PB-EPCs under treatment of EGCG, ECG, EGC and C.
Briefly, 5 × 103 PB-EPCs were seeded in 96-well plates
using serum-free medium for 24 hours. After EGCG,
ECG, EGC or C treatment, PB-EPCs were added with 20
µL MTS and incubated at 37 oC in a humidified, 5% CO2
incubator for 4 hours. Optical Density value was measured
at 490 nm using a microplate reader from Biorad (Hercules,
CA, USA).
Fig. 1. Chemical Structures of catechins. Structures of (−)-epigallocatechin gallate (EGCG) (a), (−)-epicatechin gallate (ECG)(b), (−)-epigallocatechin (EGC) (c), and (+)-catechin (C) (d).
Vol. 22, No. 2, 2016 89
Apoptosis Assay − PB-EPCs were cultured in 12-well
plate and treated with EGCG, ECG, EGC or C for 24
hours. After that, PB-EPCs were collected, washed and
stained with propidium iodide solution in phosphate
buffer saline (PBS) for 15 minutes. The apoptotic cells
were determined as SubG1 area using a fluorescence-
activated cell sorting (FACS)Calibur flow cytometer from
Becton Dickinson and presented as a percentage of total
cells.
Immunophenotyping − PB-EPCs were detached using
2 mM ethylenediaminetetraacetate (EDTA) and pre-incubated
for 15 minutes at room temperature with FcR Blocking.
Then PB-EPCs were incubated at 4 ºC with FITC-
conjugated anti-CD45/PE-conjugated anti-CD34 and PE-
conjugated anti-CD133 antibodies for 15 minutes, followed
by PE-conjugated VEGFR-2/KDR antibody for another
40 minutes. Isotype-identical antibodies were also applied
and used as controls to negative bindings. Each expression
was analyzed using a FACSCalibur.
Intracellular ROS Assay − Treated PB-EPCs were
incubated in 37 oC with 10 µmol/L DCF-DA for 30
minutes and washed with PBS containing KCl solution.
Level of intracellular ROS were measured using a
FACSCalibur.
Statistical Analysis − Data are presented as mean and
standard deviation. Statistical analysis was perfomed
using IBM SPSS Statistics for Windows software version
20.0. (Armonk, NY, USA). One-way analysis of variance
test was performed, followed by Duncan’s post-hoc tests.
Result and Discussion
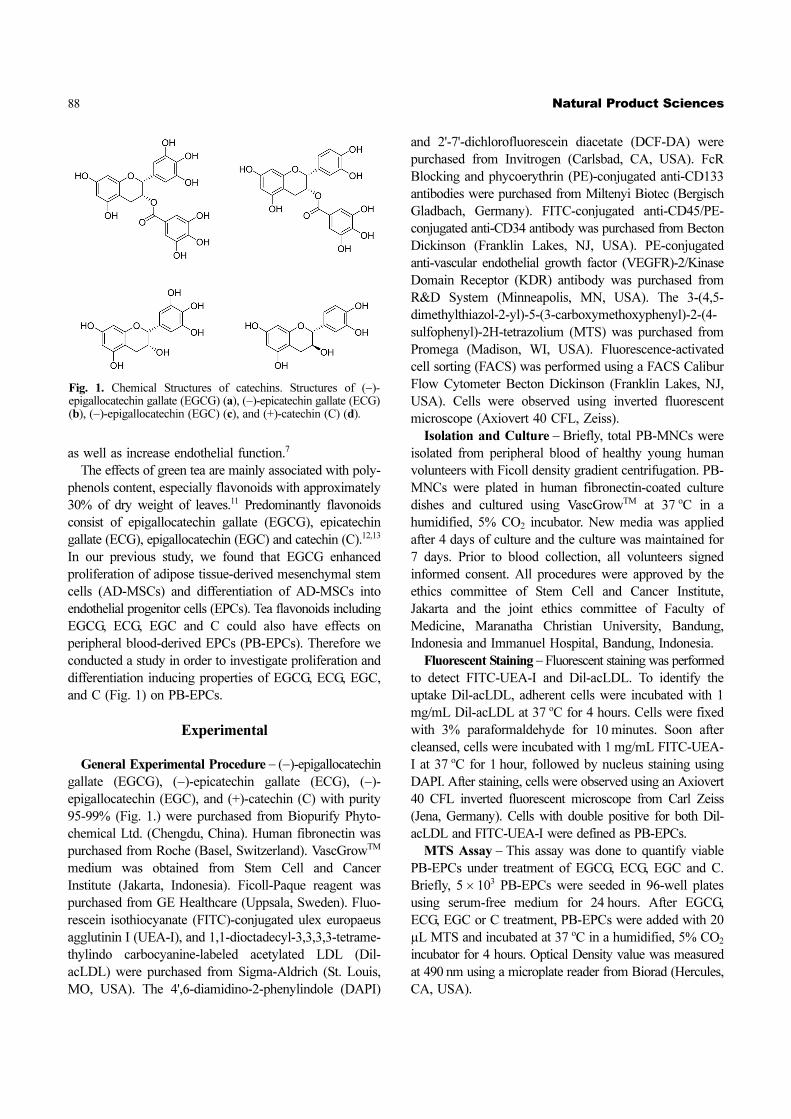
Lectin binding and Dil-acLDL uptake of the CD34+,
CD133+ and VEGFR-2+ cells − Cultured cells were
adherent with spindle-shaped morphology. Fig. 2B
showed lectin binding property, while Fig. 2C showed
Dil-acLDL uptake of the cells, marked by fluorescent
cells in both Fig. 2B and 2C. These 2 characteristics
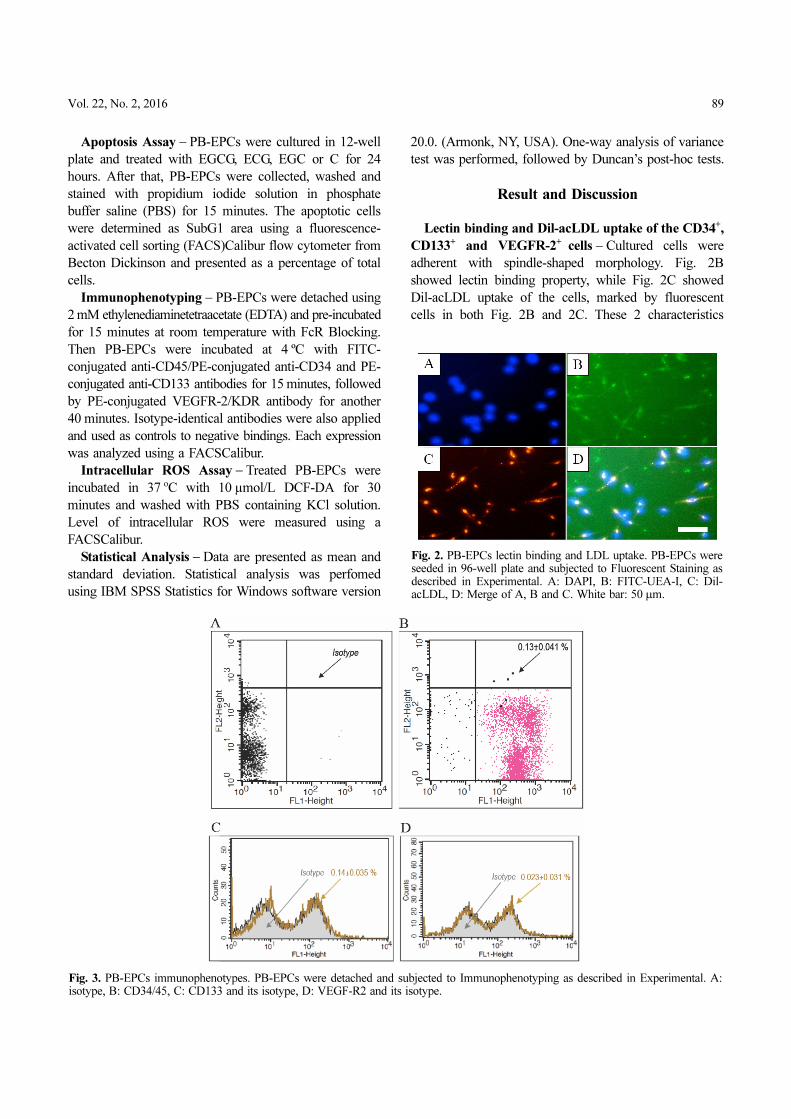
Fig. 3. PB-EPCs immunophenotypes. PB-EPCs were detached and subjected to Immunophenotyping as described in Experimental. A:isotype, B: CD34/45, C: CD133 and its isotype, D: VEGF-R2 and its isotype.
Fig. 2. PB-EPCs lectin binding and LDL uptake. PB-EPCs wereseeded in 96-well plate and subjected to Fluorescent Staining asdescribed in Experimental. A: DAPI, B: FITC-UEA-I, C: Dil-acLDL, D: Merge of A, B and C. White bar: 50 μm.
90 Natural Product Sciences
implied the cultured cells as PB-EPCs. The cells were
further immunophenotyped for CD34, CD133 and
VEGFR-2. Flow cytometric results showed that the cells
expressed CD34, CD133 and VEGFR-2 (Fig. 3). Hence,
our cultured cells were confirmed as EPCs.
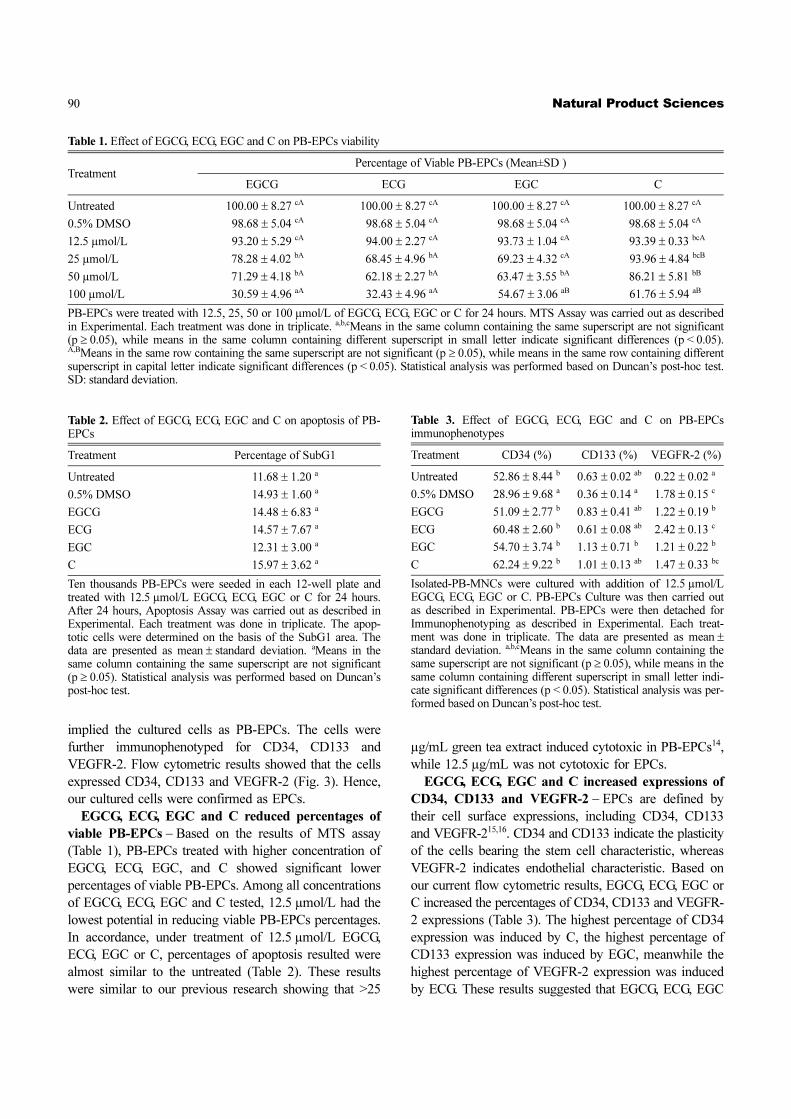
EGCG, ECG, EGC and C reduced percentages of
viable PB-EPCs − Based on the results of MTS assay
(Table 1), PB-EPCs treated with higher concentration of
EGCG, ECG, EGC, and C showed significant lower
percentages of viable PB-EPCs. Among all concentrations
of EGCG, ECG, EGC and C tested, 12.5 µmol/L had the
lowest potential in reducing viable PB-EPCs percentages.
In accordance, under treatment of 12.5 µmol/L EGCG,
ECG, EGC or C, percentages of apoptosis resulted were
almost similar to the untreated (Table 2). These results
were similar to our previous research showing that >25
µg/mL green tea extract induced cytotoxic in PB-EPCs14,
while 12.5 µg/mL was not cytotoxic for EPCs.
EGCG, ECG, EGC and C increased expressions of
CD34, CD133 and VEGFR-2 − EPCs are defined by
their cell surface expressions, including CD34, CD133
and VEGFR-215,16. CD34 and CD133 indicate the plasticity
of the cells bearing the stem cell characteristic, whereas
VEGFR-2 indicates endothelial characteristic. Based on
our current flow cytometric results, EGCG, ECG, EGC or
C increased the percentages of CD34, CD133 and VEGFR-
2 expressions (Table 3). The highest percentage of CD34
expression was induced by C, the highest percentage of
CD133 expression was induced by EGC, meanwhile the
highest percentage of VEGFR-2 expression was induced
by ECG. These results suggested that EGCG, ECG, EGC
Table 1. Effect of EGCG, ECG, EGC and C on PB-EPCs viability
TreatmentPercentage of Viable PB-EPCs (Mean±SD )
EGCG ECG EGC C
Untreated 100.00 ± 8.27 cA 100.00 ± 8.27 cA 100.00 ± 8.27 cA 100.00 ± 8.27 cA
0.5% DMSO 98.68 ± 5.04 cA 98.68 ± 5.04 cA 98.68 ± 5.04 cA 98.68 ± 5.04 cA
12.5 µmol/L 93.20 ± 5.29 cA 94.00 ± 2.27 cA 93.73 ± 1.04 cA 93.39 ± 0.33 bcA
25 µmol/L 78.28 ± 4.02 bA 68.45 ± 4.96 bA 69.23 ± 4.32 cA 93.96 ± 4.84 bcB
50 µmol/L 71.29 ± 4.18 bA 62.18 ± 2.27 bA 63.47 ± 3.55 bA 86.21 ± 5.81 bB
100 µmol/L 30.59 ± 4.96 aA 32.43 ± 4.96 aA 54.67 ± 3.06 aB 61.76 ± 5.94 aB
PB-EPCs were treated with 12.5, 25, 50 or 100 µmol/L of EGCG, ECG, EGC or C for 24 hours. MTS Assay was carried out as describedin Experimental. Each treatment was done in triplicate. a,b,cMeans in the same column containing the same superscript are not significant(p ≥ 0.05), while means in the same column containing different superscript in small letter indicate significant differences (p < 0.05).A,BMeans in the same row containing the same superscript are not significant (p ≥ 0.05), while means in the same row containing differentsuperscript in capital letter indicate significant differences (p < 0.05). Statistical analysis was performed based on Duncan’s post-hoc test.SD: standard deviation.
Table 2. Effect of EGCG, ECG, EGC and C on apoptosis of PB-EPCs
Treatment Percentage of SubG1
Untreated 11.68 ± 1.20 a
0.5% DMSO 14.93 ± 1.60 a
EGCG 14.48 ± 6.83 a
ECG 14.57 ± 7.67 a
EGC 12.31 ± 3.00 a
C 15.97 ± 3.62 a
Ten thousands PB-EPCs were seeded in each 12-well plate andtreated with 12.5 µmol/L EGCG, ECG, EGC or C for 24 hours.After 24 hours, Apoptosis Assay was carried out as described inExperimental. Each treatment was done in triplicate. The apop-totic cells were determined on the basis of the SubG1 area. Thedata are presented as mean ± standard deviation. aMeans in thesame column containing the same superscript are not significant(p ≥ 0.05). Statistical analysis was performed based on Duncan’spost-hoc test.
Table 3. Effect of EGCG, ECG, EGC and C on PB-EPCsimmunophenotypes
Treatment CD34 (%) CD133 (%) VEGFR-2 (%)
Untreated 52.86 ± 8.44 b 0.63 ± 0.02 ab 0.22 ± 0.02 a
0.5% DMSO 28.96 ± 9.68 a 0.36 ± 0.14 a 1.78 ± 0.15 c
EGCG 51.09 ± 2.77 b 0.83 ± 0.41 ab 1.22 ± 0.19 b
ECG 60.48 ± 2.60 b 0.61 ± 0.08 ab 2.42 ± 0.13 c
EGC 54.70 ± 3.74 b 1.13 ± 0.71 b 1.21 ± 0.22 b
C 62.24 ± 9.22 b 1.01 ± 0.13 ab 1.47 ± 0.33 bc
Isolated-PB-MNCs were cultured with addition of 12.5 µmol/LEGCG, ECG, EGC or C. PB-EPCs Culture was then carried outas described in Experimental. PB-EPCs were then detached forImmunophenotyping as described in Experimental. Each treat-ment was done in triplicate. The data are presented as mean ±
standard deviation. a,b,cMeans in the same column containing thesame superscript are not significant (p ≥ 0.05), while means in thesame column containing different superscript in small letter indi-cate significant differences (p < 0.05). Statistical analysis was per-formed based on Duncan’s post-hoc test.

Vol. 22, No. 2, 2016 91
and C induced differentiation of peripheral blood
mononuclear cells (PB-MNCs) into PB-EPCs. Our
previous results also showed that ECGC induced differen-
tiation of AD-MSCs into EPCs17. In addition, resulted
PB-EPCs showed that VEGFR-2 was the most elevated
marker, indicating high endothelial characteristic.
EGCG, ECG, EGC and C suppressed H2O2-induced
ROS level in PB-EPCs − DCF-DA has been used for
several studies dealing with the effect of ROS in cell
culture18,19. DCF trapped within the cells was measured to
represent the intracellular ROS level20,21. Compared with
the untreated, induction of H2O2 increased percentages of
ROS level in PB-EPCs significantly (Table 4). By
pretreatment of EGCG, ECG, EGC or C, H2O2-induced
percentages of ROS level was suppressed. These results
were consistent with our previous results. Green tea
extract that was supposed to contain flavonoids including
EGCG, ECG, EGC and C, suppressed H2O2-induced ROS
level in PB-EPCs14. Among all investigated flavonoids, C
had the highest ROS suppressing capacity in PB-EPCs,
since C was reported to have high 1,1-diphenyl-2-picryl-
hydrazyl (DPPH) free radical scavenging and high
superoxide dismutase activities22.
Taken together, our current results showed that EGCG,
ECG, EGC or C of tea flavonoids, could induce differen-
tiation of PB-MNCs into PB-EPCs as well as protect PB-
EPCs from oxidative damage by suppresing the intra-
cellular ROS levels. In addition, concentration of 12.5
µmol/L was not cytotoxic for EPCs. This study suggests
that tea flavonoids might be related to PB-EPCs produc-
tion and protection.
Acknowledgments
This research was funded by the Ministry of Research,
Technology and Higher Education, Republic of Indonesia
(No:1.41.02/SEK/IR/PPK./I/2011). Stem Cell and Cancer
Institute (SCI), Jakarta for supporting the research metho-
dology and facilities. We thank Maesaroh Maesaroh, I
Dewa Gde Sathya Deva and Balqis Balqis at Biomole-
cular and Biomedical Research Center, Aretha Medika
Utama for their technical support.
References
(1) Bonetti, P. O.; Lerman, L. O.; Lerman, A. Arterioscler. Thromb.
Vasc. Biol. 2003, 23, 168-175.
(2) Higashi, Y.; Noma, K.; Yoshizumi, M.; Kihara, Y. Circ. J. 2009, 73,
411-418.
(3) Diaz, M. N.; Frei, B.; Vita, J. A.; Keaney J. F. Jr. N. Engl. J. Med.
1997, 337, 408-416.
(4) Lin, J.; Cook, N. R.; Albert, C.; Zaharris, E.; Gaziano, J. M.; Van
Denburgh, M.; Buring, J. E.; Manson, J. E. J. Natl. Cancer Inst. 2009,
101, 14-23.
(5) Yang, C. S.; Landau, J. M. J. Nutr. 2000, 130, 2409-2412.
(6) Trevisanato, S. I.; Kim, Y. I. Nutr. Rev. 2000, 58, 1-10.
(7) Shenouda, S. M.; Vita, J. A. J. Am. Coll. Nutr. 2007, 26, 366S-372S.
(8) Grassi, D.; Mulder, T. P.; Draijer, R.; Desideri, G.; Molhuizen, H. O.;
Ferri, C. J. Hypertens. 2009, 27, 774-781.
(9) Hertog, M. G.; Feskens, E. J.; Hollman, P. C.; Katan, M. B.;
Kromhout, D. Lancet 1993, 342, 1007-1011.
(10) Mukamal, K. J.; Maclure, M.; Muller, J. E.; Sherwood, J. B.;
Mittleman, M. A. Circulation 2002, 105, 2476-2481.
(11) Balentine, D. A.; Wiseman, S. A.; Bouwens, L. C. Crit. Rev. Food
Sci. Nutr. 1997, 37, 693-704.
(12) Wolfram, S. J. Am. Coll. Nutr. 2007, 26, 373S-388S.
(13) Sano, M.; Tabata, M.; Suzuki, M.; Degawa, M.; Miyase, T.;
Maeda-Yamamoto, M. Analyst 2001, 126, 816-820.
(14) Widowati, W.; Widyanto, R. M.; Husin, W.; Ratnawati, H.;
Laksmitawati, D. R.; Setiawan, B.; Nugrahenny, D.; Bachtiar. I. Iran J.
Basic Med. Sci. 2014, 17, 702-709.
(15) Wollert, K. C.; Drexler, H. Circ. Res. 2005, 96, 151-163.
(16) Sagara, Y.; Vanhnasy, J.; Maher, P. J. Neurochem. 2004, 90, 1144-
1155.
(17) Widowati, W.; Sardjono, C. T.; Wijaya, L.; Laksmitawati, D. R.;
Sandra, F. J. US-China Med. Sci. 2012, 9, 22-29.
(18) Murphy, T. H.; Miyamoto, M.; Sastre, A.; Schnaar, R. L.; Coyle, J.
T. Neuron 1989, 2, 1547-1558.
(19) LeBel, C. P.; Ischiropoulos, H.; Bondy, S. C. Chem. Res. Toxicol.
Table 4. Effect of EGCG, ECG, EGC and C on ROS of H2O2-induced PB-EPCs
Treatment ROS Level (%) Ratio of All to Negative Control (%) Ratio of All to Positive Control (%)
Untreated (negative control) 7.20 ± 1.65 a 599.95 ± 22.97 a 22.81 ± 5.24 a
H2O2 (positive control) 31.55 ± 1.10 e 438.15 ± 15.22 e 99.99 ± 3.47 e
EGCG + H2O2 12.92 ± 0.70 c 179.49 ± 9.67 c 40.96 ± 2.21 c
ECG + H2O2 10.83 ± 2.35 bc 150.46 ± 32.62 bc 34.34 ± 7.44 bc
EGC + H2O2 18.66 ± 2.81 d 259.21 ± 39.09 d 59.15 ± 8.92 d
C + H2O2 8.85 ± 1.13 ab 122.96 ± 15.73 ab 28.06 ± 3.59 ab
PB-EPCs were treated with 12.5 µmol/L of EGCG, ECG, EGC or C for 30 minutes. PB-EPCs were then treated with H2O2 with final con-centration of 200 µmol/L for 1 hour. Treated-PB-EPCs were subjected to Intracellular ROS Assay as described in Experimental. Eachtreatment was done in triplicate. The data are presented as mean±standard deviation. a,b,c,dMeans in the same column containing the samesuperscript are not significant (p ≥ 0.05), while means in the same column containing different superscript in small letter indicate signifi-cant differences (p < 0.05). Statistical analysis was performed based on Duncan’s post-hoc test.

92 Natural Product Sciences
1992, 5, 227-231.
(20) Jie, G.; Lin, Z.; Zhang, L.; Lv, H.; He, P.; Zhao, B. J. Agric. Food
Chem. 2006, 54, 8058-8064.
(21) Valko, M.; Leibfritz, D.; Moncol, J.; Cronin, M. T.; Mazur, M.;
Telser, J. Int. J. Biochem. Cell Biol. 2007, 39, 44-84.
(22) Evacuasiany, E.; Ratnawati, H.; Liana, L. K.; Widowati, W.;
Maesaroh, M.; Mozef, T.; Risdian, C. Oxid. Antioxid. Med. Sci. 2014, 3,
141-146.
Received September 18, 2015
Revised November 18, 2015
Accepted November 25, 2015