tea co2 laser machining of cfrp composite - springer · laser scanning technique in cutting of cfrp...
TRANSCRIPT

TEA CO2 laser machining of CFRP composite
A. Salama1 • L. Li1 • P. Mativenga1 • D. Whitehead1
Received: 20 December 2015 / Accepted: 25 March 2016 / Published online: 11 April 2016
� The Author(s) 2016. This article is published with open access at Springerlink.com
Abstract Carbon fibre-reinforced polymer (CFRP) com-
posites have found wide applications in the aerospace,
marine, sports and automotive industries owing to their
lightweight and acceptable mechanical properties com-
pared to the commonly used metallic materials. Machining
of CFRP composites using lasers can be challenging due to
inhomogeneity in the material properties and structures,
which can lead to thermal damages during laser processing.
In the previous studies, Nd:YAG, diode-pumped solid-
state, CO2 (continuous wave), disc and fibre lasers were
used in cutting CFRP composites and the control of dam-
ages such as the size of heat-affected zones (HAZs)
remains a challenge. In this paper, a short-pulsed (8 ls)transversely excited atmospheric pressure CO2 laser was
used, for the first time, to machine CFRP composites. The
laser has high peak powers (up to 250 kW) and excellent
absorption by both the carbon fibre and the epoxy binder.
Design of experiment and statistical modelling, based on
response surface methodology, was used to understand the
interactions between the process parameters such as laser
fluence, repetition rate and cutting speed and their effects
on the cut quality characteristics including size of HAZ,
machining depth and material removal rate (MRR). Based
on this study, process parameter optimization was carried
out to minimize the HAZ and maximize the MRR. A dis-
cussion is given on the potential applications and com-
parisons to other lasers in machining CFRP.
1 Introduction
Composite materials such as CFRP composites have dis-
tinct advantages over conventional materials. CFRPs are
gaining widespread uses in many applications where
lightweight, high strength and corrosion resistance are
essential, such as in the aerospace, automotive and marine
industries [1]. Although the structures made by composites
are often constructed and cured to the required shape,
machining, such as trimming of the edges and drilling of
assembly/fastening holes, remains unavoidable [2]. A car-
bon fibre-reinforced polymer consists of higher-strength
abrasive fibres bonded within a weak polymer. This
structure is heterogeneous and anisotropic depending on
the constituent’s physical properties, fibre orientation and
laminar arrangement.
The inhomogeneity in the material properties and struc-
tures of CFRP compositesmakes their machining difficult by
using mechanical, electrical discharge, abrasive water jet
machining and lasers [3]. CFRP composites are more diffi-
cult to machine than conventional materials generally
because they are heat sensitive and the carbon fibres are very
abrasive [4]. Furthermore, the machining process can sig-
nificantly affect these materials, leading to various forms of
damages, such as delamination, fibres pull-out and heat
damages. This can result in components being rejected at the
last stage of their production sequence [5]. The main
machining techniques used for CFRPs are mechanical cut-
ting such as sawing, milling, drilling or grinding. Also,
abrasive water jet (AWJ) cutting is used, due to its low tool
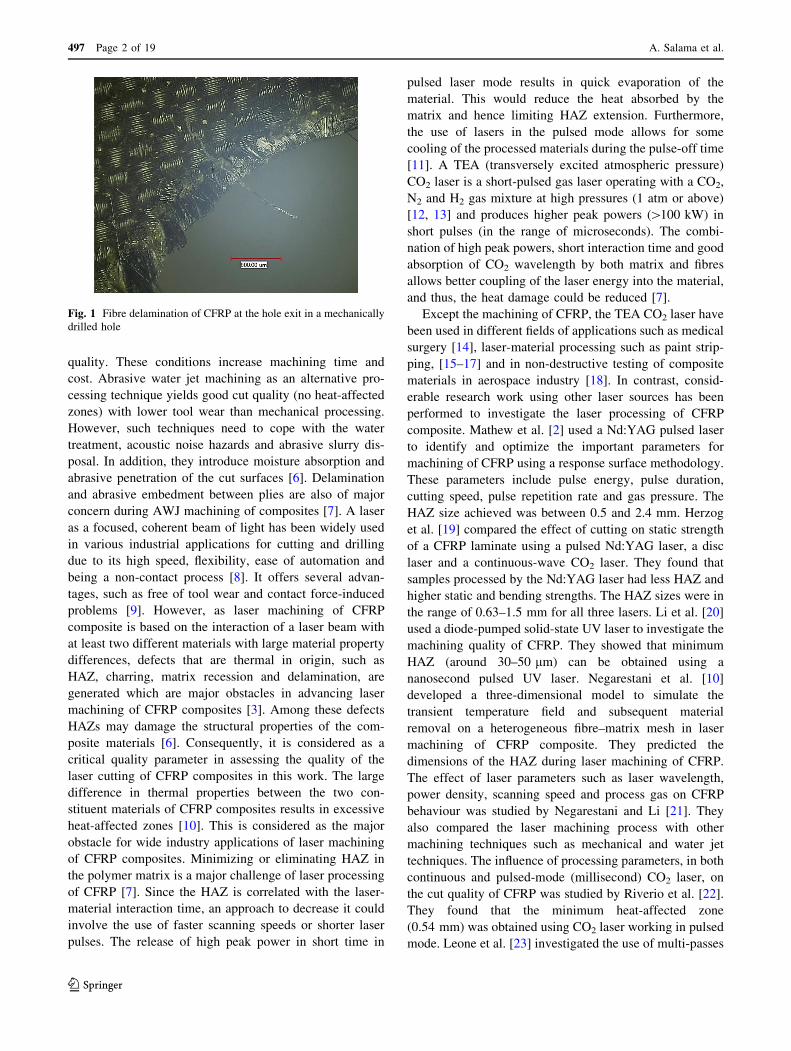
wear and avoidance of heat-affected zone. Mechanical
machining of CFRP composites often leads to excessive tool
wear and delamination (e.g. Fig. 1) on fibre.
These result in an under-utilization of tools, as they have
to be changed at low tool wear levels to control the process
& A. Salama
1 Laser Processing Research Centre, School of Mechanical,
Aerospace and Civil Engineering, The University of
Manchester, Manchester M13 9PL, UK
123
Appl. Phys. A (2016) 122:497
DOI 10.1007/s00339-016-0025-8
quality. These conditions increase machining time and
cost. Abrasive water jet machining as an alternative pro-
cessing technique yields good cut quality (no heat-affected
zones) with lower tool wear than mechanical processing.
However, such techniques need to cope with the water
treatment, acoustic noise hazards and abrasive slurry dis-
posal. In addition, they introduce moisture absorption and
abrasive penetration of the cut surfaces [6]. Delamination
and abrasive embedment between plies are also of major
concern during AWJ machining of composites [7]. A laser
as a focused, coherent beam of light has been widely used
in various industrial applications for cutting and drilling
due to its high speed, flexibility, ease of automation and
being a non-contact process [8]. It offers several advan-
tages, such as free of tool wear and contact force-induced
problems [9]. However, as laser machining of CFRP
composite is based on the interaction of a laser beam with
at least two different materials with large material property
differences, defects that are thermal in origin, such as
HAZ, charring, matrix recession and delamination, are
generated which are major obstacles in advancing laser
machining of CFRP composites [3]. Among these defects
HAZs may damage the structural properties of the com-
posite materials [6]. Consequently, it is considered as a
critical quality parameter in assessing the quality of the
laser cutting of CFRP composites in this work. The large
difference in thermal properties between the two con-
stituent materials of CFRP composites results in excessive
heat-affected zones [10]. This is considered as the major
obstacle for wide industry applications of laser machining
of CFRP composites. Minimizing or eliminating HAZ in
the polymer matrix is a major challenge of laser processing
of CFRP [7]. Since the HAZ is correlated with the laser-
material interaction time, an approach to decrease it could
involve the use of faster scanning speeds or shorter laser
pulses. The release of high peak power in short time in
pulsed laser mode results in quick evaporation of the
material. This would reduce the heat absorbed by the
matrix and hence limiting HAZ extension. Furthermore,
the use of lasers in the pulsed mode allows for some
cooling of the processed materials during the pulse-off time
[11]. A TEA (transversely excited atmospheric pressure)
CO2 laser is a short-pulsed gas laser operating with a CO2,
N2 and H2 gas mixture at high pressures (1 atm or above)
[12, 13] and produces higher peak powers ([100 kW) in
short pulses (in the range of microseconds). The combi-
nation of high peak powers, short interaction time and good
absorption of CO2 wavelength by both matrix and fibres
allows better coupling of the laser energy into the material,
and thus, the heat damage could be reduced [7].
Except the machining of CFRP, the TEA CO2 laser have
been used in different fields of applications such as medical
surgery [14], laser-material processing such as paint strip-
ping, [15–17] and in non-destructive testing of composite
materials in aerospace industry [18]. In contrast, consid-
erable research work using other laser sources has been
performed to investigate the laser processing of CFRP
composite. Mathew et al. [2] used a Nd:YAG pulsed laser
to identify and optimize the important parameters for
machining of CFRP using a response surface methodology.
These parameters include pulse energy, pulse duration,
cutting speed, pulse repetition rate and gas pressure. The
HAZ size achieved was between 0.5 and 2.4 mm. Herzog
et al. [19] compared the effect of cutting on static strength
of a CFRP laminate using a pulsed Nd:YAG laser, a disc
laser and a continuous-wave CO2 laser. They found that
samples processed by the Nd:YAG laser had less HAZ and
higher static and bending strengths. The HAZ sizes were in
the range of 0.63–1.5 mm for all three lasers. Li et al. [20]
used a diode-pumped solid-state UV laser to investigate the
machining quality of CFRP. They showed that minimum
HAZ (around 30–50 lm) can be obtained using a
nanosecond pulsed UV laser. Negarestani et al. [10]
developed a three-dimensional model to simulate the
transient temperature field and subsequent material
removal on a heterogeneous fibre–matrix mesh in laser
machining of CFRP composite. They predicted the
dimensions of the HAZ during laser machining of CFRP.
The effect of laser parameters such as laser wavelength,
power density, scanning speed and process gas on CFRP
behaviour was studied by Negarestani and Li [21]. They
also compared the laser machining process with other
machining techniques such as mechanical and water jet
techniques. The influence of processing parameters, in both
continuous and pulsed-mode (millisecond) CO2 laser, on
the cut quality of CFRP was studied by Riverio et al. [22].
They found that the minimum heat-affected zone
(0.54 mm) was obtained using CO2 laser working in pulsed
mode. Leone et al. [23] investigated the use of multi-passes
Fig. 1 Fibre delamination of CFRP at the hole exit in a mechanically
drilled hole
497 Page 2 of 19 A. Salama et al.
123
laser scanning technique in cutting of CFRP thin sheets
using a 30-W MOPA Q-switched pulsed Yb:YAG fibre
laser. They found that the kerf geometry was mainly
affected by the scanning speed. Furthermore, the HAZ
extent was influenced by the scanning speed as well as
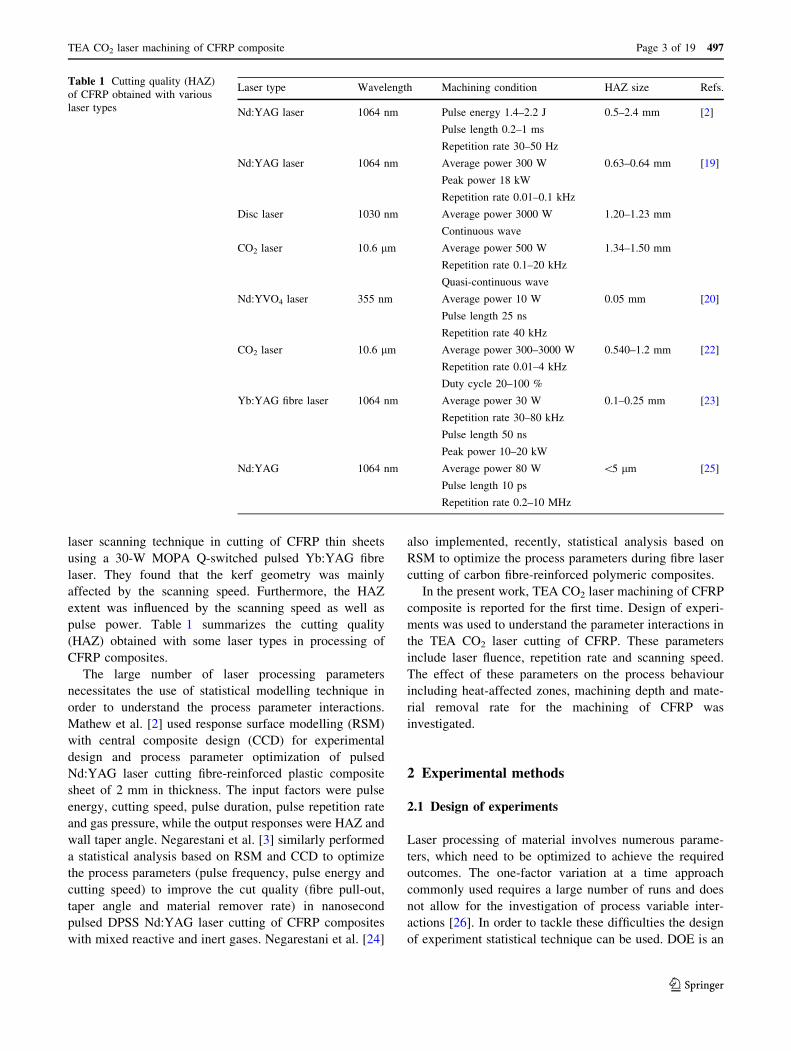
pulse power. Table 1 summarizes the cutting quality
(HAZ) obtained with some laser types in processing of
CFRP composites.
The large number of laser processing parameters
necessitates the use of statistical modelling technique in
order to understand the process parameter interactions.
Mathew et al. [2] used response surface modelling (RSM)
with central composite design (CCD) for experimental
design and process parameter optimization of pulsed
Nd:YAG laser cutting fibre-reinforced plastic composite
sheet of 2 mm in thickness. The input factors were pulse
energy, cutting speed, pulse duration, pulse repetition rate
and gas pressure, while the output responses were HAZ and
wall taper angle. Negarestani et al. [3] similarly performed
a statistical analysis based on RSM and CCD to optimize
the process parameters (pulse frequency, pulse energy and
cutting speed) to improve the cut quality (fibre pull-out,
taper angle and material remover rate) in nanosecond
pulsed DPSS Nd:YAG laser cutting of CFRP composites
with mixed reactive and inert gases. Negarestani et al. [24]
also implemented, recently, statistical analysis based on
RSM to optimize the process parameters during fibre laser
cutting of carbon fibre-reinforced polymeric composites.
In the present work, TEA CO2 laser machining of CFRP
composite is reported for the first time. Design of experi-
ments was used to understand the parameter interactions in
the TEA CO2 laser cutting of CFRP. These parameters
include laser fluence, repetition rate and scanning speed.
The effect of these parameters on the process behaviour
including heat-affected zones, machining depth and mate-
rial removal rate for the machining of CFRP was
investigated.
2 Experimental methods
2.1 Design of experiments
Laser processing of material involves numerous parame-
ters, which need to be optimized to achieve the required
outcomes. The one-factor variation at a time approach
commonly used requires a large number of runs and does
not allow for the investigation of process variable inter-
actions [26]. In order to tackle these difficulties the design
of experiment statistical technique can be used. DOE is an
Table 1 Cutting quality (HAZ)
of CFRP obtained with various
laser types
Laser type Wavelength Machining condition HAZ size Refs.
Nd:YAG laser 1064 nm Pulse energy 1.4–2.2 J 0.5–2.4 mm [2]
Pulse length 0.2–1 ms
Repetition rate 30–50 Hz
Nd:YAG laser 1064 nm Average power 300 W 0.63–0.64 mm [19]
Peak power 18 kW
Repetition rate 0.01–0.1 kHz
Disc laser 1030 nm Average power 3000 W 1.20–1.23 mm
Continuous wave
CO2 laser 10.6 lm Average power 500 W 1.34–1.50 mm
Repetition rate 0.1–20 kHz
Quasi-continuous wave
Nd:YVO4 laser 355 nm Average power 10 W 0.05 mm [20]
Pulse length 25 ns
Repetition rate 40 kHz
CO2 laser 10.6 lm Average power 300–3000 W 0.540–1.2 mm [22]
Repetition rate 0.01–4 kHz
Duty cycle 20–100 %
Yb:YAG fibre laser 1064 nm Average power 30 W 0.1–0.25 mm [23]
Repetition rate 30–80 kHz
Pulse length 50 ns
Peak power 10–20 kW
Nd:YAG 1064 nm Average power 80 W \5 lm [25]
Pulse length 10 ps
Repetition rate 0.2–10 MHz
TEA CO2 laser machining of CFRP composite Page 3 of 19 497
123
experimental-based modelling method involving the use of
analytical techniques such as analysis of variance
(ANOVA) to process the data and decide on individual and
interaction factors that affect the process and their signifi-
cances on process performance. Response surface mod-
elling with CCD, Taguchi’s method and factorial design
are the most used DOE techniques in laser processing
experiments. Ghosal and Manna [27] used RSM to develop
comprehensive statistical models and optimize the
machining parameters during laser machining of Al/Al2O3-
MMC. Elmesalamy et al. [28] also employed the RSM
based on CCD during ultra-narrow-gap laser welding of
thick-section stainless steel to develop statistical models to
understand the process parameter interactions and optimize
the welding parameters. El-Taweel et al. [29] used Taguchi
method to understand the effect of laser parameters on the
cut quality during CO2 laser cutting of Kevlar-49 com-
posite and to determine the significant parameters and
optimize the cutting parameters for better quality. Among
these techniques RSM is a combination of mathematical
and statistical techniques to correlate experimental
responses with the input variables in mathematical models
to optimize these responses. Moreover, the effect of vari-
able interactions on responses can be graphically presented
in a three-dimensional surface. Consequently, a Design
Expert� software tool was used in this work for the
experimental design using response surface methodology
based on central composite design to show the effect of
combinations of factors on behaviour of process responses
and to develop mathematical models which relate the input
laser variables (laser fluence, repetition rate and scanning
speed) with the output responses (cross-sectional heat-af-
fected zone, machining depth and material removal rate).
Table 2 shows the input laser variables used and their
levels. Six replications of centre runs were used for accu-
rate estimation of the overall process errors. The selection
of these operating parameter ranges was based on initial
screening experiment to enable CFRP machining to take
place. The fluence range was chosen to allow high ablation
rates to be studied (Fig. 5).
2.2 Experimental procedure and materials
The laser cutting experiments was performed using
Lumonics Impact 3150 HP TEA CO2 laser system. The
laser system specifications are listed in Table 3. The laser
beam was delivered to the work piece by means of mirrors
and focusing optics. An Aerotech computer-controlled X–
Y CNC stage was used to traverse the workpieces. A
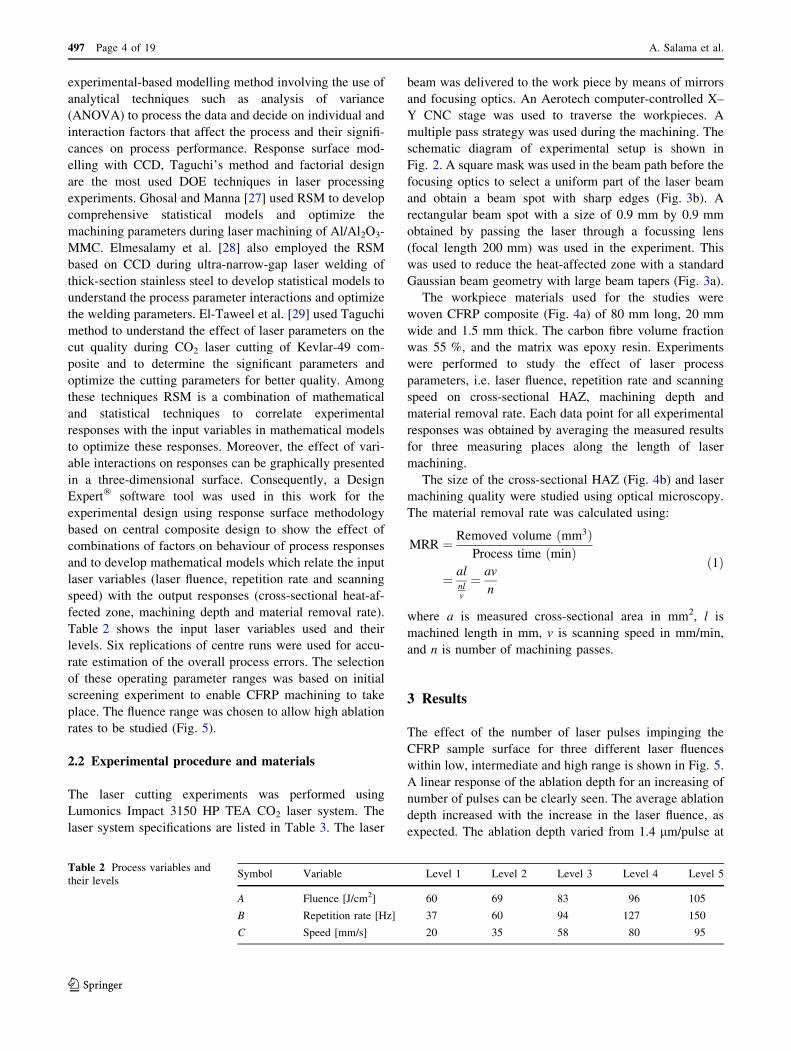
multiple pass strategy was used during the machining. The
schematic diagram of experimental setup is shown in
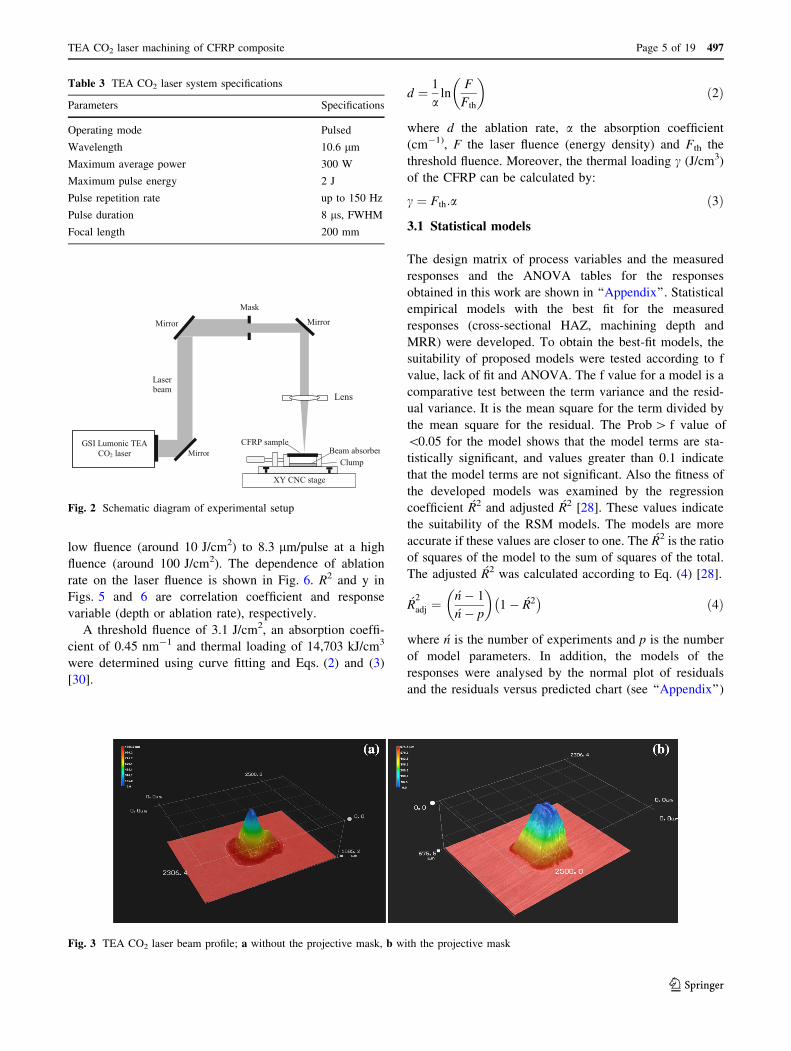
Fig. 2. A square mask was used in the beam path before the
focusing optics to select a uniform part of the laser beam
and obtain a beam spot with sharp edges (Fig. 3b). A
rectangular beam spot with a size of 0.9 mm by 0.9 mm
obtained by passing the laser through a focussing lens
(focal length 200 mm) was used in the experiment. This
was used to reduce the heat-affected zone with a standard
Gaussian beam geometry with large beam tapers (Fig. 3a).
The workpiece materials used for the studies were
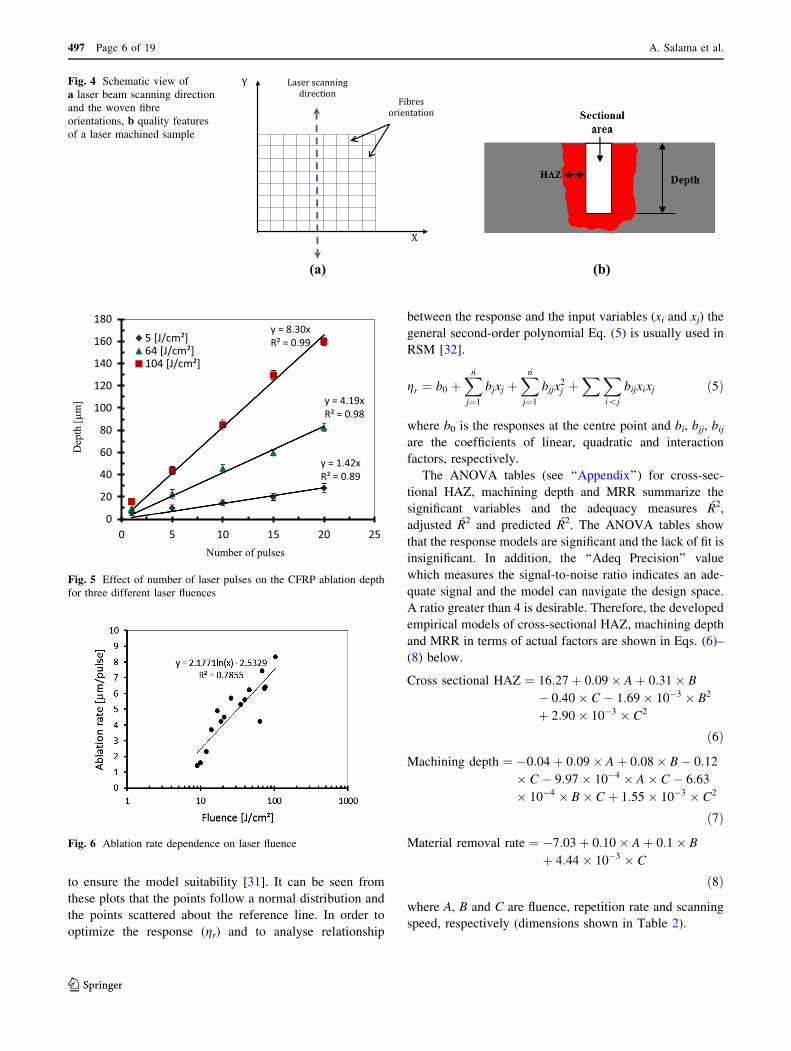
woven CFRP composite (Fig. 4a) of 80 mm long, 20 mm
wide and 1.5 mm thick. The carbon fibre volume fraction
was 55 %, and the matrix was epoxy resin. Experiments
were performed to study the effect of laser process
parameters, i.e. laser fluence, repetition rate and scanning
speed on cross-sectional HAZ, machining depth and
material removal rate. Each data point for all experimental
responses was obtained by averaging the measured results
for three measuring places along the length of laser
machining.
The size of the cross-sectional HAZ (Fig. 4b) and laser
machining quality were studied using optical microscopy.
The material removal rate was calculated using:
MRR ¼ Removed volume mm3ð ÞProcess time minð Þ
¼ alnlv
¼ av
n
ð1Þ
where a is measured cross-sectional area in mm2, l is
machined length in mm, v is scanning speed in mm/min,
and n is number of machining passes.
3 Results
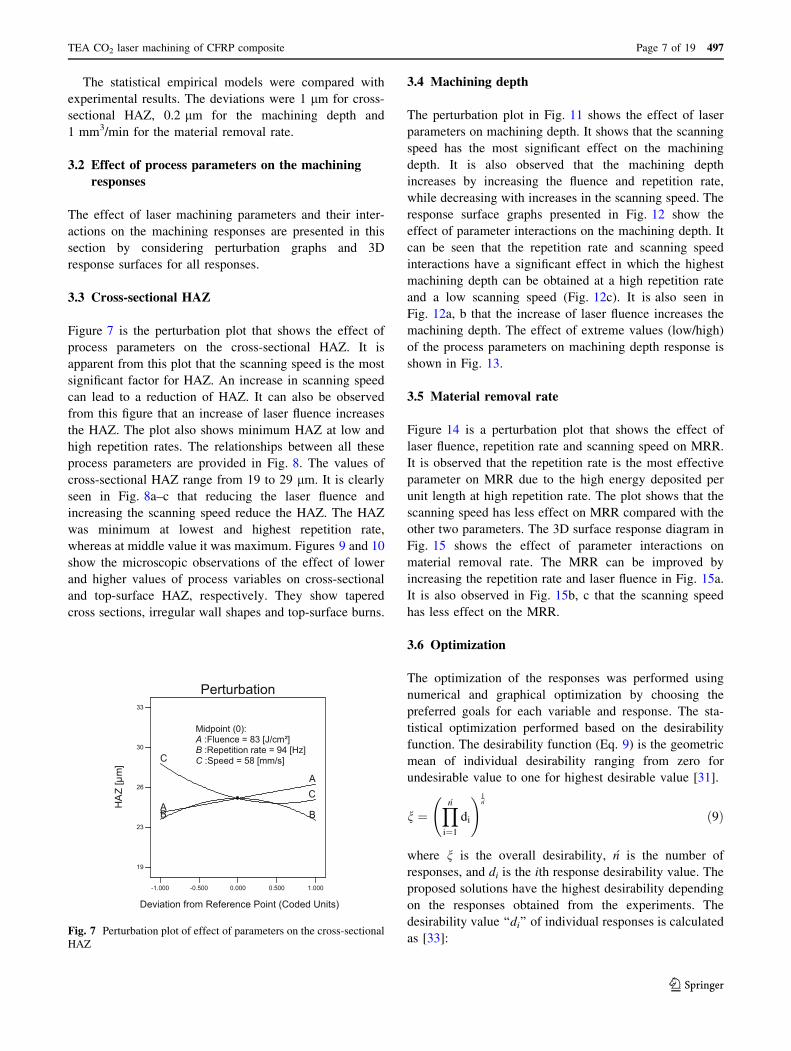
The effect of the number of laser pulses impinging the
CFRP sample surface for three different laser fluences
within low, intermediate and high range is shown in Fig. 5.
A linear response of the ablation depth for an increasing of
number of pulses can be clearly seen. The average ablation
depth increased with the increase in the laser fluence, as
expected. The ablation depth varied from 1.4 lm/pulse at
Table 2 Process variables and
their levelsSymbol Variable Level 1 Level 2 Level 3 Level 4 Level 5
A Fluence [J/cm2] 60 69 83 96 105
B Repetition rate [Hz] 37 60 94 127 150
C Speed [mm/s] 20 35 58 80 95
497 Page 4 of 19 A. Salama et al.
123
low fluence (around 10 J/cm2) to 8.3 lm/pulse at a high
fluence (around 100 J/cm2). The dependence of ablation
rate on the laser fluence is shown in Fig. 6. R2 and y in
Figs. 5 and 6 are correlation coefficient and response
variable (depth or ablation rate), respectively.
A threshold fluence of 3.1 J/cm2, an absorption coeffi-
cient of 0.45 nm-1 and thermal loading of 14,703 kJ/cm3
were determined using curve fitting and Eqs. (2) and (3)
[30].
d ¼ 1
aln
F
Fth
� �ð2Þ
where d the ablation rate, a the absorption coefficient
(cm-1), F the laser fluence (energy density) and Fth the
threshold fluence. Moreover, the thermal loading c (J/cm3)
of the CFRP can be calculated by:
c ¼ Fth:a ð3Þ
3.1 Statistical models
The design matrix of process variables and the measured
responses and the ANOVA tables for the responses
obtained in this work are shown in ‘‘Appendix’’. Statistical
empirical models with the best fit for the measured
responses (cross-sectional HAZ, machining depth and
MRR) were developed. To obtain the best-fit models, the
suitability of proposed models were tested according to f
value, lack of fit and ANOVA. The f value for a model is a
comparative test between the term variance and the resid-
ual variance. It is the mean square for the term divided by
the mean square for the residual. The Prob[ f value of
\0.05 for the model shows that the model terms are sta-
tistically significant, and values greater than 0.1 indicate
that the model terms are not significant. Also the fitness of
the developed models was examined by the regression
coefficient R2 and adjusted R2 [28]. These values indicate
the suitability of the RSM models. The models are more
accurate if these values are closer to one. The R2 is the ratio
of squares of the model to the sum of squares of the total.
The adjusted R2 was calculated according to Eq. (4) [28].
�R2
adj ¼�n� 1
�n� p
� �1� �R2� �
ð4Þ
where n is the number of experiments and p is the number
of model parameters. In addition, the models of the
responses were analysed by the normal plot of residuals
and the residuals versus predicted chart (see ‘‘Appendix’’)
Table 3 TEA CO2 laser system specifications
Parameters Specifications
Operating mode Pulsed
Wavelength 10.6 lm
Maximum average power 300 W
Maximum pulse energy 2 J
Pulse repetition rate up to 150 Hz
Pulse duration 8 ls, FWHM
Focal length 200 mm
MirrorGSI Lumonic TEA
CO2 laser
Mask
Lens
Mirror Mirror
CFRP sample Beam absorber
XY CNC stage
Laser beam
Clump
Fig. 2 Schematic diagram of experimental setup
Fig. 3 TEA CO2 laser beam profile; a without the projective mask, b with the projective mask
TEA CO2 laser machining of CFRP composite Page 5 of 19 497
123
to ensure the model suitability [31]. It can be seen from
these plots that the points follow a normal distribution and
the points scattered about the reference line. In order to
optimize the response (gr) and to analyse relationship
between the response and the input variables (xi and xj) the
general second-order polynomial Eq. (5) is usually used in
RSM [32].
gr ¼ b0 þX�nj¼1
bjxj þX�nj¼1
bjjx2j þ
XXi\j
bijxixj ð5Þ
where b0 is the responses at the centre point and bi, bjj, bijare the coefficients of linear, quadratic and interaction
factors, respectively.
The ANOVA tables (see ‘‘Appendix’’) for cross-sec-
tional HAZ, machining depth and MRR summarize the
significant variables and the adequacy measures R2,
adjusted R2 and predicted R2. The ANOVA tables show
that the response models are significant and the lack of fit is
insignificant. In addition, the ‘‘Adeq Precision’’ value
which measures the signal-to-noise ratio indicates an ade-
quate signal and the model can navigate the design space.
A ratio greater than 4 is desirable. Therefore, the developed
empirical models of cross-sectional HAZ, machining depth
and MRR in terms of actual factors are shown in Eqs. (6)–
(8) below.
Cross sectional HAZ ¼ 16:27þ 0:09� Aþ 0:31� B
� 0:40� C � 1:69� 10�3 � B2
þ 2:90� 10�3 � C2
ð6Þ
Machining depth ¼ �0:04þ 0:09� Aþ 0:08� B� 0:12
� C � 9:97� 10�4 � A� C � 6:63
� 10�4 � B� C þ 1:55� 10�3 � C2
ð7Þ
Material removal rate ¼ �7:03þ 0:10� Aþ 0:1� B
þ 4:44� 10�3 � C
ð8Þ
where A, B and C are fluence, repetition rate and scanning
speed, respectively (dimensions shown in Table 2).
(b)(a)
X
Y Laser scanning
directionFibres
orientation
Fig. 4 Schematic view of
a laser beam scanning direction
and the woven fibre
orientations, b quality features
of a laser machined sample
y = 1.42x R² = 0.89
y = 4.19x R² = 0.98
y = 8.30x R² = 0.99
0
20
40
60
80
100
120
140
160
180
0 5 10 15 20 25
Dep
th [µ
m]
Number of pulses
5 [J/cm²]64 [J/cm²]104 [J/cm²]
Fig. 5 Effect of number of laser pulses on the CFRP ablation depth
for three different laser fluences
Fig. 6 Ablation rate dependence on laser fluence
497 Page 6 of 19 A. Salama et al.
123
The statistical empirical models were compared with
experimental results. The deviations were 1 lm for cross-
sectional HAZ, 0.2 lm for the machining depth and
1 mm3/min for the material removal rate.
3.2 Effect of process parameters on the machining
responses
The effect of laser machining parameters and their inter-
actions on the machining responses are presented in this
section by considering perturbation graphs and 3D
response surfaces for all responses.
3.3 Cross-sectional HAZ
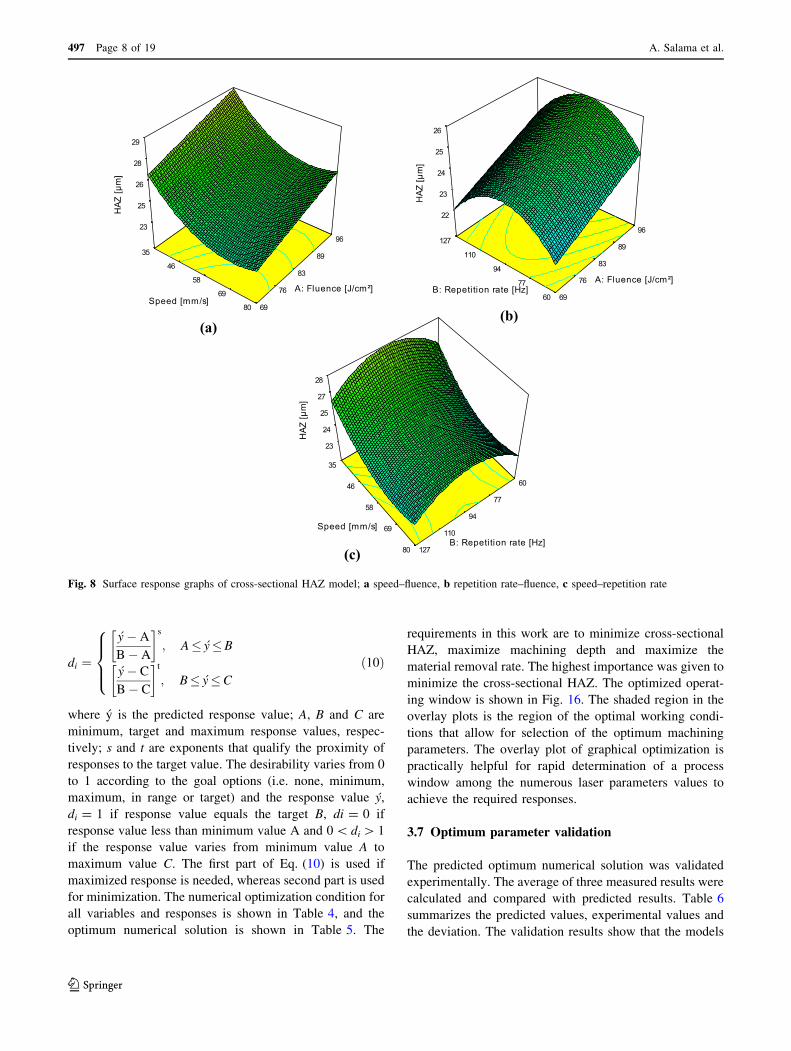
Figure 7 is the perturbation plot that shows the effect of
process parameters on the cross-sectional HAZ. It is
apparent from this plot that the scanning speed is the most
significant factor for HAZ. An increase in scanning speed
can lead to a reduction of HAZ. It can also be observed
from this figure that an increase of laser fluence increases
the HAZ. The plot also shows minimum HAZ at low and
high repetition rates. The relationships between all these
process parameters are provided in Fig. 8. The values of
cross-sectional HAZ range from 19 to 29 lm. It is clearly
seen in Fig. 8a–c that reducing the laser fluence and
increasing the scanning speed reduce the HAZ. The HAZ
was minimum at lowest and highest repetition rate,
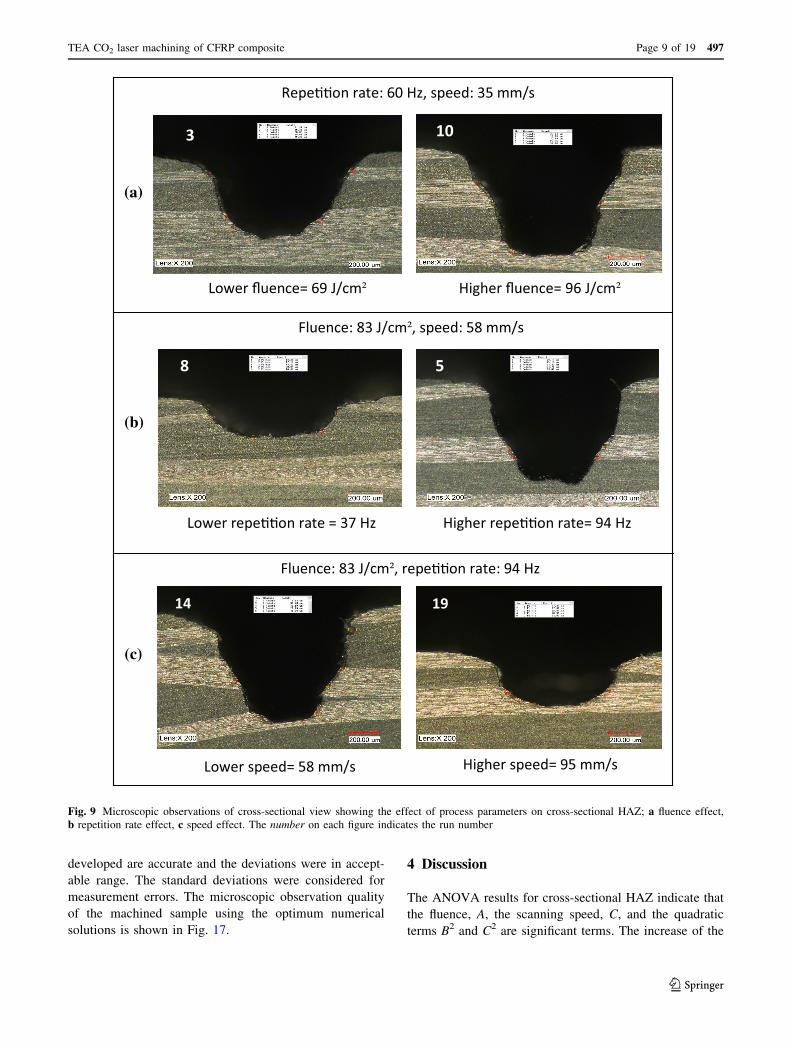
whereas at middle value it was maximum. Figures 9 and 10
show the microscopic observations of the effect of lower
and higher values of process variables on cross-sectional
and top-surface HAZ, respectively. They show tapered
cross sections, irregular wall shapes and top-surface burns.
3.4 Machining depth
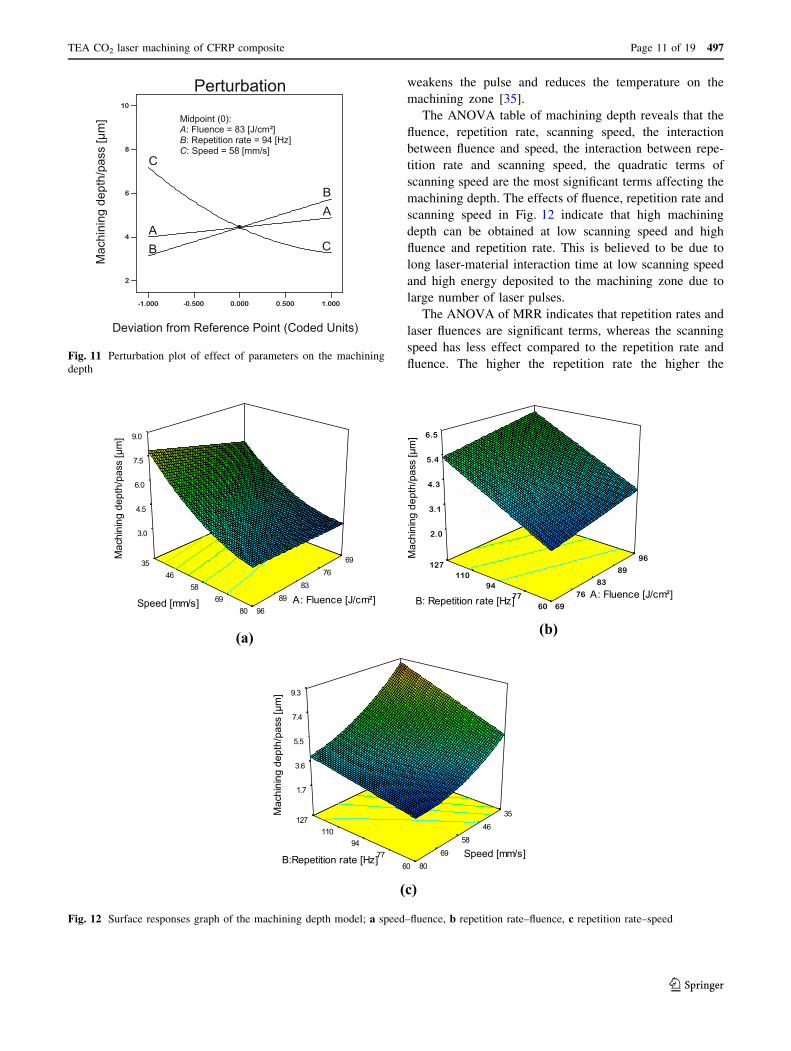
The perturbation plot in Fig. 11 shows the effect of laser
parameters on machining depth. It shows that the scanning
speed has the most significant effect on the machining
depth. It is also observed that the machining depth
increases by increasing the fluence and repetition rate,
while decreasing with increases in the scanning speed. The
response surface graphs presented in Fig. 12 show the
effect of parameter interactions on the machining depth. It
can be seen that the repetition rate and scanning speed
interactions have a significant effect in which the highest
machining depth can be obtained at a high repetition rate
and a low scanning speed (Fig. 12c). It is also seen in
Fig. 12a, b that the increase of laser fluence increases the
machining depth. The effect of extreme values (low/high)
of the process parameters on machining depth response is
shown in Fig. 13.
3.5 Material removal rate
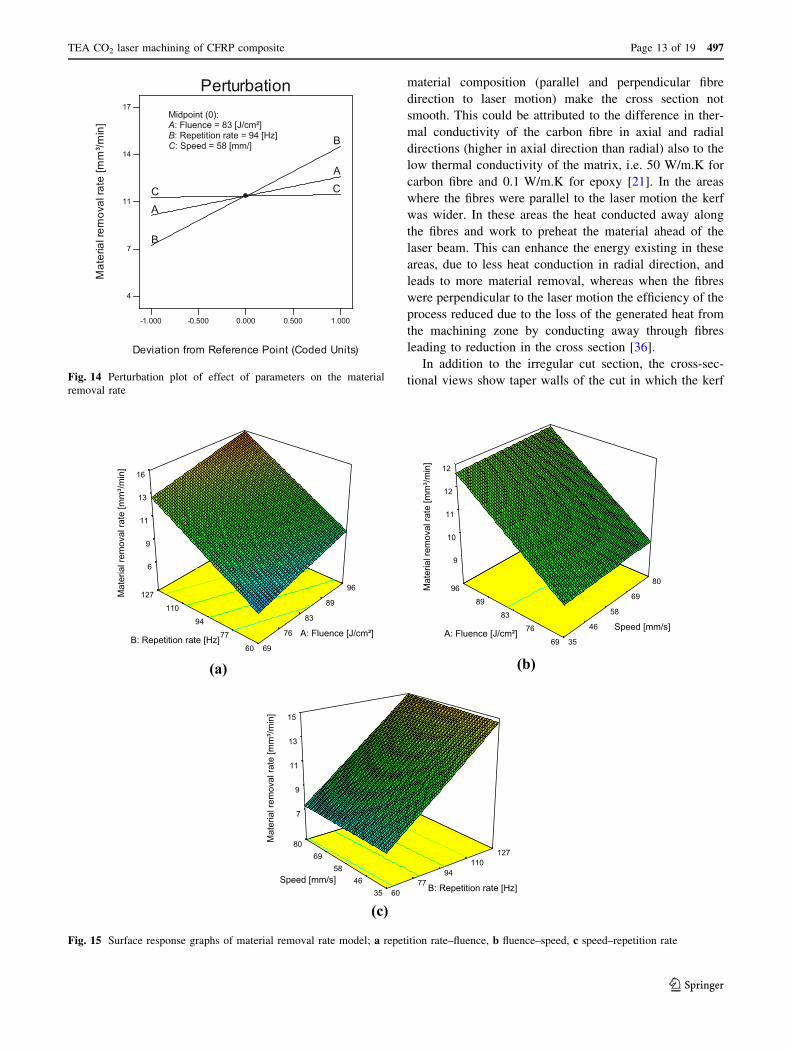
Figure 14 is a perturbation plot that shows the effect of
laser fluence, repetition rate and scanning speed on MRR.
It is observed that the repetition rate is the most effective
parameter on MRR due to the high energy deposited per
unit length at high repetition rate. The plot shows that the
scanning speed has less effect on MRR compared with the
other two parameters. The 3D surface response diagram in
Fig. 15 shows the effect of parameter interactions on
material removal rate. The MRR can be improved by
increasing the repetition rate and laser fluence in Fig. 15a.
It is also observed in Fig. 15b, c that the scanning speed
has less effect on the MRR.
3.6 Optimization
The optimization of the responses was performed using
numerical and graphical optimization by choosing the
preferred goals for each variable and response. The sta-
tistical optimization performed based on the desirability
function. The desirability function (Eq. 9) is the geometric
mean of individual desirability ranging from zero for
undesirable value to one for highest desirable value [31].
n ¼Y�ni¼1
di
!1�n
ð9Þ
where n is the overall desirability, n is the number of
responses, and di is the ith response desirability value. The
proposed solutions have the highest desirability depending
on the responses obtained from the experiments. The
desirability value ‘‘di’’ of individual responses is calculated
as [33]:
Perturbation
Deviation from Reference Point (Coded Units)
HA
Z [µ
m]
-1.000 -0.500 0.000 0.500 1.000
19
23
26
30
33
A
A
B B
C
C
Midpoint (0): A Fluence = 83 [J/cm²] B :
:Repetition rate = 94 [Hz]
C :Speed = 58 [mm/s]
Fig. 7 Perturbation plot of effect of parameters on the cross-sectional
HAZ
TEA CO2 laser machining of CFRP composite Page 7 of 19 497
123
di ¼
�y� A
B� A
� �s; A� �y�B
�y� C
B� C
� �t; B� �y�C
8>><>>:
ð10Þ
where y is the predicted response value; A, B and C are
minimum, target and maximum response values, respec-
tively; s and t are exponents that qualify the proximity of
responses to the target value. The desirability varies from 0
to 1 according to the goal options (i.e. none, minimum,
maximum, in range or target) and the response value y,
di = 1 if response value equals the target B, di = 0 if
response value less than minimum value A and 0\ di[ 1
if the response value varies from minimum value A to
maximum value C. The first part of Eq. (10) is used if
maximized response is needed, whereas second part is used
for minimization. The numerical optimization condition for
all variables and responses is shown in Table 4, and the
optimum numerical solution is shown in Table 5. The
requirements in this work are to minimize cross-sectional
HAZ, maximize machining depth and maximize the
material removal rate. The highest importance was given to
minimize the cross-sectional HAZ. The optimized operat-
ing window is shown in Fig. 16. The shaded region in the
overlay plots is the region of the optimal working condi-
tions that allow for selection of the optimum machining
parameters. The overlay plot of graphical optimization is
practically helpful for rapid determination of a process
window among the numerous laser parameters values to
achieve the required responses.
3.7 Optimum parameter validation
The predicted optimum numerical solution was validated
experimentally. The average of three measured results were
calculated and compared with predicted results. Table 6
summarizes the predicted values, experimental values and
the deviation. The validation results show that the models
35
46
58
69
80 69
76
83
89
9623
25
26
28
29
HAZ
[µm
]
Speed [mm/s] A: Fluence [J/cm²]
(a)
69
76
83
89
96
60
77
94
110
127
22
23
24
25
26
HAZ
[µm
]
A: Fluence [J/cm²] B: Repetition rate [Hz]
(b)
60
77
94
110
127
35
46
58
69
80
23
24
25
27
28
HAZ
[µm
]
B: Repetition rate [Hz]
Speed [mm/s]
(c)
Fig. 8 Surface response graphs of cross-sectional HAZ model; a speed–fluence, b repetition rate–fluence, c speed–repetition rate
497 Page 8 of 19 A. Salama et al.
123
developed are accurate and the deviations were in accept-
able range. The standard deviations were considered for
measurement errors. The microscopic observation quality
of the machined sample using the optimum numerical
solutions is shown in Fig. 17.
4 Discussion
The ANOVA results for cross-sectional HAZ indicate that
the fluence, A, the scanning speed, C, and the quadratic
terms B2 and C2 are significant terms. The increase of the
(b)
(c)
Repe��on rate: 60 Hz, speed: 35 mm/s
(a)
10
Higher fluence= 96 J/cm² Lower fluence= 69 J/cm²
Fluence: 83 J/cm², speed: 58 mm/s
Higher repe��on rate= 94 Hz Lower repe��on rate = 37 Hz
Lower speed= 58 mm/s Higher speed= 95 mm/s
19
Fluence: 83 J/cm², repe��on rate: 94 Hz
3
5 8
14
Fig. 9 Microscopic observations of cross-sectional view showing the effect of process parameters on cross-sectional HAZ; a fluence effect,
b repetition rate effect, c speed effect. The number on each figure indicates the run number
TEA CO2 laser machining of CFRP composite Page 9 of 19 497
123

heat input to the machining zone at high fluence results in
a large HAZ. Moreover, reducing the scanning speed
leads to long laser-material interaction time and high-
pulse spot overlaps which create large HAZs. The higher
is the scanning speed, the less the energy input per unite
length to the materials and hence lower is the HAZ. At
low-pulse repetition rates the pulse peak power is high
enough to increase the machining ability, while giving
time for the material to cool and therefore the material is
removed with less heat spreading to the bulk materials.
The reason for HAZ being reduced above certain value of
repetition rate can be attributed to the reduction in pulse
energy as the repetition rate was increased [34]. Fur-
thermore, the drop of peak power at higher repetition rate
3 10
Repe��on rate: 60 Hz, speed: 35 mm/s
Higher fluence= 96 J/cm² Lower fluence= 69 J/cm²
(a)
Lower repe��on rate = 37 Hz Higher repe��on rate= 94 Hz
5 8
Fluence: 83 J/cm², speed: 58 mm/s
(b)
(c)
19
Fluence: 83 J/cm², repe��on rate: 94 Hz
Lower speed= 58 mm/s Higher speed= 95 mm/s
14
Fig. 10 Microscopic observations of top-surface view showing the effect of process parameters on top-surface HAZ; a fluence effect,
b repetition rate effect, c speed effect. The number on each figure indicates the run number
497 Page 10 of 19 A. Salama et al.
123
weakens the pulse and reduces the temperature on the
machining zone [35].
The ANOVA table of machining depth reveals that the
fluence, repetition rate, scanning speed, the interaction
between fluence and speed, the interaction between repe-
tition rate and scanning speed, the quadratic terms of
scanning speed are the most significant terms affecting the
machining depth. The effects of fluence, repetition rate and
scanning speed in Fig. 12 indicate that high machining
depth can be obtained at low scanning speed and high
fluence and repetition rate. This is believed to be due to
long laser-material interaction time at low scanning speed
and high energy deposited to the machining zone due to
large number of laser pulses.
The ANOVA of MRR indicates that repetition rates and
laser fluences are significant terms, whereas the scanning
speed has less effect compared to the repetition rate and
fluence. The higher the repetition rate the higher the
Perturbation
Deviation from Reference Point (Coded Units)
Mac
hini
ng d
epth
/pas
s [µ
m]
-1.000 -0.500 0.000 0.500 1.000
2
4
6
8
10
AA
B
B
C
C
Midpoint (0):A: Fluence = 83 [J/cm²]B: Repetition rate = 94 [Hz]C: Speed = 58 [mm/s]
Fig. 11 Perturbation plot of effect of parameters on the machining
depth
69 76
83 89
96
35 46
58 69
80
3.0
4.5
6.0
7.5
9.0
Mac
hini
ng d
epth
/pas
s [µ
m]
A: Fluence [J/cm²] Speed [mm/s] 69
76
83
89
96
60 77
94 110
127
2.0
3.1
4.3
5.4
6.5
Mac
hini
ng d
epth
/pas
s [µ
m]
A: Fluence [J/cm²] B: Repetition rate [Hz]
(b)
60 77
94 110
127 35
46
58
69
80
1.7
3.6
5.5
7.4
9.3
Mac
hini
ng d
epth
/pas
s [µ
m]
B:Repetition rate [Hz] Speed [mm/s]
(c)
(a)
Fig. 12 Surface responses graph of the machining depth model; a speed–fluence, b repetition rate–fluence, c repetition rate–speed
TEA CO2 laser machining of CFRP composite Page 11 of 19 497
123

number of pluses deposited into the machining zone and
hence enhances the removal rate of materials. The increase
of laser fluence widens the machining cross-sectional area
and then improves the machining rate [2].
The microscopic observations of the cross sections in
Figs. 9 and 13 show irregular shapes of the cross sec-
tion. The difference in thermal properties between the
carbon fibre and the epoxy matrix and the nature of the
Higher fluence= 96 J/cm²
18 13
(b)
Lower fluence= 69 J/cm²
Repe��on rate: 60 Hz, speed: 35 mm/s
1
Fluence: 83 J/cm², speed: 58 mm/s
Lower repe��on rate =37 Hz Higher repe��on rate=150 Hz
Fluence: 69 J/cm², repe��on rate: 127 Hz
Lower speed= 35 mm/s Higher speed= 80 mm/s
(a)
(c)
8
3 10
Fig. 13 Microscopic observation of cross-sectional view showing the effect of process parameters on machining depth; a fluence effect,
b repetition rate effect, c speed effect. The number on each figure indicates the run number
497 Page 12 of 19 A. Salama et al.
123
material composition (parallel and perpendicular fibre
direction to laser motion) make the cross section not
smooth. This could be attributed to the difference in ther-
mal conductivity of the carbon fibre in axial and radial
directions (higher in axial direction than radial) also to the
low thermal conductivity of the matrix, i.e. 50 W/m.K for
carbon fibre and 0.1 W/m.K for epoxy [21]. In the areas
where the fibres were parallel to the laser motion the kerf
was wider. In these areas the heat conducted away along
the fibres and work to preheat the material ahead of the
laser beam. This can enhance the energy existing in these
areas, due to less heat conduction in radial direction, and
leads to more material removal, whereas when the fibres
were perpendicular to the laser motion the efficiency of the
process reduced due to the loss of the generated heat from
the machining zone by conducting away through fibres
leading to reduction in the cross section [36].
In addition to the irregular cut section, the cross-sec-
tional views show taper walls of the cut in which the kerf
Perturbation
Deviation from Reference Point (Coded Units)
Mat
eria
l rem
oval
rate
[mm
³/min
]
-1.000 -0.500 0.000 0.500 1.000
4
7
11
14
17
A
A
B
B
C C
Midpoint (0):A: Fluence = 83 [J/cm²]B: Repetition rate = 94 [Hz]C: Speed = 58 [mm/]
Fig. 14 Perturbation plot of effect of parameters on the material
removal rate
69
76
83
89
96
60
77
94
110
127
6
9
11
13
16
Mat
eria
l rem
oval
rate
[mm
³/min
]
A: Fluence [J/cm²] B: Repetition rate [Hz]
(a)
35
46
58
69
80
69
76
83
89
96
9
10
11
12
12
Mat
eria
l rem
oval
rate
[mm
³/min
]
Speed [mm/s] A: Fluence [J/cm²]
(b)
60 77
94 110
127
35 46
58 69
80
7
9
11
13
15
Mat
eria
l rem
oval
rate
[mm
³/min
]
B: Repetition rate [Hz] Speed [mm/s]
(c)
Fig. 15 Surface response graphs of material removal rate model; a repetition rate–fluence, b fluence–speed, c speed–repetition rate
TEA CO2 laser machining of CFRP composite Page 13 of 19 497
123
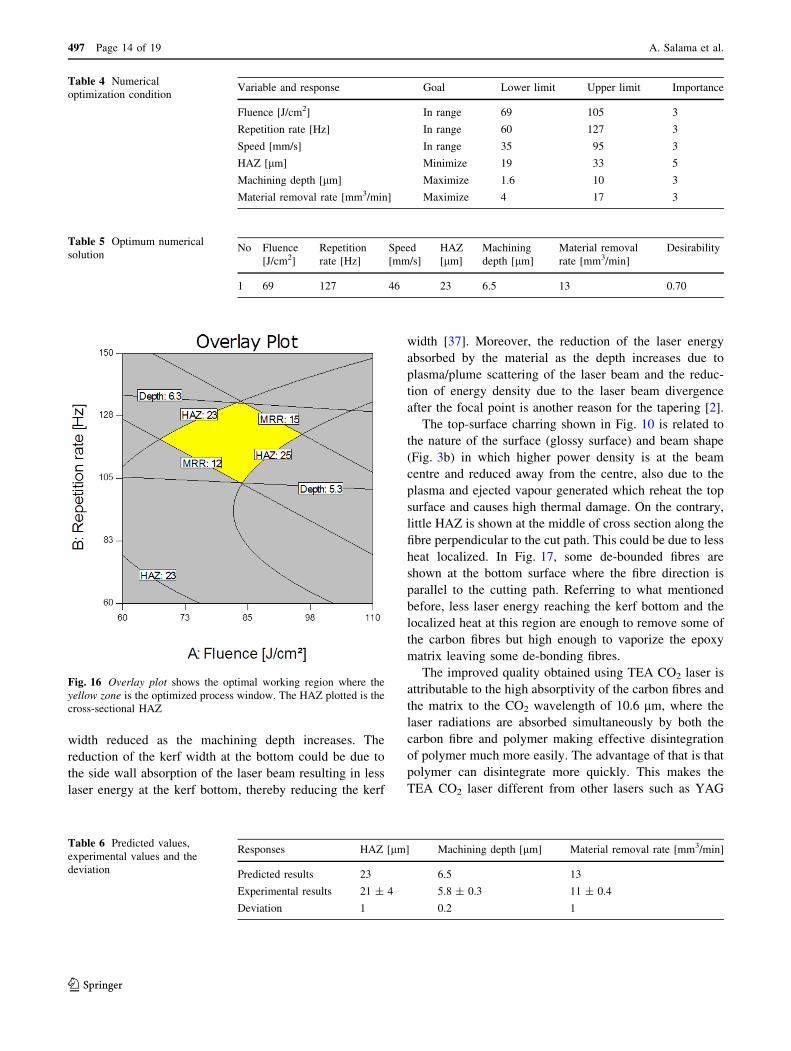
width reduced as the machining depth increases. The
reduction of the kerf width at the bottom could be due to
the side wall absorption of the laser beam resulting in less
laser energy at the kerf bottom, thereby reducing the kerf
width [37]. Moreover, the reduction of the laser energy
absorbed by the material as the depth increases due to
plasma/plume scattering of the laser beam and the reduc-
tion of energy density due to the laser beam divergence
after the focal point is another reason for the tapering [2].
The top-surface charring shown in Fig. 10 is related to
the nature of the surface (glossy surface) and beam shape
(Fig. 3b) in which higher power density is at the beam
centre and reduced away from the centre, also due to the
plasma and ejected vapour generated which reheat the top
surface and causes high thermal damage. On the contrary,
little HAZ is shown at the middle of cross section along the
fibre perpendicular to the cut path. This could be due to less
heat localized. In Fig. 17, some de-bounded fibres are
shown at the bottom surface where the fibre direction is
parallel to the cutting path. Referring to what mentioned
before, less laser energy reaching the kerf bottom and the
localized heat at this region are enough to remove some of
the carbon fibres but high enough to vaporize the epoxy
matrix leaving some de-bonding fibres.
The improved quality obtained using TEA CO2 laser is
attributable to the high absorptivity of the carbon fibres and
the matrix to the CO2 wavelength of 10.6 lm, where the
laser radiations are absorbed simultaneously by both the
carbon fibre and polymer making effective disintegration
of polymer much more easily. The advantage of that is that
polymer can disintegrate more quickly. This makes the
TEA CO2 laser different from other lasers such as YAG
Table 4 Numerical
optimization conditionVariable and response Goal Lower limit Upper limit Importance
Fluence [J/cm2] In range 69 105 3
Repetition rate [Hz] In range 60 127 3
Speed [mm/s] In range 35 95 3
HAZ [lm] Minimize 19 33 5
Machining depth [lm] Maximize 1.6 10 3
Material removal rate [mm3/min] Maximize 4 17 3
Table 5 Optimum numerical
solutionNo Fluence
[J/cm2]
Repetition
rate [Hz]
Speed
[mm/s]
HAZ
[lm]
Machining
depth [lm]
Material removal
rate [mm3/min]
Desirability
1 69 127 46 23 6.5 13 0.70
Fig. 16 Overlay plot shows the optimal working region where the
yellow zone is the optimized process window. The HAZ plotted is the
cross-sectional HAZ
Table 6 Predicted values,
experimental values and the
deviation
Responses HAZ [lm] Machining depth [lm] Material removal rate [mm3/min]
Predicted results 23 6.5 13
Experimental results 21 ± 4 5.8 ± 0.3 11 ± 0.4
Deviation 1 0.2 1
497 Page 14 of 19 A. Salama et al.
123

(1064 nm) and Yb-fibre laser (1070 nm) where the laser is
mainly absorbed by the carbon fibre and is normally
transparent to polymer. These near-IR lasers heat the car-
bon fibre, and the heat is conducted from the carbon fibre to
the polymer; thus, it is less affective and generates larger
heat-affected zones [7, 38]. Furthermore, the high peak
power of TEA CO2 laser (250 kW) released on a short time
results in rapid ablation of the CFRP composite leaving
little time for the heat to propagate to the surrounding
materials, and the cooling time between the pulses further
improves the machining equality. Figure 18 compares and
summarizes the heat-affected zone generation using laser
cutting machining methods. It is clear from the figure that
shorter pulses would enable better quality cutting for
CFRPs. The current state of the art shows the capability of
laser machining to achieve HAZ within tens of
micrometres.
The TEA CO2 laser machining of CFRP shows better
quality and low machining rate than those obtained using
continuous CO2, fibre and Nd:YAG lasers [3, 39], whereas
it is showing inferior quality than those obtained using
femtosecond and picosecond lasers, but its machining rate
is higher than fs and ps lasers [25]. The highly efficient and
low operating cost [40, 41], better quality compared with
CW CO2, fibre and YAG lasers and higher machining rate
than picosecond laser make the TEA CO2 laser potentially
a practical tool for scarf repair of CFRP composite,
acoustic hole drilling, edge trimming applications. Fur-
thermore, since TEA CO2 lasers with an average power of
more than 1 kW have become available [17], practical use
of TEA CO2 lasers for machining CFRP composite may
become economically and practically viable.
5 Conclusions
This paper presented pulsed TEA CO2 laser machining of
carbon fibre-reinforced polymer composites for the first
time. The influence of laser fluence, repetition rate and
scanning speed on cross-sectional heat-affected zone
extension, machining depth and material removal rate has
been investigated using design of experiment. Statistical
empirical models of the responses and the significant pro-
cess parameters among selected parameters were devel-
oped in this work. From this work, the following
conclusions can be drawn:
1. The TEA CO2 laser shows good machining quality
(cross-sectional HAZ) of CFRP composite. The opti-
mum machining results achieved for average cross-
sectional HAZ, machining depth and material removal
rate were 21 ± 4 lm, 5.8 ± 0.3 lm/pass and
11 ± 0.4 mm3/min, respectively.
2. The HAZ was significantly affected by the laser
fluence, scanning speed, square of repetition rate and
square of scanning speed.
Open Access This article is distributed under the terms of the
Creative Commons Attribution 4.0 International License (http://crea
tivecommons.org/licenses/by/4.0/), which permits unrestricted use,
distribution, and reproduction in any medium, provided you give
appropriate credit to the original author(s) and the source, provide a
link to the Creative Commons license, and indicate if changes were
made.
Appendix
The design matrix of process variables and the measured
responses, ANOVA tables of the responses and the diag-
nostic plots are shown below:
See Tables 7, 8, 9, 10 and Fig. 19.
Fig. 17 Cross-sectional view of the machined sample for optimum
solution
Fig. 18 Comparison of the effect of different lasers and machining
methods on HAZ (CW means continuous wave)
TEA CO2 laser machining of CFRP composite Page 15 of 19 497
123
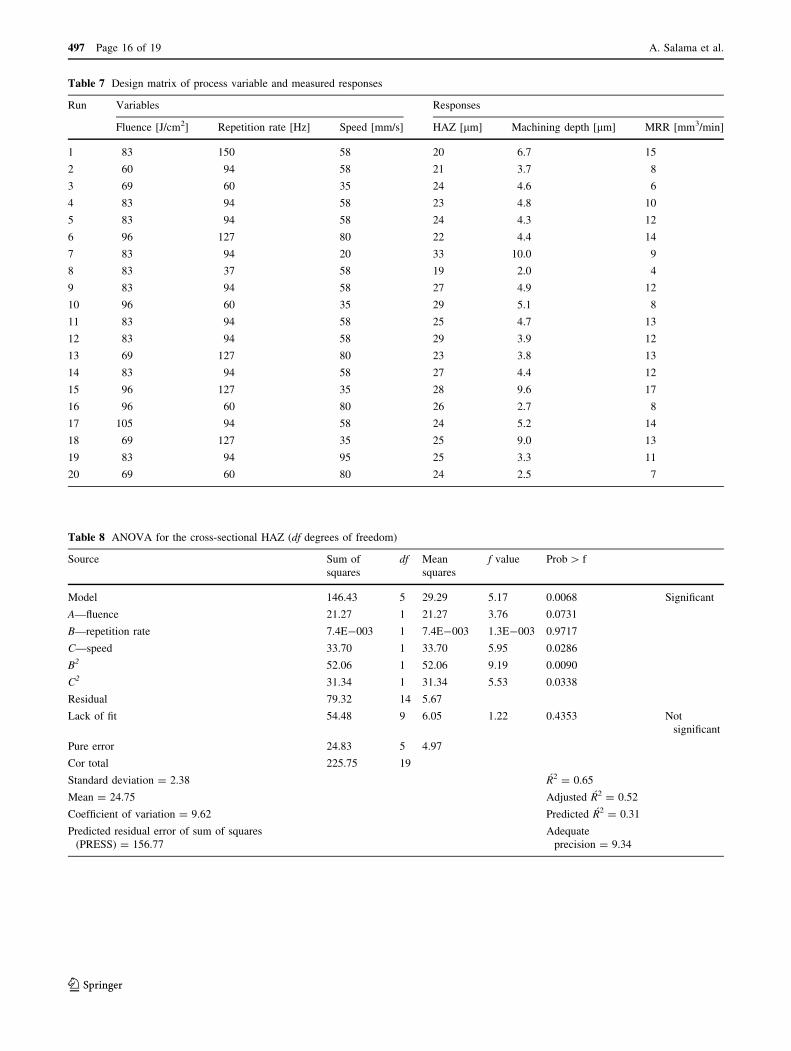
Table 7 Design matrix of process variable and measured responses
Run Variables Responses
Fluence [J/cm2] Repetition rate [Hz] Speed [mm/s] HAZ [lm] Machining depth [lm] MRR [mm3/min]
1 83 150 58 20 6.7 15
2 60 94 58 21 3.7 8
3 69 60 35 24 4.6 6
4 83 94 58 23 4.8 10
5 83 94 58 24 4.3 12
6 96 127 80 22 4.4 14
7 83 94 20 33 10.0 9
8 83 37 58 19 2.0 4
9 83 94 58 27 4.9 12
10 96 60 35 29 5.1 8
11 83 94 58 25 4.7 13
12 83 94 58 29 3.9 12
13 69 127 80 23 3.8 13
14 83 94 58 27 4.4 12
15 96 127 35 28 9.6 17
16 96 60 80 26 2.7 8
17 105 94 58 24 5.2 14
18 69 127 35 25 9.0 13
19 83 94 95 25 3.3 11
20 69 60 80 24 2.5 7
Table 8 ANOVA for the cross-sectional HAZ (df degrees of freedom)
Source Sum of
squares
df Mean
squares
f value Prob[ f
Model 146.43 5 29.29 5.17 0.0068 Significant
A—fluence 21.27 1 21.27 3.76 0.0731
B—repetition rate 7.4E-003 1 7.4E-003 1.3E-003 0.9717
C—speed 33.70 1 33.70 5.95 0.0286
B2 52.06 1 52.06 9.19 0.0090
C2 31.34 1 31.34 5.53 0.0338
Residual 79.32 14 5.67
Lack of fit 54.48 9 6.05 1.22 0.4353 Not
significant
Pure error 24.83 5 4.97
Cor total 225.75 19
Standard deviation = 2.38 R2 = 0.65
Mean = 24.75 Adjusted R2 = 0.52
Coefficient of variation = 9.62 Predicted R2 = 0.31
Predicted residual error of sum of squares
(PRESS) = 156.77
Adequate
precision = 9.34
497 Page 16 of 19 A. Salama et al.
123

Table 9 ANOVA for the machining depth
Source Sum of
squares
df Mean
squares
f value Prob[ f
Model 89.44 6 14.91 205.78 \0.0001 Significant
A—fluence 2.62 1 2.62 36.22 \0.0001
B—repetition rate 22.95 1 22.95 316.82 \0.0001
C—speed 52.08 1 52.08 718.83 \0.0001
AC 0.72 1 0.72 9.94 0.0076
BC 2.00 1 2.00 27.61 0.0002
C2 9.07 1 9.07 125.24 \0.0001
Residual 0.94 13 0.07
Lack of fit 0.24 8 0.03 0.22 0.9722 Not
significant
Pure error 0.70 5 0.14
Cor total 90.39 19
Standard deviation = 0.27 R2 = 0.99
Mean = 4.99 Adjusted R2 = 0.98
Coefficient of variation = 5.40 Predicted R2 = 0.98
Predicted residual error of sum of squares
(PRESS) = 1.59
Adequate
precision = 48.28
Table 10 ANOVA for the material removal rate
Source Sum of
squares
df Mean
squares
f value Prob[ f
Model 182.29 2 91.14 60.74 \0.0001 Significant
A—fluence 23.96 1 23.96 15.97 0.0009
B—repetition rate 158.33 1 158.33 105.51 \0.0001
Residual 25.51 17 1.50
Lack of fit 20.68 12 1.72 1.78 0.2157 Not
significant
Pure error 4.83 5 0.97
Cor total 207.80 19
Standard deviation = 1.22 R2 = 0.88
Mean = 10.90 Adjusted R2 = 0.86
Coefficient of variation = 11.24 Predicted R2 = 0.83
Predicted residual error of sum of squares
(PRESS) = 34.86
Adequate
precision = 24.14
TEA CO2 laser machining of CFRP composite Page 17 of 19 497
123

Internally Studentized Residuals
Nor
mal
% P
roba
bilit
y
Normal Plot of Residuals
-1.49 -0.56 0.37 1.30 2.23
1
510
2030
50
7080
9095
99
22
Predicted
Inte
rnal
ly S
tude
ntiz
ed R
esid
uals
Residuals vs. Predicted
-3.00
-1.50
0.00
1.50
3.00
1.70 3.73 5.75 7.78 9.80
(b)
Internally Studentized Residuals
Nor
mal
% P
roba
bilit
y
Normal Plot of Residuals
-1.97 -1.03 -0.10 0.84 1.77
1
510
2030
50
7080
9095
99
22
Predicted
Inte
rnal
ly S
tude
ntiz
ed R
esid
uals
Residuals vs. Predicted
-3.0
-1.5
0.0
1.5
3.0
19.65 22.70 25.74 28.79 31.83
(a)
4444
Predicted
Inte
rnal
ly S
tude
ntiz
ed R
esid
uals
Residuals vs. Predicted
-3.00
-1.50
0.00
1.50
3.00
5.17 8.04 10.90 13.76 16.63
Internally Studentized Residuals
Nor
mal
% P
roba
bilit
y
Normal Plot of Residuals
-1.61 -0.78 0.05 0.88 1.71
1
510
2030
50
7080
9095
99
(c)
497 Page 18 of 19 A. Salama et al.
123
References
1. K.T. Voisey, S. Fouquet, D. Roy, T.W. Clyne, Opt. Laser. Eng.
44, 1185 (2006)
2. J. Mathew, G.L. Goswami, N. Ramakrishnan, N.K. Naik, J.
Mater. Process. Technol. 89–90, 198 (1999)
3. R. Negarestani, L. Li, H.K. Sezer, D. Whitehead, J. Methven, Int.
J. Adv. Manuf. Technol. 49, 553 (2010)
4. J.P. Davim, P. Reis, Compos. Struct. 59, 481 (2003)
5. D. Kalla, J. Sheikh-Ahmad, J. Twomey, Int. J. Mach. Tool Manu.
50, 882 (2010)
6. I.S. Shyha, D.K. Aspinwall, S.L. Soo, S. Bradley, INT. J. Mach.
Tool Manu. 49, 1008 (2009)
7. Z.L. Li, P.L. Chu, H.Y. Zheng, G.C. Lim, L. Li, S. Marimuthu, R.
Negarestani, M. Sheikh, P. Mativenga, in Advances in Laser
Materials Processing, ed. by J. Lawrence, J. Pou, D.K.Y. Low, E.
Toyserkani (Woodhead Publishing, Sawston, 2010), pp. 136–177
8. E. Uhlmann, G. Spur, H. Hocheng, S. Liebelt, C.T. Pan, Int.
J. Mach. Tool Manuf. 39, 639 (1999)
9. C.T. Pan, H. Hocheng, Compos. Part A Appl. 32, 1657 (2001)
10. R. Negarestani, M. Sundar, M. Sheikh, P. Mativenga, L. Li, Z. Li,
P. Chu, C. Khin, H. Zheng, G. Lim, Proc. Inst. Mech. Eng. Pt.
B J. Eng. Manuf. 224, 1017 (2010)
11. K.A. Fenoughty, A. Jawaid, I.R. Pashby, J. Mater. Process.
Technol. 42, 391 (1994)
12. A. Beaulieu, Appl. Phys. Lett. 16, 504 (1970)
13. J.F. Ready, D.F. Farson, T. Feeley, LIA Handbook of Laser
Materials Processing (Laser Institute of America, Orlando, 2001)
14. M. Forrer, M. Frenz, V. Romano, H. Altermatt, H. Weber, A.
Silenok, M. Istomyn, V. Konov, Appl. Phys. B 56, 104 (1993)
15. P. Dyer, I. Waldeck, G. Roberts, J. Phys. D Appl. Phys. 30, L19(1997)
16. M.S. Trtica, B.M. Gakovic, T.M. Nenadovic, M.M. Mitrovic,
Appl. Surf. Sci. 177, 48 (2001)
17. A. Tsunemi, K. Hagiwara, N. Saito, K. Nagasaka, Y. Miyamoto,
O. Suto, H. Tashiro, Appl. Phys. A Mater. 63, 435 (1996)
18. A. Forbes, L.R. Botha, N. Du Preez, T.E. Drake, S. Afr. J. Sci.
102, 329 (2006)
19. D. Herzog, P. Jaeschke, O. Meier, H. Haferkamp, Int. J. Mach.
Tool Manu. 48, 1464 (2008)
20. Z. Li, H. Zheng, G. Lim, P. Chu, L. Li, Compos. Part A Appl. Sci.
41, 1403 (2010)
21. R. Negarestani, L. Li, in Machining Technology for Composite
Materials, ed. by H. Hocheng (Woodhead Publishing, Sawston,
2012), pp. 288–308
22. A. Riveiro, F. Quintero, F. Lusquinos, J. del Val, R. Comesana,
M. Boutinguiza, J. Pou, Compos. Part A Appl. Sci. 43, 1400(2012)
23. C. Leone, S. Genna, V. Tagliaferri, Opt. Laser. Eng. 53, 43
(2014)
24. R. Negarestani, L. Li, Proc. Inst. Mech. Eng. Pt. B J. Eng. Manuf.
227, 1755 (2013)
25. J. Finger, M. Weinand, D. Wortmann, J. Laser Appl. 25, 042007(2013)
26. J.C. Hernandez-Castaneda, H.K. Sezer, L. Li, Opt. Laser. Eng.
49, 1139 (2011)
27. A. Ghosal, A. Manna, Opt. Laser Tech. 46, 67 (2013)
28. A.S. Elmesalamy, L. Li, J.A. Francis, H.K. Sezer, Int. J. Adv.
Manuf. Technol. 68, 1 (2013)
29. T.A. El-Taweel, A.M. Abdel-Maaboud, B.S. Azzam, A.E.
Mohammad, Int. J. Adv. Manuf. Technol. 40, 907 (2009)
30. M.J.J. Schmidt, D.K.Y. Low, L. Li, Appl. Surf. Sci. 186, 271(2002)
31. S. Leigh, K. Sezer, L. Li, C. Grafton-Reed, M. Cuttell, Int.
J. Adv. Manuf. Technol. 43, 1094 (2009)
32. R. Biswas, A.S. Kuar, S. Sarkar, S. Mitra, Opt. Laser Technol. 42,23 (2010)
33. J.C. Hernandez-Castaneda, H.K. Sezer, L. Li, Proc. Inst. Mech.
Eng. Part B J. Eng. Manuf. 223, 775 (2009)
34. K.C. Yung, S.M. Mei, T.M. Yue, J. Mater. Process. Technol. 122,278 (2002)
35. C.-H. Li, M.-J. Tsai, C.-D. Yang, Opt. Laser Technol. 39, 786(2007)
36. A.A. Cenna, P. Mathew, Int. J. Mach. Tools Manuf. 37, 723(1997)
37. F.A. Al-Sulaiman, B.S. Yilbas, M. Ahsan, J. Mater. Process.
Technol. 173, 345 (2006)
38. J. Stock, M.F. Zaeh, M. Conrad, Phys. Procedia 39, 161 (2012)
39. I. Shyha, Procedia Eng. 63, 931 (2013)
40. T. Sumiyoshi, Y. Ninomiya, H. Ogasawara, M. Obara, H.
Tanaka, Appl. Phys. A Mater. 58, 475 (1994)
41. J. Morrison, T. Tessier, B. Gu, Circuit World 21, 24 (1994)
bFig. 19 Diagnostic plots of normal plot of residuals and residual
versus predicted values for: a cross-sectional HAZ, b machining
depth and c MRR
TEA CO2 laser machining of CFRP composite Page 19 of 19 497
123