te of analysis for ; oreas 7p batch 2 ; gold reference
TRANSCRIPT

Template: BUP-70-10-01.docx - 1.0 (Aprv:[1.0] on:[12/07/2014])
Project: COA-1136-OREAS520
Section: 1, Page: 1 of 18
Printed: 17-March-2016
ORE RESEARCH & EXPLORATION P/L ABN 28 006 859 856
37A Hosie Street · Bayswater North · VIC 3153 · AUSTRALIA
61 3 9729 0333 61 3 9729 8338
[email protected] www.ore.com.au
CERTIFICATE OF ANALYSIS FOR
IRON OXIDE COPPER-GOLD ORE
CERTIFIED REFERENCE MATERIAL
OREAS 520
Summary Statistics for Key Analytes (see Table 1 for 156 additional certified values).
Constituent (ppm) Certified
1SD 95% Confidence Limits 95% Tolerance Limits
Value Low High Low High
Pb Fire Assay
Au, Gold (ppm) 0.176 0.008 0.174 0.178 0.173* 0.179*
Aqua Regia Digestion
Au, Gold (ppm) 0.169 0.010 0.165 0.173 0.165† 0.172
†
4-Acid Digestion
Co, Cobalt (ppm) 203 6 200 205 198 207
Cu, Copper (wt.%) 0.293 0.008 0.290 0.296 0.287 0.299
Infrared Combustion
S, Sulphur (wt.%) 1.11 0.034 1.09 1.12 1.08 1.13
*Gold Tolerance Limits for typical 30g fire assay charge weight determined from 20 x 85mg NAA results and the Sampling Constant (Ingamells & Switzer, 1973); †Gold Tolerance Limits for typical 25g aqua regia sample weight determined as above;
Please note: intervals may appear asymmetric due to rounding.
The homogeneity of OREAS 520 is of a level such that negligible sampling error exists for a conventional fire assay, peroxide fusion, 4-acid digestion, 3-acid digestion, aqua regia digestion, infrared combustion or pycnometry determination.

COA-1136-OREAS520.docx Page: 2 of 18
INTRODUCTION OREAS reference materials are intended to provide a low cost method of evaluating and improving the quality of analysis of geological samples. To the geologist they provide a means of implementing quality control in analytical data sets generated in exploration from the grass roots level through to prospect evaluation, and in grade control at mining operations. To the analyst they provide an effective means of calibrating analytical equipment, assessing new techniques and routinely monitoring in-house procedures.
SOURCE MATERIALS
Certified Reference Material (CRM) OREAS 520 was prepared from a blend of iron oxide copper-gold ore and magnetite-bearing waste rock (altered, porphyritic, intermediate volcanic rock). The mineralisation is hosted by a breccia comprising strongly altered and replaced felsic volcanic fragments in a matrix largely composed of magnetite, calcite, pyrite, biotite, chalcopyrite, K feldspar titanite and quartz. Accessory minerals include garnet, barite, molybdenite, fluorite, amphibole, apatite, monazite, arsenopyrite, a LREE fluorcarbonate, galena, cobaltite, sphalerite, scheelite, uraninite and tourmaline. Copper occurs as native copper, bornite and chalcopyrite. Gold occurs mainly in the molecular framework of the chalcopyrite. Significant levels of cobalt, molybdenum, rare earth elements and low levels of uranium are also present. The ore and waste materials were sourced from the Ernest Henry Mine located about 38 kilometres north-east of Cloncurry in north-west Queensland.
COMMINUTION AND HOMOGENISATION PROCEDURES
The material constituting OREAS 520 was prepared in the following manner:
drying to constant mass at 105°C;
crushing and milling of the ore material to 100% minus 35 microns;
crushing and milling of the barren material to 99% minus 75 microns;
blending in appropriate proportions to achieve the desired grades;
packaging in 60g and 100g units sealed under nitrogen in laminated foil pouches and 500g units in plastic jars.
ANALYTICAL PROGRAM Twenty six commercial analytical laboratories participated in the program to certify the 161 analytes reported in Table 1. The following methods were employed:
Gold via 25-50g fire assay with AAS (18 labs) or ICP-OES (6 labs) finish;
Gold via 15-40g aqua regia digestion with ICP-MS (12 labs) or AAS (5 labs) finish;
Instrumental neutron activation analysis (INAA) for Au on 85mg subsamples to confirm homogeneity (1 lab);
Peroxide fusion for full elemental suite ICP-OES and ICP-MS finishes (up to 19 laboratories depending on the element);

COA-1136-OREAS520.docx Page: 3 of 18
4-Acid digestion (HF-HNO3-HClO4-HCl) for full elemental suite ICP-OES and ICP-MS finishes (up to 22 laboratories depending on the element; one lab used an AAS finish for Cu only);
3-Acid digestion (HNO3-HClO4-HCl) for Ag, As, Co, Cu, Fe, Mo and S with ICP-OES or AAS finishes (up to 16 laboratories depending on the element; one lab used an ICP-MS finish for Ag, As and Mo);
Aqua regia digestion (see note below) for full elemental suite ICP-OES and ICP-MS finishes (up to 14 laboratories depending on the element; some laboratories used an AAS finish for certain elements i.e. Ag, As, Co, Cu, Fe and Mo);
S by IR combustion furnace (21 labs);
Specific gravity by gas (11 labs) or liquid (5 labs) pycnometry.
It is important to note that in the analytical industry there is no standardisation of the aqua regia digestion process. Aqua regia is a partial empirical digest and differences in recoveries for various analytes are commonplace. These are caused by variations in the digest conditions which can include the ratio of nitric to hydrochloric acids, acid strength, temperatures, leach times and secondary digestions. Recoveries for sulphide-hosted base metal sulphides approach total values, however, other analytes, in particular the lithophile elements, show greater sensitivity to method parameters. This can result in lack of consensus in an inter-laboratory certification program for these elements. The approach applied here is to report certified values in those instances where reasonable agreement exists amongst a majority of participating laboratories. The results of specific laboratories may differ significantly from the certified values, but will, nonetheless, be valid and reproducible in the context of the specifics of the aqua regia method in use. Users of this reference material should, therefore, be mindful of this limitation when applying the certified values in a quality control program.
For the round robin program twenty 1kg lot samples were taken at predetermined intervals during the bagging stage, immediately following final blending and are considered representative of the entire batch. The six samples received by each laboratory were obtained by taking two 110g scoop splits from each of three separate 1kg lots. This format enabled nested ANOVA treatment of the results to evaluate homogeneity, i.e. to ascertain whether between-unit variance is greater than within-unit variance. Table 1 presents the 161 certified values together with their associated 1SD’s, 95% confidence and tolerance limits and Table 2 shows 34 indicative values. Table 3 shows the gold instrumental neutron activation analysis (INAA) results for twenty 85mg subsamples determined by the Australian Nuclear Science & Technology Organisation (ANSTO) located in Lucas Heights, NSW, Australia. Table 4 provides performance gate intervals for the certified values of each method group based on their pooled 1SD’s. Tabulated results of all elements together with uncorrected means, medians, standard deviations, relative standard deviations and per cent deviation of lab means from the corrected mean of
means (PDM3) are presented in the detailed certification data for this CRM (OREAS 520
DataPack.xlsx).
STATISTICAL ANALYSIS
Certified Values, Confidence Limits, Standard Deviations and Tolerance Limits (Table 1) have been determined for each analytical method following the removal of individual, laboratory dataset (batch) and 3SD outliers (single iteration). For individual outliers within a laboratory batch the z-score test is used in combination with a second
COA-1136-OREAS520.docx Page: 4 of 18
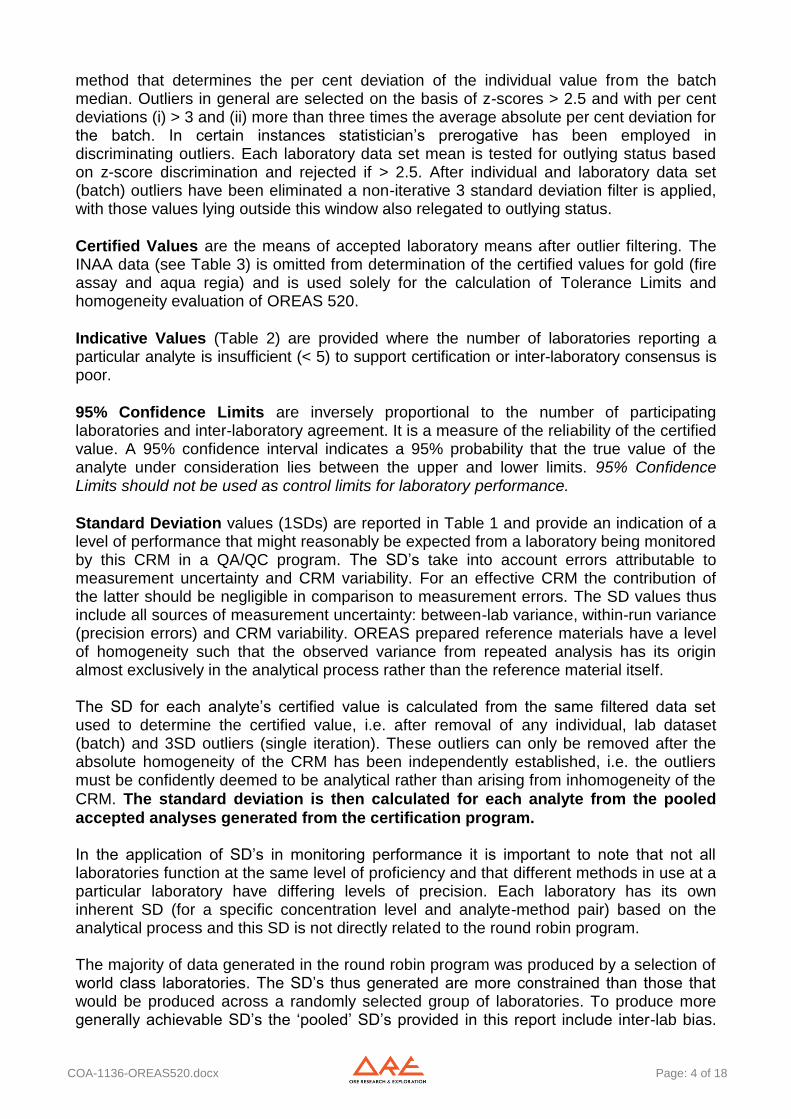
method that determines the per cent deviation of the individual value from the batch median. Outliers in general are selected on the basis of z-scores > 2.5 and with per cent deviations (i) > 3 and (ii) more than three times the average absolute per cent deviation for the batch. In certain instances statistician’s prerogative has been employed in discriminating outliers. Each laboratory data set mean is tested for outlying status based on z-score discrimination and rejected if > 2.5. After individual and laboratory data set (batch) outliers have been eliminated a non-iterative 3 standard deviation filter is applied, with those values lying outside this window also relegated to outlying status.
Certified Values are the means of accepted laboratory means after outlier filtering. The INAA data (see Table 3) is omitted from determination of the certified values for gold (fire assay and aqua regia) and is used solely for the calculation of Tolerance Limits and homogeneity evaluation of OREAS 520.
Indicative Values (Table 2) are provided where the number of laboratories reporting a particular analyte is insufficient (< 5) to support certification or inter-laboratory consensus is poor.
95% Confidence Limits are inversely proportional to the number of participating laboratories and inter-laboratory agreement. It is a measure of the reliability of the certified value. A 95% confidence interval indicates a 95% probability that the true value of the analyte under consideration lies between the upper and lower limits. 95% Confidence Limits should not be used as control limits for laboratory performance.
Standard Deviation values (1SDs) are reported in Table 1 and provide an indication of a level of performance that might reasonably be expected from a laboratory being monitored by this CRM in a QA/QC program. The SD’s take into account errors attributable to measurement uncertainty and CRM variability. For an effective CRM the contribution of the latter should be negligible in comparison to measurement errors. The SD values thus include all sources of measurement uncertainty: between-lab variance, within-run variance (precision errors) and CRM variability. OREAS prepared reference materials have a level of homogeneity such that the observed variance from repeated analysis has its origin almost exclusively in the analytical process rather than the reference material itself. The SD for each analyte’s certified value is calculated from the same filtered data set used to determine the certified value, i.e. after removal of any individual, lab dataset (batch) and 3SD outliers (single iteration). These outliers can only be removed after the absolute homogeneity of the CRM has been independently established, i.e. the outliers must be confidently deemed to be analytical rather than arising from inhomogeneity of the
CRM. The standard deviation is then calculated for each analyte from the pooled
accepted analyses generated from the certification program. In the application of SD’s in monitoring performance it is important to note that not all laboratories function at the same level of proficiency and that different methods in use at a particular laboratory have differing levels of precision. Each laboratory has its own inherent SD (for a specific concentration level and analyte-method pair) based on the analytical process and this SD is not directly related to the round robin program. The majority of data generated in the round robin program was produced by a selection of world class laboratories. The SD’s thus generated are more constrained than those that would be produced across a randomly selected group of laboratories. To produce more generally achievable SD’s the ‘pooled’ SD’s provided in this report include inter-lab bias.

COA-1136-OREAS520.docx Page: 5 of 18
This ‘one size fits all’ approach may require revision at the discretion of the QC manager concerned following careful scrutiny of QC control charts.
Table 4 shows Performance Gates calculated for two and three standard deviations. As a guide these intervals may be regarded as warning or rejection for multiple 2SD outliers, or rejection for individual 3SD outliers in QC monitoring, although their precise application should be at the discretion of the QC manager concerned. A second method utilises a 5% window calculated directly from the certified value. Standard deviation is also shown in relative percent for one, two and three relative standard deviations (1RSD, 2RSD and 3RSD) to facilitate an appreciation of the magnitude of these numbers and a comparison with the 5% window. Caution should be exercised when concentration levels approach lower limits of detection of the analytical methods employed as performance gates calculated from standard deviations tend to be excessively wide whereas those determined by the 5% method are too narrow.
Tolerance Limits (ISO Guide 3207) were determined using an analysis of precision errors method and are considered a conservative estimate of true homogeneity. The meaning of tolerance limits may be illustrated for copper via 4-acid digestion where 99% of the time (1-α=0.99) at least 95% of subsamples (ρ=0.95) will have concentrations lying between 0.287 and 0.299 wt.%. Put more precisely, this means that if the same number of subsamples were taken and analysed in the same manner repeatedly, 99% of the tolerance intervals so constructed would cover at least 95% of the total population, and 1% of the tolerance intervals would cover less than 95% of the total population (ISO Guide 35). For gold, tolerance can be determined by INAA using the reduced analytical subsample method which utilises the known relationship between standard deviation and analytical subsample weight (Ingamells and Switzer, 1973). In this approach the latter parameter is substantially reduced to a point where most of the variability in replicate assays is due to inhomogeneity of the reference material and measurement error becomes negligible. In this instance very small subsample weights of 85 milligrams were employed and the 1RSD of 0.58% at a 30g charge weight (10.83% at 85mg weights) confirms the high level of gold homogeneity in OREAS 520 (see Table 3 below).
The homogeneity of OREAS 520 has also been evaluated in a nested ANOVA of the round robin program. Each of the twenty-six round robin laboratories received six samples per CRM and these samples were made up of paired samples from three different, non-adjacent sampling intervals. The purpose of the ANOVA evaluation is to test that no statistically significant difference exists in the variance between-units to that of the variance within-units. This allows an assessment of homogeneity across the entire prepared batch of OREAS 520. The test was performed using the following parameters:
Significance Level α = P (type I error) = 0.05;
Null Hypothesis, H0: Between-unit variance is no greater than within-unit variance (reject H0 if p-value < 0.05);
Alternative Hypothesis, H1: Between-unit variance is greater than within-unit variance.
P-values are a measure of probability where values less than 0.05 indicate a greater than 95% probability that the observed differences in within-unit and between-unit variances are real. The dataset was filtered for both individual and laboratory data set (batch) outliers prior

COA-1136-OREAS520.docx Page: 6 of 18
to the calculation of the p-value. This process derived no significant p-values for all 161 certified values and the Null Hypothesis is retained. It is important to note that ANOVA is not an absolute measure of homogeneity. Rather, it establishes whether or not the analytes are distributed in a similar manner throughout the packaging run of OREAS 520 and whether the variance between two subsamples from the same unit is statistically distinguishable to the variance from two subsamples taken from any two separate units. A reference material therefore, can possess poor absolute homogeneity yet still pass a relative homogeneity test if the within-unit heterogeneity is large and similar across all units. Based on the statistical analysis of the results of the inter-laboratory certification program it can be concluded that OREAS 520 is fit-for-purpose as a certified reference material (see ‘Intended Use’ below). Furthermore, the homogeneity of OREAS 520 is of a level such that negligible sampling error exists for a conventional fire assay, peroxide fusion, 4-acid digestion, 3-acid digestion, aqua regia digestion, infrared combustion or pycnometry determination.
PARTICIPATING LABORATORIES
1. Actlabs, Ancaster, Ontario, Canada
2. ALS, Brisbane, QLD, Australia
3. ALS, Lima, Peru
4. ALS, Loughrea, Galway, Ireland
5. ALS, Perth, WA, Australia
6. ALS, Vancouver, BC, Canada
7. ANSTO, Lucas Heights, NSW, Australia
8. Bureau Veritas Commodities Canada Ltd, Vancouver, BC, Canada
9. Bureau Veritas Geoanalytical, Adelaide, SA, Australia
10. Bureau Veritas Geoanalytical, Perth, WA, Australia
11. Bureau Veritas Minerals, Santiago, Chile 12. Geoanalitica, Antofagasta, Chile
13. Inspectorate (BV), Lima, Peru
14. Intertek Genalysis, Adelaide, SA, Australia
15. Intertek Genalysis, Perth, WA, Australia
16. Intertek Testing Services, Cupang, Muntinlupa, Philippines
17. MinAnalytical Services, Perth, WA, Australia
18. Mineracao Mine Lab, Paracatu, Minas Gerais, Brazil
19. PT Geoservices Ltd, Cikarang, Jakarta Raya, Indonesia
20. PT Intertek Utama Services, Jakarta Timur, DKI Jakarta, Indonesia 21. SGS Australia Mineral Services, Perth, WA, Australia
22. SGS Canada Inc., Vancouver, BC, Canada
23. SGS CIMM T & S, Antofagasta, Chile
24. SGS del Peru, Lima, Peru
25. SGS Lakefield Research Ltd, Lakefield, Ontario, Canada
26. SGS Mineral Services, Townsville, QLD, Australia
27. Shiva Analyticals Ltd, Bangalore North, Karnataka, India

COA-1136-OREAS520.docx Page: 7 of 18
Table 1. Certified Values, SD's, 95% Confidence and Tolerance Limits for OREAS 520.
Constituent Certified
1SD 95% Confidence Limits 95% Tolerance Limits
Value Low High Low High
Pb Fire Assay
Au, Gold (ppm) 0.176 0.008 0.174 0.178 0.173* 0.179*
Peroxide Fusion ICP
Al, Aluminium (wt.%) 5.68 0.113 5.62 5.73 5.54 5.81
As, Arsenic (ppm) 156 23 149 164 151 161
Ba, Barium (ppm) 8058 425 7772 8344 7925 8192
Bi, Bismuth (ppm) 3.02 0.229 2.84 3.19 2.77 3.26
Ca, Calcium (wt.%) 4.21 0.200 4.11 4.31 4.11 4.31
Ce, Cerium (ppm) 85 4.0 83 87 82 88
Co, Cobalt (ppm) 207 13 201 213 201 213
Cr, Chromium (ppm) 44.2 6.8 39.3 49.1 40.0 48.5
Cs, Cesium (ppm) 0.87 0.068 0.84 0.90 0.79 0.95
Cu, Copper (wt.%) 0.293 0.005 0.290 0.295 0.286 0.299
Dy, Dysprosium (ppm) 3.99 0.230 3.85 4.13 3.78 4.21
Er, Erbium (ppm) 2.42 0.173 2.31 2.54 2.33 2.52
Fe, Iron (wt.%) 16.84 0.369 16.68 17.00 16.51 17.17
Ga, Gallium (ppm) 19.9 1.31 19.0 20.8 19.2 20.6
Gd, Gadolinium (ppm) 4.36 0.298 4.14 4.57 4.09 4.62
Hf, Hafnium (ppm) 3.78 0.39 3.45 4.11 IND IND
Ho, Holmium (ppm) 0.83 0.059 0.79 0.87 0.79 0.87
K, Potassium (wt.%) 3.52 0.154 3.43 3.60 3.42 3.61
La, Lanthanum (ppm) 90 3.2 88 92 87 92
Li, Lithium (ppm) 18.0 3.1 16.0 20.0 16.8 19.2
Lu, Lutetium (ppm) 0.38 0.023 0.36 0.40 0.34 0.41
Mg, Magnesium (wt.%) 1.22 0.032 1.21 1.23 1.19 1.25
Mn, Manganese (wt.%) 0.252 0.017 0.246 0.258 0.247 0.257
Mo, Molybdenum (ppm) 64 5.0 61 68 62 67
Nb, Niobium (ppm) 6.55 0.93 6.14 6.96 6.26 6.84
Nd, Neodymium (ppm) 23.2 1.06 22.4 23.9 21.8 24.5
Ni, Nickel (ppm) 82 9 79 85 78 87
P, Phosphorus (wt.%) 0.076 0.006 0.072 0.079 0.072 0.080
Pr, Praseodymium (ppm) 7.28 0.306 7.07 7.48 6.95 7.60
Rb, Rubidium (ppm) 114 4 112 116 110 118
S, Sulphur (wt.%) 1.14 0.028 1.12 1.15 1.10 1.17
Sb, Antimony (ppm) 3.35 0.328 3.15 3.56 2.97 3.74
Sc, Scandium (ppm) 16.6 1.8 14.6 18.6 IND IND
Si, Silicon (wt.%) 19.72 0.630 19.30 20.13 19.17 20.27
Sm, Samarium (ppm) 4.32 0.287 4.11 4.52 4.08 4.55
Sr, Strontium (ppm) 108 4 106 111 102 114
Ta, Tantalum (ppm) 0.54 0.044 0.51 0.56 IND IND
Tb, Terbium (ppm) 0.65 0.059 0.60 0.69 0.59 0.70
Note: intervals may appear asymmetric due to rounding; *Gold Tolerance Limits for typical 30g fire assay charge weight determined from 20 x 85mg INAA results and the Sampling Constant (Ingamells & Switzer, 1973).

COA-1136-OREAS520.docx Page: 8 of 18
Table 1 continued.
Constituent Certified
1SD 95% Confidence Limits 95% Tolerance Limits
Value Low High Low High
Peroxide Fusion ICP continued
Th, Thorium (ppm) 10.1 0.42 9.9 10.3 9.7 10.5
Ti, Titanium (wt.%) 0.542 0.012 0.538 0.546 0.529 0.555
Tm, Thulium (ppm) 0.37 0.030 0.36 0.39 0.36 0.39
U, Uranium (ppm) 18.1 1.01 17.5 18.8 17.6 18.6
V, Vanadium (ppm) 280 20 266 295 272 288
W, Tungsten (ppm) 44.5 4.32 41.1 47.9 42.8 46.3
Y, Yttrium (ppm) 22.4 1.07 21.7 23.1 21.7 23.0
Yb, Ytterbium (ppm) 2.40 0.164 2.30 2.50 2.26 2.54
Zr, Zirconium (ppm) 141 22 117 165 134 149
4-Acid Digestion
Ag, Silver (ppm) 0.450 0.045 0.429 0.471 0.420 0.480
Al, Aluminium (wt.%) 5.63 0.185 5.55 5.71 5.51 5.75
As, Arsenic (ppm) 153 10 149 158 150 157
Be, Beryllium (ppm) 1.06 0.12 1.01 1.11 1.01 1.12
Bi, Bismuth (ppm) 2.94 0.220 2.84 3.05 2.83 3.05
Ca, Calcium (wt.%) 4.10 0.162 4.03 4.16 4.02 4.17
Ce, Cerium (ppm) 86 5.0 84 88 84 88
Co, Cobalt (ppm) 203 6 200 205 198 207
Cr, Chromium (ppm) 36.4 3.16 34.9 37.9 34.5 38.3
Cs, Cesium (ppm) 0.80 0.063 0.76 0.83 0.77 0.83
Cu, Copper (wt.%) 0.293 0.008 0.290 0.296 0.287 0.299
Dy, Dysprosium (ppm) 3.66 0.285 3.45 3.86 3.51 3.80
Er, Erbium (ppm) 2.21 0.156 2.10 2.33 2.15 2.28
Eu, Europium (ppm) 1.29 0.092 1.22 1.37 1.24 1.35
Fe, Iron (wt.%) 16.43 0.922 15.98 16.88 16.16 16.70
Ga, Gallium (ppm) 18.7 0.90 18.2 19.1 18.1 19.2
Gd, Gadolinium (ppm) 4.08 0.41 3.78 4.38 3.95 4.21
Hf, Hafnium (ppm) 3.53 0.192 3.43 3.63 3.43 3.63
Ho, Holmium (ppm) 0.76 0.054 0.72 0.80 0.74 0.78
In, Indium (ppm) 0.11 0.01 0.10 0.12 0.10 0.11
K, Potassium (wt.%) 3.46 0.107 3.41 3.51 3.38 3.54
La, Lanthanum (ppm) 85 6.1 82 87 82 87
Li, Lithium (ppm) 16.9 1.40 16.3 17.6 16.2 17.7
Lu, Lutetium (ppm) 0.34 0.026 0.33 0.35 0.32 0.36
Mg, Magnesium (wt.%) 1.19 0.063 1.16 1.22 1.16 1.22
Mn, Manganese (wt.%) 0.242 0.013 0.236 0.247 0.237 0.247
Mo, Molybdenum (ppm) 65 3.8 63 67 63 67
Na, Sodium (wt.%) 1.35 0.077 1.31 1.39 1.32 1.38
Nb, Niobium (ppm) 5.68 0.405 5.46 5.89 5.44 5.91
Nd, Neodymium (ppm) 22.1 0.96 21.4 22.7 21.6 22.6
Ni, Nickel (ppm) 76 5.3 74 78 74 78
P, Phosphorus (wt.%) 0.074 0.004 0.072 0.076 0.072 0.076
Note: intervals may appear asymmetric due to rounding.

COA-1136-OREAS520.docx Page: 9 of 18
Table 1 continued.
Constituent Certified
1SD 95% Confidence Limits 95% Tolerance Limits
Value Low High Low High
4-Acid Digestion continued
Pb, Lead (ppm) 5.85 1.06 5.36 6.33 5.50 6.19
Pr, Praseodymium (ppm) 6.69 0.449 6.37 7.01 6.49 6.89
Rb, Rubidium (ppm) 111 2 110 112 108 115
Re, Rhenium (ppm) 0.031 0.003 0.030 0.031 0.027 0.034
S, Sulphur (wt.%) 1.01 0.085 0.97 1.05 0.99 1.04
Sb, Antimony (ppm) 3.21 0.216 3.11 3.31 3.08 3.34
Sc, Scandium (ppm) 17.0 1.27 16.4 17.6 16.4 17.6
Se, Selenium (ppm) 1.76 0.30 1.60 1.92 IND IND
Sm, Samarium (ppm) 4.02 0.293 3.81 4.22 3.87 4.16
Sn, Tin (ppm) 4.76 0.232 4.65 4.87 4.59 4.92
Sr, Strontium (ppm) 104 4 102 106 102 107
Ta, Tantalum (ppm) 0.47 0.07 0.44 0.51 0.44 0.50
Tb, Terbium (ppm) 0.64 0.050 0.61 0.67 0.61 0.66
Te, Tellurium (ppm) 0.36 0.04 0.34 0.38 0.32 0.40
Th, Thorium (ppm) 9.62 0.693 9.30 9.95 9.26 9.98
Ti, Titanium (wt.%) 0.445 0.041 0.427 0.463 0.432 0.459
Tl, Thallium (ppm) 0.26 0.03 0.25 0.28 0.25 0.28
Tm, Thulium (ppm) 0.31 0.031 0.29 0.34 0.30 0.33
U, Uranium (ppm) 17.9 1.28 17.2 18.5 17.4 18.4
V, Vanadium (ppm) 257 13 251 262 250 264
W, Tungsten (ppm) 43.8 3.80 42.0 45.5 42.5 45.1
Y, Yttrium (ppm) 20.8 1.00 20.4 21.2 20.3 21.4
Yb, Ytterbium (ppm) 2.20 0.129 2.12 2.27 2.12 2.27
Zn, Zinc (ppm) 22.7 1.90 21.7 23.7 21.5 23.9
Zr, Zirconium (ppm) 134 7 131 137 130 137
3-Acid Digestion (no HF)
Ag, Silver (ppm) < 0.5 IND IND IND IND IND
As, Arsenic (ppm) 151 12 144 158 146 156
Co, Cobalt (ppm) 199 10 194 205 197 202
Cu, Copper (wt.%) 0.292 0.006 0.288 0.295 0.287 0.296
Fe, Iron (wt.%) 16.96 0.458 16.70 17.22 16.62 17.30
Mo, Molybdenum (ppm) 60 2.7 58 62 58 62
S, Sulphur (wt.%) 1.07 0.049 1.04 1.10 1.05 1.10
Aqua Regia Digestion
Ag, Silver (ppm) 0.422 0.031 0.406 0.438 0.399 0.445
Al, Aluminium (wt.%) 1.56 0.050 1.53 1.59 1.53 1.59
As, Arsenic (ppm) 152 8 148 157 148 157
Au, Gold (ppm) 0.169 0.010 0.165 0.173 0.165† 0.172
†
Be, Beryllium (ppm) 0.54 0.07 0.48 0.60 0.46 0.63
Bi, Bismuth (ppm) 2.90 0.157 2.78 3.02 2.77 3.03
Note: intervals may appear asymmetric due to rounding; †Gold Tolerance Limits for typical 25g aqua regia
sample weight determined from 20 x 85mg INAA results and the Sampling Constant (Ingamells & Switzer, 1973).

COA-1136-OREAS520.docx Page: 10 of 18
Table 1 continued.
Constituent Certified
1SD 95% Confidence Limits 95% Tolerance Limits
Value Low High Low High
Aqua Regia Digestion continued
Ca, Calcium (wt.%) 3.84 0.154 3.73 3.94 3.76 3.92
Ce, Cerium (ppm) 79 3.2 77 82 77 81
Co, Cobalt (ppm) 196 12 189 204 193 200
Cr, Chromium (ppm) 37.4 1.93 36.1 38.7 36.2 38.6
Cs, Cesium (ppm) 0.57 0.041 0.53 0.60 0.55 0.58
Cu, Copper (wt.%) 0.296 0.009 0.290 0.301 0.289 0.302
Fe, Iron (wt.%) 15.74 0.877 15.21 16.28 15.42 16.07
Ga, Gallium (ppm) 13.7 0.65 13.2 14.2 13.2 14.2
Ge, Germanium (ppm) 0.25 0.04 0.20 0.29 IND IND
Hf, Hafnium (ppm) 0.81 0.13 0.69 0.92 0.77 0.84
In, Indium (ppm) 0.11 0.010 0.10 0.12 0.10 0.12
K, Potassium (wt.%) 0.506 0.015 0.495 0.516 0.492 0.520
La, Lanthanum (ppm) 83 4.1 80 86 81 85
Li, Lithium (ppm) 16.6 1.7 15.3 17.9 15.8 17.4
Lu, Lutetium (ppm) 0.20 0.016 0.18 0.22 0.19 0.21
Mg, Magnesium (wt.%) 1.14 0.056 1.10 1.18 1.12 1.17
Mn, Manganese (wt.%) 0.228 0.009 0.222 0.234 0.224 0.233
Mo, Molybdenum (ppm) 62 4.5 59 65 61 63
Na, Sodium (wt.%) 0.052 0.006 0.048 0.055 IND IND
Ni, Nickel (ppm) 73 1.7 72 74 71 75
P, Phosphorus (wt.%) 0.074 0.004 0.071 0.077 0.072 0.076
Pb, Lead (ppm) 5.22 0.64 4.69 5.75 4.87 5.57
Rb, Rubidium (ppm) 31.5 2.04 29.5 33.4 30.4 32.5
S, Sulphur (wt.%) 1.03 0.052 0.99 1.06 1.01 1.05
Sb, Antimony (ppm) 1.97 0.23 1.77 2.17 1.90 2.03
Sc, Scandium (ppm) 11.8 0.88 11.2 12.4 11.4 12.2
Se, Selenium (ppm) 1.73 0.28 1.54 1.92 IND IND
Sn, Tin (ppm) 3.42 0.111 3.32 3.51 3.26 3.57
Sr, Strontium (ppm) 36.0 2.34 34.4 37.7 35.0 37.1
Tb, Terbium (ppm) 0.50 0.028 0.46 0.54 0.49 0.51
Te, Tellurium (ppm) 0.33 0.04 0.30 0.36 0.30 0.36
Th, Thorium (ppm) 8.03 0.601 7.58 8.49 7.69 8.38
Ti, Titanium (wt.%) 0.135 0.018 0.123 0.148 0.131 0.140
Tl, Thallium (ppm) 0.090 0.010 0.081 0.098 IND IND
U, Uranium (ppm) 14.9 0.96 14.1 15.7 14.5 15.3
V, Vanadium (ppm) 247 14 237 258 241 254
W, Tungsten (ppm) 29.6 3.9 26.8 32.5 28.9 30.4
Y, Yttrium (ppm) 14.3 1.30 13.3 15.2 13.8 14.7
Yb, Ytterbium (ppm) 1.36 0.064 1.29 1.44 IND IND
Zn, Zinc (ppm) 20.7 1.63 19.8 21.5 19.6 21.8
Zr, Zirconium (ppm) 28.0 4.6 24.3 31.8 26.8 29.2
Note: intervals may appear asymmetric due to rounding.

COA-1136-OREAS520.docx Page: 11 of 18
Table 1 continued.
Constituent Certified
1SD 95% Confidence Limits 95% Tolerance Limits
Value Low High Low High
Infrared Combustion
S, Sulphur (wt.%) 1.11 0.034 1.09 1.12 1.08 1.13
Gas / Liquid Pycnometry
SG, Specific Gravity (Unity) 3.00 0.045 2.98 3.03 2.98 3.02
Note: intervals may appear asymmetric due to rounding.
Table 2. Indicative Values for OREAS 520.
Constituent Unit Value Constituent Unit Value Constituent Unit Value
Pb Fire Assay
Pd ppb < 5 Pt ppb 3
Peroxide Fusion ICP
Ag ppm < 1 Ge ppm 0.9 Te ppm < 1
B ppm 49 In ppm 0.2 Tl ppm < 0.5
Be ppm 1 Pb ppm 6.7 Zn ppm 25
Cd ppm < 0.2 Re ppm < 0.1
Eu ppm 2.2 Sn ppm 5.4
4-Acid Digestion
Cd ppm < 0.02 Ge ppm 0.3 Hg ppm 0.06
Aqua Regia Digestion
B ppm < 10 Gd ppm 3.5 Pr ppm 6.7
Cd ppm 0.02 Hg ppm 0.05 Re ppm 0.03
Dy ppm 2.9 Ho ppm 0.6 Sm ppm 3.6
Er ppm 1.6 Nb ppm 0.3 Ta ppm < 0.01
Eu ppm 1.2 Nd ppm 21 Tm ppm 0.2
Sulphuric Acid Leach (5%)
Cu wt.% 0.08
Table 3. Instrumental Neutron Activation Analysis of Au on 20 x 85mg subsamples of OREAS 520.
Replicate INAA
No 85mg
1 0.200
2 0.142
3 0.170
4 0.154
5 0.148
6 0.150
7 0.167
8 0.185
9 0.147
10 0.169
11 0.186
12 0.154
COA-1136-OREAS520.docx Page: 12 of 18
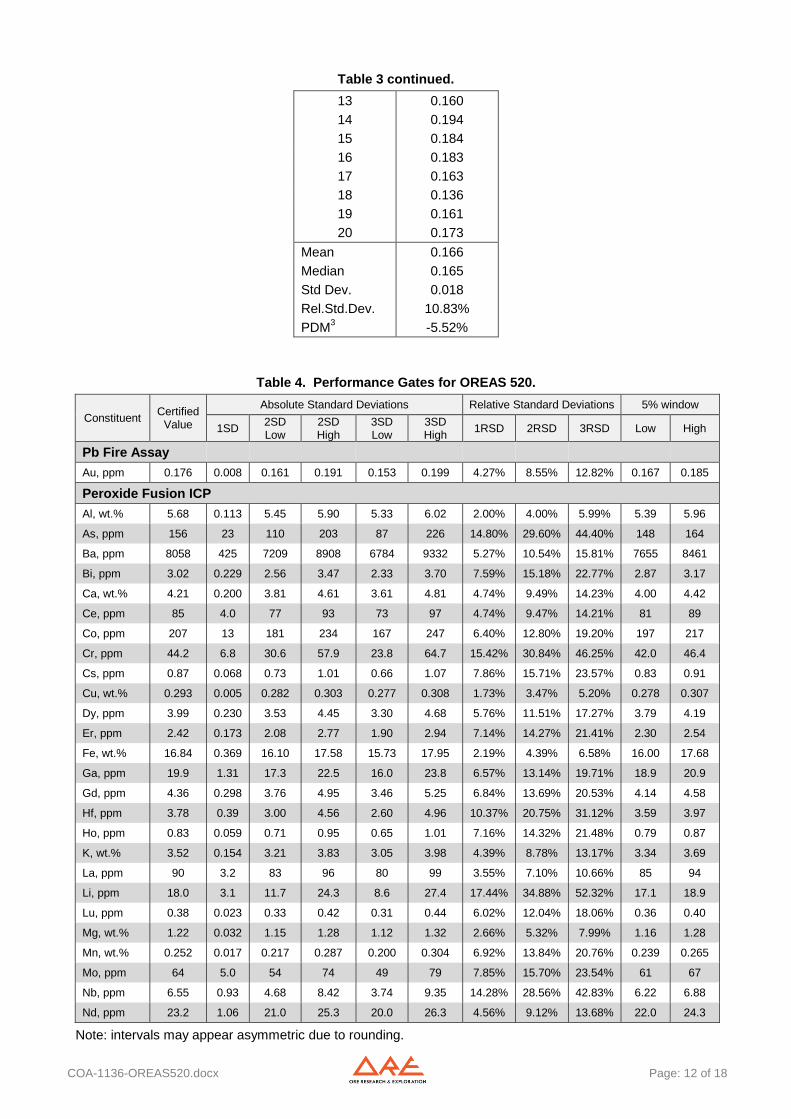
Table 3 continued.
13 0.160
14 0.194
15 0.184
16 0.183
17 0.163
18 0.136
19 0.161
20 0.173
Mean 0.166
Median 0.165
Std Dev. 0.018
Rel.Std.Dev. 10.83%
PDM3 -5.52%
Table 4. Performance Gates for OREAS 520.
Constituent Certified
Value
Absolute Standard Deviations Relative Standard Deviations 5% window
1SD 2SD Low
2SD High
3SD Low
3SD High
1RSD 2RSD 3RSD Low High
Pb Fire Assay
Au, ppm 0.176 0.008 0.161 0.191 0.153 0.199 4.27% 8.55% 12.82% 0.167 0.185
Peroxide Fusion ICP
Al, wt.% 5.68 0.113 5.45 5.90 5.33 6.02 2.00% 4.00% 5.99% 5.39 5.96
As, ppm 156 23 110 203 87 226 14.80% 29.60% 44.40% 148 164
Ba, ppm 8058 425 7209 8908 6784 9332 5.27% 10.54% 15.81% 7655 8461
Bi, ppm 3.02 0.229 2.56 3.47 2.33 3.70 7.59% 15.18% 22.77% 2.87 3.17
Ca, wt.% 4.21 0.200 3.81 4.61 3.61 4.81 4.74% 9.49% 14.23% 4.00 4.42
Ce, ppm 85 4.0 77 93 73 97 4.74% 9.47% 14.21% 81 89
Co, ppm 207 13 181 234 167 247 6.40% 12.80% 19.20% 197 217
Cr, ppm 44.2 6.8 30.6 57.9 23.8 64.7 15.42% 30.84% 46.25% 42.0 46.4
Cs, ppm 0.87 0.068 0.73 1.01 0.66 1.07 7.86% 15.71% 23.57% 0.83 0.91
Cu, wt.% 0.293 0.005 0.282 0.303 0.277 0.308 1.73% 3.47% 5.20% 0.278 0.307
Dy, ppm 3.99 0.230 3.53 4.45 3.30 4.68 5.76% 11.51% 17.27% 3.79 4.19
Er, ppm 2.42 0.173 2.08 2.77 1.90 2.94 7.14% 14.27% 21.41% 2.30 2.54
Fe, wt.% 16.84 0.369 16.10 17.58 15.73 17.95 2.19% 4.39% 6.58% 16.00 17.68
Ga, ppm 19.9 1.31 17.3 22.5 16.0 23.8 6.57% 13.14% 19.71% 18.9 20.9
Gd, ppm 4.36 0.298 3.76 4.95 3.46 5.25 6.84% 13.69% 20.53% 4.14 4.58
Hf, ppm 3.78 0.39 3.00 4.56 2.60 4.96 10.37% 20.75% 31.12% 3.59 3.97
Ho, ppm 0.83 0.059 0.71 0.95 0.65 1.01 7.16% 14.32% 21.48% 0.79 0.87
K, wt.% 3.52 0.154 3.21 3.83 3.05 3.98 4.39% 8.78% 13.17% 3.34 3.69
La, ppm 90 3.2 83 96 80 99 3.55% 7.10% 10.66% 85 94
Li, ppm 18.0 3.1 11.7 24.3 8.6 27.4 17.44% 34.88% 52.32% 17.1 18.9
Lu, ppm 0.38 0.023 0.33 0.42 0.31 0.44 6.02% 12.04% 18.06% 0.36 0.40
Mg, wt.% 1.22 0.032 1.15 1.28 1.12 1.32 2.66% 5.32% 7.99% 1.16 1.28
Mn, wt.% 0.252 0.017 0.217 0.287 0.200 0.304 6.92% 13.84% 20.76% 0.239 0.265
Mo, ppm 64 5.0 54 74 49 79 7.85% 15.70% 23.54% 61 67
Nb, ppm 6.55 0.93 4.68 8.42 3.74 9.35 14.28% 28.56% 42.83% 6.22 6.88
Nd, ppm 23.2 1.06 21.0 25.3 20.0 26.3 4.56% 9.12% 13.68% 22.0 24.3
Note: intervals may appear asymmetric due to rounding.

COA-1136-OREAS520.docx Page: 13 of 18
Table 4 continued.
Constituent Certified
Value
Absolute Standard Deviations Relative Standard Deviations 5% window
1SD 2SD Low
2SD High
3SD Low
3SD High
1RSD 2RSD 3RSD Low High
Peroxide Fusion ICP continued
Ni, ppm 82 9 65 100 56 108 10.51% 21.03% 31.54% 78 86
P, wt.% 0.076 0.006 0.064 0.088 0.057 0.094 8.07% 16.14% 24.21% 0.072 0.080
Pr, ppm 7.28 0.306 6.67 7.89 6.36 8.19 4.20% 8.40% 12.60% 6.91 7.64
Rb, ppm 114 4 107 122 103 125 3.22% 6.43% 9.65% 109 120
S, wt.% 1.14 0.028 1.08 1.19 1.05 1.22 2.45% 4.89% 7.34% 1.08 1.19
Sb, ppm 3.35 0.328 2.70 4.01 2.37 4.34 9.77% 19.53% 29.30% 3.19 3.52
Sc, ppm 16.6 1.8 12.9 20.3 11.1 22.1 11.09% 22.18% 33.27% 15.8 17.4
Si, wt.% 19.72 0.630 18.46 20.98 17.83 21.61 3.20% 6.39% 9.59% 18.73 20.70
Sm, ppm 4.32 0.287 3.74 4.89 3.45 5.18 6.66% 13.31% 19.97% 4.10 4.53
Sr, ppm 108 4 100 117 95 121 4.04% 8.08% 12.12% 103 114
Ta, ppm 0.54 0.044 0.45 0.63 0.41 0.67 8.09% 16.18% 24.27% 0.51 0.57
Tb, ppm 0.65 0.059 0.53 0.76 0.47 0.82 9.13% 18.26% 27.39% 0.61 0.68
Th, ppm 10.1 0.42 9.3 11.0 8.9 11.4 4.14% 8.29% 12.43% 9.6 10.6
Ti, wt.% 0.542 0.012 0.518 0.566 0.506 0.578 2.20% 4.40% 6.60% 0.515 0.569
Tm, ppm 0.37 0.030 0.31 0.43 0.28 0.47 8.15% 16.29% 24.44% 0.36 0.39
U, ppm 18.1 1.01 16.1 20.1 15.1 21.1 5.56% 11.13% 16.69% 17.2 19.0
V, ppm 280 20 240 320 220 340 7.15% 14.30% 21.46% 266 294
W, ppm 44.5 4.32 35.9 53.2 31.6 57.5 9.71% 19.42% 29.13% 42.3 46.8
Y, ppm 22.4 1.07 20.2 24.5 19.2 25.6 4.79% 9.58% 14.36% 21.3 23.5
Yb, ppm 2.40 0.164 2.07 2.72 1.91 2.89 6.83% 13.66% 20.49% 2.28 2.52
Zr, ppm 141 22 96 186 74 208 15.89% 31.79% 47.68% 134 148
4-Acid Digestion
Ag, ppm 0.450 0.045 0.360 0.540 0.315 0.585 10.00% 20.00% 30.01% 0.427 0.472
Al, wt.% 5.63 0.185 5.26 6.00 5.07 6.19 3.29% 6.59% 9.88% 5.35 5.91
As, ppm 153 10 134 173 124 182 6.38% 12.77% 19.15% 145 161
Be, ppm 1.06 0.12 0.82 1.30 0.71 1.42 11.20% 22.40% 33.60% 1.01 1.12
Bi, ppm 2.94 0.220 2.50 3.38 2.28 3.60 7.49% 14.98% 22.47% 2.79 3.09
Ca, wt.% 4.10 0.162 3.77 4.42 3.61 4.58 3.95% 7.91% 11.86% 3.89 4.30
Ce, ppm 86 5.0 76 96 71 101 5.84% 11.68% 17.52% 81 90
Co, ppm 203 6 190 215 184 221 3.11% 6.21% 9.32% 192 213
Cr, ppm 36.4 3.16 30.0 42.7 26.9 45.8 8.70% 17.40% 26.11% 34.5 38.2
Cs, ppm 0.80 0.063 0.67 0.92 0.61 0.99 7.84% 15.69% 23.53% 0.76 0.84
Cu, wt.% 0.293 0.008 0.278 0.309 0.270 0.316 2.65% 5.30% 7.95% 0.278 0.308
Dy, ppm 3.66 0.285 3.09 4.23 2.80 4.51 7.80% 15.60% 23.40% 3.47 3.84
Er, ppm 2.21 0.156 1.90 2.53 1.75 2.68 7.05% 14.11% 21.16% 2.10 2.33
Eu, ppm 1.29 0.092 1.11 1.48 1.01 1.57 7.16% 14.31% 21.47% 1.23 1.36
Fe, wt.% 16.43 0.922 14.59 18.28 13.67 19.20 5.61% 11.22% 16.83% 15.61 17.25
Ga, ppm 18.7 0.90 16.9 20.5 16.0 21.4 4.82% 9.64% 14.46% 17.7 19.6
Gd, ppm 4.08 0.41 3.26 4.90 2.84 5.31 10.09% 20.19% 30.28% 3.87 4.28
Hf, ppm 3.53 0.192 3.15 3.92 2.95 4.11 5.45% 10.90% 16.35% 3.35 3.71
Ho, ppm 0.76 0.054 0.65 0.87 0.60 0.92 7.15% 14.29% 21.44% 0.72 0.80
In, ppm 0.11 0.01 0.08 0.14 0.06 0.15 13.62% 27.24% 40.85% 0.10 0.12
K, wt.% 3.46 0.107 3.25 3.67 3.14 3.78 3.09% 6.18% 9.26% 3.29 3.63
Note: intervals may appear asymmetric due to rounding.

COA-1136-OREAS520.docx Page: 14 of 18
Table 4 continued.
Constituent Certified
Value
Absolute Standard Deviations Relative Standard Deviations 5% window
1SD 2SD Low
2SD High
3SD Low
3SD High
1RSD 2RSD 3RSD Low High
4-Acid Digestion continued
La, ppm 85 6.1 73 97 67 103 7.19% 14.38% 21.57% 81 89
Li, ppm 16.9 1.40 14.2 19.7 12.8 21.1 8.26% 16.51% 24.77% 16.1 17.8
Lu, ppm 0.34 0.026 0.29 0.39 0.26 0.42 7.66% 15.32% 22.97% 0.32 0.36
Mg, wt.% 1.19 0.063 1.07 1.32 1.00 1.38 5.27% 10.53% 15.80% 1.13 1.25
Mn, wt.% 0.242 0.013 0.216 0.268 0.203 0.281 5.40% 10.80% 16.19% 0.230 0.254
Mo, ppm 65 3.8 57 72 54 76 5.85% 11.69% 17.54% 62 68
Na, wt.% 1.35 0.077 1.20 1.50 1.12 1.58 5.69% 11.39% 17.08% 1.28 1.42
Nb, ppm 5.68 0.405 4.87 6.49 4.46 6.89 7.13% 14.25% 21.38% 5.39 5.96
Nd, ppm 22.1 0.96 20.1 24.0 19.2 25.0 4.36% 8.72% 13.09% 21.0 23.2
Ni, ppm 76 5.3 66 87 60 92 6.97% 13.94% 20.91% 72 80
P, wt.% 0.074 0.004 0.066 0.083 0.061 0.087 5.73% 11.47% 17.20% 0.070 0.078
Pb, ppm 5.85 1.06 3.73 7.96 2.68 9.01 18.06% 36.13% 54.19% 5.55 6.14
Pr, ppm 6.69 0.449 5.79 7.59 5.34 8.04 6.71% 13.43% 20.14% 6.36 7.02
Rb, ppm 111 2 106 116 104 119 2.22% 4.45% 6.67% 106 117
Re, ppm 0.031 0.003 0.025 0.036 0.023 0.039 8.64% 17.28% 25.92% 0.029 0.032
S, wt.% 1.01 0.085 0.84 1.18 0.76 1.27 8.41% 16.82% 25.23% 0.96 1.06
Sb, ppm 3.21 0.216 2.78 3.64 2.56 3.86 6.73% 13.47% 20.20% 3.05 3.37
Sc, ppm 17.0 1.27 14.5 19.5 13.2 20.8 7.49% 14.98% 22.47% 16.1 17.8
Se, ppm 1.76 0.30 1.15 2.37 0.85 2.67 17.28% 34.55% 51.83% 1.67 1.85
Sm, ppm 4.02 0.293 3.43 4.60 3.14 4.89 7.29% 14.58% 21.88% 3.82 4.22
Sn, ppm 4.76 0.232 4.29 5.22 4.06 5.46 4.89% 9.77% 14.66% 4.52 5.00
Sr, ppm 104 4 96 113 92 117 4.00% 8.01% 12.01% 99 109
Ta, ppm 0.47 0.07 0.33 0.61 0.26 0.69 15.06% 30.11% 45.17% 0.45 0.50
Tb, ppm 0.64 0.050 0.54 0.74 0.49 0.79 7.86% 15.71% 23.57% 0.61 0.67
Te, ppm 0.36 0.04 0.27 0.45 0.22 0.49 12.56% 25.12% 37.67% 0.34 0.37
Th, ppm 9.62 0.693 8.23 11.01 7.54 11.70 7.20% 14.41% 21.61% 9.14 10.10
Ti, wt.% 0.445 0.041 0.364 0.527 0.323 0.567 9.14% 18.28% 27.41% 0.423 0.468
Tl, ppm 0.26 0.03 0.20 0.32 0.17 0.35 11.60% 23.21% 34.81% 0.25 0.27
Tm, ppm 0.31 0.031 0.25 0.38 0.22 0.41 9.93% 19.86% 29.78% 0.30 0.33
U, ppm 17.9 1.28 15.3 20.4 14.1 21.7 7.13% 14.26% 21.40% 17.0 18.8
V, ppm 257 13 230 283 217 296 5.14% 10.29% 15.43% 244 269
W, ppm 43.8 3.80 36.2 51.4 32.4 55.2 8.69% 17.37% 26.06% 41.6 46.0
Y, ppm 20.8 1.00 18.8 22.8 17.8 23.8 4.82% 9.65% 14.47% 19.8 21.9
Yb, ppm 2.20 0.129 1.94 2.46 1.81 2.59 5.87% 11.73% 17.60% 2.09 2.31
Zn, ppm 22.7 1.90 18.9 26.5 17.0 28.4 8.37% 16.74% 25.11% 21.6 23.8
Zr, ppm 134 7 121 147 114 153 4.90% 9.80% 14.69% 127 140
3-Acid Digestion (no HF)
Ag, ppm < 0.5 IND IND IND IND IND IND IND IND IND IND
As, ppm 151 12 127 175 115 188 8.05% 16.11% 24.16% 143 159
Co, ppm 199 10 180 218 171 228 4.79% 9.57% 14.36% 189 209
Cu, wt.% 0.292 0.006 0.280 0.303 0.274 0.309 2.05% 4.10% 6.15% 0.277 0.306
Fe, wt.% 16.96 0.458 16.05 17.88 15.59 18.33 2.70% 5.40% 8.09% 16.11 17.81
Mo, ppm 60 2.7 54 65 52 68 4.57% 9.13% 13.70% 57 63
S, wt.% 1.07 0.049 0.97 1.17 0.92 1.22 4.56% 9.13% 13.69% 1.02 1.12

COA-1136-OREAS520.docx Page: 15 of 18
Table 4 continued.
Constituent Certified
Value
Absolute Standard Deviations Relative Standard Deviations 5% window
1SD 2SD Low
2SD High
3SD Low
3SD High
1RSD 2RSD 3RSD Low High
Aqua Regia Digestion
Ag, ppm 0.422 0.031 0.360 0.484 0.329 0.515 7.36% 14.71% 22.07% 0.401 0.443
Al, wt.% 1.56 0.050 1.46 1.66 1.41 1.71 3.20% 6.39% 9.59% 1.48 1.64
As, ppm 152 8 137 167 130 175 4.94% 9.88% 14.82% 145 160
Au, ppm 0.169 0.010 0.149 0.189 0.139 0.198 5.83% 11.66% 17.49% 0.160 0.177
Be, ppm 0.54 0.07 0.40 0.69 0.32 0.76 13.54% 27.07% 40.61% 0.52 0.57
Bi, ppm 2.90 0.157 2.59 3.21 2.43 3.37 5.41% 10.82% 16.23% 2.76 3.05
Ca, wt.% 3.84 0.154 3.53 4.15 3.37 4.30 4.02% 8.05% 12.07% 3.65 4.03
Ce, ppm 79 3.2 73 86 69 89 4.08% 8.17% 12.25% 75 83
Co, ppm 196 12 172 220 160 232 6.08% 12.17% 18.25% 186 206
Cr, ppm 37.4 1.93 33.5 41.3 31.6 43.2 5.16% 10.31% 15.47% 35.5 39.3
Cs, ppm 0.57 0.041 0.48 0.65 0.44 0.69 7.18% 14.36% 21.55% 0.54 0.59
Cu, wt.% 0.296 0.009 0.277 0.314 0.268 0.323 3.08% 6.16% 9.24% 0.281 0.310
Fe, wt.% 15.74 0.877 13.99 17.50 13.11 18.38 5.57% 11.14% 16.71% 14.96 16.53
Ga, ppm 13.7 0.65 12.4 15.0 11.8 15.7 4.76% 9.53% 14.29% 13.0 14.4
Ge, ppm 0.25 0.04 0.17 0.32 0.14 0.35 14.64% 29.27% 43.91% 0.23 0.26
Hf, ppm 0.81 0.13 0.54 1.07 0.41 1.21 16.35% 32.71% 49.06% 0.77 0.85
In, ppm 0.11 0.010 0.09 0.13 0.08 0.14 9.02% 18.05% 27.07% 0.10 0.11
K, wt.% 0.506 0.015 0.475 0.536 0.459 0.552 3.05% 6.11% 9.16% 0.480 0.531
La, ppm 83 4.1 74 91 70 95 4.98% 9.96% 14.94% 79 87
Li, ppm 16.6 1.7 13.1 20.1 11.4 21.8 10.46% 20.91% 31.37% 15.8 17.4
Lu, ppm 0.20 0.016 0.17 0.23 0.15 0.25 7.75% 15.51% 23.26% 0.19 0.21
Mg, wt.% 1.14 0.056 1.03 1.25 0.98 1.31 4.87% 9.74% 14.61% 1.09 1.20
Mn, wt.% 0.228 0.009 0.211 0.246 0.202 0.254 3.84% 7.68% 11.51% 0.217 0.240
Mo, ppm 62 4.5 53 71 49 75 7.23% 14.45% 21.68% 59 65
Na, wt.% 0.052 0.006 0.039 0.064 0.033 0.071 12.23% 24.46% 36.68% 0.049 0.054
Ni, ppm 73 1.7 69 76 68 78 2.31% 4.62% 6.93% 69 76
P, wt.% 0.074 0.004 0.065 0.083 0.061 0.087 5.95% 11.89% 17.84% 0.070 0.078
Pb, ppm 5.22 0.64 3.94 6.50 3.30 7.14 12.25% 24.51% 36.76% 4.96 5.48
Rb, ppm 31.5 2.04 27.4 35.6 25.4 37.6 6.47% 12.93% 19.40% 29.9 33.1
S, wt.% 1.03 0.052 0.92 1.13 0.87 1.18 5.07% 10.14% 15.22% 0.98 1.08
Sb, ppm 1.97 0.23 1.50 2.44 1.27 2.67 11.87% 23.73% 35.60% 1.87 2.07
Sc, ppm 11.8 0.88 10.1 13.6 9.2 14.5 7.43% 14.87% 22.30% 11.2 12.4
Se, ppm 1.73 0.28 1.18 2.28 0.90 2.56 15.97% 31.93% 47.90% 1.64 1.82
Sn, ppm 3.42 0.111 3.20 3.64 3.08 3.75 3.25% 6.50% 9.75% 3.25 3.59
Sr, ppm 36.0 2.34 31.4 40.7 29.0 43.1 6.50% 13.01% 19.51% 34.2 37.9
Tb, ppm 0.50 0.028 0.44 0.55 0.41 0.58 5.63% 11.26% 16.88% 0.47 0.52
Te, ppm 0.33 0.04 0.25 0.41 0.21 0.45 12.46% 24.91% 37.37% 0.31 0.34
Th, ppm 8.03 0.601 6.83 9.23 6.23 9.83 7.48% 14.96% 22.43% 7.63 8.43
Ti, wt.% 0.135 0.018 0.099 0.172 0.081 0.190 13.33% 26.67% 40.00% 0.129 0.142
Tl, ppm 0.090 0.010 0.070 0.109 0.060 0.119 10.99% 21.98% 32.97% 0.085 0.094
U, ppm 14.9 0.96 13.0 16.8 12.0 17.8 6.42% 12.84% 19.25% 14.1 15.6
V, ppm 247 14 220 275 206 289 5.63% 11.26% 16.89% 235 260
W, ppm 29.6 3.9 21.9 37.4 18.0 41.3 13.09% 26.19% 39.28% 28.1 31.1
Note: intervals may appear asymmetric due to rounding.

COA-1136-OREAS520.docx Page: 16 of 18
Table 4 continued.
Constituent Certified
Value
Absolute Standard Deviations Relative Standard Deviations 5% window
1SD 2SD Low
2SD High
3SD Low
3SD High
1RSD 2RSD 3RSD Low High
Aqua Regia Digestion continued
Y, ppm 14.3 1.30 11.7 16.9 10.4 18.1 9.08% 18.16% 27.25% 13.5 15.0
Yb, ppm 1.36 0.064 1.23 1.49 1.17 1.56 4.71% 9.41% 14.12% 1.29 1.43
Zn, ppm 20.7 1.63 17.4 23.9 15.8 25.6 7.89% 15.78% 23.67% 19.6 21.7
Zr, ppm 28.0 4.6 18.8 37.3 14.1 41.9 16.54% 33.08% 49.62% 26.6 29.4
Infrared Combustion
S, wt.% 1.11 0.034 1.04 1.18 1.00 1.21 3.11% 6.22% 9.34% 1.05 1.16
Gas / Liquid Pycnometry
SG, Unity 3.00 0.045 2.91 3.09 2.87 3.14 1.51% 3.01% 4.52% 2.85 3.15
Note: intervals may appear asymmetric due to rounding.
PREPARER AND SUPPLIER OF THE REFERENCE MATERIAL Reference material OREAS 520 has been prepared, certified and is supplied by: ORE Research & Exploration Pty Ltd Tel: +613-9729 0333
37A Hosie Street Fax: +613-9729 8338
Bayswater North VIC 3153 Web: www.ore.com.au
AUSTRALIA Email: [email protected]
OREAS 520 is available in unit sizes of 60g and 100g (sealed under nitrogen in single-use laminated foil pouches) and 500g (plastic jars).
INTENDED USE OREAS 520 is intended for the following uses:
for the monitoring of laboratory performance in the analysis of analytes reported in Table 1 in geological samples;
for the verification of analytical methods for analytes reported in Table 1;
for the calibration of instruments used in the determination of the concentration of analytes reported in Table 1.
STABILITY AND STORAGE INSTRUCTIONS OREAS 520 has been sourced from iron oxide copper-gold ore and waste rock from the Ernest Henry deposit. In its unopened state and under normal conditions of storage it has a shelf life beyond ten years. Its stability will be monitored at regular intervals and purchasers notified if any changes are observed.

COA-1136-OREAS520.docx Page: 17 of 18
INSTRUCTIONS FOR CORRECT USE The certified values for OREAS 520 refer to the concentration level in its packaged state. It should not be dried prior to weighing and analysis.
HANDLING INSTRUCTIONS Fine powders pose a risk to eyes and lungs and therefore standard precautions such as the use of safety glasses and dust masks are advised.
TRACEABILITY
The analytical samples were selected in a manner to represent the entire batch of prepared CRM. This ‘representivity’ was maintained in each submitted laboratory sample batch and ensures the user that the data is traceable from sample selection through to the analytical results that underlie the consensus values. Each analytical data set has been validated by its assayer through the inclusion of internal reference materials and QC checks during analysis. The laboratories were chosen on the basis of their competence (from past performance in inter-laboratory programs) for a particular analytical method, analyte or analyte suite, and sample matrix. Most of these laboratories have and maintain ISO 17025 accreditation. The certified values presented in this report are calculated from the means of accepted data following robust statistical treatment as detailed in this report.
LEGAL NOTICE Ore Research & Exploration Pty Ltd has prepared and statistically evaluated the property values of this reference material to the best of its ability. The Purchaser by receipt hereof releases and indemnifies Ore Research & Exploration Pty Ltd from and against all liability and costs arising from the use of this material and information.
QMS ACCREDITED
ORE Pty Ltd is accredited to ISO 9001:2008 by Lloyd’s Register Quality Assurance Ltd for its quality management system including development, manufacturing, certification and supply of CRMs.
CERTIFYING OFFICER
Craig Hamlyn (B.Sc. Hons - Geology), Technical Manager - ORE P/L

COA-1136-OREAS520.docx Page: 18 of 18
REFERENCES Ingamells, C. O. and Switzer, P. (1973), Talanta 20, 547-568.
ISO Guide 30 (1992), Terms and definitions used in connection with reference materials.
ISO Guide 31 (2000), Reference materials – Contents of certificates and labels.
ISO Guide 3207 (1975), Statistical interpretation of data - Determination of a statistical
tolerance interval.
ISO Guide 35 (2006), Certification of reference materials - General and statistical
principals.