te ist ei eeet et i teste st e 5 ypass s. meadows great...
TRANSCRIPT
For more information:
For Sale or Lease
Great Retail OpportunityTHE FIRST COMMERCIAL DEVELOPMENT PROJECT IN NORTHWESTERN SANTA FE 599 Bypass & S. Meadows
Santa Fe, NM 87507
599 Bypass & S. Meadows
418 Cerrillos Rd. | Suite 11 | Santa Fe, NM 87501
505 988 8081 www.gotspaceusa.com
Carlos [email protected]
505 670 3181
Cindy Campos [email protected]
720 329 1113
Santa Fe Airport
Santa Fe Animal Shelter
NM Dept. of Game and Fish
SF Municipal Recreation Complex
El Camino Real Academy
La Familia Medical Center
Marty Sanchez Municipal Golf Course
S I T E
3 m
iles
Meow Wolf
Santa Fe Country Club
Veteran
s Mem
orial
Hwy.
Airport Rd.
35,000Rodeo Rd.
599
Vista Desangres Homes
Cerrillos Rd.
Capital High School
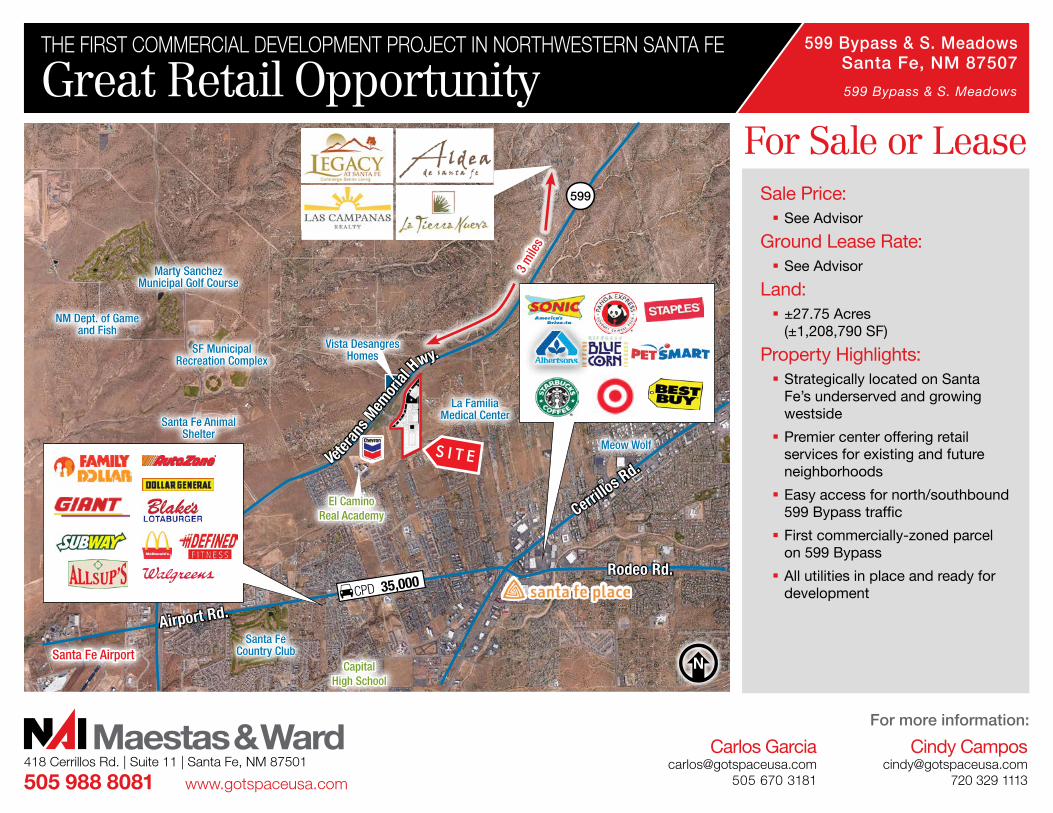
Sale Price: � See Advisor
Ground Lease Rate: � See Advisor
Land: � ±27.75 Acres (±1,208,790 SF)
Property Highlights: � Strategically located on Santa Fe’s underserved and growing westside
� Premier center offering retail services for existing and future neighborhoods
� Easy access for north/southbound 599 Bypass traffic
� First commercially-zoned parcel on 599 Bypass
� All utilities in place and ready for development
For more information:
Great Retail OpportunityTHE FIRST COMMERCIAL DEVELOPMENT PROJECT IN NORTHWESTERN SANTA FE 599 Bypass & S. Meadows
Santa Fe, NM 87507
Carlos [email protected]
505 670 3181
Cindy Campos [email protected]
720 329 1113
THE INFORMATION CONTAINED IS BELIEVED RELIABLE. WHILE WE DO NOT DOUBT THE ACCURACY, WE HAVE NOT VERIFIED IT AND MAKE NO GUARANTEE, WARRANTY OR REPRESENTATION ABOUT IT. IT IS YOUR RESPONSIBILITY TO INDEPENDENTLY CONFIRM ITS ACCURACY AND COMPLETENESS. ANY PROJECTION, OPINION, ASSUMPTION OR ESTIMATED USES ARE FOR EXAMPLE ONLY AND DO NOT REPRESENT THE CURRENT OR FUTURE PERFORMANCE OF THE PROPERTY. THE VALUE OF THIS TRANSACTION TO YOU DEPENDS ON MANY FACTORS WHICH SHOULD BE EVALUATED BY YOUR TAX, FINANCIAL, AND LEGAL COUNSEL. YOU AND YOUR COUNSEL SHOULD CONDUCT A CAREFUL INDEPENDENT INVESTIGATION OF THE PROPERTY TO DETERMINE THAT IT IS SUITABLE TO YOUR NEEDS.
505 988 8081
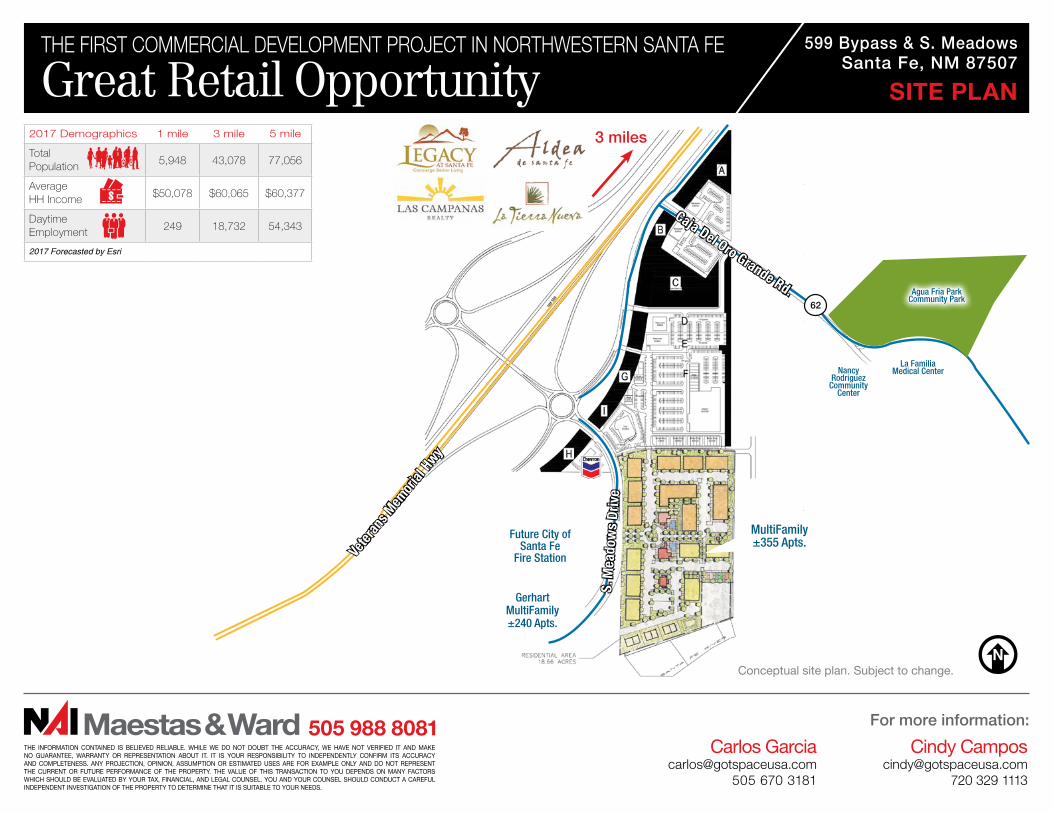
SITE PLAN
MultiFamily±355 Apts.
NancyRodriguez
CommunityCenter
La Familia Medical Center
Vete
rans
Mem
orial
Hwy
62Agua Fria Park
Community Park
S. M
eado
ws
Driv
e
Caja Del Oro Grande Rd.
Gerhart MultiFamily±240 Apts.
3 miles
Future City of Santa Fe
Fire Station
Conceptual site plan. Subject to change.
2017 Demographics 1 mile 3 mile 5 mile
Total Population 5,948 43,078 77,056
Average HH Income $50,078 $60,065 $60,377
Daytime Employment 249 18,732 54,343
2017 Forecasted by Esri
For more information:
Carlos [email protected]
505 670 3181
Cindy Campos [email protected]
720 329 1113
THE INFORMATION CONTAINED IS BELIEVED RELIABLE. WHILE WE DO NOT DOUBT THE ACCURACY, WE HAVE NOT VERIFIED IT AND MAKE NO GUARANTEE, WARRANTY OR REPRESENTATION ABOUT IT. IT IS YOUR RESPONSIBILITY TO INDEPENDENTLY CONFIRM ITS ACCURACY AND COMPLETENESS. ANY PROJECTION, OPINION, ASSUMPTION OR ESTIMATED USES ARE FOR EXAMPLE ONLY AND DO NOT REPRESENT THE CURRENT OR FUTURE PERFORMANCE OF THE PROPERTY. THE VALUE OF THIS TRANSACTION TO YOU DEPENDS ON MANY FACTORS WHICH SHOULD BE EVALUATED BY YOUR TAX, FINANCIAL, AND LEGAL COUNSEL. YOU AND YOUR COUNSEL SHOULD CONDUCT A CAREFUL INDEPENDENT INVESTIGATION OF THE PROPERTY TO DETERMINE THAT IT IS SUITABLE TO YOUR NEEDS.
505 988 8081
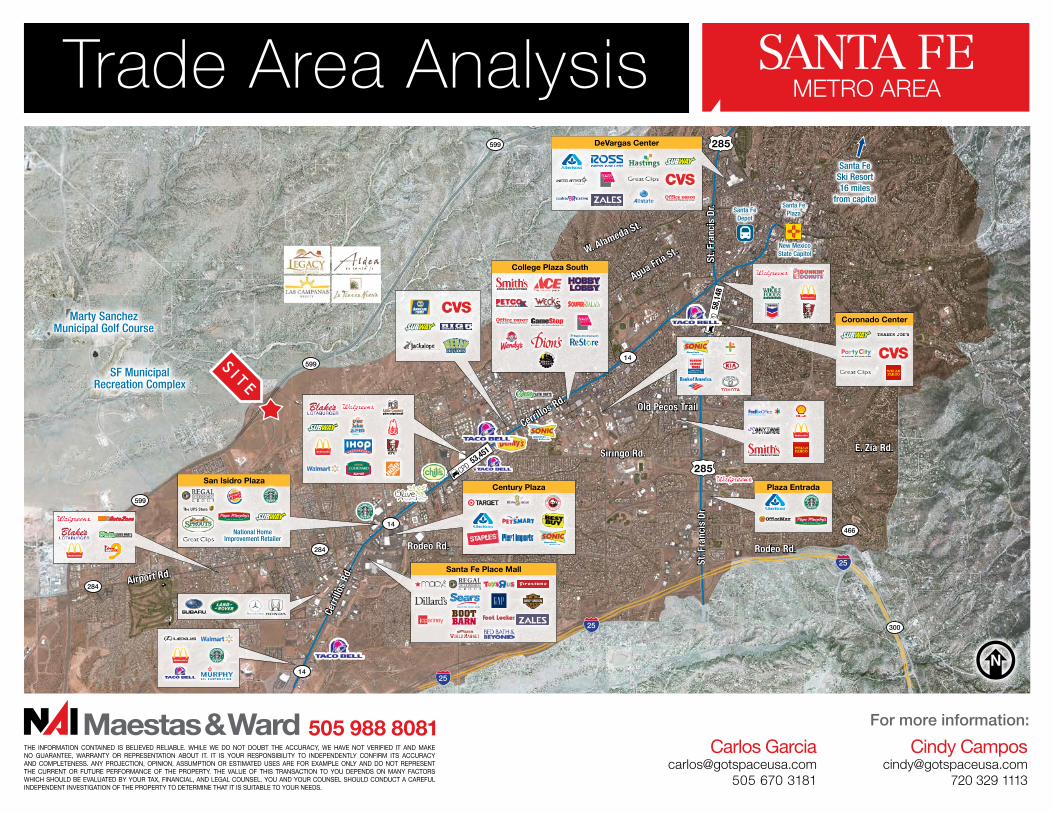
Trade Area Analysis SANTA FEMETRO AREA
Cerr
illos
Rd.
Cerrillos Rd.
Agua Fria St.W. Alameda St.
Airport Rd.
Rodeo Rd. Rodeo Rd.
E. Zia Rd.Siringo Rd.
25
285
285
25
300
466
599
599
599
284
14
14
14
284
St. F
ranc
is D
r.St
. Fra
ncis
Dr. Santa Fe
Depot
Santa FePlaza
New MexicoState Capitol
Old Pecos Trail
Santa FeSki Resort16 miles
from capitol
58,
148
53,451
25
Plaza Entrada
Coronado Center
DeVargas Center
Century Plaza
Santa Fe Place Mall
College Plaza South
San Isidro Plaza
National Home Improvement Retailer
S I T ESF Municipal
Recreation Complex
Marty Sanchez Municipal Golf Course
For more information:
Great Retail OpportunityTHE FIRST COMMERCIAL DEVELOPMENT PROJECT IN NORTHWESTERN SANTA FE 599 Bypass & S. Meadows
Santa Fe, NM 87507
Carlos [email protected]
505 670 3181
Cindy Campos [email protected]
720 329 1113
THE INFORMATION CONTAINED IS BELIEVED RELIABLE. WHILE WE DO NOT DOUBT THE ACCURACY, WE HAVE NOT VERIFIED IT AND MAKE NO GUARANTEE, WARRANTY OR REPRESENTATION ABOUT IT. IT IS YOUR RESPONSIBILITY TO INDEPENDENTLY CONFIRM ITS ACCURACY AND COMPLETENESS. ANY PROJECTION, OPINION, ASSUMPTION OR ESTIMATED USES ARE FOR EXAMPLE ONLY AND DO NOT REPRESENT THE CURRENT OR FUTURE PERFORMANCE OF THE PROPERTY. THE VALUE OF THIS TRANSACTION TO YOU DEPENDS ON MANY FACTORS WHICH SHOULD BE EVALUATED BY YOUR TAX, FINANCIAL, AND LEGAL COUNSEL. YOU AND YOUR COUNSEL SHOULD CONDUCT A CAREFUL INDEPENDENT INVESTIGATION OF THE PROPERTY TO DETERMINE THAT IT IS SUITABLE TO YOUR NEEDS.
505 988 8081
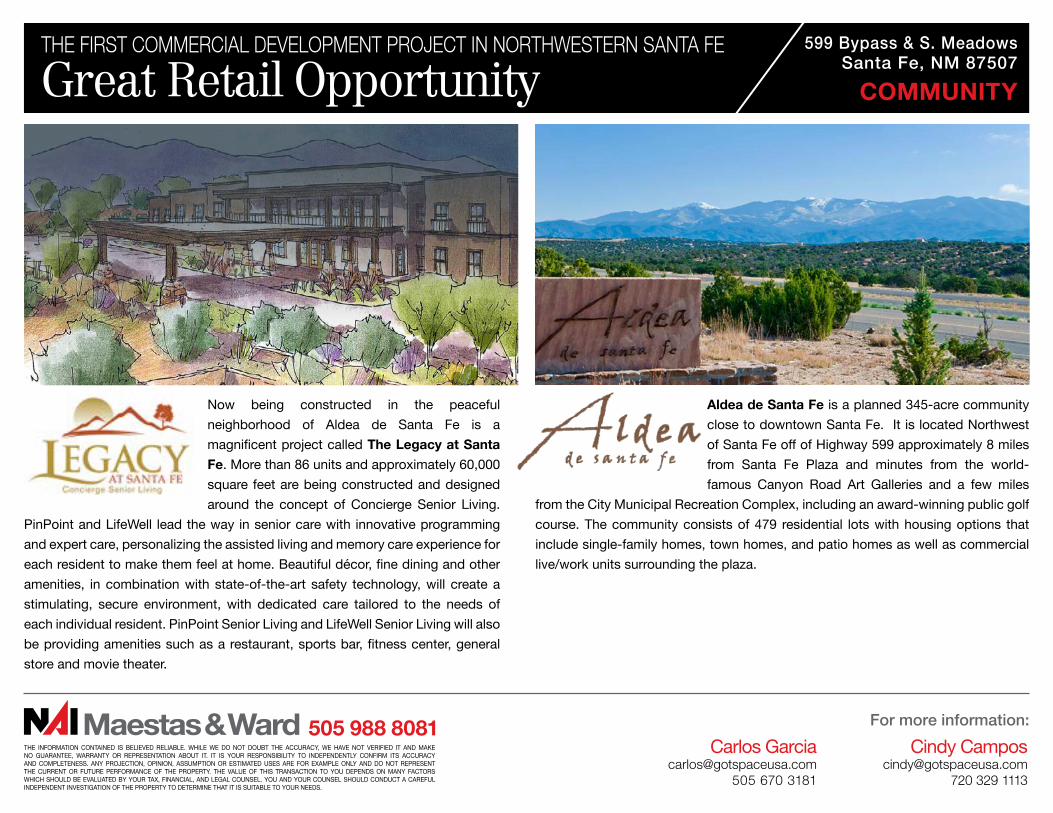
COMMUNITY
Now being constructed in the peaceful
neighborhood of Aldea de Santa Fe is a
magnificent project called The Legacy at Santa
Fe. More than 86 units and approximately 60,000
square feet are being constructed and designed
around the concept of Concierge Senior Living.
PinPoint and LifeWell lead the way in senior care with innovative programming
and expert care, personalizing the assisted living and memory care experience for
each resident to make them feel at home. Beautiful décor, fine dining and other
amenities, in combination with state-of-the-art safety technology, will create a
stimulating, secure environment, with dedicated care tailored to the needs of
each individual resident. PinPoint Senior Living and LifeWell Senior Living will also
be providing amenities such as a restaurant, sports bar, fitness center, general
store and movie theater.
Aldea de Santa Fe is a planned 345-acre community
close to downtown Santa Fe. It is located Northwest
of Santa Fe off of Highway 599 approximately 8 miles
from Santa Fe Plaza and minutes from the world-
famous Canyon Road Art Galleries and a few miles
from the City Municipal Recreation Complex, including an award-winning public golf
course. The community consists of 479 residential lots with housing options that
include single-family homes, town homes, and patio homes as well as commercial
live/work units surrounding the plaza.
For more information:
Great Retail OpportunityTHE FIRST COMMERCIAL DEVELOPMENT PROJECT IN NORTHWESTERN SANTA FE 599 Bypass & S. Meadows
Santa Fe, NM 87507
Carlos [email protected]
505 670 3181
Cindy Campos [email protected]
720 329 1113
THE INFORMATION CONTAINED IS BELIEVED RELIABLE. WHILE WE DO NOT DOUBT THE ACCURACY, WE HAVE NOT VERIFIED IT AND MAKE NO GUARANTEE, WARRANTY OR REPRESENTATION ABOUT IT. IT IS YOUR RESPONSIBILITY TO INDEPENDENTLY CONFIRM ITS ACCURACY AND COMPLETENESS. ANY PROJECTION, OPINION, ASSUMPTION OR ESTIMATED USES ARE FOR EXAMPLE ONLY AND DO NOT REPRESENT THE CURRENT OR FUTURE PERFORMANCE OF THE PROPERTY. THE VALUE OF THIS TRANSACTION TO YOU DEPENDS ON MANY FACTORS WHICH SHOULD BE EVALUATED BY YOUR TAX, FINANCIAL, AND LEGAL COUNSEL. YOU AND YOUR COUNSEL SHOULD CONDUCT A CAREFUL INDEPENDENT INVESTIGATION OF THE PROPERTY TO DETERMINE THAT IT IS SUITABLE TO YOUR NEEDS.
505 988 8081
COMMUNITY
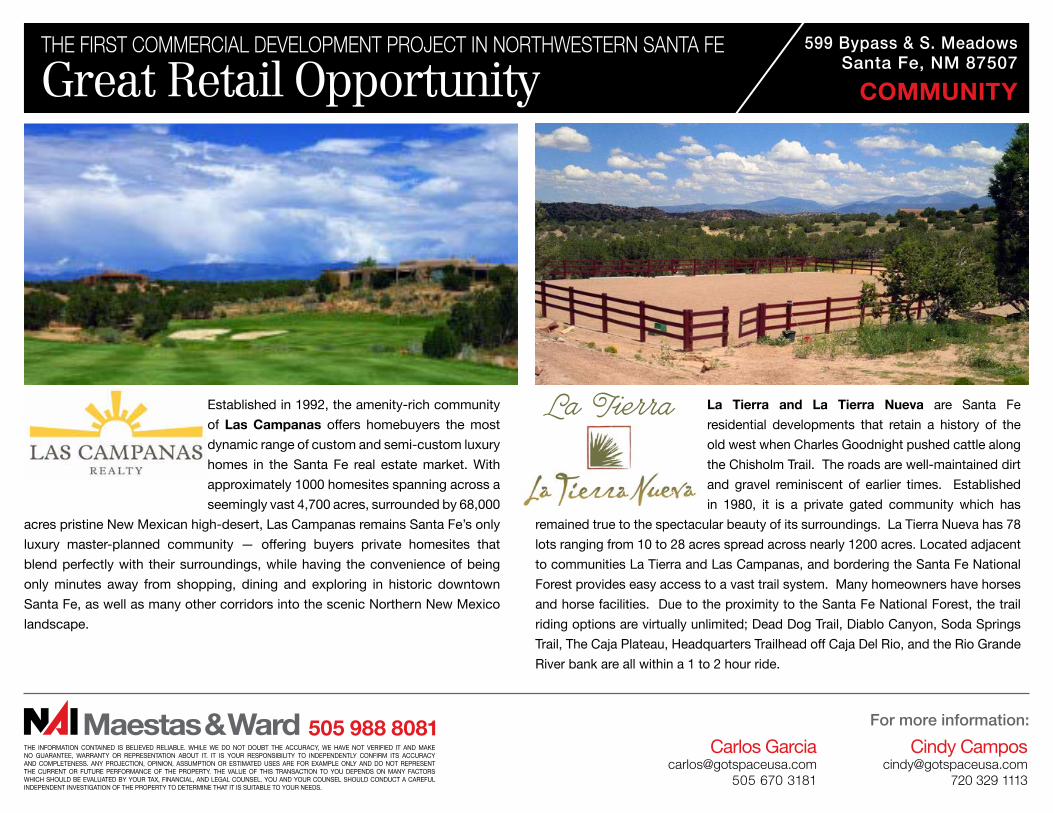
Established in 1992, the amenity-rich community
of Las Campanas offers homebuyers the most
dynamic range of custom and semi-custom luxury
homes in the Santa Fe real estate market. With
approximately 1000 homesites spanning across a
seemingly vast 4,700 acres, surrounded by 68,000
acres pristine New Mexican high-desert, Las Campanas remains Santa Fe’s only
luxury master-planned community — offering buyers private homesites that
blend perfectly with their surroundings, while having the convenience of being
only minutes away from shopping, dining and exploring in historic downtown
Santa Fe, as well as many other corridors into the scenic Northern New Mexico
landscape.
La Tierra and La Tierra Nueva are Santa Fe
residential developments that retain a history of the
old west when Charles Goodnight pushed cattle along
the Chisholm Trail. The roads are well-maintained dirt
and gravel reminiscent of earlier times. Established
in 1980, it is a private gated community which has
remained true to the spectacular beauty of its surroundings. La Tierra Nueva has 78
lots ranging from 10 to 28 acres spread across nearly 1200 acres. Located adjacent
to communities La Tierra and Las Campanas, and bordering the Santa Fe National
Forest provides easy access to a vast trail system. Many homeowners have horses
and horse facilities. Due to the proximity to the Santa Fe National Forest, the trail
riding options are virtually unlimited; Dead Dog Trail, Diablo Canyon, Soda Springs
Trail, The Caja Plateau, Headquarters Trailhead off Caja Del Rio, and the Rio Grande
River bank are all within a 1 to 2 hour ride.
For more information:
Carlos [email protected]
505 670 3181
Cindy Campos [email protected]
720 329 1113418 Cerrillos Rd. | Suite 11 | Santa Fe, NM 87501
505 988 8081 www.gotspaceusa.com
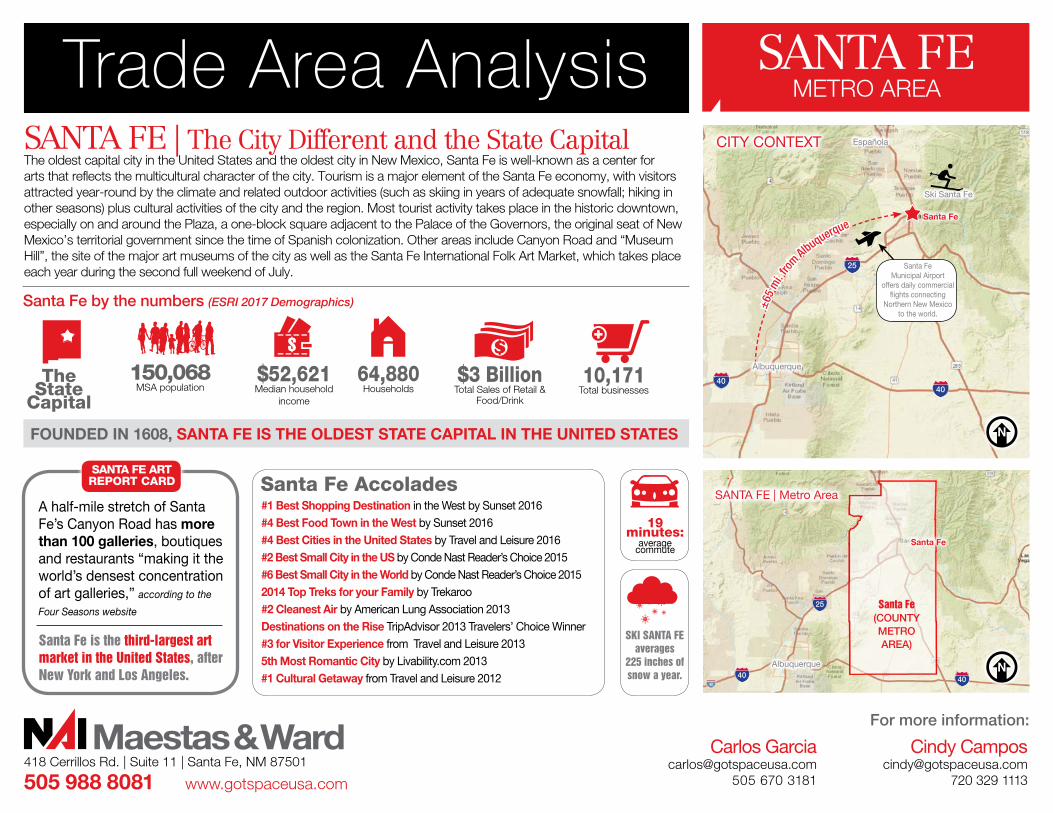
150,068 MSA population
Santa Fe by the numbers (ESRI 2017 Demographics)
$52,621 Median household
income
64,880 Households
$3 Billion Total Sales of Retail &
Food/Drink
10,171 Total businesses
The
State Capital
SANTA FE | The City Different and the State Capital The oldest capital city in the United States and the oldest city in New Mexico, Santa Fe is well-known as a center for arts that reflects the multicultural character of the city. Tourism is a major element of the Santa Fe economy, with visitors attracted year-round by the climate and related outdoor activities (such as skiing in years of adequate snowfall; hiking in other seasons) plus cultural activities of the city and the region. Most tourist activity takes place in the historic downtown, especially on and around the Plaza, a one-block square adjacent to the Palace of the Governors, the original seat of New Mexico’s territorial government since the time of Spanish colonization. Other areas include Canyon Road and “Museum Hill”, the site of the major art museums of the city as well as the Santa Fe International Folk Art Market, which takes place each year during the second full weekend of July.
25
40
Ski Santa Fe
Española
±65
mi. f
rom Albuquerque
SANTA FE ART REPORT CARD Santa Fe Accolades
A half-mile stretch of Santa Fe’s Canyon Road has more than 100 galleries, boutiques and restaurants “making it the world’s densest concentration of art galleries,” according to the
Four Seasons website
19 minutes:
average commute
SKI SANTA FE
averages 225 inches of snow a year.
Santa Fe is the third-largest art market in the United States, after New York and Los Angeles.
#1 Best Shopping Destination in the West by Sunset 2016#4 Best Food Town in the West by Sunset 2016#4 Best Cities in the United States by Travel and Leisure 2016#2 Best Small City in the US by Conde Nast Reader’s Choice 2015#6 Best Small City in the World by Conde Nast Reader’s Choice 20152014 Top Treks for your Family by Trekaroo#2 Cleanest Air by American Lung Association 2013Destinations on the Rise TripAdvisor 2013 Travelers’ Choice Winner#3 for Visitor Experience from Travel and Leisure 20135th Most Romantic City by Livability.com 2013#1 Cultural Getaway from Travel and Leisure 2012
Santa Fe(COUNTY METRO AREA)
Santa Fe
40 40
25
CITY CONTEXT
Albuquerque
Santa Fe
Albuquerque
40
FOUNDED IN 1608, SANTA FE IS THE OLDEST STATE CAPITAL IN THE UNITED STATES
SANTA FE | Metro Area
Santa Fe Municipal Airport
offers daily commercial flights connecting
Northern New Mexico to the world.
Trade Area Analysis SANTA FEMETRO AREA
For more information:
Great Retail OpportunityTHE FIRST COMMERCIAL DEVELOPMENT PROJECT IN NORTHWESTERN SANTA FE 599 Bypass & S. Meadows
Santa Fe, NM 87507
Carlos [email protected]
505 670 3181
Cindy Campos [email protected]
720 329 1113
THE INFORMATION CONTAINED IS BELIEVED RELIABLE. WHILE WE DO NOT DOUBT THE ACCURACY, WE HAVE NOT VERIFIED IT AND MAKE NO GUARANTEE, WARRANTY OR REPRESENTATION ABOUT IT. IT IS YOUR RESPONSIBILITY TO INDEPENDENTLY CONFIRM ITS ACCURACY AND COMPLETENESS. ANY PROJECTION, OPINION, ASSUMPTION OR ESTIMATED USES ARE FOR EXAMPLE ONLY AND DO NOT REPRESENT THE CURRENT OR FUTURE PERFORMANCE OF THE PROPERTY. THE VALUE OF THIS TRANSACTION TO YOU DEPENDS ON MANY FACTORS WHICH SHOULD BE EVALUATED BY YOUR TAX, FINANCIAL, AND LEGAL COUNSEL. YOU AND YOUR COUNSEL SHOULD CONDUCT A CAREFUL INDEPENDENT INVESTIGATION OF THE PROPERTY TO DETERMINE THAT IT IS SUITABLE TO YOUR NEEDS.
505 988 8081
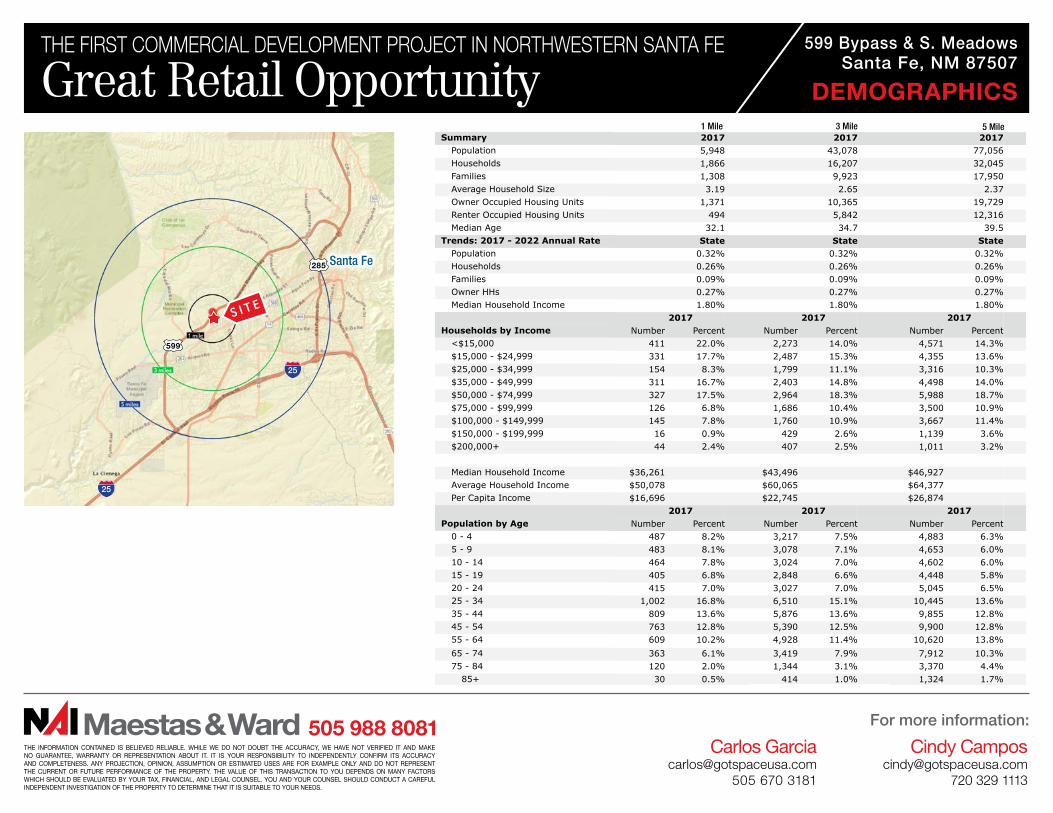
DEMOGRAPHICS
S I T E
25
599
Santa Fe
1 Mile 3 Mile 5 Mile
Demographic and Income Profile6, Santa Fe, New Mexico, 87507 Prepared by EsriRing: 1 mile radius Latitude: 35.65797
Longitude: -106.03521
Summary Census 2010 2017 2022Population 5,319 5,948 6,250Households 1,668 1,866 1,966Families 1,190 1,308 1,365Average Household Size 3.19 3.19 3.18Owner Occupied Housing Units 1,241 1,371 1,448Renter Occupied Housing Units 427 494 518Median Age 30.2 32.1 33.4
Trends: 2017 - 2022 Annual Rate Area State NationalPopulation 1.00% 0.32% 0.83%Households 1.05% 0.26% 0.79%Families 0.86% 0.09% 0.71%Owner HHs 1.10% 0.27% 0.72%Median Household Income 0.25% 1.80% 2.12%
2017 2022 Households by Income Number Percent Number Percent
<$15,000 411 22.0% 455 23.1%$15,000 - $24,999 331 17.7% 337 17.1%$25,000 - $34,999 154 8.3% 145 7.4%$35,000 - $49,999 311 16.7% 299 15.2%$50,000 - $74,999 327 17.5% 328 16.7%$75,000 - $99,999 126 6.8% 144 7.3%$100,000 - $149,999 145 7.8% 183 9.3%$150,000 - $199,999 16 0.9% 20 1.0%$200,000+ 44 2.4% 56 2.8%
Median Household Income $36,261 $36,723Average Household Income $50,078 $55,236Per Capita Income $16,696 $18,457
Census 2010 2017 2022 Population by Age Number Percent Number Percent Number Percent
0 - 4 490 9.2% 487 8.2% 491 7.9%5 - 9 463 8.7% 483 8.1% 494 7.9%10 - 14 408 7.7% 464 7.8% 504 8.1%15 - 19 393 7.4% 405 6.8% 454 7.3%20 - 24 424 8.0% 415 7.0% 397 6.4%25 - 34 871 16.4% 1,002 16.8% 947 15.1%35 - 44 788 14.8% 809 13.6% 921 14.7%45 - 54 696 13.1% 763 12.8% 737 11.8%55 - 64 462 8.7% 609 10.2% 667 10.7%65 - 74 226 4.2% 363 6.1% 428 6.8%75 - 84 75 1.4% 120 2.0% 177 2.8%
85+ 23 0.4% 30 0.5% 34 0.5%Census 2010 2017 2022
Race and Ethnicity Number Percent Number Percent Number PercentWhite Alone 3,472 65.3% 3,806 64.0% 3,986 63.8%Black Alone 29 0.5% 38 0.6% 45 0.7%American Indian Alone 107 2.0% 134 2.3% 150 2.4%Asian Alone 20 0.4% 26 0.4% 30 0.5%Pacific Islander Alone 3 0.1% 5 0.1% 6 0.1%Some Other Race Alone 1,473 27.7% 1,686 28.3% 1,764 28.2%Two or More Races 216 4.1% 253 4.3% 268 4.3%
Hispanic Origin (Any Race) 4,425 83.2% 4,981 83.7% 5,257 84.1%Data Note: Income is expressed in current dollars.
Source: U.S. Census Bureau, Census 2010 Summary File 1. Esri forecasts for 2017 and 2022.
August 28, 2017
©2017 Esri Page 1 of 6
Demographic and Income Profile6, Santa Fe, New Mexico, 87507 Prepared by EsriRing: 3 mile radius Latitude: 35.65797
Longitude: -106.03521
Summary Census 2010 2017 2022Population 39,707 43,078 44,776Households 14,915 16,207 16,876Families 9,390 9,923 10,190Average Household Size 2.65 2.65 2.65Owner Occupied Housing Units 9,751 10,365 10,744Renter Occupied Housing Units 5,164 5,842 6,132Median Age 33.6 34.7 35.3
Trends: 2017 - 2022 Annual Rate Area State NationalPopulation 0.78% 0.32% 0.83%Households 0.81% 0.26% 0.79%Families 0.53% 0.09% 0.71%Owner HHs 0.72% 0.27% 0.72%Median Household Income 1.47% 1.80% 2.12%
2017 2022 Households by Income Number Percent Number Percent
<$15,000 2,273 14.0% 2,404 14.2%$15,000 - $24,999 2,487 15.3% 2,473 14.7%$25,000 - $34,999 1,799 11.1% 1,691 10.0%$35,000 - $49,999 2,403 14.8% 2,248 13.3%$50,000 - $74,999 2,964 18.3% 2,959 17.5%$75,000 - $99,999 1,686 10.4% 1,885 11.2%$100,000 - $149,999 1,760 10.9% 2,186 13.0%$150,000 - $199,999 429 2.6% 525 3.1%$200,000+ 407 2.5% 505 3.0%
Median Household Income $43,496 $46,786Average Household Income $60,065 $67,157Per Capita Income $22,745 $25,468
Census 2010 2017 2022 Population by Age Number Percent Number Percent Number Percent
0 - 4 3,225 8.1% 3,217 7.5% 3,324 7.4%5 - 9 3,032 7.6% 3,078 7.1% 3,153 7.0%10 - 14 2,947 7.4% 3,024 7.0% 3,125 7.0%15 - 19 2,782 7.0% 2,848 6.6% 2,921 6.5%20 - 24 2,772 7.0% 3,027 7.0% 2,938 6.6%25 - 34 5,950 15.0% 6,510 15.1% 6,718 15.0%35 - 44 5,861 14.8% 5,876 13.6% 6,124 13.7%45 - 54 5,383 13.6% 5,390 12.5% 5,241 11.7%55 - 64 4,256 10.7% 4,928 11.4% 4,958 11.1%65 - 74 2,257 5.7% 3,419 7.9% 3,934 8.8%75 - 84 935 2.4% 1,344 3.1% 1,852 4.1%
85+ 310 0.8% 414 1.0% 489 1.1%Census 2010 2017 2022
Race and Ethnicity Number Percent Number Percent Number PercentWhite Alone 27,455 69.1% 29,239 67.9% 30,230 67.5%Black Alone 385 1.0% 500 1.2% 593 1.3%American Indian Alone 922 2.3% 1,094 2.5% 1,193 2.7%Asian Alone 463 1.2% 594 1.4% 683 1.5%Pacific Islander Alone 27 0.1% 38 0.1% 42 0.1%Some Other Race Alone 8,938 22.5% 9,903 23.0% 10,248 22.9%Two or More Races 1,518 3.8% 1,711 4.0% 1,787 4.0%
Hispanic Origin (Any Race) 28,655 72.2% 31,432 73.0% 32,931 73.5%Data Note: Income is expressed in current dollars.
Source: U.S. Census Bureau, Census 2010 Summary File 1. Esri forecasts for 2017 and 2022.
August 28, 2017
©2017 Esri Page 3 of 6
Demographic and Income Profile6, Santa Fe, New Mexico, 87507 Prepared by EsriRing: 5 mile radius Latitude: 35.65797
Longitude: -106.03521
Summary Census 2010 2017 2022Population 72,332 77,056 80,262Households 30,138 32,045 33,425Families 17,282 17,950 18,531Average Household Size 2.37 2.37 2.37Owner Occupied Housing Units 18,776 19,729 20,627Renter Occupied Housing Units 11,362 12,316 12,798Median Age 38.0 39.5 40.0
Trends: 2017 - 2022 Annual Rate Area State NationalPopulation 0.82% 0.32% 0.83%Households 0.85% 0.26% 0.79%Families 0.64% 0.09% 0.71%Owner HHs 0.89% 0.27% 0.72%Median Household Income 1.83% 1.80% 2.12%
2017 2022 Households by Income Number Percent Number Percent
<$15,000 4,571 14.3% 4,682 14.0%$15,000 - $24,999 4,355 13.6% 4,239 12.7%$25,000 - $34,999 3,316 10.3% 3,107 9.3%$35,000 - $49,999 4,498 14.0% 4,197 12.6%$50,000 - $74,999 5,988 18.7% 6,026 18.0%$75,000 - $99,999 3,500 10.9% 3,966 11.9%$100,000 - $149,999 3,667 11.4% 4,560 13.6%$150,000 - $199,999 1,139 3.6% 1,393 4.2%$200,000+ 1,011 3.2% 1,256 3.8%
Median Household Income $46,927 $51,371Average Household Income $64,377 $72,726Per Capita Income $26,874 $30,295
Census 2010 2017 2022 Population by Age Number Percent Number Percent Number Percent
0 - 4 5,020 6.9% 4,883 6.3% 5,048 6.3%5 - 9 4,649 6.4% 4,653 6.0% 4,722 5.9%10 - 14 4,553 6.3% 4,602 6.0% 4,744 5.9%15 - 19 4,440 6.1% 4,448 5.8% 4,555 5.7%20 - 24 4,507 6.2% 5,045 6.5% 4,947 6.2%25 - 34 9,965 13.8% 10,445 13.6% 11,053 13.8%35 - 44 10,038 13.9% 9,855 12.8% 10,071 12.5%45 - 54 10,351 14.3% 9,900 12.8% 9,539 11.9%55 - 64 9,863 13.6% 10,620 13.8% 10,395 13.0%65 - 74 5,300 7.3% 7,912 10.3% 9,120 11.4%75 - 84 2,594 3.6% 3,370 4.4% 4,561 5.7%
85+ 1,050 1.5% 1,324 1.7% 1,507 1.9%Census 2010 2017 2022
Race and Ethnicity Number Percent Number Percent Number PercentWhite Alone 53,015 73.3% 55,355 71.8% 57,244 71.3%Black Alone 718 1.0% 949 1.2% 1,146 1.4%American Indian Alone 1,750 2.4% 2,083 2.7% 2,316 2.9%Asian Alone 928 1.3% 1,185 1.5% 1,385 1.7%Pacific Islander Alone 58 0.1% 82 0.1% 96 0.1%Some Other Race Alone 13,056 18.1% 14,266 18.5% 14,779 18.4%Two or More Races 2,807 3.9% 3,136 4.1% 3,297 4.1%
Hispanic Origin (Any Race) 45,034 62.3% 48,811 63.3% 51,373 64.0%Data Note: Income is expressed in current dollars.
Source: U.S. Census Bureau, Census 2010 Summary File 1. Esri forecasts for 2017 and 2022.
August 28, 2017
©2017 Esri Page 5 of 6
25
285