td - unctadunctad.org/en/docs/wpd188a2_en.pdfreport by the secretary-general of unctad annex ii:...
TRANSCRIPT

TRADE AND DEVELOPMENT BOARD Working Party on the Medium-term Plan and the Programme Budget Forty-seventh session Geneva, 11–15 September 2006 Item 3 of the provisional agenda
REVIEW OF TECHNICAL COOPERATION ACTIVITIES OF UNCTAD
Report by the Secretary-General of UNCTAD
Annex II: STATISTICAL TABLES
TD
United Nations Conference on Trade and Development
Distr. GENERAL TD/B/WP/188/Add.2 10 July 2006 ENGLISH ONLY
UNITED NATIONS
GE.06-51028

TD/B/WP/188/Add.2 Page 2 __________________________________________ Review of the Technical Cooperation Activities of UNCTAD
CONTENTS
Page
Tables
1. Evolution of UNCTAD’s technical cooperation, by source of funds, 2002–2005 ............... 3
2. Distribution of expenditures by interregional, regional and country activities, 2005 ................ 4
3. Expenditures by division and region, as of 31 December 2005 ........................................... 5
4. Technical cooperation related to least developed count ries, 2002–2005 ............................. 6
5. Projects financed by UN regular programme of technical cooperation and the Development Account, 2005 .................................................................................. 6
6. Associate Experts' expenditures in 2005 .............................................................................. 7
7. Projects by country/region and interregional, 2005 .............................................................. 8
8. UNCTAD Trust Fund contributions, 2002–2005 ............................................................... 20
Chart
1. Trends in mobilization of UNCTAD's technical cooperation, by source of funds, 1972–2005 .......................................................................................... 3
Notes
Ø All references to dollars ($) are to United States dollars.
Ø Details and percentages do not necessarily add up to totals, owing to rounding.
Ø The financial data in the tables on projects reflect the situation as at 31 December 2005. Early in 2006, budget figures were adjusted to reflect exact income. The negative amounts in the 2005 expenditures column pertain to the adjustments of prior-year accounts and/or savings on the liquidation of the prior year’s obligations.

TD/B/WP/188/Add.2 Annex I1: Statistical tables ________________________________________________________________________ Page 3
TABLE 1
Evolution of UNCTAD's technical cooperation, by source of funds, 2002–2005 (Actual project expenditures in thousands of dollars)
UNDP a Trust funds b
UN regular programme of
technical cooperation and
development account c Total
Year Amount % Amount % Amount % amount
2002 ......................... 3 386 15.5 15 336 70.3 3 110 14.2 21 832
2003 ......................... 4 887 17.6 19 919 71.7 2 982 10.7 27 788
2004 ......................... 2 565 8.5 26 289 85.2 1 739 6.3 30 594
2005.......................... 1 943 6.4 26 816 88.0 1 726 5.6 30 485
a UNDP-financed projects. b Voluntary contributions by member States and multilateral organizations. c Sections 22 and 34 of the United Nations regular budget.
CHART 1
Trends in mobilization of UNCTAD's technical cooperation, by source of funds, 1972–2005 (Percentage of total pr oject expenditures)
.
.
.
.
.
.
.
.
.
.
.
UNDP Trust funds Programme Budget

TD/B/WP/188/Add.2 Page 4 __________________________________________ Review of the Technical Cooperation Activities of UNCTAD
TABLE 2
Distribution of expenditures by interregional, regional and country activities, 2005 (In thousands of dollars and percentages)
2005
UNDP a Trust funds b
UN regular programme of
technical cooperation and
development account c Total
Amount % Amount % Amount % Amount %
Africa
Country ................. 615 2.0 2 861 9.4 - 3 476 11.4
Regional ................ 113 0.4 1 514 5.0 - 1 627 5.3
Subtotal ................ 728 2.4 4 375 14.4 - 5 103 16.7
Asia and Pacific
Country ................. 429 1.4 4 844 15.9 - 5 273 17.3
Regional ................ -1 0.0 703 2.3 - 702 2.3
Subtotal ................ 428 1.4 5 547 18.2 - 5 975 19.6
Latin America and the Caribbean
Country ................. 661 2.2 1 003 3.3 - 1 664 5.5
Regional ................ 0 0.0 601 2.0 - 601 2.0
Subtotal ................ 661 2.2 1 604 5.3 - 2 265 7.4
Europe
Country ................. 2 0.0 1 152 3.8 - 1 154 3.8
Regional ................ 0 0.0 1 0.0 - 1 0.0
Subtotal ................ 2 0.0 1 153 3.8 - 1 155 3.8
Interregional
Interregional ......... 124 0.4 14 137 46.4 1 726 5.7 15 987 52.4
Subtotal
Interregional ......... 124 0.4 14 137 46.4 1 726 5.7 15 987 52.4
Country ................. 1 707 5.6 9 860 32.3 11 567 37.9
Regional ................ 112 0.4 2 819 9.2 2 931 9.6
TOTAL ................... 1 943 6.4 26 816 88.0 1 726 5.7 30 485 100.0
a UNDP-financed projects. b Voluntary contributions by member States and multilateral organizations. c Sections 22 and 34 of the United Nations regular budget.

TD/B/WP/188/Add.2 Annex I1: Statistical tables ________________________________________________________________________ Page 5
TABLE 3
Expenditures by division and region, as of 31 December 2005 (In thousands of dollars)
Division/Programme Africa
Asia and
Pacific
Latin America
and Caribbea
n Europe Inter-
regional Total
Percent -age of
total
Division on Globalization and Development Strategies (GDS) ....................................... 372 259 291 34 3 250 4 206 14
Macroeconomic and development policies ..................... - - - - 303 303 1 DMFAS Programme ........................................................ 372 231 291 34 2 944 3 871 13 Special programmes ........................................................ - 29 - - 3 32 0
Division on International Trade in Goods and Services, and Commodities (DITC) ......................... 1 255 1 439 570 - 5 616 8 880 29
Trade analysis .................................................................. - - - - 414 414 1 Trade negotiations and commercial diplomacy................ 1 171 227 343 - 2 374 4 115 13 Trade analysis and information ....................................... - - - - 124 124 0 Commodities ................................................................... 53 - - - 442 495 2 Trade, environment and development ............................. 30 1 212 227 - 1 763 3 233 11 Competition law and policy and consumer protection .... - - - - 499 499 2
Division on Investment, Technology and Enterprise Development (DITE) ............................. 320 87 201 79 3 284 3 972 13
Investment issues analysis ................................ ............... - - - 1 693 694 2 Other DITE ...................................................................... - - 73 - 137 210 1 Policy and capacity building ........................................... 320 87 114 78 2 363 2 962 10 Investment, enterprise and competitiveness .................... - - 14 - 92 106 0
Division for Services Infrastructure for Development and Trade Efficiency (SITE) .............. 3 157 4 173 1 202 1 041 1 610 11 182 37
Trade logistics ................................................................ 7 343 - - 488 839 3 ASYCUDA ...................................................................... 3 101 3 343 1 202 1 041 86 8 772 29 Information and training ................................................. 48 488 - - 874 1 410 5 Trade Points ..................................................................... - -1 - - 40 39 0 Electronic commerce ....................................................... - - - - 122 122 0
Least Developed, Landlocked and Island Developing Countries (LDCs) ............................. - 16 2 0 1 110 1 128 4
UN regular programme of technical cooperation (section 22) ....................................................................... - - - - 814 814 3
Executive Direction and Management (EDM), and Support Services ....................................................... - - - - 228 228 1
Resource Management Service .......................................... - - - - 75 75 0
T O T A L .......................................................................... 5 103 5 975 2 266 1 155 15 987 30 485 100

TD/B/WP/188/Add.2 Page 6 __________________________________________ Review of the Technical Cooperation Activities of UNCTAD
TABLE 4
Technical cooperation related to least developed countries, 2002–2005 (In thousands of dollars and percentages)
2002 2003 2004 2005
(1) Country projects in LDCs ................................................................................................2 792 2 886 2 676 3 594
(2) Estimate of inter-country project expenditures directed towards LDCs a ......................3 535 5 877 7 739 7 800
(3) Total expenditures related to LDCs ..................................................................................6 327 8 763 10 415 11 394
(4) Total UNCTAD technical cooperation expenditures .......................................................21 832 27 788 30 594 30 485
(5) Share of LDCs in UNCTAD’s technical cooperation, i.e. (3) / (4) (percentage) .............29 32 34 37
a Secretariat estimate. This calculation was reached as follows: actual expenditures on inter -country projects concerning exclusively LDCs; plus for all other inter-country projects, 30% of interregional project expenditures; 60% of project expenditures in Africa; and 20% of project expenditures in Asia and the Pacific, and 5% of project expenditures in Latin America and the Caribbean, and the Arab States.
TABLE 5
Projects financed by UN regular programme of technical cooperation and the Development Account, 2005
(In dollars)
Project No. Title Duration Division Source of funds Total
income 2002–2005
Allotment 2004–2005
Expenditures in 2005
ROA-2180 (A) Promotion of electronic commerce ........ 2000–05 SITE Development Account 798 150 0 0
ROA-2062 (M2) Sustained resource-based development .. 2000– DITC Development Account 320 910 47 478 17 737
ROA-2072 (N2) Integration in multilateral trading system .. 2000– DITC Development Account 142 233 22 363 1 784
ROA-2064 (O2) Debt sustainability analysis ................... 2000– GDS Development Account 203 207 51 931 30 772
ROA-2076 (P2) Diversification and commodity-based development ........... 2000– DITC Development Account 237 556 133 357 64 722
ROA-2074 (J3) Key issues on the international economic agenda ............................... 2002– SITE Development Account 996 983 437 781 88 843
ROA-2106 (K3) Developing countries to attract and benefit from international investment ... 2002– DITE Development Account 958 600 155 013 8 338
ROA-2166 (L3) Dispute settlement in international trade, investment and intellectual property ..... 2002– DITC Development Account 418 061 68 735 40 760
ROA-2076 (M3) Competition law and policy .................. 2002– DITC Development Account 392 780 36 563 -3 582
ROA-2084 (K4) Capacity building for debt sustainability . 2004- GDS Development Account 189 786 640 000 189 786
ROA-2166 (L4) Meeting Millennium development goals through policies and actions ................. 2004- DITC Development Account 179 213 640 000 179 213
ROA-2180 (M4) Trade and transport facilitation .............. 2004- SITE Development Account 158 637 640 000 107 037
ROA-2106 (N4) Investment promotion through public-private partnerships .................... 2004- DITE Development Account 200 806 650 000 186 344
UND12-340 UN regular programme of technical cooperation ......................................... 2000– All UN regular programme 4 025 480 1 951 300 814 110
TOTAL ............................................. 9 222 402 5 474 521 1 725 864

TD/B/WP/188/Add.2 Annex I1: Statistical tables ________________________________________________________________________ Page 7
TABLE 6
Associate Experts' expenditures in 2005 (in dollars)
Project No. Short title Division Source of funds Expenditures
in 2005
INT/02/X21 UNCTAD/UNDP Global Programme ................... EDM Belgium 80 016
INT/03/X46 Least Developed Countries..................................... LDC Belgium 94 840 INT/02/X37 Trade Negotiations and Commercial Diplomacy .. DITC France 53 634
INT/02/X10 Least Developed Countries .................................... LDC Germany 42 816 INT/04/X36 TrainForTrade ........................................................ SITE Germany 79 981
INT/05/X59 Investment Promotion............................................. DITE Germany 29 109
INT/00/X64 NGOs/Civil Society ............................................... EDM Italy -6 828 INT/03/X44 Investment Policy Review ..................................... DITE Italy 90 627
INT/04/X45 Commodity information and risk management...... DITC Italy 92 875 INT/05/X26 Macroeconomic and development policies............ GDS Italy 39 411
INT/03/X08 Investment Promotion ............................................ DITE Netherlands 85 101 INT/04/X27 Trade, Environment and Development................... DITC Netherlands 77 854
TOTAL ................................ ................................ . 759 436
Note: An additional Associate Expert, financed by France, is posted in the Lao People's Democratic Republic in the framework of the TrainForTrade programme (SITE).

TD/B/WP/188/Add.2 Page 8 __________________________________________ Review of the Technical Cooperation Activities of UNCTAD
TABLE 7
Projects by country/region and interregional, 2005 (In dollars)
Short title Project number Division Source
of fund
Total income
2002 –2005 a
Allotment 2005
Expenditures
in 2005
AFRICA
Algeria
Examen des Politiques de l'Investissement de l'Algérie ........... ALG/02/007 DITE UNDP 94 540 0 -5 322 Renforcement des capacités de gestion de la dette de la Banque d'Algérie .........................................................
ALG/0T/4AC
GDS
Central Bank of Algeria 132 249 115 206 68 352
Angola Angola enterprise programme: support to the development of the micro-enterprise sector in Angola .................................... ANG/03/011 DITE UNDP 306 115 362 727 186 710
Benin Migration to ASYCUDA++ ................................................. BEN/0T/1AR SITE Benin 174 302 64 279 65 744 Botswana Implementation of ASYCUDA ............................................. BOT/0T/1AL SITE Botswana 745 002 144 000 152 234
Advisory services and capacity building in investment promotion BOT/02/U01 DITE UNDP 67 109 81 628 5 922 Burkina Faso Migration to ASYCUDA++ ................................................. BKF/0T/1BS SITE Burkina Faso 132 417 0 -4 Burundi
Renforcement des capacités de gestion de la dette .................. BDI/0T/0AN GDS Burundi 4 063 0 -1 029 Migration to ASYCUDA++ ................................................. BDI/0T/2CH SITE Burundi 478 184 147 753 163 301 Cameroon Migration to ASYCUDA++ ................................................. CMR/0T/2CR SITE Cameroon 634 176 223 030 235 742
Cape Verde Migration au système SYDONIA ++ .................................... CVI/0T/0BA SITE Cape Verde 120 767 31 047 33 025 Central African Republic
Information de la gestion de la dette extérieure ....................... CAF/9X/53V GDS Central African Republic 1 777 5 547 4 881
Migration au système SYDONIA++ .................................... CAF/0T/3AX SITE Central African Republic 436 835 106 000 108 839
Chad Renforcement des capacités de gestion de la dette .................. CHD/0T/0AB GDS Chad 2 672 4 639 3 930 Congo Installation du système SYDONIA++ ................................... PRC/0T/2BW SITE Congo 644 077 62 414 70 078 Renforcement des capacités de gestion de la dette .................. PRC/0T/3AJ GDS Congo 112 795 53 525 42 226 Côte d'Ivoire
Implémentation de ASYCUDAWorld en Côte d'Ivoire ........... IVC/0T/4BV SITE Côte d'Ivoire 599 670 281 650 298 333 Democratic Republic of the Congo Renforcement des capacités de gestion de la dette à l'office de gestion de la dette publique ...................................................
ZAI/0T/4CB
GDS
Democratic Republic of the Congo 121 278 87 610 99 414
Djibouti
Promotion des investissements - assistance à l'ANPI services .. DJI/98/005 DITE UNDP 71 772 16 232 14 910 Renforcement de la capacité de gestion de la dette publique .... DJI/0T/2AY GDS Djibouti 87 960 19 557 18 412 Ethiopia Migration to ASYCUDA ++ ................................ ................ ETH/02/019 SITE UNDP 365 699 174 252 117 937
Installation of DMFAS 5.3 - Capacity Building in Debt and Financial Management ........................................................ ETH/0T/4BE GDS Netherlands 98 541 79 646 13 691
(for note see end of table)

TD/B/WP/188/Add.2 Annex I1: Statistical tables ________________________________________________________________________ Page 9
TABLE 7 (continued)
Projects by country/region and interregional, 2005 (In dollars)
Short title Project number Division Source
of fund
Total income
2002 –2005 a
Allotment 2005
Expenditures
in 2005
Gabon Renforcement des capacités de gestion de la dette .................. GAB/0T/1AZ GDS Gabon 15 536 44 292 13 055 Implementation of ASYCUDA++ System ............................. GAB/0T/1CU SITE Gabon 612 453 10 295 -7 409 Support to Gabonese Customs for the Extension of ASYCUDA GAB/0T/4AX SITE Gabon 151 637 16 852 10 263
Kenya Enhancing capacities through trade expansion and diversification KEN/04/102 DITC UNDP 132 603 168 564 117 525 Enhancing foreign direct investment in Kenya ....................... KEN/04/106 DITC UNDP 106 377 86 820 90 880 Madagascar
Appui au développement du commerce extérieur .................... MAG/9X/8AQ DITC France 4 279 6 361 -170
Migration to ASYCUDA++ ................................................. MAG/0T/2BY SITE Madagascar 581 257 244 990 262 579
Malawi ASYCUDA ........................................................................ MLW/9X/8A
U SITE United
Kingdom 613 232 105 979 86 746 Mali
Migration à SYDONIA++ .................................................... MLI/0T/2AT SITE Mali 309 957 14 815 16 149 Mauritania Migration to ASYCUDA++ System ...................................... MAU/0T/1CJ SITE Mauritania 306 090 5 840 6 369 Namibia
Migration to ASYCUDA++ ................................................. NAM/0T/2AI SITE Namibia 945 874 183 309 198 878 Niger Migration au système SYDONIA++ ................................ ..... NER/0T/1BT SITE Niger 20 124 15 669 17 724 Nigeria Investment policy review of Nigeria ................................ ..... NIR/05/001 DITE UNDP 70 276 108 000 70 276 Implementation of ASYCUDA++ in the Nigeria Customs Service . NIR/0T/5AB SITE Nigeria 3 007 594 254 000 122 457 Rwanda
Migration to ASYCUDA++ ................................................. RWA/0T/2BX SITE DFID 1 647 071 318 500 309 027 Investment Policy Review in Rwanda ................................... RWA/0T/4CJ DITE Germany 144 059 59 500 47 708 Somalia Assistance to the Bari Regional Administration....................... SOM/9X/66S SITE EC 5 643 0 11 553
Sudan Migration to AS YCUDA++ ................................................. SUD/0T/3AS SITE Sudan 365 441 28 080 29 555 Capacity Building in Debt and Financial Management ........... SUD/0T/4BG GDS Norway 351 041 303 716 45 763 Togo
Migration to ASYCUDA++ ................................................. TOG/0T/2AN SITE Togo 316 790 26 425 29 028 Renforcement des capacités de gestion de la dette .................. TOG/03/001 GDS UNDP 99 696 44 925 29 174 Tunisia Programme de formation portuaire pour la Tunisie (TRAINFORTRADE) .........................................................
TUN/0T/2CF
SITE
Office de la Marine Marchande et des Ports de Tunisie 36 537 0 -1 135
Uganda Migration to ASYCUDA ++ Customs Modernization Programme .......................................................................................... UGA/0T/1AP SITE Uganda 173 005 15 423 16 694
Implementation of DMFAS in the Treasury Office of Accounts of the Ministry of Finance .................................................... UGA/0T/2BK GDS Uganda 100 712 24 318 5 924 BIOTRADE Initiative in Uganda .......................................... UGA/0T/4BT DITC Norway 208 143 79 500 30 368
United Republic of Tanzania ASYCUDA ........................................................................ URT/98/009 SITE UNDP 9 570 0 -13 495 Migration to ASYCUDA++ ................................................. URT/0T/2CY SITE Tanzania 547 971 195 965 205 709
(for note see end of table)

TD/B/WP/188/Add.2 Page 10_________________________________________ Review of the Technical Cooperation Activities of UNCTAD
TAB LE 7 (continued)
Projects by country/region and interregional, 2005 (In dollars)
Short title Project number Division Source
of fund
Total income
2002 –2005 a
Allotment 2005
Expenditures
in 2005
Zambia Implementation of DMFAS 5.1............................................. ZAM/9X/9D
L GDS Zambia 14 361 14 066 13 968 Migration to ASYCUDA++ ................................................. ZAM/0T/1AW SITE United
Kingdom 123 103 0 -703
Zimbabwe Implementation of DMFAS 5.1 ............................................ ZIM/9X/9DN GDS Zimbabwe 22 623 23 347 13 816
Subtotal country projects 16 475 054 4 460 293 3 475 602
Regional Africa Support to the Arab States in their pursuit of economic and social reform and multilateral economic cooperation ............... RAB/96/001 DITC UNDP 4 663 0 123
Développement de marchés des assurances compétitifs ........... RAF/9X/43J DITE Luxembourg 4 209 0 -4 778 Capacity building for trade and development in Africa ............ RAF/96/001 DITC UNDP 191 427 0 169 ACIS RailTracker in Southern Africa (Rolling Stock Information System) ............................................................ RAF/9X/9DB SITE USAID 39 624 0 -5
Mise en place de capacités de formation du commerce international (TRAINFORTRADE) ...................................... RAF/9X/9DC SITE France 13 387 0 -5 069 SYDONIA v 2.7 (pays de la CEDEAO et Centre Informatique Communautaire de la CEDEAO (CIC)) ................................. RAF/9X/9DD SITE ECOWAS 467 0 -101
Improving oil and gas trade and finance in Africa ................... RAF/9X/9DE DITC Multidonors 198 700 18 578 26 147 Programme de Renforcement des Capacités de Formation Portuaire ............................................................................ RAF/0T/2AC SITE Multidonors 94 519 8 040 -3 644 Migration to ASYCUDA system from version 2.7 to ASYCUDA++ in ECOWAS ................................ ................ RAF/0T/2AG SITE ECOWAS 91 974 17 496 19 804
Technical assistance on ASYCUDA V2.7 .............................. RAF/0T/2AW SITE COMESA 58 394 3 646 1 978 Commercial Diplomacy and WTO Accession of Portuguese-speaking countries .............................................................. RAF/0T/2BR DITC Portugal 40 162 0 -5 978
Formation portuaire pour les Pays Africains de Langue Officielle Portugaise ............................................................ RAF/0T/2BT SITE PALOP 52 189 0 -1 893 Joint Integrated Technical Assistance Programme Phase II ...... RAF/0T/3AI DITC WTO/ITC/
UNCTAD 2 307 396 949 092 855 845
Improvement of the Sustainability of Cotton Production in West Africa . RAF/0T3AR DITC Common Fund for Commodities 69 043 29 870 27 279
Creation of a Regional ASYCUDA Centre for Africa ............. RAF/0T/3BX SITE France 538 203 181 292 199 949 Trade Capacity Development for Sub-Saharan Africa ............. RAF/04/006 DITC UNDP 145 865 181 800 112 406 ACIS RoadTracker in UEMOA ............................................ RAF/0T/4BH SITE UEMOA 157 357 15 955 594 COMESA regional support project for ASYCUDA++ ............. RAF/0T/4BM SITE EC 401 463 372 574 344 657
Strengthening the Capacity of Academic Institutions in the Area of International Commodity Trade ......................................... RAF/0T/5AL SITE Japan 1 932 106 195 59 890
Subtotal regional Africa 4 410 972 1 884 538 1 627 373
TOTAL AFRICA ............................................................ 20 886 026 6 344 831 5 102 975
ASIA AND THE PACIFIC
Afganistan Emergency Customs Modernization and Trade Facilitation Project in Afghanistan ........................................................ AFG/0T/4CE SITE World Bank 3 971 318 1 691 800 1 161 967
(for note see end of table)

TD/B/WP/188/Add.2 Annex I1: Statistical tables _______________________________________________________________________ Page 11
TABLE 7 (continued)
Projects by country/region and interregional, 2005 (In dollars)
Short title Project number Di vision Source
of fund
Total income
2002 –2005 a
Allotment 2005
Expenditures
in 2005
Bangladesh CAM I Implementation of ASYCUDA ................................. BGD/0T/0BK SITE Bangladesh 674 787 0 -7 636 Trade-related technical assistance: Pre-Cancún Package .......... BGD/0T/3BA DITC EC 783 001 16 390 181 790 India
TRIPS & Access to life saving drugs - implications for India.... IND/0T/2AA DITC UNAIDS 105 546 0 -19 314 Strategies and preparedness for trade and globalization in India IND/0T/2CC DITC DFID 4 175 006 1 595 924 1 231 741 Indonesia Implementation of DMFAS 5.1 ............................................ INS/8X/8DS GDS Australia 4 703 0 -280
Implementation of DMFAS 5.3 ............................................ INS/0T/3BI GDS Indonesia 180 249 105 600 60 371 Iran (Islamic Republic of) ACIS in Iran (PortTracker) .................................................. IRA/99/008 SITE UNDP 269 493 0 -2 259
Implementation of e-customs ASYCUDAWORLD in the Islamic Republic of Iran ...................................................... IRA/05/755 SITE UNDP 108 980 139 091 108 980 Lebanon Completion of the implementation of ASYCUDA++ in Lebanon LEB/0T/2BI SITE EC 113 618 59 546 11 055
Mongolia Supply, installation and support of a Debt Recording System ... MON/0T/1BI GDS Mongolia 11 081 11 415 881 New Caledonia Implementation of ASYCUDA++ in the Customs Administration of New Caledonia .........................................
NCA/0T/3AU
SITE
New Caledonia 1 671 419 676 000 600 026
Nepal Promotion of the trade and transport sectors of Nepal ............. NEP/9X/78G SITE Nepal 437 285 0 -41 505
Pakistan Promotion of the trade and transport sectors ........................... PAK/9X/9DX SITE Pakistan 2 008 620 421 900 390 575 Trade related technical assistance for Pakistan ........................ PAK/0T/4CI DITC EC 79 706 73 280 55 774
Palestinian People Capacity building in debt and financial management ............... PAL/0T/0AH GDS Norway 289 522 241 795 66 651 ASYCUDA++ Phase II - Pilot Site Implementation ................ PAL/0T3BM SITE EC 743 512 181 445 193 044 Institutional Support and Capacity Building for Investment Retention ................................ ................................ ........... PAL/0T/3BZ DITE Norway 95 521 54 330 -4 724
Integrated Framework for Palestinian Macroeconomic, Trade and Labour Policy ............................................................... PAL/0T/4CA GDS
Canada/IDRC 74 896 36 575 28 575
Support for Palestinian Small and Medium Enterprises Development – Emergency Assistance to Empretec Palestine ... PAL/0T5AF DITE PFESP 127 201 110 708 91 269
ASYCUDA Special Technical Assistance for Rollout at Rafah Border................................ ................................ ................ PAL/0T5BA SITE EC 192 557 36 860 39 731 Papua New Guinea Installation of the Automated System for Customs Data in Papua New Guinea ..............................................................
PNG/0T/4AP
SITE
Papua New Guinea 497 646 319 793 310 715
Philippines
ASYCUDA ........................................................................ PHI/9X/43G SITE Philippines 113 755 98 238 50 637 Saudi Arabia Institutional support to Saudi Arabian General Investment Authority (SAGIA) ............................................................. SAU/01/006 DITE UNDP 50 633 0 219
Sri Lanka Customs modernization programme Migration to ASYCUDA++ .................................................................... SRL/9X/792 SITE Sri Lanka 8 406 18 838 9 762
Syrian Arab Republic ASYCUDA Implementation in Syria .......................................... SYR/0T/4BP SITE Syria 1 017 343 416 466 432 719
(for note see end of table)

TD/B/WP/188/Add.2 Page 12_________________________________________ Review of the Technical Cooperation Activities of UNCTAD
TABLE 7 (continued)
Projects by country/region and interregional, 2005 (In dollars)
Short titl e Project number Division Source
of fund
Total income
2002 –2005 a
Allotment 2005
Expenditures
in 2005
Timor-Leste ASYCUDA ........................................................................ TIM/02/015 SITE UNDP 381 861 49 859 31 359 Viet Nam Capacity Development for Effective and Sustainable External Debt VIE/01/U10 GDS UNDP,
Australia, Switzerland 212 371 123 305 103 207
Yemen Implementation of ASYCUDA in Yemen Phase II ................ YEM/03/009 SITE UNDP 402 788 217 273 187 885
Subtotal country projects 18 802 823 6 696 431 5 273 215
Regional Asia and the Pacific Assistance to Countries of the Asian Region on MFN and Preferential Tariffs Negotiations ................................ ........... RAS/9X/78R DITC Japan 523 565 0 -10 572
Computerization of Customs Data and External Trade Statistics RAS/9X/8B2 SITE Australia 26 188 0 -20 962 Strengthening Trade Points in Asia/Pacific for Regional Cooperation ........................................................................ RAS/99/064 SITE UNDP 277 936 4 300 -861
Support to the Forum Secretariat .......................................... RAS/0T/0AC LDC Ireland 6 481 17 931 16 278 ASYCUDA implementation and support in the Asia/Pacific region ................................ ................................ ................ RAS/0X/0DX SITE Multildonor 345 794 127 704 44 006 International Multimodal Transport Operations in the ECO Region: Trade Facilitation Component .................................. RAS/0T/1BR SITE IDB-ECO 21 690 25 950 -3 431
ASYCUDA Support Mechanism for the Pacific ..................... RAS/0T/1DA SITE Fiji, Samoa, Vanuatu, AUSAID 964 138 220 778 189 618
Strengthening capacity of the trade support institutions in Asian LDCs ................................................................................. RAS/0T/2BL SITE Japan 21 086 88 058 74 933 Capacity Building in the Field of Training for International Trade (TrainForTrade) ......................................................... RAS/0T/2CK SITE France 1 375 852 457 594 412 584
Subtotal regional projects 3 562 731 942 315 701 593
TOTAL ASIA AND THE PACIFIC .............................. 22 365 554 7 638 746 5 974 808
LATIN AMERICA AND THE CARIBBEAN
Barbados Simplification of Customs Procedures and Data Using ASYCUDA++ .................................................................... BAR/0T/1BY SITE Barbados 587 766 203 719 208 563 Bolivia
Strengthening investment promotion Implementation of the National Investment Promotion Strategy ................................ BOL/9X/9BL DITE Switzerland 773 381 102 850 102 975 Apoyo a la implementación del systema aduanero automatizado SIDUNEA ......................................................................... BOL/00/002 SITE UNDP 418 957 10 009 9 749
Integración de la gestión de la deuda .................................... BOL/0T/0AK GDS Bolivia 61 932 0 -95 Brazil Promotion of Inter -Firm Cooperation in Nort h-East Brazil ...... BRA/0T/4CG DITE GTZ 659 330 371 328 72 805
Colombia Investment Policy Review of Colombia ................................ COL/02/014 DITE UNDP 41 758 8 758 4 093 Costa Rica Desarrollo de un Programa Nacional de Biocomercio en Costa Rica COS/0T/5AA DITC Switzerland 72 320 64 000 53 640
Dominican Republic Control y administración del endeudamiento externo .............. DOM/9X/53
X GDS Dominican
Republic 13 246 34 404 11 701
(for note see end of table)

TD/B/WP/188/Add.2 Annex I1: Statistical tables _______________________________________________________________________ Page 13
TABLE 7 (continued)
Projects by country/region and interregional, 2005 (In dollars)
Short title Project number Division Source
of fund
Total income
2002 –2005 a
Allotment 2005
Expenditures
in 2005
Implantación del SIGADE en la Secretaría de Estoea de Finanzas .. DOM/0T/2BJ GDS Inter-American Development Bank 206 896 54 033 25 399
Ecuador Improving Ecuador's Investment Framework and designing an investment promotion plan ................................................... ECU/0T/1BU DITE Switzerland 8 256 10 970 -1 656 Guyana
EMPRETEC Guyana ................................ ........................... GUY/01/002 DITE UNDP 64 050 21 697 15 404 Haiti Migration au système SYDONIA++ ................................ ..... HAI/0T/2AM SITE Haiti 209 924 52 915 38 935
Honduras Fortalecimiento de las capacidades para la gestión de la deuda en Honduras ....................................................................... HON/0T/4AH GDS Honduras 336 457 160 500 164 187 Netherlands Antilles
Simplification of Customs Procedures and Data Using ASYCUDA++ .................................................................... NAN/0T/1BX SITE Netherlands 727 798 77 162 64 949 Panama Cooperación técnica para apoyar el programa sectorial financiero .. PAN/98/002 GDS UNDP 237 317 40 446 23 928 Paraguay Control y administración del endeudamiento público .............. PAR/95/003 GDS UNDP 64 774 117 207 10 380 Peru Strengthening Investment Promotion in Peru .......................... PER/0T/5AX DITE Spain 142 287 123 894 8 198 Saint Lucia Support to the sustainable development of trade in goods and services .............................................................................. STL/9X/9DI LDC Ireland 917 6 485 2 260
Simplification and Computerisation of Customs Procedures and Data Using ASYCUDA++ ................................................... STL/0T/3AT SITE Saint Lucia 271 683 139 113 135 890 Trinidad and Tobago Simplification of Customs Procedures and Data Using ASYCUDA++ ....................................................................
TRI/0T/1BW
SITE
Trinidad and Tobago 586 131 95 709 66 081
Installation of DMFAS 5.2 Capacity building in debt and financial management ..........................................................
TRI/0T/2AB
GDS
Trinidad and Tobago 130 335 41 439 40 501
Venezuela Gestión de la deuda en Venezuela ......................................... VEN/9X/9DW GDS Venezuel a 27 748 15 057 14 543 Apoyo a la Modernización del Sistema Aduanero ................... VEN/01/013 SITE UNDP 2 009 581 636 226 596 983
Assistance to the Venezuelan Government on WTO issues ...... VEN/0T/0CJ DITC Venezuela 7 237 0 -5 183
Subtotal country projects 7 660 080 2 387 921 1 664 230
Regional Latin America Empresa y tecnología para el siglo XXI ................................. RLA/9X/66O DITE Spain 1 740 0 -932
BIOTRADE Initiative in the Amazon .................................... RLA/99/050 DITC UNFIP 864 265 0 -1 841 ASYCUDA Regional Support for the Americas ..................... RLA/0T/3AD SITE National
Governments 414 565 72 600 80 485
Strengthening Institutional and Capacity Building in the Area of Competition and Consumer Law and Policy in Latin American Countries ...................................... RLA/0T/3BF DITC Switzerland 1 870 000 900 040 348 071 BIOTRADE Initiative in the Amazon, phase II ...................... RLA/04/339 DITC UNFIP 175 552 429 345 175 552
Subtotal regional Latin American 3 326 122 1401 985 601 335
TOTAL LATIN AMERICAN AND THE CARIBBEAN 10 986 202 3 789 906 2 265 565
(for note see end of table)

TD/B/WP/188/Add.2 Page 14_________________________________________ Review of the Technical Cooperation Activities of UNCTAD
TABLE 7 (continued)
Projects by country/region and interregional, 2005 (In dollars)
Short title Project number Division Source
of fund
Total income
2002 –2005 a
Allotment 2005
Expenditures
in 2005
EUROPE
Albania
Computerization of Customs Procedures and Data Processing Using ASYCUDA++ ................................ ........................... ALB/0T/1BZ SITE EC 767 044 0 -9 688 ASYCUDA technical and functional training ......................... ALB/0T/3AZ SITE World Bank 26 582 23 103 25 880 ASYCUDA Technical Assistance for Roll-Out of Asycuda++ in Albania (Phase 2) ................................ ................................ ALB/0T/4CK SITE EC 415 230 141 740 143 511
Bosnia and Herzegovina Technical Assistance on ASYCUDA Aspects of the Merger of the Customs Administration of Bosnia and Herzegovina ......... BIH/0T/4BA SITE EC 698 485 126 328 111 993
Technical Assistance on ASYCUDA Aspects of the Merger of the Customs Administration of Bosnia and Herzegovina .......... BIH/0T/5AI SITE EC 741 385 216 160 208 542 Georgia
Strengthening the external debt management capacity ............. GEO/98/008 GDS UNDP 23 408 2 405 1 991 Lithuania Agreement for ASYCUDA++ service, technical assistance and support .............................................................................. LIT/0T/2CB SITE Lithuania 199 775 18 247 15 166
Republic of Moldova Implementation of ASYCUDA .............................................. MOL/0T/3BC SITE World Bank 714 252 317 028 351 412 Implementation of DMFAS version 5.3.................................. MOL/0T/4CP GDS Sweden 81 520 39 536 32 370 Romania
EMPRETEC Phase I Pilot Phase through an EMPRETEC National Centre in Romania .................................................
ROM/0T/1CZ
DITE
Romania, Italy 521 423 160 810 78 360
Slovakia ASYCUDA++ technical assistance and support - .................... SLO/0T/4AD SITE Slovakia 164 920 139 917 149 486 The former Yugoslav Republic of Macedonia ASYCUDA Technical Assistance for Transit and Selectivity ... MCD/0T/3BP SITE The FYR of
Macedonia 107 853 49 758 44 449
Subtotal country project 4 461 877 1 235 032 1 153 472
Regional Europe Raising awareness of foreign direct investment issues in Poland RER/9X/54Z DITE Poland 1 776 8 544 1 113
Subtotal Regional Europe 1 776 8 544 1 113
TOTAL EUROPE ................................ ........................... 4 463 653 1 243 576 1 154 585
INTERREGIONAL
Globalization, liberalization and sustainable human development GLO/98/615 EDM UNDP -3 096 0 497 Globalization liberalization and Sustainable Development PHASE II GLO/01/615 EDM UNDP 5 634 100 655 81 721 Follow-up of Round Table Pilot Phase-Integrated Framework in Uganda .............................................................................. GLO/02/G04 DITC UNDP 30 276 0 -529
ICT TASK FORCE.............................................................. GLO/02/X02 SITE DESA 10 338 17 000 10 338 Course on Improving Port Performance (IPP) ........................ INT/8X/301 SITE Multidonors 11 220 2 142 90 Training programme on RBPs (competition policies) .............. INT/8X/603 DITC France,
Norway, Sweden, SIDA 1 096 744 205 653 218 829
STRATSHIP: Strategic planning course................................. INT/8X/80C SITE Norway 2 545 14 905 1 996 Studies for the G-24 ............................................................ INT/8X/90F GDS Multidonors 3 501 6 890 190
for note see end of table)

TD/B/WP/188/Add.2 Annex I1: Statistical tables _______________________________________________________________________ Page 15
TABLE 7 (continued)
Projects by country/region and interregional, 2005 (In dollars)
Short title Project number Division Source
of fund
Total income
2002 –2005 a
Allotment 2005
Expenditures
in 2005
TRAINS: Development and dissemination of selected computerized trade data ....................................................... INT/9X/00J DITC Multidonors 226 883 44 814 50 518 Training in the field of foreign trade ...................................... INT/9X/00L SITE France 781 995 141 796 119 720 Negotiations for a GSTP among developing countries ............. INT/9X/00M DITC Multidonors 1 129 561 512 500 318 665
TrainForTrade Trust Fund .................................................... INT/9X/10U SITE Multidonors 285 797 79 502 37 083 Reconciliation of environmental and trade policies ................. INT/9X/219 DITC Netherlands,
Norway 83 624 13 039 -29 579 Introduction of multimodal transport and microcomputer software programmes .......................................................... INT/9X/31Y SITE Multidonors 20 561 30 698 7 622
United Nations Trust Fund on Transnational Corporations ....... INT/9X/325 DITE Multidonors 185 259 38 500 31 625
Research on foreign direct investment in services .................... INT/9X/326 DITE Republic of Korea 1 070 6 979 7 882
Collection and dissemination of iron ore statistics ................... INT/9X/42Z DITC Multidonors 247 771 67 220 75 899 Strengthening the debt management capacity of developing countries ............................................................................ INT/9X/542 GDS Switzerland 93 265 0 -1 517
Strengthening competition policy and legislation in developing countries and countries in transition ...................................... INT/9X/65I DITC Netherl ands 798 908 4 576 -33 593 Commodity risk management and finance .............................. INT/9X/65N DITC Multidonors 111 901 36 469 39 337 Technical cooperation on market access, trade laws and preferences .........................................................................
INT/9X/77I
DITC
Italy, China, EC 62 281 0 -1 591
Trust Fund for Least Developed Countries: core project .......... INT/9X/77J LDC Multidonors 3 119 052 1 638 957 840 446 Multilateral framework on investment .................................... INT/9X/77L DITE Multidonors 23 161 0 154
Quick response window for ASIT ......................................... INT/9X/77S DITE Switzerland 1 116 896 677 234 271 004 Biotrade initiative programme .............................................. INT/9X/77V DITC Multidonors 14 619 14 430 4 899 Support for ASYCUDA implementation activities .................. INT/9X/89S SITE Multidonors 40 006 75 878 63 238
Mediterranean 2000 ............................................................ INT/9X/89Y DITE Italy 36 000 68 435 46 260 Investment Guides and Capacity Building for Least Developed Countries ................................ ................................ ........... INT/9X/8A2 DITE Multidonors 1 670 336 454 289 437 521 Support for ASYCUDA implementation activities .................. INT/9X/8A3 SITE Multidonors 202 405 26 416 20 276
Study of international cooperation networks in the area of science and technology ........................................................ INT/9X/8A5 DITE Austria 22 828 16 190 16 950 Agricultural Trade Policy Simulation Model .......................... INT/9X/8A7 DITC United
Kingdom 34 541 6 548 4 149
Strengthening research and policy-making capacity on trade and environment in developing countries......................................
INT/9X/8A8
DITC
United Kingdom 5 884 0 -2 373
Needs assessment to attract Asian FDI investment to Africa (Phase I) ............................................................................ INT/99/921 DITE UNDP 40 066 35 132 8 132
Support to the World Association of Investment Promotion Agencies (WAIPA) ............................................................. INT/9X/9C1 DITE WAIPA 414 459 188 000 135 251 L'intelligence économique au service des plus démunis ........... INT/9X/9C2 DITC France 360 519 97 436 42 940
Micro-Bank ........................................................................ INT/9X/9C5 DITE Luxembourg 9 903 0 -1 011 Civil Society preparation for UNCTAD Conferences .............. INT/9X/9CC EDM Multidonors 1 255 3 223 2 358 UNCTAD trust fund project for WTO accession .................... INT/9X/9CD DITC United
Kingdom 1 427 340 531 824 578 464
ASYCUDA: passage à l’an 2000 .......................................... INT/9X/9CH SITE France 14 126 0 -481 Soutien aux administrations des douanes des pays utilisateurs du système SYDONIA Bogue de l’an 2000 ........................... INT/9X/9CK SITE France 12 398 2 623 2 565
Building capacity through training in the settlement of disputes in international trade, investment and intellectual property ....... INT/0T/0AG DITC Multidonors 134 093 25 960 28 486 G-24 Technical Support Service, Phase IV (IDRC) ................. INT/0T/0AL GDS Canada 181 064 92 100 73 930 Support for ACIS promotional activities ................................ INT/0T/0BB SITE Multidonors 746 192 38 688 37 632
Capacity building on international investment agreements ....... INT/0T/0BG DITE Multidonors 3 800 285 758 748 725 614
for note see end of table)

TD/B/WP/188/Add.2 Page 16_________________________________________ Review of the Technical Cooperation Activities of UNCTAD
TABLE 7 (continued)
Projects by country/region and interregional, 2005 (In dollars)
Short title Project number Division Source
of fund
Total income
2002 –2005 a
Allotment 2005
Expenditures
in 2005
Support to UNCTAD’s technical cooperation ......................... INT/0T/0BU RMS Belgium 794 732 215 000 36 360 Financing of participation of experts from developing countries and countries with economies in transition in UNCTAD Expert Group .
INT/0T/1AK
RMS
Finland, Iceland, Mauritius 271 616 42 650 28 827
Increasing the developing country representation in the Agricultural Market Access Database (AMAD) ...................... INT/0T/1AT DITC Ireland 314 217 39 400 40 716 Accountancy development in developing countries and countries with economies in transition ................................... INT/0T/1BM DITE Multidonors 65 753 19 911 17 563 Capacity Building in Investment Promotion ........................... INT/0T/1BN DITE France,
Norway 181 558 193 000 7 869
First Round of CBT F Activities: UNCTAD-Led Projects ........ INT/0T/1BV DITC UNEP 106 945 92 320 90 735 Capacity Building on Good Governance in Investment Promotion .......................................................................... INT/0T/1CH DITE Sweden 389 093 88 112 35 755 Publication on Small Island Developing States ....................... INT/0T/1CI LDC Ireland 5 516 26 025 3 271
Globalization, Liberalization and Sustainable Development PHASE II ................................ ................................ ........... INT/0T/1CK EDM Belgium 1 300 449 0 -19 013 Institutional and capacity building in the area of competition law INT/0T/1CO DITC United
Kingdom 879 318 194 635 215 700
Support to capacity building for effective integration in the international trading system and facilitation of market access .. INT/0T/1CQ DITC Finland 229 459 0 -2 260 Services and Development Capacity Building ........................ INT/0T/1CY DITC United
Kingdom 1 112 632 356 400 388 720
Appui aux programmes de formation TrainForTrade et programme de formation portuaire ........................................
INT/0T/2AH
SITE
Le Cabildo de Gran Canaria 190 167 0 -2 345
Strengthening the Debt Management Capacity of Developing Countries ................................ ................................ ........... INT/0T/2AO GDS Multidonors 9 777 746 2 669 353 2 914 337 Building capacity for improved policy and negotiations on key trade and environment issues ................................ ................
INT/0T/2AQ
DITC
United Kingdom 1 269 816 423 086 337 838
Special trust fund for activities of science and technology for development ....................................................................... INT/0T/2AU DITE Multidonors 5 275 14 149 6 127
Online trade efficiency support services ................................ INT/0T/2AX SITE Belgium 268 045 8 534 10 632 Investment policy reviews in five least developed countries .... INT/0T/2BA DITE Germany 253 839 0 -5 166 Strengthening women entrepreneurs in selected LDCs in Africa . INT/0T/2BB DITE Germany 249 338 0 -11 827 World Investment Report 2003 ............................................ INT/0T/2BC DITE United
Kingdom 330 614 0 -3 934 Capacity building programme on training in selected economic issues: distance learning techniques ...................................... INT/0T/2CJ SITE Belgium 831 079 242 462 219 961 Development Institutions on Transit Transport Cooperation, Kazakhstan ......................................................................... INT/0T/2CM LDC Italy 154 497 0 -9 294
Promoting and Facilitating Foreign Direct Investment in Least Developed Countries ................................ ........................... INT/0T/2CO DITE Italy 894 147 179 650 108 928
Getting started with CDM in least developed countries ........... INT/0T/2CQ DITC Norway 112 322 8 504 -5 626 Training in LDCs and developing countries on trade policies formulation ........................................................................ INT/0T/2CT DITC Norway 1 412 366 398 100 398 073 Development and Dissemination of Selected Data on FDI and the Operations of Transnational Corporations ......................... INT/0T/2CW DITE Multidonors 52 945 94 000 18 820
Biotrade Facilitation Programme for Biodiversity Products and Service ..............................................................................
INT/0T/3AC
DITC
Switzerland, Netherlands 1 789 905 1 151 477 1 289 954
LDCS Trade Ministers Preparatory Meeting for the Fifth WTO Conference, Dhaka, Bangladesh, 31 May - 2 June 2003 .......... INT/0T/3AM LDC Multidonors 6 760 0 -8 270 Support to the UNCTAD/ICC Investment Advisory Council ... INT/0T/3AO DITE Norway,
Germany 172 031 50 575 -1 262
for note see end of table)

TD/B/WP/188/Add.2 Annex I1: Statistical tables _______________________________________________________________________ Page 17
TABLE 7 (continued)
Projects by country/region and interregional, 2005 (In dollars)
Short title Project number Division Source
of fund
Total income
2002 –2005 a
Allotment 2005
Expenditures
in 2005
Investment policy reviews in French-speaking countries ......... INT/0T/3AW DITE Multidonors 1 046 836 358 326 243 686 Consultative task force on environmental requirements and international trade ............................................................... INT/0T/3BB DITC Netherlands 298 610 30 469 22 614 Investment Policy ............................................................... INT/0T/3BG DITE Sweden 250 614 78 171 65 342
Integrating IPR Policies in Sustainable Development Strategies INT/0T/3BH DITE DFID 167 999 9 500 70 030 Trade Facilitation in the Context of the Doha Development Agenda: Support to Trade Facilitation Platforms in Developing Countries .......................................................... INT/0T/3BJ SITE Sweden 368 160 0 -29 945 Services Trade-Related Development Strategies for Poverty Reduction .......................................................................... INT/0T/3BN DITC Germany 317 342 174 642 161 945 World Investment Report ................................ ..................... INT/0T/3BR DITE Multidonors 974 427 178 512 184 175
Renforcement de l'aide à la conception et à la mise en œuvre d'un plan stratégique d'orientation et de développement de l'investissement économique (RAPSODIE) ............................
INT/0T/3BT
DITE
Agence Intergouverne- mentale de la Francophonie 108 990 31 059 33 907
Commodity Atlas ................................ ................................ INT/0T/3BV DITC Common Fund for Commodities 60 667 0 -3 770
LDCS: pre and post diagnostic trade integration study (DTIS) capacity building ................................................................. INT/0T/3BY LDC Finland 598 079 225 635 63 918
Support for Regional Investment Agreements ........................ INT/0T/4AA DITE Mulltidonors 322 855 0 -19 865 Mise en place d'un projet de renforcement des capacités de formation portuaire pour les pays en développement (programme Trainfortrade) ..................................................
INT/0T/4AB
SITE
Les ports des pays en développement 264 734 147 759 159 565
Selected Commodity Issues in the Context of Trade and Development ...................................................................... INT/0T/4AF DITC Finland 96 476 57 500 31 867 Training Workshop on Trade and Poverty, Organised Jointly with the World Bank Institute ............................................... INT/0T/4AG LDC Finland 103 997 0 -1 679
Development of a Prototype of the UNCTAD Training Resources Platform ............................................................. INT/0T/4AJ SITE Canada 178 493 119 989 122 463 Preparation for UNCTAD XI High -Level Interactive Round Table on Trade and Gender .................................................. INT/0T/4AK GDS Canada 69 934 16 817 3 223
Competition Policy, Competitiveness and Development .......... INT/0T/4AM DITC United Kingdom 79 445 3 689 9 281
Financing of Activities in Support of the Preparatory Process of UNCTAD XI; Parallel and Side Events ................................. INT/0T/4AT RMS Multidonors 89 549 0 9 480
Capacity Building for Integration into the Multilateral Trading System (Window II of the LDCS Trust Fund) ........................ INT/0T/4AU DITC Norway 420 578 329 974 166 033 Strengthening of the World Trade Point Federation and its Trade Points .......................................................................
INT/0T/4AW
SITE
World Trade Point Federation 245 390 39 000 39 958
Integration of LDCs, landlocked and island countries in the global economy ................................................................... INT/0T/4AY LDC Italy 200 000 63 491 83 932
Support Developing Countries' Assessment of the NAMA Negotiations and Trade Preferences ...................................... INT/0T/4BC DITC DFID, UK 174 643 114 932 123 942 International Task Force on Harmonization and Equivalency in Organic Agriculture............................................................................ INT/0T/4BF DITC Switzerland 66 250 68 077 55 298
Investment Policy Reviews and Capacity-Building in Investment Policy Making ................................................... INT/0T/4BJ DITE Japan 85 605 48 654 53 966 Facilitation of foreign investment procedures ......................... INT/0T/4BN DITE World Bank 263 678 145 879 164 436
for note see end of table)
TD/B/WP/188/Add.2 Page 18_________________________________________ Review of the Technical Cooperation Activities of UNCTAD
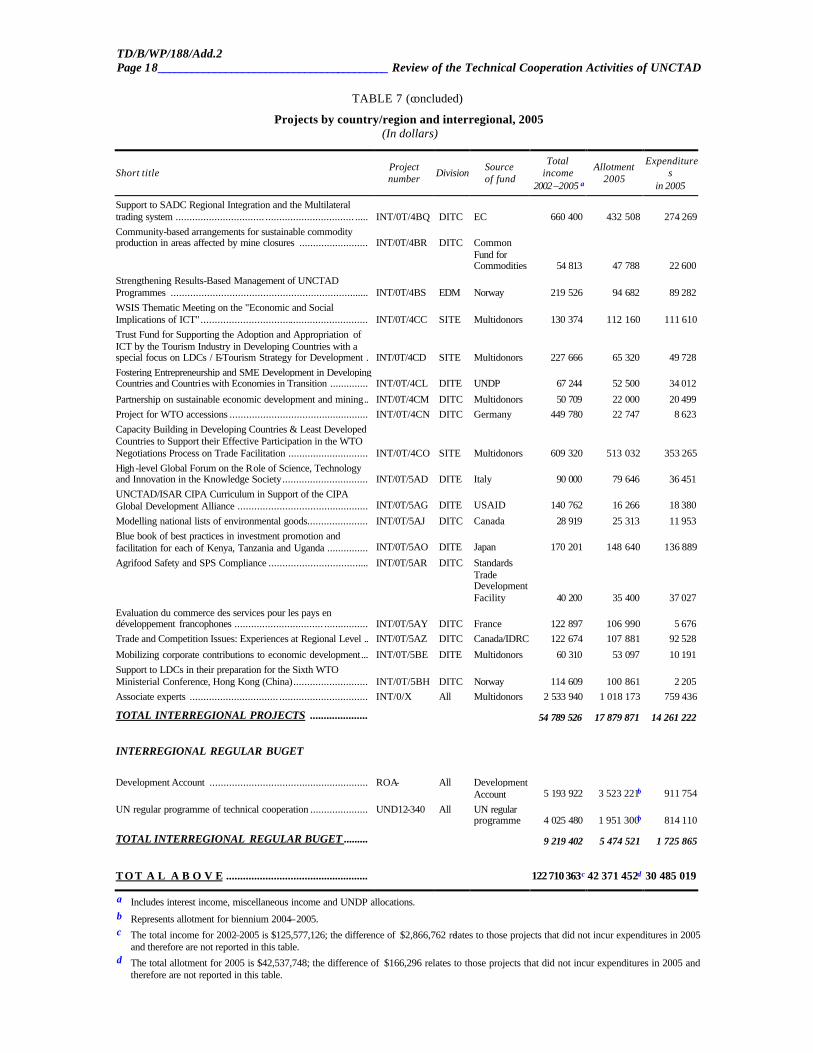
TABLE 7 (concluded)
Projects by country/region and interregional, 2005 (In dollars)
Short title Project number Division Source
of fund
Total income
2002 –2005 a
Allotment 2005
Expenditures
in 2005
Support to SADC Regional Integration and the Multilateral trading system ................................ ................................ ..... INT/0T/4BQ DITC EC 660 400 432 508 274 269 Community-based arrangements for sustainable commodity production in areas affected by mine closures .........................
INT/0T/4BR
DITC
Common Fund for Commodities 54 813 47 788 22 600
Strengthening Results-Based Management of UNCTAD Programmes ....................................................................... INT/0T/4BS EDM Norway 219 526 94 682 89 282 WSIS Thematic Meeting on the "Economic and Social Implications of ICT"............................................................ INT/0T/4CC SITE Multidonors 130 374 112 160 111 610 Trust Fund for Supporting the Adoption and Appropriation of ICT by the Tourism Industry in Developing Countries with a special focus on LDCs / E-Tourism Strategy for Development . INT/0T/4CD SITE Multidonors 227 666 65 320 49 728 Fostering Entrepreneurship and SME Development in Developing Countries and Countries with Economies in Transition .............. INT/0T/4CL DITE UNDP 67 244 52 500 34 012
Partnership on sustainable economic development and mining.. INT/0T/4CM DITC Multidonors 50 709 22 000 20 499 Project for WTO accessions .................................................. INT/0T/4CN DITC Germany 449 780 22 747 8 623 Capacity Building in Developing Countries & Least Developed Countries to Support their Effective Participation in the WTO Negotiations Process on Trade Facilitation ............................. INT/0T/4CO SITE Multidonors 609 320 513 032 353 265 High -level Global Forum on the Role of Science, Technology and Innovation in the Knowledge Society............................... INT/0T/5AD DITE Italy 90 000 79 646 36 451 UNCTAD/ISAR CIPA Curriculum in Support of the CIPA Global Development Alliance ............................................... INT/0T/5AG DITE USAID 140 762 16 266 18 380
Modelling national lists of environmental goods...................... INT/0T/5AJ DITC Canada 28 919 25 313 11 953 Blue book of best practices in investment promotion and facilitation for each of Kenya, Tanzania and Uganda ............... INT/0T/5AO DITE Japan 170 201 148 640 136 889
Agrifood Safety and SPS Compliance .................................... INT/0T/5AR DITC Standards Trade Development Facility 40 200 35 400 37 027
Evaluation du commerce des services pour les pays en développement francophones ................................ ................ INT/0T/5AY DITC France 122 897 106 990 5 676 Trade and Competition Issues: Experiences at Regional Level .. INT/0T/5AZ DITC Canada/IDRC 122 674 107 881 92 528
Mobilizing corporate contributions to economic development... INT/0T/5BE DITE Multidonors 60 310 53 097 10 191 Support to LDCs in their preparation for the Sixth WTO Ministerial Conference, Hong Kong (China)........................... INT/0T/5BH DITC Norway 114 609 100 861 2 205 Associate experts ................................ ................................ INT/0/X All Multidonors 2 533 940 1 018 173 759 436
TOTAL INTERREGIONAL PROJECTS ..................... 54 789 526 17 879 871 14 261 222
INTERREGIONAL REGULAR BUGET
Development Account ......................................................... ROA- All Development Account 5 193 922 3 523 221b 911 754
UN regular programme of technical cooperation ..................... UND12-340 All UN regular programme 4 025 480 1 951 300b 814 110
TOTAL INTERREGIONAL REGULAR BUGET ......... 9 219 402 5 474 521 1 725 865
T O T A L A B O V E ................................................... 122 710 363c 42 371 452d 30 485 019
a Includes interest income, miscellaneous income and UNDP allocations. b Represents allotment for biennium 2004–2005. c The total income for 2002–2005 is $125,577,126; the difference of $2,866,762 relates to those projects that did not incur expenditures in 2005
and therefore are not reported in this table. d The total allotment for 2005 is $42,537,748; the difference of $166,296 relates to those projects that did not incur expenditures in 2005 and
therefore are not reported in this table.

TD/B/WP/188/Add.2 Annex I1: Statistical tables _______________________________________________________________________ Page 19
TABLE 8
UNCTAD Trust Fund contributions, 2002–2005a (In dollars)
Donor 2002 2003 2004 2005 Total
(2002–2005)
Algeria .......................................................... - - - 185 183 185 183 Angola .......................................................... 169 993 12 510 5 000 5 000 192 502 Argentina ..................................................... - 35 255 20 642 71 823 127 720 Australia ....................................................... 124 661 11 038 11 816 - 147 515 Austria .......................................................... - 4 358 - 18 096 22 454 Bangladesh ................................................. 281 055 152 890 228 975 82 930 745 850 Barbados ...................................................... - 286 110 143 069 142 459 571 638 Belgium ........................................................ 845 533 1 644 798 501 267 - 2 991 598 Benin ............................................................ 9 965 163 675 24 968 88 938 287 546 Bolivia ......................................................... - 5 000 59 307 5 000 69 307 Botswana ..................................................... 117 640 205 290 162 070 165 545 650 545 Brazil ............................................................ 5 000 20 443 18 681 5 000 49 123 Burkina Faso ............................................... - 125 285 10 766 - 136 051 Burundi ........................................................ - 460 000 - 5 000 465 000 Cameroon .................................................... 38 455 597 692 34 968 34 975 706 090 Canada .......................................................... 73 945 31 203 438 930 286 795 830 873 Cape Verde .................................................. 12 475 12 468 - 12 500 37 443 Central African Republic .......................... 9 275 - - 13 929 23 204 Chile ............................................................. - 159 700 106 771 5 000 271 471 China ............................................................ 50 000 30 000 30 000 40 000 150 000 Colombia ..................................................... - - 47 250 47 250 Congo ........................................................... 11 571 768 840 - 56 744 837 155 Côte d'Ivoire ................................................ - 4 975 - 593 647 598 622 Cuba .............................................................. 15 000 - 14 970 29 377 59 347 Denmark ...................................................... - - 79 316 235 588 314 904 Democratic Republic of the Congo ......... - - - 157 963 157 963 Djibouti ........................................................ 83 716 - - - 83 716 Dominican Republic .................................. - 314 492 4 980 4 980 324 452 Ecuador ........................................................ - 5 000 10 000 5 000 20 000 Egypt ............................................................ 30 000 - 5 000 5 000 40 000 El Salvador .................................................. - - - 20 882 20 882 Estonia .......................................................... 159 454 - - - 159 454 Fiji ................................................................. 67 000 95 924 72 329 69 709 304 962 Finland ......................................................... 294 060 526 276 863 628 - 1 683 964 France ........................................................... 465 671 1 810 565 2 384 364 1 522 322 6 182 922 Gabon ........................................................... 584 195 - - 150 265 734 460 Germany ...................................................... 576 213 303 750 416 632 820 809 2 117 404 Ghana ........................................................... - - - 20 239 20 239 Greece .......................................................... - - - 39 216 39 216 Guinea .......................................................... 9 976 9 980 18 475 262 475 300 906 Guyana ......................................................... - - 1 950 - 1 950 Haiti .............................................................. - 204 960 - 1 004 980 1 209 940 Honduras ...................................................... - 81 680 - 335 676 417 356 India .............................................................. 15 000 15 000 15 000 15 000 60 000 Indonesia ...................................................... - 129 098 144 776 5 000 278 874 Ireland .......................................................... - 178 154 29 838 313 673 521 665 Islamic Republic of Iran ............................ - - 37 500 - 37 500 Italy ............................................................... 1 204 933 66 000 4 000 434 231 1 709 164 Japan ............................................................. 261 249 250 000 - 167 963 679 212 Jordan ........................................................... - 5 000 5 000 5 000 15 000 Kenya ........................................................... 12 000 - - - 12 000 Latvia ............................................................ 25 000 - - - 25 000 Lebanon ....................................................... - - 5 000 5 000 10 000
(for notes see end of table)

TD/B/WP/188/Add.2 Page 20_________________________________________ Review of the Technical Cooperation Activities of UNCTAD
TABLE 8 (continued)
UNCTAD Trust Fund contributions, 2002-2005a (In dollars)
Donor 2002 2003 2004 2005 Total
(2002–2005)
Libyan Arab Jamahiriya ............................ - - 129 776 14 075 143 851 Lithuania ...................................................... 188 721 - - - 188 721 Luxembourg ................................................ 103 395 - 36 618 - 140 013 Madagascar ................................................. - - 236 945 351 180 588 125 Malaysia ....................................................... 30 000 14 985 14 980 15 000 74 965 Maldives ...................................................... 5 500 5 500 5 500 5 500 22 000 Mali .............................................................. 146 380 - 149 942 - 296 322 Mauritania ................................................... 285 000 - 15 665 - 300 665 Mexico ......................................................... 15 000 15 000 15 000 15 000 60 000 Morocco ....................................................... - - 14 975 15 000 29 975 Myanmar ...................................................... 3 000 - - - 3 000 Namibia ........................................................ 269 166 157 014 237 583 228 260 892 023 Nepal .......................................................... - 130 000 - - 130 000 Netherlands ................................................. 935 784 878 331 1 021 325 1 576 335 4 411 775 Nicaragua ..................................................... - 46 000 10 000 5 000 61 000 Nigeria .......................................................... 39 414 - - 2 950 000 2 989 414 Norway ......................................................... 2 424 241 3 504 640 3 655 781 4 690 384 14 275 046 Pakistan ........................................................ 515 000 560 000 206 569 689 250 1 970 819 Palestinian Authority ................................. 134 500 - - - 134 500 Panama ......................................................... - 5 000 5 000 5 000 15 000 Papua New Guinea ..................................... - - 175 621 326 565 502 186 Paraguay ...................................................... - - - 15 000 15 000 Philippines .................................................. 10 538 188 911 65 350 107 645 372 444 Portugal ........................................................ 190 015 113 732 235 900 78 521 618 168 Republic of Korea ...................................... 15 000 15 000 15 000 7 500 52 500 Republic of Moldova ................................ - - 395 349 330 086 725 435 Romania ....................................................... 115 000 129 650 145 000 15 000 404 650 Saint Lucia ................................................... - - 262 239 - 262 239 Samoa ........................................................... 15 000 80 916 72 347 69 709 237 972 Saudi Arabia ................................................ - - 10 000 - 10 000 Senegal ......................................................... - 9 973 24 947 - 34 920 Singapore ..................................................... - 15 000 60 000 15 000 90 000 Slovakia ....................................................... - - 159 086 - 159 086 Spain ............................................................. - 182 006 - 480 890 662 896 Sudan ............................................................ 18 058 210 155 5 004 22 115 255 333 Sweden ......................................................... 1 360 436 1 624 480 1 836 511 1 305 263 6 126 690 Switzerland .................................................. 3 142 690 1 098 018 1 378 063 1 108 320 6 727 090 Syrian Arab Republic ................................ - - - 1 000 000 1 000 000 Thailand ....................................................... 13 278 30 000 - 15 000 58 278 The former Yugoslav Republic of Macedonia ............................................................................................................. - - 76 563 30 173 106 736 Timor -Leste ................................................. - - - 9 379 9 379 Togo .............................................................. 219 973 98 711 16 666 24 999 360 348 Trinidad and Tobago ................................. 15 000 125 091 563 870 15 000 718 961 Tunisia .......................................................... - 34 971 - 34 971 69 942 Uganda ......................................................... 131 173 102 223 - 44 120 277 516 United Kingdom ......................................... 1 543 031 4 880 048 4 242 930 2 662 505 13 328 514 United Republic of Tanzania ................... 12 655 - 328 780 210 695 552 130 United States of America .......................... - - - 139 900 139 900 Vanuatu ........................................................ 41 930 95 960 72 327 69 629 279 846 Venezuela .................................................... 9 486 1 444 90 199 76 014 177 143 Yemen .......................................................... - - 9 972 4 988 14 960 Zambia ......................................................... - - 9 975 28 387 38 362 Zimbabwe .................................................... - - 5 000 26 000 31 000
(for notes see end of table)

TD/B/WP/188/Add.2 Annex I1: Statistical tables _______________________________________________________________________ Page 21
TABLE 8 (concluded)
UNCTAD Trust Fund contributions, 2002-2005a (In dollars)
Donor 2002 2003 2004 2005 Total
(2002–2005)
UN system organizations FAO .............................................................. 20 000 30 000 - 1 250 51 250 ILO ............................................................... - - - 125 100 125 100 IMF ............................................................... - - - 2 312 2 312 ITC ................................................................ 187 128 493 181 899 684 1 046 586 2 626 579 ITU ............................................................... - - - 2 344 2 344 UNDP ........................................................... - 5 000 247 308 70 930 323 238 UNECA ........................................................ - 51 400 - 51 400 UNEP ........................................................... - - 100 000 - 100 000 UNOPs ......................................................... - - 1 225 000 2 700 000 3 925 000 World Bank/IBRD ..................................... - 11 000 140 000 190 000 341 000 WHO ............................................................ 100 000 85 - 100 085 UN Framework Convention on Climate Change ......................................................... 87 834 - - - 87 834
Other international donors
European Commission .............................. 1 374 018 2 172 928 691 278 2 888 463 7 126 687 Agence Intergouvernementale de la Francophonie ................................... 201 046 58 750 373 549 141 838 775 183 Arab Fund for Economic and Social Development ............................................... - - 121 328 - 121 328 Asia Development Bank ........................... - - - 6 135 6 135 COMESA .................................................... 104 914 66 389 22 110 - 193 412 Common Fund for Commodities ............. - 66 535 59 800 108 240 234 575 ECOWAS .................................................... 9 980 19 960 59 963 - 89 903 International Council on Mining and Metals ........................................................... - - 25 000 25 000 50 000 Inter-American Development Bank ........ 13 000 - 2 971 - 15 971 International Centre for Trade and Sustainable Development ......................... 67 800 62 150 124 300 62 150 316 400 International Federation of Organic Agriculture Movements ............................ - - 13 865 - 13 865 Islamic Development Bank ...................... - 16 859 - - 16 859 Japan Bank for International Cooperation ... - - 84 820 - 84 820 OECD ........................................................... - 2 000 61 863 3 057 66 920 OPEC ............................................................ - - 67 956 - 67 956 WAIPA ........................................................ 91 860 63 000 193 000 60 000 407 860 West African Economic and Monetary Union ............................................................ - - 155 827 - 155 827 World Trade Orga nization ........................ - - - 612 724 612 724
Other contribution b .................................. 136 191 184 925 281 177 446 858 1 049 151
T O T A L ................................................... 19 895 167 26 384 243 26 873 226 34 822 509 107 975 145
a Exclusive of cost -sharing contributions through UNDP and Associate Experts. The major part of contributions from developing countries are self-financed projects, financed from proceeds of loans, credits or grants from international financial institutions.
b Includes private sector contributions and public donations.