tcrp report 140 – a guide for planning and operating...
TRANSCRIPT

A Guide for Planning and Operating Flexible
Public Transportation Services
TRANSIT COOPERATIVERESEARCHPROGRAMTCRP
REPORT 140
Sponsored by
the Federal
Transit Administration

TRANSPORTATION RESEARCH BOARD 2010 EXECUTIVE COMMITTEE*
OFFICERS
CHAIR: Michael R. Morris, Director of Transportation, North Central Texas Council of Governments, Arlington
VICE CHAIR: Neil J. Pedersen, Administrator, Maryland State Highway Administration, BaltimoreEXECUTIVE DIRECTOR: Robert E. Skinner, Jr., Transportation Research Board
MEMBERS
J. Barry Barker, Executive Director, Transit Authority of River City, Louisville, KYAllen D. Biehler, Secretary, Pennsylvania DOT, HarrisburgLarry L. Brown, Sr., Executive Director, Mississippi DOT, JacksonDeborah H. Butler, Executive Vice President, Planning, and CIO, Norfolk Southern Corporation,
Norfolk, VAWilliam A.V. Clark, Professor, Department of Geography, University of California, Los AngelesEugene A. Conti, Jr., Secretary of Transportation, North Carolina DOT, RaleighNicholas J. Garber, Henry L. Kinnier Professor, Department of Civil Engineering, and Director,
Center for Transportation Studies, University of Virginia, CharlottesvilleJeffrey W. Hamiel, Executive Director, Metropolitan Airports Commission, Minneapolis, MNPaula J. Hammond, Secretary, Washington State DOT, OlympiaEdward A. (Ned) Helme, President, Center for Clean Air Policy, Washington, DCAdib K. Kanafani, Cahill Professor of Civil Engineering, University of California, BerkeleySusan Martinovich, Director, Nevada DOT, Carson CityDebra L. Miller, Secretary, Kansas DOT, TopekaSandra Rosenbloom, Professor of Planning, University of Arizona, TucsonTracy L. Rosser, Vice President, Corporate Traffic, Wal-Mart Stores, Inc., Mandeville, LASteven T. Scalzo, Chief Operating Officer, Marine Resources Group, Seattle, WAHenry G. (Gerry) Schwartz, Jr., Chairman (retired), Jacobs/Sverdrup Civil, Inc., St. Louis, MOBeverly A. Scott, General Manager and Chief Executive Officer, Metropolitan Atlanta Rapid Transit
Authority, Atlanta, GADavid Seltzer, Principal, Mercator Advisors LLC, Philadelphia, PA Daniel Sperling, Professor of Civil Engineering and Environmental Science and Policy; Director, Institute of
Transportation Studies; and Interim Director, Energy Efficiency Center, University of California, DavisKirk T. Steudle, Director, Michigan DOT, LansingDouglas W. Stotlar, President and CEO, Con-Way, Inc., Ann Arbor, MIC. Michael Walton, Ernest H. Cockrell Centennial Chair in Engineering, University of Texas, Austin
EX OFFICIO MEMBERS
Thad Allen (Adm., U.S. Coast Guard), Commandant, U.S. Coast Guard, U.S. Department of Homeland Security, Washington, DC
Peter H. Appel, Administrator, Research and Innovative Technology Administration, U.S.DOTJ. Randolph Babbitt, Administrator, Federal Aviation Administration, U.S.DOTRebecca M. Brewster, President and COO, American Transportation Research Institute, Smyrna, GAGeorge Bugliarello, President Emeritus and University Professor, Polytechnic Institute of New York
University, Brooklyn; Foreign Secretary, National Academy of Engineering, Washington, DCAnne S. Ferro, Administrator, Federal Motor Carrier Safety Administration, U.S.DOT LeRoy Gishi, Chief, Division of Transportation, Bureau of Indian Affairs, U.S. Department of the
Interior, Washington, DCEdward R. Hamberger, President and CEO, Association of American Railroads, Washington, DCJohn C. Horsley, Executive Director, American Association of State Highway and Transportation
Officials, Washington, DCDavid T. Matsuda, Deputy Administrator, Maritime Administration, U.S.DOTVictor M. Mendez, Administrator, Federal Highway Administration, U.S.DOTWilliam W. Millar, President, American Public Transportation Association, Washington, DCCynthia L. Quarterman, Administrator, Pipeline and Hazardous Materials Safety Administration,
U.S.DOTPeter M. Rogoff, Administrator, Federal Transit Administration, U.S.DOTDavid L. Strickland, Administrator, National Highway Traffic Safety Administration, U.S.DOTJoseph C. Szabo, Administrator, Federal Railroad Administration, U.S.DOTPolly Trottenberg, Assistant Secretary for Transportation Policy, U.S.DOTRobert L. Van Antwerp (Lt. Gen., U.S. Army), Chief of Engineers and Commanding General,
U.S. Army Corps of Engineers, Washington, DC
TCRP OVERSIGHT AND PROJECTSELECTION COMMITTEE*
CHAIRAnn AugustSantee Wateree Regional Transportation Authority
MEMBERSJohn BartosiewiczMcDonald Transit AssociatesMichael BlaylockJacksonville Transportation AuthorityLinda J. BohlingerHNTB Corp.Raul BravoRaul V. Bravo & AssociatesGregory CookVeolia TransportationTerry Garcia CrewsStarTranAngela IannuzzielloENTRA ConsultantsJohn InglishUtah Transit AuthoritySherry LittleSpartan Solutions, LLCJonathan H. McDonaldHNTB CorporationGary W. McNeilGO TransitMichael P. MelaniphyMotor Coach IndustriesBradford MillerDes Moines Area Regional Transit AuthorityFrank OteroPACO TechnologiesKeith ParkerVIA Metropolitan TransitPeter RogoffFTAJeffrey RosenbergAmalgamated Transit UnionRichard SarlesWashington Metropolitan Area Transit AuthorityMichael ScanlonSan Mateo County Transit DistrictMarilyn ShazorSouthwest Ohio Regional Transit AuthorityJames StemUnited Transportation UnionGary ThomasDallas Area Rapid TransitFrank TobeyFirst TransitMatthew O. TuckerNorth County Transit DistrictPam WardOttumwa Transit AuthorityAlice Wiggins-TolbertParsons Brinckerhoff
EX OFFICIO MEMBERSWilliam W. MillarAPTARobert E. Skinner, Jr.TRBJohn C. HorsleyAASHTOVictor MendezFHWA
TDC EXECUTIVE DIRECTORLouis SandersAPTA
SECRETARYChristopher W. JenksTRB
*Membership as of June 2010.*Membership as of June 2010.
TRANSPORTAT ION RESEARCH BOARDWASHINGTON, D.C.
2010www.TRB.org
T R A N S I T C O O P E R A T I V E R E S E A R C H P R O G R A M
TCRP REPORT 140
Research sponsored by the Federal Transit Administration in cooperation with the Transit Development Corporation
Subscriber Categories
Public Transportation • Planning and Forecasting
A Guide for Planning and Operating Flexible Public Transportation Services
John F. PottsMaxine A. MarshallTHE DMP GROUP, INC.
New Orleans, LA
Emmett C. CrockettJackson, MS
Joel WashingtonSilver Spring, MD

TCRP REPORT 140
Project B-35ISSN 1073-4872ISBN 978-0-309-15480-2Library of Congress Control Number 2010929874
© 2010 National Academy of Sciences. All rights reserved.
COPYRIGHT INFORMATION
Authors herein are responsible for the authenticity of their materials and for obtainingwritten permissions from publishers or persons who own the copyright to any previouslypublished or copyrighted material used herein.
Cooperative Research Programs (CRP) grants permission to reproduce material in thispublication for classroom and not-for-profit purposes. Permission is given with theunderstanding that none of the material will be used to imply TRB, AASHTO, FAA, FHWA,FMCSA, FTA, or Transit Development Corporation endorsement of a particular product,method, or practice. It is expected that those reproducing the material in this document foreducational and not-for-profit uses will give appropriate acknowledgment of the source ofany reprinted or reproduced material. For other uses of the material, request permissionfrom CRP.
NOTICE
The project that is the subject of this report was a part of the Transit Cooperative ResearchProgram, conducted by the Transportation Research Board with the approval of theGoverning Board of the National Research Council.
The members of the technical panel selected to monitor this project and to review thisreport were chosen for their special competencies and with regard for appropriate balance.The report was reviewed by the technical panel and accepted for publication according toprocedures established and overseen by the Transportation Research Board and approvedby the Governing Board of the National Research Council.
The opinions and conclusions expressed or implied in this report are those of theresearchers who performed the research and are not necessarily those of the TransportationResearch Board, the National Research Council, or the program sponsors.
The Transportation Research Board of the National Academies, the National ResearchCouncil, and the sponsors of the Transit Cooperative Research Program do not endorseproducts or manufacturers. Trade or manufacturers’ names appear herein solely becausethey are considered essential to the object of the report.
TRANSIT COOPERATIVE RESEARCH PROGRAM
The nation’s growth and the need to meet mobility, environmental,and energy objectives place demands on public transit systems. Currentsystems, some of which are old and in need of upgrading, must expandservice area, increase service frequency, and improve efficiency to servethese demands. Research is necessary to solve operating problems, toadapt appropriate new technologies from other industries, and to intro-duce innovations into the transit industry. The Transit CooperativeResearch Program (TCRP) serves as one of the principal means bywhich the transit industry can develop innovative near-term solutionsto meet demands placed on it.
The need for TCRP was originally identified in TRB Special Report213—Research for Public Transit: New Directions, published in 1987and based on a study sponsored by the Urban Mass TransportationAdministration—now the Federal Transit Administration (FTA). Areport by the American Public Transportation Association (APTA),Transportation 2000, also recognized the need for local, problem-solving research. TCRP, modeled after the longstanding and success-ful National Cooperative Highway Research Program, undertakesresearch and other technical activities in response to the needs of tran-sit service providers. The scope of TCRP includes a variety of transitresearch fields including planning, service configuration, equipment,facilities, operations, human resources, maintenance, policy, andadministrative practices.
TCRP was established under FTA sponsorship in July 1992. Pro-posed by the U.S. Department of Transportation, TCRP was autho-rized as part of the Intermodal Surface Transportation Efficiency Actof 1991 (ISTEA). On May 13, 1992, a memorandum agreement out-lining TCRP operating procedures was executed by the three cooper-ating organizations: FTA, the National Academies, acting through theTransportation Research Board (TRB); and the Transit DevelopmentCorporation, Inc. (TDC), a nonprofit educational and research orga-nization established by APTA. TDC is responsible for forming theindependent governing board, designated as the TCRP Oversight andProject Selection (TOPS) Committee.
Research problem statements for TCRP are solicited periodically butmay be submitted to TRB by anyone at any time. It is the responsibilityof the TOPS Committee to formulate the research program by identi-fying the highest priority projects. As part of the evaluation, the TOPSCommittee defines funding levels and expected products.
Once selected, each project is assigned to an expert panel, appointedby the Transportation Research Board. The panels prepare project state-ments (requests for proposals), select contractors, and provide techni-cal guidance and counsel throughout the life of the project. The processfor developing research problem statements and selecting researchagencies has been used by TRB in managing cooperative research pro-grams since 1962. As in other TRB activities, TCRP project panels servevoluntarily without compensation.
Because research cannot have the desired impact if products fail toreach the intended audience, special emphasis is placed on dissemi-nating TCRP results to the intended end users of the research: tran-sit agencies, service providers, and suppliers. TRB provides a seriesof research reports, syntheses of transit practice, and other support-ing material developed by TCRP research. APTA will arrange forworkshops, training aids, field visits, and other activities to ensurethat results are implemented by urban and rural transit industrypractitioners.
The TCRP provides a forum where transit agencies can cooperativelyaddress common operational problems. The TCRP results support andcomplement other ongoing transit research and training programs.
Published reports of the
TRANSIT COOPERATIVE RESEARCH PROGRAM
are available from:
Transportation Research BoardBusiness Office500 Fifth Street, NWWashington, DC 20001
and can be ordered through the Internet at
http://www.national-academies.org/trb/bookstore
Printed in the United States of America


CRP STAFF FOR TCRP REPORT 140
Christopher W. Jenks, Director, Cooperative Research ProgramsCrawford F. Jencks, Deputy Director, Cooperative Research ProgramsGwen Chisholm Smith, Senior Program OfficerTom Van Boven, Senior Program AssistantEileen P. Delaney, Director of PublicationsEllen M. Chafee, Editor
TCRP PROJECT B-35 PANEL
Field of Service Configuration
Ann August, Santee Wateree Regional Transportation Authority, Sumter, SC (Chair)Timothy Collins, Veolia Transportation, North Las Vegas, NV Ronald Downing, Golden Gate Bridge, Highway, and Transportation District, San Rafael, CAVince Jackson, Hampton Roads Transit, Norfolk, VADel A. Peterson, North Dakota State University, Fargo, NDWill Scott, Will Scott & Co., LLC, Cincinnati, OH Carol Wise, New Jersey Transit Authority, Newark, NJDoug Birnie, FTA LiaisonRobert Carlson, Community Transportation Association of America, Washington, DCPeter Shaw, TRB Liaison
C O O P E R A T I V E R E S E A R C H P R O G R A M S

TCRP Report 140: A Guide for Planning and Operating Flexible Public TransportationServices describes the types of flexible transportation service strategies appropriate for small,medium, and large urban and rural transit agencies. This guide includes discussions onfinancial and political realities, operational issues, and institutional mechanisms appropriatefor implementing and sustaining flexible transportation services. This guide will be helpfulto public transportation providers, decision-makers, policymakers, planners, and othersinterested in considering flexible services.
Public transportation agencies face increasing demands to serve ever more diversemarkets that may require cost-effective, unconventional solutions. Flexible transportationservices show great promise in meeting the mobility needs of many individuals nationwide.Flexible transportation service may be especially valuable to those communities that are try-ing to address ADA requirements and those classified as suburban, small urban, and rural,where mobility markets are often defined by low or irregular demand. In addition to newflexible services, existing traditional fixed-route and paratransit transit services may beconverted into flexible services. In order to answer the questions of whether, and in whatcircumstances, the introduction of flexible service may be feasible, a broad, comprehensivelook at planning and operating flexible transportation services as part of an array of optionswas needed.
To develop the guide, the research team conducted a comprehensive review of flexibleservice types operated in the United States and Canada over the last 10 years that includedidentifying flexible services that have been successfully implemented or are close to imple-mentation. Services that were successfully implemented but not sustained were alsoreviewed. In this review, the research team gathered key information from a cross sectionof public transportation providers on (1) the characteristics of the provider’s flexible ser-vice, (2) the provider’s reasons for considering flexible service, (3) the way that the flexibleservice was implemented, (4) the benefits of implementing flexible service, (5) the politicalenvironment, and (6) the operational considerations. Also, the researchers made a series ofon-site visits to transit agencies that operate flexible public transportation service to gatherinformation on lessons learned. Finally, the guide identifies a range of best practices forimplementing flexible public transportation services and includes “decision guides” to assistagencies in rural, small urban, and large urban areas in determining whether and how toprovide flexible transportation services.
F O R E W O R D
By Gwen Chisholm SmithStaff OfficerTransportation Research Board
1 Summary
4 Chapter 1 Basic Concepts of Flexible Public Transportation Service
4 1.1 History and Definitions5 1.2 Current Status of Flexible Public Transportation Services
19 Chapter 2 Framework/Decision Matrix for Considering Flexible Public Transportation Service
19 2.1 Rural Flexible Public Transportation Service24 2.2 Small Urban Flexible Public Transportation Service27 2.3 Large Urban Flexible Public Transportation Service
31 Chapter 3 Implementing New Flexible Public Transportation Services
31 3.1 Analyzing Existing Conditions—What Data Should I Review?34 3.2 Obtaining Community and Policymaker Input35 3.3 Planning and Scheduling Flexible Public Transportation Service36 3.4 Understanding the Costs37 3.5 Capital Needs—Vehicles and Technology40 3.6 Marketing Flexible Public Transportation Service
42 Chapter 4 Best Practices of Successful Flexible Public Transportation Services
44 4.1 Mason County Transportation Authority 48 4.2 St. Joseph Transit51 4.3 Potomac and Rappahannock Transportation Commission56 4.4 Pierce County Public Transportation Benefit Area Corporation59 4.5 Regional Transportation District67 4.6 Jacksonville Transportation Authority73 4.7 Charleston Area Regional Transportation Authority76 4.8 Mountain Rides Transportation Authority78 4.9 South Central Adult Services Council, Inc.82 4.10 Omnitrans
88 References
89 Unpublished Material
C O N T E N T S

Flexible public transportation services include a range of services that are not fully demandresponsive or fixed route. While these types of services have been around for over 40 years, itwas believed that flexible public transportation services were operated by a relatively small per-centage of public transit agencies. In a survey for this study of nearly 1,100 public transporta-tion operators, it was revealed that 39 percent of the 500 respondents (ranging from small ruralto large urban operators) provided some type of flexible public transportation service.
Many agencies that have implemented flexible public transportation services have real-ized real benefits while others have attempted this approach and abandoned the effort afterseveral months or years. Often, in rural and small urban areas, flexible public transportationservices can serve senior citizens and persons with disabilities at a lower cost than demand-responsive service. Also, in suburban communities, a flexible public transportation servicewith small buses may encourage first-time public transit users to leave their cars at homeand use the service to connect with regional transit services to reach nearby destinations.
For the purposes of this study, the concept of flexible public transportation services includesthe following:
• Route Deviation—vehicles operating on a regular schedule along a well-defined path, with orwithout marked bus stops, that deviate to serve demand-responsive requests within a zonearound the path. The width or extent of the zone may be precisely established or flexible.
• Point Deviation—vehicles serving demand-responsive requests within a zone and also serv-ing a limited number of stops within the zone without any regular path between the stops.
• Demand-Responsive Connector—vehicles operating in demand-responsive mode within azone, with one or more scheduled transfer points that connect with a fixed-route network. Ahigh percentage of ridership consists of trips to or from the transfer points.
• Request Stops—vehicles operating in conventional fixed-route, fixed-schedule mode and alsoserving a limited number of undefined stops along the route in response to passenger requests.
• Flexible-Route Segments—vehicles operating in conventional fixed-route, fixed-schedulemode, but switching to demand-responsive operation for a limited portion of the route.
• Zone Route—vehicles operating in demand-responsive mode along a corridor with estab-lished departure and arrival times at one or more end points in the zone.
This guide will identify best practices and barriers to effective implementation of flexiblepublic transportation services and will also move the research into practice by suggestingspecific actions that public transit providers can take to more effectively consider andsuccessfully implement flexible public transportation service alternatives.
The research revealed that flexible public transportation is structured differently andserves very different needs depending on the area served. For this reason, this guide offers a
1
S U M M A R Y
A Guide for Planning andOperating Flexible PublicTransportation Services

decision-making framework for agencies considering flexible public transportation servicesin three different operating environments:
• Rural Areas (Under 50,000 in population)• Small Urban Areas (50,000 to 200,000 in population)• Large Urban Areas (more than 200,000 in population)
Chapter 1: Basic Concepts of Flexible Public Transportation Service provides anoverview of the current state of flexible public transportation services in the United States.This is accomplished by sharing the results of a comprehensive survey of 95 agencies thatoffer one or more types of flexible public transportation service. The list of respondents andthe survey instrument are presented in Appendices A and B. (Appendices A through C avail-able by searching for “TCRP Report 140” on www.trb.org.)
Chapter 2: Framework/Decision Matrix for Considering Flexible Public TransportationService uses previous research studies, the results of the survey for this study, and lessonslearned during on-site visits to numerous flexible public transportation service operations toassist agencies in making a decision on the applicability of flexible public transportationservices in their locality. The framework takes into consideration the key factors thataffect the effectiveness of flexible public transportation services, including populationand employment densities, trip purpose, and clientele served. Decision guide flowchartsare presented to help agencies determine whether flexible public transportation servicesshould be considered.
Chapter 3: Implementing New Flexible Public Transportation Services guides local agen-cies through the process of implementing flexible public transportation services if implemen-tation has been determined to be feasible. This chapter identifies key steps for local decisionmakers to follow such as analyzing existing conditions, obtaining community input, planningand scheduling the service, determining capital needs, and marketing the services.
Chapter 4: Best Practices of Successful Flexible Public Transportation Services presentsdetailed information on nine agencies that operate a range of flexible public transporta-tion services and one agency that operated flexible public transportation service and thendiscontinued the service. The agencies and contact persons are identified, and service areacharacteristics are described for the overall service area and specifically for the flexiblepublic transportation service area. The flexible public transportation services are describedin detail, productivity standards and measures are noted, and other issues faced by the agen-cies are described. Some of the agencies have accumulated considerable data on their flexi-ble public transportation services and noted trends; this information will be very useful tosimilar agencies that may be considering implementing flexible public transportation ser-vices. Finally, Appendix C—available on the TRB website (www.trb.org) by searching onTCRP Report 140—provides a collection of marketing materials from the websites of over20 different operators of flexible public transportation service. This material can be very use-ful to any agency wishing to gain more information on similar services operated in small andlarge communities throughout the United States.
In summary, the primary objective of this research effort is the development of a practicalguide that public transportation providers can use to consider the merits of flexible publictransportation services. Agencies should learn that the costs per trip for flexible public trans-portation are higher than the costs per trip for fixed-route public transportation. Additionally,flexible public transportation services require communications and scheduling technology thatexceeds the communications and scheduling technology needs of fixed-route public transporta-tion. Finally, customers who use public transportation for time-sensitive trips, including workand school trips, may resist a change to flexible public transportation services.
2 A Guide for Planning and Operating Flexible Public Transportation Services

Nonetheless, for an agency that has areas and/or services that are conducive to flexiblepublic transportation, this service type can serve many needs, including the following:
• Reducing the costs of full demand-response services in rural areas where passengers frequentcommon destinations such as medical centers, senior citizen centers, or shopping centers.
• Eliminating the need to operate ADA-complementary paratransit in a specific geographic areaor systemwide, if an agency chooses to eliminate fixed-route services in those areas.
• Providing an introduction to public transportation for suburban residents not served by reg-ular fixed-route service by offering convenient connections to frequent fixed-route buses orfixed-guideway systems.
Summary 3

The primary objective of this research effort is the development of a practical guide that pub-lic transportation providers can use to consider the merits of flexible public transportation ser-vices. Prior to this research, flexible public transportation services were believed to be operatedby a relatively small percentage of public transit agencies. Many agencies that have implementedflexible public transportation services have realized real benefits while others have attempted thisapproach and abandoned the effort after several months or years. Often, in small urban areas,flexible public transportation services can serve persons with disabilities at a lower cost thandemand-responsive service. Also, in suburban communities, a flexible public transportationservice with small buses may encourage first-time public transit users to leave their cars at homeand use the service to connect with regional transit services to reach nearby destinations.
This guide will identify best practices and barriers to effective implementation of flexible pub-lic transportation services. This guide will also move the research into practice by suggesting spe-cific actions that public transit providers can take to more effectively consider and successfullyimplement flexible public transportation service alternatives.
1.1 History and Definitions
Public transportation services have historically operated as fixed-route systems that operatealong a well-defined corridor making predetermined stops to collect passengers at scheduledtimes. These systems are most efficient in areas where there are high concentrations of residencesand common destinations, such as a strong downtown or central business district (CBD). Morerecently, public transportation services have come to include those services that operate asdemand responsive, meaning that no fixed route is involved and the vehicle collects passengersat their origins and takes them to their destinations. These demand-responsive systems usuallyserve specific clientele (e.g., persons with disabilities) and/or areas of low densities. Clearly, fixed-route services are more productive and less costly than demand-responsive systems.
Flexible public transportation services encompass a wide range of hybrid service types that arenot fully demand responsive or fixed route. According to TCRP Synthesis 53: Operational Expe-riences with Flexible Transit Services (Koffman, 2004), flexible public transportation services havebeen in existence for over 40 years:
At least since the 1960s, practitioners have proposed services that combine features of conventionalservice and purely demand-responsive service (Cole 1968; Arrillaga and Mouchahoir 1974). One of theearliest documented experiments is the Merrill-Go-Round in Merrill, Wisconsin (Flusberg 1976;Mergel 1976), which used a ‘point deviation’ mode of operation, as defined later in this report, and thatis still operating. More recent research continues to propose flexible transit services as part of the toolkitto help transit operators address suburbanization and dispersed travel patterns (Cervero and Beutler 1999;Urbitran 1999) (p. 3).
4
C H A P T E R 1
Basic Concepts of Flexible PublicTransportation Service

For purposes of this study, the definition of flexible public transportation services includes thefollowing:
• Route Deviation—vehicles operating on a regular schedule along a well-defined path, with orwithout marked bus stops, that deviate to serve demand-responsive requests within a zonearound the path. The width or extent of the zone may be precisely established or flexible.
• Point Deviation—vehicles serving demand-responsive requests within a zone and also serv-ing a limited number of stops within the zone without any regular path between the stops.
• Demand-Responsive Connector—vehicles operating in demand-responsive mode within azone, with one or more scheduled transfer points that connect with a fixed-route network. Ahigh percentage of ridership consists of trips to or from the transfer points.
• Request Stops—vehicles operating in conventional fixed-route, fixed-schedule mode and alsoserving a limited number of undefined stops along the route in response to passenger requests.
• Flexible-Route Segments—vehicles operating in conventional fixed-route, fixed-schedulemode, but switching to demand-responsive operation for a limited portion of the route.
• Zone Route—vehicles operating in demand-responsive mode along a corridor with estab-lished departure and arrival times at one or more end points.
1.2 Current Status of Flexible Public Transportation Services
This research effort involved a comprehensive review and outreach effort to identify flexiblepublic transportation services that have been successfully implemented or are close to beingimplemented in the United States and Canada. Over 1,100 transit managers, representing pub-lic transit systems of different sizes and types and in different areas of the country, were asked toparticipate in a web-based initial survey to help the researchers gain a better understanding ofthe types of agencies that operate flexible public transportation services and those that don’t. Theinitial survey contained the following questions:
• Please provide the contact information on your agency and a contact person that we can reachfor follow-up questions.
• What modes of public transportation does your agency operate?• If you checked “Flexible Public Transportation” on the previous question, please tell us which
type(s) of flexible public transportation your agency operates.• If your agency currently operates or has plans to operate any type of “flexible public trans-
portation,” please briefly describe your service.• On what date did you begin operation of flexible public transportation OR if the service has
not yet started, what date do you plan to begin operation?• If your agency ever operated “flexible” public transportation and discontinued the service,
please briefly describe the type of flexible service operated and the reason for discontinuingthe service.
The final response rate for the initial survey was approximately 45 percent, with 194 agencies(39 percent) indicating that they operated flexible public transportation service. This is a muchhigher number than was expected. As shown in Table 1, the profile of the agencies operating flex-ible public transportation service is very similar to the profile of all respondents, including thosethat do not operate flexible public transportation service.
The initial outreach survey also identified the types of flexible public transportation servicesoperated by the agencies. Table 2 shows that route deviation is by far the most common form offlexible public transportation service (63.9 percent), followed by request stops (30.9 percent) anddemand-responsive connector (24.2 percent).
Basic Concepts of Flexible Public Transportation Service 5

The initial survey also revealed that the implementation of flexible public transportation ser-vices is on the rise. As shown in Figure 1, a large number of respondents implemented flexiblepublic transportation service after 1991, and the number of new service implementations hasbeen higher still in the past 8 years. The last column on this figure shows those respondents whoindicated that they plan to implement flexible public transportation services in the next 5 years.
Finally, the initial outreach effort asked respondents if their agencies had ever operated flexi-ble public transportation services and discontinued the service. If discontinuation of flexiblepublic transportation services had occurred, respondents were asked to please briefly describethe type of flexible public transportation service operated and to share the reason for discontin-uing the service. Over 30 respondents shared comments regarding the discontinuation of flexi-ble public transportation services. Some of the reasons given for discontinuing flexible publictransportation service were the following:
• “Problems with scheduling—can’t make time points when demand for flexible trips is high orhave too much extra time when demand for flexible is low.”
6 A Guide for Planning and Operating Flexible Public Transportation Services
Modes of Transit Operated
All 501 Respondents
(%)
194 Respondents Operating
Flexible Transit (%)
Fixed Route 58.1 57.3ADA Paratransit 53.4 48.4General Public Demand Response 55.2 67.2Client Demand Response 29.6 33.Light Rail 2.7 2.6Heavy Rail 1.4 0Bus Rapid Transit 2.5 2.1
Table 1. Operating characteristics of survey respondents.
Type of Flexible PublicTransportation Service
Route DeviationRequest StopsDemand-Responsive ConnectorPoint DeviationFlexible Route SegmentsZone Routes
% of Respondents
63.930.924.216.014.411.9
Table 2. Types of flexible public transportation services operated.
Number ofRespondents
Before1980
1981-1990
1991-2000
2001-Present
FutureService
05
1015202530354045
Figure 1. Number of respondents by date of flexible transportation service implementation.

• “Decided not to implement flexible transportation after pilot program in an area of town thathad lost a fixed route several years earlier failed to generate sufficient ridership.”
• “Replaced flexible service with door-to-door service; ridership increased from two passengersper hour to three and one-half passengers per hour.”
• “Flexible transportation service scaled back due to fuel expenses.”• “Low ridership, equipment and resources needed in other areas.”• “Implemented flexible transportation services to salvage Saturday service on two local fixed
routes. Discontinued service due to low ridership, communication problems, and confusionabout how the service operated.”
• “Discontinued flexible service when ridership increased to justify fixed-route service.”
In summary, the initial outreach effort revealed the following about flexible public transporta-tion service:
• Nearly 40 percent of respondents indicated that they operate some form of flexible publictransportation service.
• While respondents were geographically dispersed across the United States, the largest num-bers of respondents were located in the Southeast and Midwest.
• Agencies that operate flexible public transportation service also operate other modes of publictransit service at a similar proportion as all respondents.
• The largest majority of agencies that operate flexible public transportation service operateroute-deviation service, followed by request stops, and demand-responsive connector service.
• Implementation of flexible public transportation service has increased significantly in the past20 years and is still on the increase.
• The major reason for discontinuing flexible public transportation services was low ridership.
Using the results of the initial outreach effort, a distribution list of public transit service opera-tors was developed to solicit for gathering key information. The second phase of data solicitationwas targeted at the 194 agencies that indicated that they operated flexible public transportationservice.
Survey Respondents
Ninety-five agencies (see Appendix A for listing of agencies) responded to the second requestfor more detailed data on their flexible public transportation services. Of the 95 respondents,85.3 percent completed the survey, and most answered all of the questions (see Appendix B forsurvey and summary of responses). As shown in Figure 2, there was a good distribution of agencytypes among the respondents. Over 30 percent were transit authorities or districts, while 28 percent
Basic Concepts of Flexible Public Transportation Service 7
Figure 2. Distribution of agency types amongrespondents to second phase of data solicitation.

were private, non-profit. The remaining agencies were primarily city or county departments,with a small number (4 percent) responding that their agency was private, for profit.
The respondents served a wide range of service areas and service area populations. The small-est agency served a rural area of 2,000 in population, while the largest agency served a popula-tion of over two million people. The square mileage of the service areas also varied significantly,from 20 square miles to nearly 17,000 square miles. Previous research showed that areas of lowdensity (persons/square mile) were often good candidates for flexible public transportation ser-vice. Clearly, service areas can include a mix of medium-/high-density and low-density areas, butfor purposes of this data collection phase, total service area densities were calculated. The results,as shown in Figure 3, were that 34, or nearly 45 percent, of the respondents that provided pop-ulation statistics served areas of relatively low density (less than 100 persons/square mile). Con-versely, only 16 respondents (20 percent) served areas of medium-/high-density (over 1,000 personsper square mile).
When asked about basic service statistics for all modes of public transit service, 95 percent ofrespondents provided data on ridership, vehicle revenue hours, peak vehicles operated, and operating budgets. Figure 4 shows annual ridership while Figure 5 shows peak vehicles for allmodes. As shown, the respondents were predominately small agencies.
Types of Flexible Public Transportation Service
Fewer respondents, 56 percent, provided similar basic service statistics for flexible public trans-portation service only. Six respondents indicated that 100 percent of their service was flexible, sothe service statistics reported were reported for all modes. Figure 6 compares annual ridership on
8 A Guide for Planning and Operating Flexible Public Transportation Services
Figure 3. Service area population density.
Number ofRespondents
30
25
20
15
10
5
0
<10,
000
10,0
00–5
0,00
0
50,0
00–1
00,0
00
100,
000–
500,
000
1,00
0,00
0–10
,000
,000
500,
000–
1,00
0,00
0
>10,
000,
000
Figure 4. Annual ridership—all modes.

all modes to ridership reported for flexible public transportation service alone. As shown, whereridership was low (less than 50,000 annual trips), flexible public transportation service was pre-dominant. None of the respondents reported flexible ridership exceeding 10,000,001.
Figure 7 shows the percentage of total passenger trips that used the flexible public transporta-tion service feature.
When asked to describe their flexible public transportation service, 56 percent of respondentsreported that the service included route deviation for the general public while 45 percent indi-cated that the service was route deviation for persons with disabilities. The other responses arepresented in Table 3.
Basic Concepts of Flexible Public Transportation Service 9
0
10
20
30
40
50
60
<20 21–50 51–250
251–500
>500
Number ofRespondents
Vehicles
Figure 5. Peak vehicles—all modes.
<10,000
10,000–50,000
50,000–100,000Rid
ersh
ip
100,000–500,000
1,000,000–10,000,000
500,000–1,000,000
>10,000,000
Figure 6. Annual ridership on all modes and on flexible publictransportation service only.
Passenger Trips Using Flexible Public Transportation
Figure 7. Percent of passenger trips using the flexible transportation feature.

10 A Guide for Planning and Operating Flexible Public Transportation Services
Type of Flexible Public TransportationService
Route Deviation for General PublicRoute Deviation for Persons with DisabilitiesPoint DeviationDemand-Responsive ConnectorRequest StopsFlexible Route SegmentsZone Routes
% ofRespondents
56.145.119.530.530.919.532.9
Table 3. Types of flexible transportation services operated.
Figure 8. Flexible service area types.
A large majority of respondents (84.7 percent) indicated that the flexible public transporta-tion service was operated at all times of the day, while only 4.2 percent indicated that the servicewas only operated at night and 6.9 percent indicated the service was only operated on weekends.
It appears that flexible public transportation service is operated in a variety of area types.As shown in Figure 8, most of the respondents indicated that flexible public transportationservice was provided in rural areas (36 percent) and small towns (20 percent). However, over40 percent of respondents indicated that the service was operated in urban and suburbanareas also.
Flexible Public Transportation Service Users and Productivity of the Service
A large majority of respondents indicated that senior citizens (29 percent) and persons withdisabilities (27 percent) were the principal users of flexible public transportation service, asshown in Figure 9.
When asked about productivity standards for flexible public transportation service, nearly80 percent of the respondents indicated that they did not have standards. Productivity standards forflexible transportation services, for those respondents that did have them, included the following:
• “4 passengers/hour”• “Growth rate in Unit Costs (trip/vehicle mile/change to revenue vehicle hour/etc.)”• “2.3 passengers per revenue hour per contract with the provider”• “Rural route deviated—goal 10 passengers/hour, minimum 5 passengers/hour”• “Ridership comparison, cost per passenger”• “Like to stay over 5.0 passengers/hour”• “Boardings per hour and cost per passenger”

• “At least 20 passengers a day”• “15% farebox ratio, minimum 4.0 passengers/revenue hour”• “3–5 passengers/hour”• “Cost per trip, mile, hour must meet contracted amount and standards for fixed routes”• “Miles per passenger”• “4.00 passengers/vehicle hour and 0.193 passengers/vehicle mile”• “Safe on-time standard”• “3 to 5 boarding per hour minimum”• “Not separately recorded, included with regular passenger count”
As the list of productivity standards suggests, most respondents used passengers per hour astheir standard, and most agencies reported standards ranging from 3 to 5 passengers per hour.Figure 10 shows the actual passengers per hour productivity measures for the respondents thatprovided measures.
Operation of Flexible Public Transportation Service
With respect to how flexible public transportation service is operated, the following questionswere asked:
• For route deviation service, how far are the vehicles allowed to deviate?• What is the fare for flexible service? Is it different from the fare charged for fixed-route or
demand-responsive service?
Basic Concepts of Flexible Public Transportation Service 11
Figure 9. Users of flexible transportation service.
Passengers per Hour
Number ofRespondents
Figure 10. Flexible transportation service passengersper hour.

• How is the flexible transportation service scheduled?• How are drivers assigned to flexible transportation service?• What types of vehicles are used to operate flexible transportation service?
Distance That Vehicles Are Allowed to Deviate in Route Deviation Service
An equal number of respondents, 17 (27 percent), stated that the maximum deviation fromthe route was up to one-half mile and that there was no limit for deviation within the agencies’service area. Fourteen respondents (22 percent) allowed deviation up to three-quarters of a milefrom the route, the distance required by the ADA to provide complementary paratransit service.Figure 11 displays these results.
Fares for Flexible, Fixed-Route, and Demand-Responsive Services
Seventy percent of respondents indicated that the fare charged for flexible public transporta-tion service was the same as the fare charged for fixed-route or demand-responsive service. Of therespondents that charge a different fare for flexible public transportation service, 61 percent saidthat the fare for flexible public transportation service was higher.
Scheduling of Flexible Transportation Service
Respondents who operated route deviation were asked to complete a statement about routedeviation (“For route deviation service, a complete route is scheduled . . .”) with one of threephrases. The completing phrases and the percentage that chose each one are the following:
• With a limited number of short deviations to known locations—44%• With time for deviations to unspecified locations, but only within short portions of the
route—17%• With time for deviations throughout the route to unspecified locations—35%
Respondents who operated point deviation, zone routes, or demand-responsive connectorservice were also asked how they scheduled their service. The top responses and the percentagethat chose them were the following:
• A few time points are scheduled with most of the time available for deviations—64%• With time for deviations to unspecified locations, but only within short portions of the
route—28%
Assignment of Drivers to Flexible Transportation Service
Following is some information on drivers who operate flexible public transportation service—including type of employee, process by which drivers are selected for flexible routes, and any spe-cial training provided—and the percentage of respondents that selected the characteristic to describe their drivers.
12 A Guide for Planning and Operating Flexible Public Transportation Services
RouteDeviation
Limit
Figure 11. Maximum deviation from route.
The types of drivers and the percentage of respondents using each type for flexible transportationservices were the following:
• Full time—88.3%• Part time—79.2%• Volunteer—9.1%• Union member—27.3%• Contract employee—22.1%
The processes by which drivers were selected for flexible routes and the percentage of respondentsusing each selection process for flexible transportation services were the following:
• Assigned to flexible service by agency—52.1%• Bid process, based on seniority—35.2%• Bid process, with special training requirement—9.9%• Driver volunteers for flexible assignments—9.9%
Types of special training provided for drivers, if any, and the percentage of respondentsproviding different types of special training for drivers (or no special training) were the following:
• No special training—19.7%• Map reading skills training—31.8%• Familiarization with area served—83.3%• Technology training (e.g., to use mobile data terminals)—24.2%
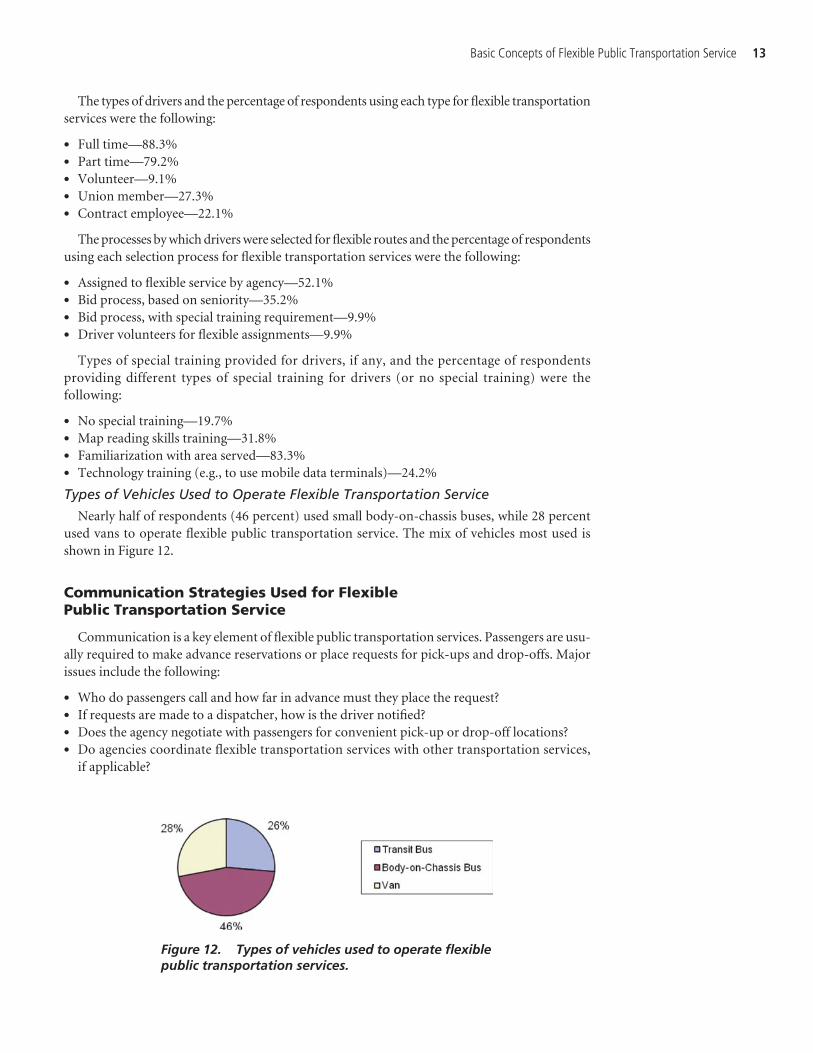
Types of Vehicles Used to Operate Flexible Transportation Service
Nearly half of respondents (46 percent) used small body-on-chassis buses, while 28 percentused vans to operate flexible public transportation service. The mix of vehicles most used isshown in Figure 12.
Communication Strategies Used for Flexible Public Transportation Service
Communication is a key element of flexible public transportation services. Passengers are usu-ally required to make advance reservations or place requests for pick-ups and drop-offs. Majorissues include the following:
• Who do passengers call and how far in advance must they place the request?• If requests are made to a dispatcher, how is the driver notified?• Does the agency negotiate with passengers for convenient pick-up or drop-off locations?• Do agencies coordinate flexible transportation services with other transportation services,
if applicable?
Basic Concepts of Flexible Public Transportation Service 13
Figure 12. Types of vehicles used to operate flexiblepublic transportation services.

Requesting Flexible Public Transportation Service
Exactly 50 percent of respondents said that passengers using flexible public transportationservice could be picked up without a called-in request or prior reservation at any established stopalong a route. Nearly 40 percent said that the passenger must make prior arrangements. Over60 percent of respondents said that passengers using flexible public transportation service couldbe dropped off without a called-in request or prior reservation at any established stop along aroute. Nearly 30 percent said that passengers must make prior arrangements, and approximatelythe same percentage of respondents stated that passengers could be dropped off at a limitednumber of designated locations without making prior arrangements. Table 4 shows these results.
Most respondents, 55.2 percent, require previous day advance notice for flexible pick-ups,while a total of 37 percent of respondents allow passengers to call within 2 hours or less to requesta flexible pick-up. Passengers appear to be offered multiple ways to request a flexible pick-up, asshown in Figure 13. A large majority of respondents, 68.4 percent, have passengers call the dis-patcher or reservation agent, while a limited number of respondents, 14 percent, allow passen-gers to call the driver directly.
Notifying Drivers of Flexible Public Transportation Service Requests
As shown above, most of the respondents require passengers to contact a dispatcher or reser-vation agent to make the request for a flexible public transportation service pick-up. Since manyagencies allow for the request to be made within 2 hours of the desired pick-up, it is critical thatthe agency be able to communicate with the driver. As shown in Figure 14, a large majority ofrespondents rely on radio communications with drivers, while others use cell phones, and a smallnumber use mobile data terminals (MDTs).
Negotiation with Passengers for Convenient Pick-Up or Drop-Off Locations
Respondents were very evenly split on whether they negotiated with passengers for con-venient pick-up or drop-off locations that are off the main route but not at the actual origin
14 A Guide for Planning and Operating Flexible Public Transportation Services
Can Passengers Use Flexible PublicTransportation Service Without Making Prior Arrangements?
FlexiblePick-Up
(%)
FlexibleDrop-Off
(%)
No 39.5 27.8Yes, at any established stop along a route 50.0 65.3Yes, at a fixed-route transfer location 22.4 18.1Yes, at a limited number of stops 14.5 26.4
Table 4. Requirement for prior arrangements.
Methods for Requesting Pick-up
Figure 13. Distribution among respondents of methods for requesting a flexible pick-up.

or destination of the passenger. Finally, with respect to communication, a large majority of respondents, 89 percent, who operated both flexible public transportation service andfixed-route or demand-responsive transportation services reported that they coordinated theservices.
Coordinating Flexible Transportation Services with Other Transportation Services
When asked to describe how they coordinated flexible public transportation and other ser-vices, respondents indicated that the flexible public transportation services made it easier for pas-sengers to transfer to other routes and coordinate with other transit operators in surroundingareas, including intercity bus and rail service. Several respondents indicated that they served sen-ior centers or nursing homes, reducing the demand on complementary ADA paratransit service.In many locations, the purpose of flexible public transportation was to coordinate with otherservices. In these areas, the respondents indicated that rather than serve specific destinations,their flexible public transportation services acted as feeder service into major fixed-route ser-vices, including light or heavy rail lines.
Other Considerations for Flexible Public Transportation Service
Many other factors affect the successful operation of flexible public transportation service. Togain added insight, respondents were asked the following:
• What technologies are used for flexible public transportation service?• What reasons motivated you to operate flexible public transportation service?• What is the best way to promote flexible public transportation to the public?• What advice would you offer other agencies that are considering implementing flexible pub-
lic transportation services?
Technologies Used for Flexible Public Transportation Service
Most respondents reported more than one type of technology used for flexible public trans-portation services. Over 55 percent of respondents identified voice radio as the most frequentlyused technology for flexible public transportation services (see Figure 15). Many respondentsprovided more than one response to this question. In addition to voice radio, 50 percent indi-cated that they used computerized scheduling, while 38 percent stated that they used cellularphones. A much smaller number, 18 percent, used automated vehicle locators (AVL) or globalpositioning systems (GPS), and only 8 percent indicated that they utilized the Internet (web) fortheir flexible public transportation services.
Basic Concepts of Flexible Public Transportation Service 15
Driver Notification
Methods
Figure 14. Distribution among respondents of methods by whicha dispatcher notifies a driver of flexible requests.

Reasons to Operate Flexible Public Transportation Service
When asked what motivated the agency to operate flexible public transportation service, over70 percent stated that they were responding to community preferences and geography. Otherresponses are shown in Table 5.
Promoting Flexible Public Transportation to the Public
Survey respondents used a combination of methods to promote flexible public transportationservice to the public as shown in Figure 16.
Advice for Agencies Considering Implementing Flexible Public Transportation Services
Respondents were very generous when asked to share advice with other agencies that wereconsidering implementing flexible public transportation service. Some respondents suggestedthat agencies should understand the community to be served and set expectations and servicedesign to match. Others suggested that agencies should start slowly, advertise heavily, and be
16 A Guide for Planning and Operating Flexible Public Transportation Services
Radio 0%
10%
20%
30%
40%
50%
60% 55% 50%
38%
18%
8%
Number of Respondents
Computer Cellular
Flexible Public Transportation Technologies
AVL/GPS Web
Figure 15. Technologies used for flexible publictransportation service.
What Motivated Your Agency to Operate Flexible Services? Respondents(%)
Respond to community preferences and geography 71.1Provide coverage to a large, low-density area 60.5Balance customer access and routing efficiency 42.1Reduce/eliminate the expense of separate ADA complementary paratransit 32.9Lay the groundwork for future fixed-route transit 19.7Serve low demand times 17.1
Table 5. Reasons for operating flexible public transportation services.
Promotional Method
Figure 16. Methods for promoting flexible public transportation.

realistic. Some respondents recommended making sure that agency staff, especially drivers,understand the service, are trained properly, and are willing to be patient and listen to passen-gers. Other respondents focused on understanding the costs associated with operating flexiblepublic transportation services. Respondent comments ranged from topics such as the potentialcost savings of flexible public transportation service in comparison to complementary ADAparatransit service, to the fact that flexible public transportation service costs more than tradi-tional fixed-route bus service.
In summary, the survey revealed the following key findings about flexible public transporta-tion service:
• Most respondents were public agencies, but nearly one-third were private, non-profit entities.• Most agencies were small and served areas of low density.• In agencies that operated other modes of service, flexible public transportation service repre-
sented a small proportion of total trips.• Route deviation is the most common type of flexible public transportation service.• Most agencies operate flexible public transportation service in rural areas, small towns, and
suburban areas.• Senior citizens and persons with disabilities are the most frequent rider types.• Productivity as measured by passengers per hour averaged 4 passengers per hour.• Most agencies limit the distance that buses can deviate from the route for flexible public trans-
portation trips; however, nearly 40 percent have no limits or informal limits.• Most agencies do not charge a premium fare for flexible public transportation.• Flexible public transportation drivers do not receive additional skills training.• Most agencies use small body-on-chassis buses for flexible public transportation service.• Most agencies require previous-day, advance notice to arrange flexible public transportation
service pick-ups.• Passengers most frequently call a reservation agent or dispatcher to make a request.• Voice radios are the most common method of contacting drivers.• Most agencies coordinate flexible public transportation service with other services, if
applicable.• The use of technology to implement flexible public transportation services is limited.• Most agencies implemented flexible public transportation service in response to community
needs.• Agencies often promote flexible public transportation service through a variety of means,
including community presentations and on agency websites.
Using the results of the initial survey of public transit agencies, the following factors wereconsidered important in identifying current flexible public transportation service agencies forfurther study:
• Geography—agencies selected from all regions of the United States.• Agency Type and Size—studied both public and non-profit agencies.• Density—selected agencies that serve both high- and low-density areas.• Area Served by Flexible Service—agencies that served urban, rural, or suburban areas.• Type of Flexible Public Transportation Service Operated.• Participation in TCRP Synthesis 53: Operational Experiences with Flexible Transit Services.
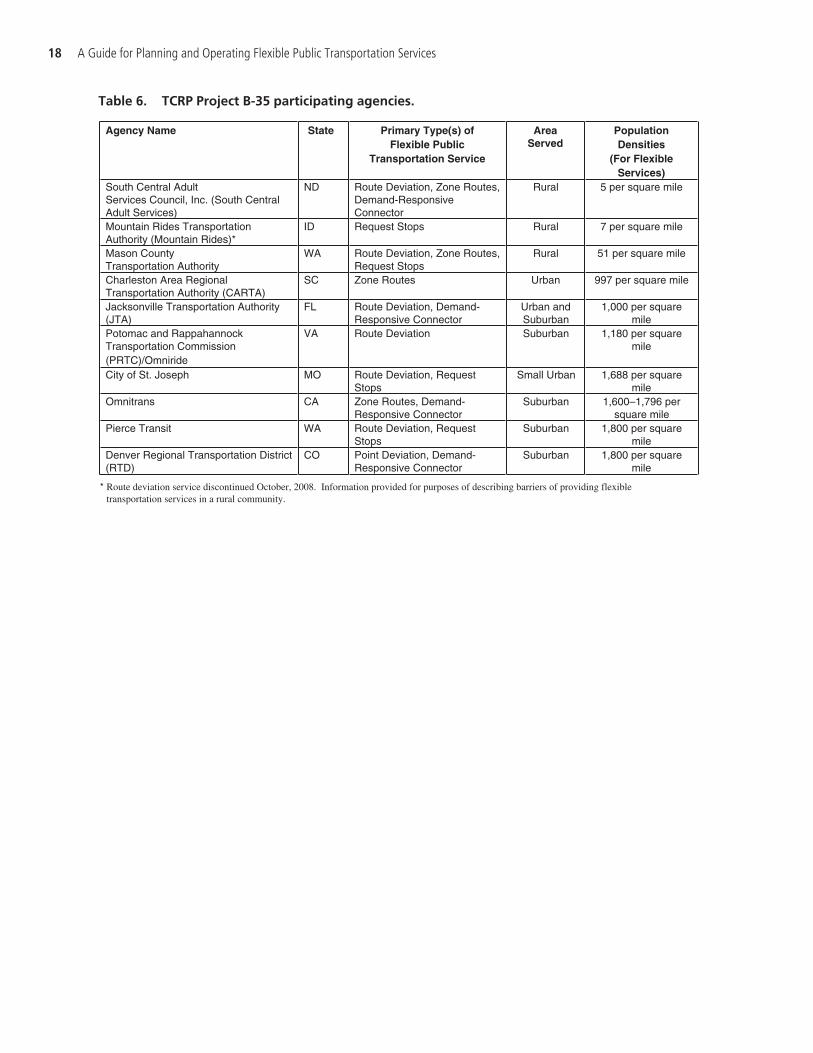
The results of the detailed case studies presented in Chapter 4, along with the survey results,formed the basis for the framework and decision matrix described in Chapter 2. Table 6 showsthe agencies studied, primary types of flexible public transportation service provided, areasserved by the flexible public transportation services, and population densities of the areas servedby flexible public transportation services.
Basic Concepts of Flexible Public Transportation Service 17
18 A Guide for Planning and Operating Flexible Public Transportation Services
Agency Name State Primary Type(s) ofFlexible Public
Transportation Service
AreaServed
PopulationDensities
(For FlexibleServices)
South Central Adult Services Council, Inc. (South Central Adult Services)
ND Route Deviation, Zone Routes, Demand-ResponsiveConnector
Rural 5 per square mile
Mountain Rides TransportationAuthority (Mountain Rides)*
ID Request Stops Rural 7 per square mile
Mason County Transportation Authority
WA Route Deviation, Zone Routes, Request Stops
Rural 51 per square mile
Charleston Area Regional Transportation Authority (CARTA)
SC Zone Routes Urban 997 per square mile
Jacksonville Transportation Authority (JTA)
FL Route Deviation, Demand-Responsive Connector
Urban and Suburban
1,000 per square mile
Potomac and Rappahannock Transportation Commission(PRTC)/Omniride
VA Route Deviation Suburban 1,180 per square mile
City of St. Joseph MO Route Deviation, RequestStops
Small Urban 1,688 per square mile
Omnitrans CA Zone Routes, Demand-Responsive Connector
Suburban 1,600–1,796 per square mile
Pierce Transit WA Route Deviation, RequestStops
Suburban 1,800 per square mile
Denver Regional Transportation District (RTD)
CO Point Deviation, Demand-Responsive Connector
Suburban 1,800 per square mile
* Route deviation service discontinued October, 2008. Information provided for purposes of describing barriers of providing flexibletransportation services in a rural community.
Table 6. TCRP Project B-35 participating agencies.

TCRP Synthesis 53: Operational Experiences with Flexible Transit Services (Koffman, 2004) sug-gested that there were few places that operated flexible public transportation services. As previ-ously described, results of the survey undertaken as part of TCRP Project B-35, reported herein,suggest that flexible public transportation services are much more prevalent in the United Statesthan initially thought. Almost 39 percent of the respondents to the initial survey for this studystated that they operated some form of flexible public transportation.
The overwhelming majority of flexible public transportation services were found in rural areasthat could be described as the following:
• Very large rural areas (up to 6,000 square miles) with very low-density populations (5 to 100 per-sons per square mile)
• Large jurisdictions (e.g., counties) with low-density populations (100 to 500 persons persquare mile)
• Small rural communities (e.g., towns) with low-density populations (100 to 500 persons persquare mile).
There are some flexible public transportation services operated in small urban areas wherepopulation densities can range from low/medium (500 to 1,000 persons per square mile) tomedium/high (1,000 to 2,000 persons per square mile). These services typically occur in com-munities where the public transportation agency does not provide many work trips and flexiblepublic transportation services obviate the need for complementary ADA paratransit.
In larger urban areas, limited flexible public transportation services are operated under spe-cific circumstances, e.g., to fill a need for nighttime service, to serve low-density areas, to act asa feeder or connector to fixed-route, rail, or major traffic generators such as employment cen-ters and shopping malls. Flexible public transportation service can also serve to introduce choiceriders to fixed-route services in some limited circumstances.
2.1 Rural Flexible Public Transportation Service
The use of flexible public transportation in rural areas is well documented. In TCRP Report 6:Users’ Manual for Assessing Service-Delivery Systems for Rural Passenger Transportation (Burkhardtet al., 1995), route deviation and point deviation are discussed as “variable route, fixed scheduleservices” (33). The report states that (33)
Route deviation services work well where:
• the deviations are a relatively small part of the overall demand and the overall running timeof the route,
• the majority of the riders are not highly time-sensitive,
19
C H A P T E R 2
Framework/Decision Matrix forConsidering Flexible PublicTransportation Service
• door-to-door service is important to some but not all passengers,• there are other positive reasons for providing services that are more like fixed route than
demand-responsive options.
TCRP Report 6 also states the following (Burkhardt et al., 1995, 33):
Route deviation services do not typically work well where:
• most of the trips are time sensitive, and• some sort of basic route structure is not desirable for this community.
On the subject of point deviation, TCRP Report 6 states:
While point deviation services share many of the same advantages and disadvantages of route devia-tion services, point deviation services are more like demand-responsive operations. Route deviation ser-vice would be preferred where passengers would be waiting along the route to be picked up withoutadvance notice to the system, and point deviation would be preferred when a service needed to be morehighly responsive to changing or variable demands. Point deviation services may be preferable to routedeviation services in rural areas because the routes between checkpoints can be flexible, allowing the drivermore routing options for maintaining the schedule, and requests for service can be negotiated or deferredso that the schedule is maintained. (Burkhardt et al., 1995, 33–34)
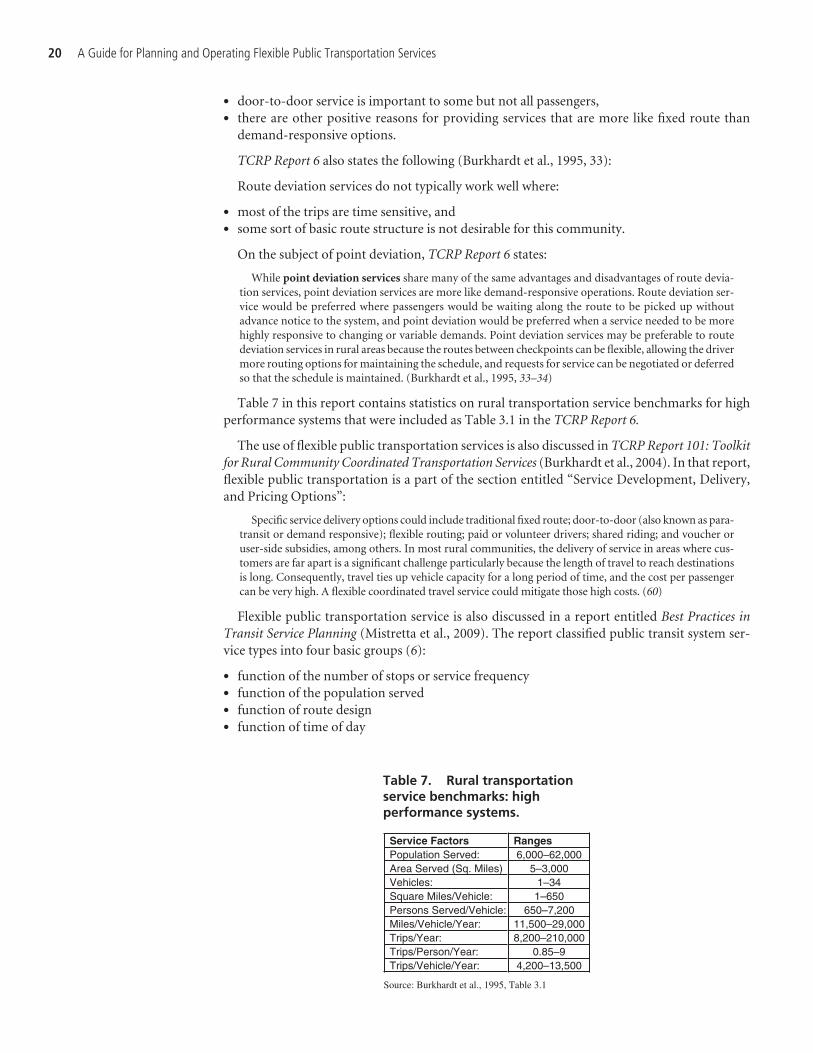
Table 7 in this report contains statistics on rural transportation service benchmarks for highperformance systems that were included as Table 3.1 in the TCRP Report 6.
The use of flexible public transportation services is also discussed in TCRP Report 101: Toolkitfor Rural Community Coordinated Transportation Services (Burkhardt et al., 2004). In that report,flexible public transportation is a part of the section entitled “Service Development, Delivery,and Pricing Options”:
Specific service delivery options could include traditional fixed route; door-to-door (also known as para-transit or demand responsive); flexible routing; paid or volunteer drivers; shared riding; and voucher oruser-side subsidies, among others. In most rural communities, the delivery of service in areas where cus-tomers are far apart is a significant challenge particularly because the length of travel to reach destinationsis long. Consequently, travel ties up vehicle capacity for a long period of time, and the cost per passengercan be very high. A flexible coordinated travel service could mitigate those high costs. (60)
Flexible public transportation service is also discussed in a report entitled Best Practices inTransit Service Planning (Mistretta et al., 2009). The report classified public transit system ser-vice types into four basic groups (6):
• function of the number of stops or service frequency• function of the population served• function of route design• function of time of day
20 A Guide for Planning and Operating Flexible Public Transportation Services
Service Factors RangesPopulation Served: 6,000–62,000Area Served (Sq. Miles) 5–3,000Vehicles: 1–34Square Miles/Vehicle: 1–650Persons Served/Vehicle: 650–7,200Miles/Vehicle/Year: 11,500–29,000Trips/Year: 8,200–210,000Trips/Person/Year: 0.85–9Trips/Vehicle/Year: 4,200–13,500
Source: Burkhardt et al., 1995, Table 3.1
Table 7. Rural transportationservice benchmarks: high performance systems.
The report defines flexible public transportation service as follows:
Flexible service or route deviation allows for deviations from the general route path to provide directtransportation access to passengers who live in the vicinity of the basic route path. On request, and per-haps for an additional charge, the vehicle will deviate a few blocks from the route to pick up or deliver apassenger. This service is most often provided with smaller vehicles and provides service in a designatedarea (typically lower density). (Mistretta et al., 2009, 6)
The report provides a useful definition for flexible public transportation service in ruralareas:
Extremely low density service also referred to as life-line or peripheral service provides some level ofminimal service in areas with low population density or low transit use. This type of service typically oper-ates on secondary streets. Extremely low density services usually operate with one-hour headways orhigher and may not operate a full day or every day. They are operated primarily to provide accessibilityto transit-dependent populations that have no other alternative. While productivity is low, this type ofservice is often less expensive to run as compared to demand response services. It also can serve as a vitalconnection to more frequent service. (Mistretta et al., 2009, 7)
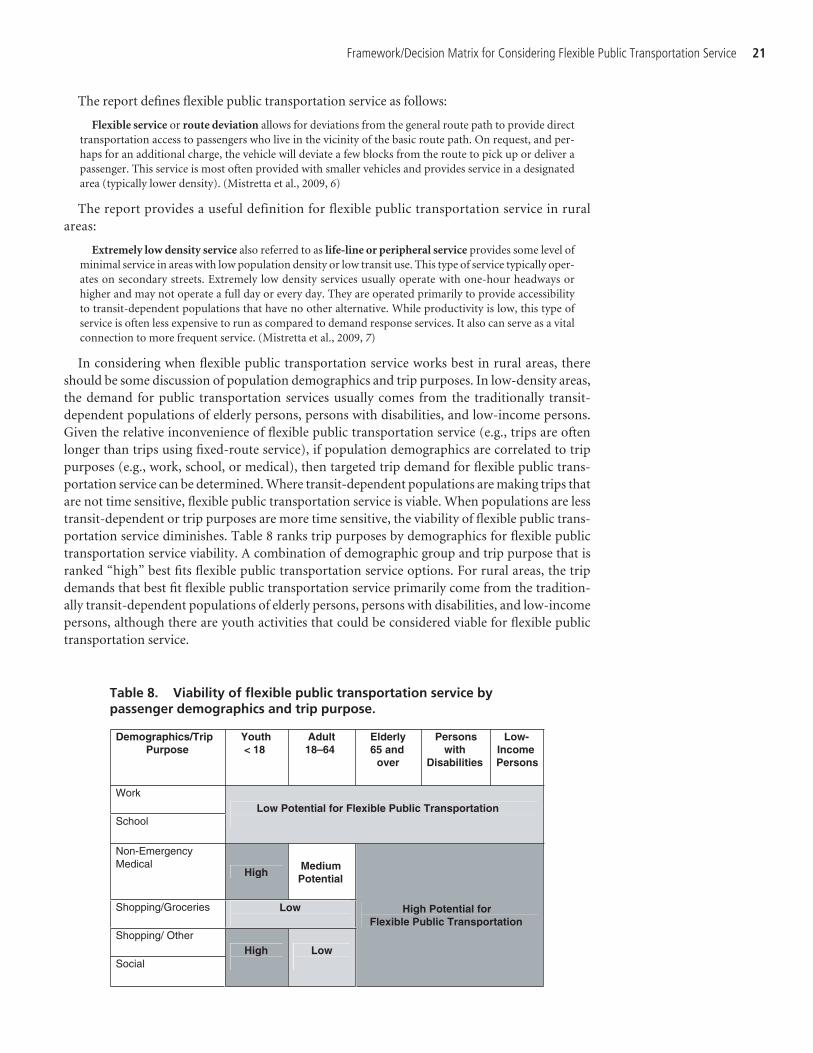
In considering when flexible public transportation service works best in rural areas, thereshould be some discussion of population demographics and trip purposes. In low-density areas,the demand for public transportation services usually comes from the traditionally transit-dependent populations of elderly persons, persons with disabilities, and low-income persons.Given the relative inconvenience of flexible public transportation service (e.g., trips are oftenlonger than trips using fixed-route service), if population demographics are correlated to trippurposes (e.g., work, school, or medical), then targeted trip demand for flexible public trans-portation service can be determined. Where transit-dependent populations are making trips thatare not time sensitive, flexible public transportation service is viable. When populations are lesstransit-dependent or trip purposes are more time sensitive, the viability of flexible public trans-portation service diminishes. Table 8 ranks trip purposes by demographics for flexible publictransportation service viability. A combination of demographic group and trip purpose that isranked “high” best fits flexible public transportation service options. For rural areas, the tripdemands that best fit flexible public transportation service primarily come from the tradition-ally transit-dependent populations of elderly persons, persons with disabilities, and low-incomepersons, although there are youth activities that could be considered viable for flexible publictransportation service.
Framework/Decision Matrix for Considering Flexible Public Transportation Service 21
Demographics/TripPurpose
Youth< 18
Adult18–64
Elderly65 and
over
Persons with
Disabilities
Low-IncomePersons
Work
SchoolLow Potential for Flexible Public Transportation
Non-Emergency Medical
HighMediumPotential
Shopping/Groceries Low
Shopping/ Other
SocialHigh Low
High Potential forFlexible Public Transportation
Table 8. Viability of flexible public transportation service by passenger demographics and trip purpose.

The actual demand for flexible public transportation service in rural areas depends on thenumber of transit-dependent populations and their densities. Where there are rural popula-tion densities that approach the high end of low-density (500 persons per square mile) and thetransit-dependent population demographics (i.e., elderly persons, persons with disabilities,and low-income persons) are higher than average, the demand for flexible public transporta-tion service is higher. Ridership data suggest that flexible public transportation service can bemore productive than general demand-responsive service since trip types can be scheduled andoperated together as the travel demand requires. If substantial demand exists, then servicescan be provided more frequently, e.g., every day. Should actual demand be lower, services canbe provided less frequently, e.g., every Tuesday and Thursday.
In considering flexible public transportation service design, trip origin and destination optionsby trip purpose were examined and ranked for applicability to flexible public transportation ser-vice. A trip origin is viable for flexible public transportation service when it is close to transit-dependent populations or is a convenient public gathering place and the trip purpose is not timesensitive. A trip origin becomes less viable for flexible public transportation service the furtherit is away from transit-dependent populations or convenient public gathering places and as trippurposes become more time sensitive. Table 9 shows the rankings of trip origins.
With respect to trip destination options, where the destination provides the trip purpose thattransit-dependent populations need, e.g., non-emergency medical services, and the trip purposeis not time sensitive, that trip location is viable as a destination for flexible public transportationservice. When the trip destination is for trip purposes that are more time sensitive, its ranking asa destination for flexible public transportation service diminishes. Table 10 shows that destina-tions such as hospitals or clinics, for non-emergency medical trip purposes, have a high poten-tial for flexible public transportation service.
The key to designing flexible public transportation service is gearing the service to transit-dependent populations and using origins, routes, and destinations that have trip purposes thatare not time sensitive.
Flexible public transportation service has been shown to be more productive than basic demand-responsive systems because it introduces a “time” or “schedule” component to service delivery. InTCRP Report 124: Guidebook for Measuring, Assessing, and Improving Performance of Demand-
22 A Guide for Planning and Operating Flexible Public Transportation Services
Trip Origin/Trip Purpose
ActivityCenter
Landmark Elderly Housing
SubsidizedHousing
SingleFamilyHome
Work
SchoolLow Potential for Flexible Public Transportation
Non-Emergency Medical Medium
PotentialHigh
Shopping/Grocery
Shopping/Other
Social
High Potential for Flexible Public Transportation
Low
Table 9. Viability of flexible public transportation service by trip origin and purpose.

Response Transportation (KFH Group, Inc., et al., 2008), in a section of Table 6a-4/Figure 6-6 called“Characteristics of Systems Affecting Performance,” there was the following observation:
In addition to ADA paratransit service, the system provides ‘shopper’ routes, essentially service routeswith same-day service for ADA riders; these flexible routes, which serve specific areas and target seniorand other housing complexes, achieve group loads and help increase productivity. (71)
In Table 6A-7/Figure 6-10 of TCRP Report 124 (KFH Group, Inc., et al., 2008), there wasanother observation:
Starting in 2004, the DRT system ‘zoned’ much of the service, requiring riders to use the closest facil-ity for their trips. This change affected roughly 25% of riders, and allowed the system to reduce its peakfleet by 12%. (74)
South Central Adult Services Council, Inc. (South Central Adult Services) in North Dakota(see description in Chapter 4), successfully operates this type of flexible public transportation inan area that has population densities ranging from two to eight persons per square mile.
The types of flexible public transportation service best suited for very rural areas are thefollowing:
• Demand-responsive connector. This service works best when there are no viable trip ori-gins but there are public transportation connections to viable trip destinations within adefined area.
• Request stops. This service works best when passengers are given the opportunity to use thefixed-route system (even a deviated fixed route) along the corridor.
• Flexible route segments. This service works best when there is an area where no viable triporigins exist, but a transit-dependent trip demand is prevalent.
• Zone routes. This service works best when no corridor exists, but viable trip origins and/ortrip destinations exist within a defined zone.
Transportation agencies that serve rural areas that are smaller in geographic size, such asMason County Transit (see description in Chapter 4), can also operate the other types of flexi-ble public transportation services:
• Route deviation. This service works best where there are defined origins and destinationsalong a corridor that have high viability for flexible public transportation service. Given thelow-density nature of the area, service can deviate off the route as the occasion arises.
Framework/Decision Matrix for Considering Flexible Public Transportation Service 23
TripDestination/Trip Purpose
Major Shopping
Center
SmallCity
Center
Hospital/Clinic EmploymentCenter
School
Work Low Potential for Flexible Public Transportation
School Not ApplicableLow
Non-Emergency Medical
Not ApplicableHigh
PotentialNot Applicable
Shopping/GroceryLow
Shopping/Other
Social
HighPotential
High Not Applicable
Table 10. Viability of flexible public transportation service by trip destination and trip purpose.

• Point deviation. This service works best when there are no viable trip origins, but there areviable trip destinations within a defined area or when there are no viable trip destinations, butthere are viable trip origins.
Agencies offering public transportation in rural areas should follow the decision guide pre-sented as Figure 17 in considering whether its service area is a good candidate for flexible publictransportation services.
2.2 Small Urban Flexible Public Transportation Service
In the United States, almost all of the small urban areas (50,000 to 200,000 population) oper-ate some form of public transportation service. These small urban areas are usually recipients ofFTA Section 5307 funding on a formula basis and use the funding to obtain vehicles, other equip-ment, and facilities to operate public transportation service, primarily fixed-route service. A con-siderable number of small urban public transportation systems operate fixed-route service withone major focal point, normally the city center or downtown, which often has a transit center.Service is provided using “clockface” headways, with buses meeting at the transit center every30, 45, or 60 minutes to facilitate transfer. Many systems utilize buses that are 30 feet or smallerin length, and passenger loads generally range from 5 to 15 passengers per hour. Many of thesmall urban areas have population densities that range from low/medium (500 to 1,000 personsper square mile) to medium/high (1,000 to 2,000 persons per square mile).
Small urban fixed-route public transportation systems that have ridership productivity ratesthat approach 5 to 16 passengers per hour are strong candidates for flexible public transporta-tion service options. Ridership data suggest that flexible public transportation service in smallurban areas has its benchmark productivity levels at between 5 and 11 passengers per hour.St. Joseph Transit in Missouri (see Chapter 4) provides a flexible public transportation servicethat operates route deviation and request stops. For the last 3 years, St. Joseph Transit has
24 A Guide for Planning and Operating Flexible Public Transportation Services
Figure 17. Decision guide for rural areas(less than 50,000 population).

reported that its passenger per hour rates were 5.9, 5.8, and 7.2 passengers per hour. However,Transfort, a small urban transit system in Fort Collins, Colorado, reports average ridership of27.6 passengers per hour. This system would not be a good candidate for flexible public trans-portation service. Fort Collins is home to Colorado State University and carries a large numberof students and faculty who frequently make time-sensitive trips.
In the development of a flexible public transportation service model, the logistics shouldevolve from a demand-responsive service approach to public transportation and not a fixed-route service approach. Conceptually, flexible public transportation service is more likedemand-responsive service than fixed-route service. In planning the logistics of fixed-routeservice, the concept is to develop and operate defined routes, stops, and timeframes (service)to which the riding public responds. The operator focuses internally on the reliability of thepublic transportation network and accepts passengers as they board and alight. Adjustmentsare made to the “fixed” nature of the public transportation network to improve productivity.Fixed-route systems can be very productive, and the boardings per hour can range from 10 to500. Communications are necessary, but they focus mostly on internal matters. Advancedcommunications (e.g., AVL) become more important as the productivity and complexity ofthe fixed-route system increases. A wide variety of vehicles are used, ranging from a 25-foot,body-on-chassis bus to a 65-foot, articulated bus. Fares can be more than nominal in natureand, in some instances, assist in controlling demand.
In planning the logistics of demand-responsive service, the concept is to develop and oper-ate service based on an interaction with the passenger before the routes, stops, and timeframes(service) are provided. The operator develops service based on a predetermined demand. Theoperator makes adjustments to the “tours” created by the demand for the service to improveproductivity. Demand-responsive systems are far less productive than fixed-route systems,with boardings per hour ranging from 1.28 to 4.70, as shown in Table 11. TCRP Report 124:Guidebook for Measuring, Assessing, and Improving Performance of Demand-Response Trans-portation (KFH Group, Inc., et al., 2008) provides a range of passenger trips per revenue hourfor the following demand-responsive systems.
Small urban fixed-route public transportation systems that have ridership productivity ratesthat approach 5 to 16 passengers per hour are strong candidates for flexible public transporta-tion service options that would obviate the need for complementary ADA paratransit service.Under the Americans with Disabilities Act of 1990 (ADA), agencies that operate fixed-routeservice must provide complementary ADA paratransit service for persons who, because oftheir disability, are unable to use the fixed-route system. According to the APTA 2009 PublicTransportation Fact Book (Neff and Dickens, 2009), the capital and operating expenses associ-ated with complementary ADA paratransit service are substantial. Table 12 summarizes the
Framework/Decision Matrix for Considering Flexible Public Transportation Service 25
Representative Demand-Responsive Systems by Category
PassengerTrips/Revenue Hour
ADA Only 1.77–3.84 Limited Eligibility 1.76–4.04 Small Urban Systems General Public 2.92–4.70 ADA Only 1.83–2.68
Large Urban Systems Other 1.70–3.55 ADA Only 1.28–2.34
Largest Urban Systems Other 1.49–4.35
Table 11. Range of performance data from representative demand-responsive transportation systems.

26 A Guide for Planning and Operating Flexible Public Transportation Services
ExpenseCategory
Paratransit Capital
Expenses($ Million)
All Modes Capital
Expenses($ Million)
Facilities 170.6 8,842.5Rolling Stock 500.2 3,927.0Other 76.9 1,758.8Total 747.7 14,528.3% of Total 5.2% 100%
Table 12. 2007 capital expenseby mode (millions of dollars).
ExpenseCategory
Paratransit Operating Expenses($ Million)
TotalOperating Expenses($ Million)
VehicleOperations
1,429.0 15,560.0
VehicleMaintenance
290.9 5,981.7
Non-Vehicle Maintenance
58.0 3,154.0
GeneralAdministration
388.1 4,779.1
PurchasedTransportation
2,254.7 4,402.4
Total 4,420.7 33,877.2% of Total 13.0% 100%
Table 13. 2007 operating expenseby mode (millions of dollars).
ExpenseCategory
Paratransit Expenses($ Million)
TotalOperating Expenses($ Million)
OperatingExpenditures
4,420.8 33,877.3
CapitalExpenditures
747.8 14,528.3
TotalExpenditures
5,168.6 48,405.6
% of Total 10.7% 100%
Table 14. 2007 total expense bymode (millions of dollars).
Service Type TotalExpenses
($ Thousands)
% of Total
Fixed Route(27.6 pph*)
$6,051.7 78
Paratransit(2.6 pph)
$1,743.0 22
Total $7.794.7 100
* pph = passengers per hour.
Table 15. City of Fort Collins, Colorado—2008 public transit operating expenses.
annual total public transportation capital and operating expenses for Fiscal Year (FY) 2007 forparatransit (which is predominately complementary ADA paratransit) and for all modes.Paratransit capital expenses were $747.7 million and represented 5.2 percent of the total cap-ital expenses.
Paratransit operating expenses, as shown in Table 13, were $4,420.8 million and represented13.0 percent of the total expenses in that category.
When totaled together, as shown in Table 14, paratransit expenses represented 10.7 percentof all capital and operating public transportation expenses.
In many small urban areas, paratransit operating expenses can be an even higher percentageof total operating expenses. Table 15 summarizes the FY 2008 public transit operating expensesfor the small urban city (population of 137,000) of Fort Collins, Colorado. For FY 2008, para-transit expenses represented 22 percent of the system’s operating expenses.
The type of flexible public transportation service that is being implemented most frequentlyin small urban areas is route deviation. As previously described, the operation of complemen-tary ADA paratransit service is expensive, and most agencies need to reduce costs in order toserve the growing public demand for public transit service. Now that most public transit systemsoperate fully accessible transit fleets and as communities complete the task of making sidewalksand bus stops accessible, persons with disabilities are more able to use the same services offeredto the general public. Many small urban areas have substituted fixed-route service with routedeviation service to eliminate the ADA requirement to provide for ADA complementary para-

transit service to fixed-route service. While this service design can be a very viable alternative,there are two mistakes small urban transit systems must avoid:
• The service should not be publicized as only for persons with disabilities.• The service should not be designed as fixed route with deviations added as an afterthought.
FTA has determined that flexible public transportation services, including route deviation,are not fixed-route services; therefore, ADA complementary paratransit service is not requiredwhere flexible public transportation is operated. However, the service must be flexible anddeviate for the general public. An agency cannot require persons requesting a deviation toprequalify as elderly or a person with disabilities in order to schedule a pick-up or request adeviated destination.
The other mistake that some small systems make is not properly planning for the demand-responsive service features of route deviation as a flexible public transportation service.Sometimes small systems have approached the provision of route deviation service from afixed-route service perspective instead of a demand-responsive service perspective. This notonly causes disappointment when policymakers realize that the costs per passenger of pro-viding flexible public transportation is higher than fixed-route service, it causes discontentamong passengers who do not have the benefit of a more comprehensive and interactive call-taking and dispatching system, as is required of demand-responsive services. Commu-nication is more complex, given the need for both external and internal interactions. Advancedcommunication capability does become more important as the productivity and complexityof the demand-responsive system increases. The passenger communications systems and thedriver skills needed for complementary ADA paratransit service can be modified to work onflexible public transportation service. Smaller vehicles are almost always used in providingdemand-responsive services since productivity is limited. Fares are almost always nominalin nature.
Transit operators in small urban areas should follow the decision guide presented as Figure 18 in considering whether its service area is a good candidate for flexible public trans-portation services.
2.3 Large Urban Flexible Public Transportation Service
Large urban areas present some new opportunities for the provision of flexible publictransportation service. While there is limited opportunity for comprehensive implemen-tation of flexible public transportation service because of the overall higher population densities, there are some areas where population densities are conducive to flexible publictransportation service. For many years, urban populations have been moving to the suburbs,creating communities that are more automobile oriented and less dense than communitiesin the city center. In some instances, the movement to the suburbs has created pockets of lessdensely populated communities in the urban core. In some circumstances, a major event,such as Hurricane Katrina in New Orleans, Louisiana, has created an urban location that hasa lower density rate more conducive to flexible public transportation services. Research hasshown that low-density urban areas in which major transportation activity centers—such asrail stations, transit hubs, shopping centers, medical centers, employment parks, andschools—are located are conducive to flexible public transportation. The most informativeresearch results on this subject are contained in a report on Denver, Colorado’s, RTD call-n-Ride Service (Transportation Management & Design, 2008). Other opportunities for flexiblepublic transportation service include service in low/medium (500 to 1,000 persons per square
Framework/Decision Matrix for Considering Flexible Public Transportation Service 27

mile) density service areas during lower than normal demand periods, e.g., nighttimes and/or weekends.
Best Practices in Transit Service Planning (Mistretta et al., 2009) lists several service areacharacteristics that should be measured when planning for public transportation services.These measures include population density, employment density, age, income, and vehicleavailability (10):
• Population Density– Persons per square mile– Dwelling units per acre– Minimum number of households
• Employment Density– Employees per square mile– Employees per acre– Employees per employer (threshold)
• Age– Population age 18 and younger– Population age 60 and older
• Income– Number of households with incomes less than $10,000– Per capita income
28 A Guide for Planning and Operating Flexible Public Transportation Services
Figure 18. Decision guide for small urban areas (50,000–200,000 population).

• Vehicle Availability– Zero car households– One-car households
A report on flexible public transportation in Denver (Transportation Management & Design,2008) identified five of these variables as having the highest overall correlation to the perfor-mance of flexible public transportation services (4):
• Population density• Employment density• Senior density• Youth density• Median income
Large urban fixed-route public transportation systems that have routes or areas that haveridership productivity rates that approach 5 to 16 passengers per hour are strong candidatesfor flexible public transportation service options. Pierce Transit in Washington State (seeChapter 4) provides a flexible public transportation service that operates route deviation andrequest stops. The Pierce Transit productivity standard for its flexible public transportationservice is 5 passengers per hour. The Regional Transportation District (RTD) in Denver, Col-orado (see Chapter 4), provides a flexible public transportation service called call-n-Ride thatoperates point deviation, demand-responsive connector, and route deviation. RTD’s call-n-Ride service standards analysis for FY 2007 show that the number of passengers per hourranges effectively from 1.7 to 14.6, with an average of 4.9. Call-n-Ride productivity for FY2008 ranges from 2.7 passengers per hour to 9.7 passengers per hour. One call-n-Ride route,Gateway, had a productivity rate of 19.1 passengers per hour in FY 2008, but this rate appearsto be outside of the norms.
In the RTD Call-N-Ride Performance Review (Transportation Management & Design, Inc.,2008) was the following “key finding” (10):
• Routes with scheduled stops are the most productive call-n-Ride services.
The call-n-Ride services offering point deviation and scheduled checkpoints perform significantly bet-ter than those that do not. These particular services seem to work well for regular commuters who rou-tinely ride the call-n-Ride services. The consistency of service helps to increase its attractiveness to riderswho require the same service on a repeated basis. Although the implementation of point deviation is par-tially brought about by high ridership demand, designing other call-n-Ride service areas to provide check-point service, if applicable, may help to increase the performance, as it helps to create a base market withconsistent ridership. Utilizing scheduled stop service eliminates the need for customers to call ahead toplan trips, allowing for more spontaneous ridership.
The productivity rates for Omnilink, a flexible public transportation service provided by thePotomac and Rappahannock Transportation Commission (PRTC) in Virginia (see Chapter 4),were 15.4, 15.8, and 16.1 passengers per hour, respectively, for the past 3 years.
In large urban areas, the flexible public transportation service area must be defined to facilitateoptimal service operations. The optimal physical size of an area for flexible public transportationservice is dependent on several factors, including population demographics, population density,topography, and the presence of a major transportation activity center; however, considerationmust also be given to optimal vehicle operating times. For zone routes, for example, the servicearea must be small enough for the vehicle to reach end points at defined intervals, e.g., every 30,45, or 60 minutes.
Transit operators in large urban areas should follow the decision guide presented as Figure 19in considering whether certain parts of its service area are good candidates for flexible publictransportation services.
Framework/Decision Matrix for Considering Flexible Public Transportation Service 29

30 A Guide for Planning and Operating Flexible Public Transportation Services
Figure 19. Decision guide for large urban areas(over 200,000 population).

The intent of this chapter is to guide local agencies through the process of implementing newflexible public transportation services. There are numerous reasons why a community or agencychooses to operate flexible public transportation services. Based on this research effort, threeoperating environments were identified as good candidates for flexible public transportationservices. They are all rural areas, small urban cities, and selected applications in urban and sub-urban areas.
While communities operate different types of services for different reasons, there are some gen-erally shared circumstances and related operational responses. Often, fiscal constraints, geographicchallenges, and ridership behavior patterns influence the public transportation mix in any locale.Some reasons for considering flexible public transportation services are the following:
• Improving productivity for general public demand-responsive systems• Serving special needs populations (ranging from senior citizens to students)• Replacing all or some fixed routes with flexible public transportation service to reduce or
eliminate the need for complementary ADA paratransit service• Providing limited employment transportation such as Job Access and Reverse Commute (JARC)• Providing connections to other public transportation services in the area• Providing basic mobility and travel options when demand is low• Introducing public transportation to new areas and/or new users
Prior to undertaking the implementation of new flexible public transportation services, it isnecessary to take the following key steps, which will be described in this chapter:
• Analyze existing conditions• Obtain input from policymakers and the community• Plan and schedule flexible public transportation services• Determine capital needs—vehicles and technology• Understand the costs• Market the new service
3.1 Analyzing Existing Conditions—What Data Should I Review?
Implementing flexible public transportation services in an existing public transportation oper-ation requires an understanding of the agency’s existing conditions. These issues vary accordingto the type of service currently provided by the agency and the area to be served by the flexiblepublic transportation service. In all cases, drivers and supervisors should be involved with plannersand management in analyzing existing conditions and considering options. These employees are
31
C H A P T E R 3
Implementing New Flexible PublicTransportation Services

closest to the customers and the operating environment and can offer valuable advice. Further,drivers and supervisors need to buy-in to the change since they will be ultimately responsible fordelivering the new service.
Rural Areas
Agencies that serve rural areas of extremely low density (up to 500 persons per square mile)should review and understand the following data when considering flexible public transportation:
• Population density• Senior citizen density• Youth density• Low-income and/or subsidized housing• Senior citizen housing• Trip destination locations (e.g., discount stores, hospitals, senior citizen centers, and activity
centers for persons with disabilities)• Trip purpose
Public transportation in rural areas usually serves the most transit-dependent populations.When the service is general public demand-responsive service, the agency operates service basedon demand and groups trips together on a daily basis; there is little need to understand the demo-graphics of the service area. Since flexible public transportation service must contain some typeof schedule and time, the agency must take steps to understand as much as possible about the loca-tions of potential riders. Since senior citizens, persons with disabilities, and youth have the high-est potential to be users of flexible public transportation service, transportation providers need toknow where members of these groups live and where they want to travel. By plotting populationdensities, e.g., concentrations of people in a given area, it is easy to predict where most trips willoriginate. Many rural areas can look to their regional planning organizations to provide these data.These regional planning organizations often help to facilitate locally coordinated transportationplans that are used to prioritize federal funding for transportation. Population density data aremost useful when socioeconomic characteristics such as age and income are considered.
An agency that is already operating demand-responsive service should examine trip patternsduring a 6-month period to identify common destinations. If riders frequent a transportationgenerator—such as Walmart, a hospital (for non-emergency trips), or a senior citizen nutritionprogram—it may be more cost-effective to create a flexible public transportation service routeto serve the hospital twice each week, instead of making that trip every day for fewer passengers.A possible guideline is to consider any destination that generates over five individual trips perweek as a candidate for a flexible public transportation service route. The next step would beto determine whether the origination point is conducive to grouping the trips in a scheduledflexible public transportation service zone route. The operation and routing of service bySouth Central Adult Services (described in Chapter 4) in North Dakota is a good example ofthis type of service.
Other agencies operate one or two fixed routes in rural areas in relatively close proximity to aCBD where many services and shops are located. These agencies are therefore required to oper-ate complementary ADA paratransit. When considering more cost-effective options, these agen-cies should determine the trip purposes of their current riders. If the trips are time sensitive, suchas work or school commutes, flexible public transportation services may result in a loss of rid-ers. Work and school commuters tend to want to minimize their travel time since they make thetrip so frequently. However, if the trips are for shopping or non-emergency medical purposes,current riders will be less inconvenienced by flexible public transportation service. MasonCounty Transit Authority (described in Chapter 4) is an example of a rural area in Washington
32 A Guide for Planning and Operating Flexible Public Transportation Services

State that evolved from general public demand-responsive service to route deviation flexiblepublic transportation service.
Small Urban Areas
Small urban areas (50,000 to 200,000 in population) are usually the best candidates for theroute deviation or point deviation forms of flexible public transportation service. In these areas,the following factors should be considered when assessing whether flexible public transportationservices are viable:
• Current route productivity• Population density• Senior citizen density• Youth density• Income levels• Trip purpose
Agencies operating fixed-route service in small urban areas should first determine whether thetransit system has productivity rates of fewer than 15 passengers per hour. If so, the entire transitsystem can be considered for flexible public transportation services. This research effort has shownthat flexible public transportation services can achieve productivity rates of up to 15 passengersper hour. A second factor to consider is the trip purposes of the current riders. If passenger tripsare largely work or school commutes, the agency is less likely to be in a position to successfullyoperate route deviation throughout the day. In these cases, the agency could consider operatingflexible services during off-peak periods, limiting the need to provide complementary ADA para-transit service to those peak periods when fixed-route service is operated.
Population densities are also an important consideration because concentrations of transit-dependent persons, including senior citizens, youth, and low-income persons, may impact thenumber of deviations and the scheduled trip time.
Large Urban Areas and Suburban Areas
Many large urban (population over 200,000) transit systems have service standards for differenttypes of service. These standards allow management to measure the efficiency and effectivenessof the service. When routes do not meet the standards, management will consider alternativesranging from reducing service frequency to eliminating the service completely. Further, stan-dards can be used to determine whether conditions exist for implementing new service. Onealternative, especially in areas outside of the core area, is substituting the regular route servicestandard for less frequent, but more targeted, flexible public transportation service.
Flexible public transportation services in medium and large urban areas have been proven suc-cessful in limited applications. Due to higher ridership and the high use of public transportationfor work and school commutes in these areas, a systemwide approach to flexible public trans-portation service is usually not advised. The most frequently reported applications for flexiblepublic transportation service in urban areas are the following:
• Suburban residential and mixed use as feeder to other transit connections• Office campuses• Replacement of an unsuccessful bus route• Urban night owl service• Residential community constrained by geographic barriers such as lakes, mountains, etc.• Suburban residential as circulators for senior citizens and youth
Implementing New Flexible Public Transportation Services 33

• New suburban residential• Areas never served by transit
Key data to examine when considering flexible public transportation service in urban areasare the following:
• Population density• Size of area to be served• Travel time to connector or time point• Employment density• Household density• Auto ownership• Senior citizen density• Youth density• Median income• Productivity of existing routes, if any
In large urban areas, both residential and employment population densities are key data fac-tors to consider in understanding whether flexible public transportation service can be utilizedeffectively. Other factors to consider include the following:
• Are there routes outside of the core area where ridership productivity is below 15 passengersper hour?
• Are there areas with significant origins or destinations, near a transit connection such as busrapid transit (BRT) or light-rail line that are not served by public transportation?
• Are there times of day when ridership is low, but public transportation is needed?• Are there special needs groups, year round or seasonally, that could travel within a small area
or zone?
3.2 Obtaining Community and Policymaker Input
Obtaining community input on decisions such as the type of transportation service to beimplemented and the area to be served is vital to planners and local officials. The communityshould be engaged early on in the planning process and stay engaged through implementationand operations. In several communities studied for this research, community leaders initiateddiscussion with the transportation provider about implementing local, community-based trans-portation that resulted in flexible public transportation service, often in the form of zone routes.Ongoing community involvement builds support and creates advocacy for the new service. Thisresearch revealed a broad range of outreach techniques that are employed by flexible publictransportation service providers, including town hall type meetings and information fairs. Themost prevalent outreach methods reported by operators of flexible public transportation serviceswere the following:
• Public meetings/hearings• Targeted presentations to civic clubs, neighborhood associations, and church groups• Website forums• Citizen’s advisory committees• Surveys• Mixed media, i.e., print and broadcast
Communities should use the public involvement technique that is most appropriate for theevent purpose and audience. The surveys and case study interviews pointed out that involvementis critical, and marketing the services is a major challenge. To increase the likelihood of success,
34 A Guide for Planning and Operating Flexible Public Transportation Services

agencies and communities should try a number of techniques and settle on those that are mostappropriate for their communities.
3.3 Planning and Scheduling Flexible Public Transportation Service
As stated previously, the logistics of flexible public transportation services are more related todemand-responsive service than fixed-route service. Deviations consume time, and unscheduledactivity is problematic for fixed-route service. Even without route deviations, fixed-route service canhave its schedule disrupted by weather, accidents, passenger illnesses, traffic congestion, railroadtrains, and lift deployments. Fixed-route schedules need recovery time to ensure that, no matterwhat unscheduled activity occurs, the next trip can begin at the scheduled time. Fixed-route sched-ules already build in up to 10 percent or more of the total scheduled time for recovery (3 minuteson a 30-minute trip and 6 minutes on a 60-minute trip). Each route deviation can take 3 to 10 min-utes, therefore, adding the time for recovery and the deviation can make the ability to schedule timesmore difficult, especially if 50 percent or more of the time has an unknown factor to it.
Rural Areas
One advantage in providing flexible public transportation service in rural areas is introducinga time component to the service. In low-density areas, there is less likelihood of the unscheduledactivities that occur in small urban and large urban areas. It is also probable that the passengerproductivity potential is lower than the maximum threshold for utilizing fixed-route service.There also is probably not another scheduled trip for the bus to make after the main trip. As aresult, the process for scheduling flexible public transportation service in rural areas is simplerand could entail the following steps:
• Developing a route that has stops at all the major origins and destinations of the purpose ofthe trip(s).
• Calculating the running time from Point A to Points B, C, and D along the way, using a speedunder the posted speed limits.
• Adding 20 to 25 percent additional time for expected daily deviations on a daily basis.
Small Urban Areas
In planning and scheduling flexible public transportation service in small urban areas, it isimportant to understand the neighborhoods to be served, the street system, and the logicalplace(s) for service to “meet.”
Since all small urbanized areas receive FTA Section 5307 funding for capital, operating, andpreventative maintenance expenses, they currently operate some form of public transportation,most likely fixed-route service. Routes generally have trip times that allow the buses to meet every30, 45, and/or 60 minutes at a designated point, often a transit center. Recovery time is alreadybuilt into the fixed-route schedule. When planning and scheduling flexible public transporta-tion service, the unscheduled time should be approximately 50 percent of the actual time to allowfor flexibility and recovery.
Large Urban Areas
In planning and scheduling flexible public transportation service in large urban areas, it isimportant to understand the area to be served, the street system, the natural and man-madebarriers, and the logical place(s) for service to target.
Implementing New Flexible Public Transportation Services 35

Flexible public transportation service areas should be small enough to allow buses to penetrateand return in logical times, e.g., 30, 45, and/or 60 minutes. As a result, the service area should beno larger than 4 to 10 square miles. Flexible public transportation service works well in areas withbarriers such as mountains, water, and railroad tracks. The important time points are providedat the major transportation activity centers such as rail stations, shopping centers, and transit cen-ters. Routes should be developed to allow the buses to serve the activity center every 30, 45, and/or60 minutes such that passengers can know the service frequencies. When planning and schedul-ing for flexible public transportation service in these circumstances, the unscheduled time shouldbe approximately 50 percent of the actual time to allow for flexibility and recovery.
3.4 Understanding the Costs
The cost of providing flexible public transportation service is measurable, and, while it mayvary from region to region, there is enough cost history available to compare flexible publictransportation service costs to fixed-route costs across the three operating environments identi-fied for this study. Most agencies did not calculate the cost per trip for flexible public transporta-tion services; therefore, for the purposes of this analysis, where flexible public transportationservice costs are not available or where flexible public transportation service does not actuallyoperate, its costs were presumed to be similar to those of demand-responsive service.
According to the 2007 National Transit Database (NTD), the national averages for directlyoperated demand-responsive service cost per trip was $26.95 and the directly operated fixed-route motorbus service cost per trip was $3.21. These rates are similar to the national averagesfor the combined directly operated and purchased transportation cost per trip of $28.52 fordemand-responsive service and $3.19 for fixed-route motorbus service. To gain a better under-standing of flexible public transportation service costs, the cost per trip for the three operatingenvironments identified in the study are presented below.
Rural Areas
Most flexible public transportation services are operated in rural areas that include large areaswith low-density populations, large counties with low-density populations, and small rural com-munities and towns with low-density populations. The cost per trip among rural serviceproviders varied across regions, but the rates do show that flexible public transportation servicecosts in rural areas are less than the national averages. For example:
• South Central Adult Services in North Dakota (see Chapter 4 for more information) operatesflexible public transportation services (route deviation and zone routes) and reported cost pertrip rates of $10.37 for 2008.
• Western Maine Transportation Services, Incorporated (WMTS) in Auburn, Maine, a private,non-profit corporation that provides fixed-route and demand-responsive transportationservices, reported cost per trip rates of $12.18 for demand-responsive service and $3.66 forfixed-route bus service in 2007.
• Santee Wateree Regional Transportation Authority (SWRTA) in South Carolina, a rural multi-county jurisdictional agency, reported a 2007 cost per trip rate of $35.27 for demand-responsiveservice and $8.01 for fixed-route bus service.
Small Urban Areas
Flexible public transportation services are operated in a number of small urban areas wherepopulation densities can range from low/medium (500 to 1,000 persons per square mile) tomedium/high (1,000 to 2,000 persons per square mile). In a number of these small urban com-munities, the public transportation agency does not provide many work trips, and flexible pub-lic transportation services obviate the need for complementary ADA paratransit service. The cost
36 A Guide for Planning and Operating Flexible Public Transportation Services

per trip rates among small urban service providers show that flexible public transportation ser-vice costs in small urban areas are less than the national averages. For example:
• City of St. Joseph, Missouri (see Chapter 4 for more information), operates flexible publictransportation service (route deviation and request stops) on each of its eight routes andreports a cost per trip of $10.46.
• Decatur Public Transit System in Decatur, Illinois, reported a 2007 cost per trip of $9.98 fordemand-responsive service and $3.63 for fixed-route bus service.
• Middletown Area Transit District (MAT) in Middletown, Connecticut, reported a cost pertrip of $15.02 for demand-responsive service and $3.19 for fixed-route bus service.
• City of Fargo, North Dakota, reported a 2007 cost per trip of $7.17 for demand-responsiveservice and $6.45 for fixed-route bus service.
Large Urban Areas
Limited flexible public transportation services are generally operated in large urban areas, andthey usually fulfill a specific need—nighttime service; service to low-density areas; or feeder orconnector service to fixed route, rail, or major traffic generators such as employment centers andshopping malls. In addition, flexible public transportation service can also serve to introducechoice riders to public transit services in some limited circumstances. The cost per trip ratesamong large urban service providers show that flexible public transportation service costs inlarge urban areas are similar to the national averages. All of the agencies listed below operate flex-ible public transportation services that are further described in Chapter 4 of this report. The costsof flexible public transportation service for these agencies were reported as the following:
• Jacksonville Transportation Authority (JTA) in Jacksonville, Florida, reported a 2007 cost pertrip of $46.77 for demand-responsive service and $6.00 for fixed-route bus service.
• Charleston Area Regional Transportation Authority (CARTA) in Charleston, South Carolina,reported a cost per trip of $36.27 for demand-responsive service, $23.83 for flexible publictransportation service, and $4.14 for fixed-route bus service in 2007.
• Regional Transportation District (RTD) in Denver, Colorado, reported a 2007 cost per trip of$30.18 for demand-responsive service, $13.51 for flexible public transportation service, and$3.78 for fixed-route bus service.
• Potomac and Rappahannock Transportation Commission (PRTC) in Virginia reported a2007 cost per trip of $5.38 for its OmniLink flexible public transportation service and $7.59for fixed-route service.
Table 16 shows the cost per trip for different types of public transportation for selected agen-cies in each of the three operating environments identified in the study. The shaded areas in thetable indicate services that are not operated by the agency.
As the table shows, the cost per trip of flexible public transportation service is generally lowerthan demand-responsive service, yet much higher than fixed-route service.
3.5 Capital Needs—Vehicles and Technology
Transportation agencies and other providers of flexible public transportation services use avariety of vehicles to transport riders, ranging from passenger vans to regular transit buses. Anumber of considerations are factored into the choice of vehicles, including the following:
• Passenger loads• Ridership characteristics (ADA, senior citizens, etc.)• Width of travel lanes• Route or zone distances• Capital funding• Agency preferences
Implementing New Flexible Public Transportation Services 37

38 A Guide for Planning and Operating Flexible Public Transportation Services
Agency Name AreaServed
Cost Per Tripfor Fixed Route ($)
Cost Per Trip for DRT* ($)
Cost Per Trip for FPTS**($)
South CentralAdult Services
Council, Inc. (ND) Rural 10.37WMTS(ME) Rural 3.66 12.18
Santee Wateree (SC) Rural 8.01 35.27
Decatur Public Transit System
(IL)SmallUrban 3.63 9.98
City of St. Joseph (MO)
SmallUrban 10.46
City of Fargo(ND)
SmallUrban 6.45 7.17
MAT(CT)
SmallUrban 3.19 15.02
JTA(FL)
LargeUrban 6.00 46.77
Notavailable
CARTA(SC)
LargeUrban 4.14 36.27 23.83
RTD (CO)LargeUrban 3.78 30.18 13.51
*DRT =Demand-Responsive Transportation **FPTS = Flexible Public Transportation Services
Table 16. Cost per trip for different types of public transportation.
Type of Service Area
Type of Flexible Public Transportation Service
Recommended Vehicle Types
Rural Request StopsZone RoutesRoute Deviation
Passenger Vans ( 5–16 seats)Body-on-Chassis Vehicle (12–30 seats)Small Buses ( 18–35 seats)
Small Urban Route DeviationPoint DeviationRequest Stops
Body-on-Chassis Vehicles (12–30 seats)Small Buses (18–35 seats)
Large Urban Point DeviationDemand-Responsive
ConnectorFlexible Route SegmentsZone Routes
Body-on-Chassis Vehicles (12–30 seats)Small Buses (18–35 seats)
Table 17. Vehicle types and service areas.
A large majority of the survey respondents indicated that they used small, body-on -chassis busesto operate flexible public transportation services. This is not too surprising since most respondentswere small agencies and private, non-profit organizations that generally served areas of low densityin rural and small urban areas. Small buses and body-on-chassis vehicles are best suited for flexiblepublic transportation service in all areas. Table 17 shows the different types of vehicles recommendedfor each service area and the type of flexible public transportation service operated.
Vehicle Selection Issues
A number of variables should be considered when determining the type of vehicle to operatefor flexible public transportation service. Ultimately, the vehicle selected should closely fit the type

of service to be used and the operating and physical environment in which it will be operated. APennsylvania Department of Transportation Report titled Handbook for Purchasing a Small Tran-sit Vehicle (Bureau of Public Transportation, 1988) cited a number of factors to be considered inthe selection of a vehicle type and size. These include the following:
• Service considerations• Costs• Maintenance and storage capabilities• Operating environment• Other factors (i.e., government regulations, community acceptance, etc.)
A community or agency should evaluate the above factors and make the vehicle selectionbased on what they determine to be the best fit for their service needs.
Technology to Facilitate Flexible Public Transportation
The use of technology by agencies operating public transportation is now commonplace inthe United States. Agencies typically employ technology to achieve a higher level of passengerservice, increase capacity and quality of service, improve customer service, reduce system oper-ating costs, manage fleets, and improve service reliability. The same holds true for providers offlexible public transportation services. These providers use technology predominantly for com-munications and scheduling. The vast majority of survey respondents identified voice radio asthe most frequently used technology for flexible public transportation service. Voice radio wasfollowed by cell phones and computerized scheduling systems. Very few respondents indicateduse of AVL systems, GPS, or MDTs. Table 18 shows the different types of technology used byflexible public transportation service providers.
The deployment of advanced communication and scheduling technologies holds consider-able promise for improving the effectiveness and efficiency of flexible public transportation ser-vices. More sophisticated technologies have been identified and tested with the potential forimproving the delivery of flexible public transportation services, including the following:
• Interactive voice response technologies for handling customer requests• Accurate automatic vehicle location of buses• Powerful mathematical algorithms for calculating shortest path assignments• Fast processors to make the calculations feasible• Reliable communications systems with on-board MDTs
Implementing New Flexible Public Transportation Services 39
Type of Service Area Type of Technology Deployed
Rural Cell PhonesVoice Radio
Small Urban Voice RadioCell PhonesAVLComputerized Scheduling and
Dispatching SystemsLarge Urban Voice Radio
AVLGPSMDTsComputerized Scheduling and
Dispatching Systems
Table 18. Technology used to operate flexible public transportation services.

There is no doubt that the use of technology can greatly affect the timeliness and quality of flex-ible public transportation service; however, costs, staffing, and training of drivers and dispatchpersonnel are issues that must be considered.
Most agencies in rural and small urban areas deploy the same technologies and strategies usedfor demand-responsive service, including ADA complementary paratransit service, for their flex-ible public transportation services. A dispatcher and/or reservationist can accept requests for aflexible pick-up and radio the same to the driver or, if received a day in advance of the trip, canadd the pick-up to the driver’s daily manifest.
Larger agencies that operate service in a variety of areas or that carry more than 10 passengersper hour should invest in more sophisticated computerized scheduling systems designed for flex-ible public transportation services. This can involve direct communication with the driver, viacell phone or an on-board computer that accepts on-line reservations and inserts them into thenext available slot. The driver then checks the schedule before each trip leaves the time point.The most advanced systems identified during this research were found at RTD’s call-N-Rideservice and at the PRTC OmniLink service in suburban Washington, DC. Both of these servicesare further described in Chapter 4.
3.6 Marketing Flexible Public Transportation Service
It is very important to promote and advertise any type of new product or service. This is noless true for flexible public transportation service than it is for a new flavor of diet soda. The typeof marketing that most providers of flexible public transportation service found useful is directpresentations to community groups. Since flexible public transportation service usually serves aspecific clientele, area, or community, the public transportation provider should meet withmembers of the public at regular community gatherings to solicit input and feedback and pro-mote the service. The transportation provider can speak at the following:
• Senior citizen centers• Neighborhood associations• Local business groups such as a chamber of commerce• Community fairs• Events at colleges or local schools
The next most frequently used and probably least costly form of marketing was the agency’swebsite. More than half of the agencies participating in this research indicated that their websiteswere an effective and efficient way to publicize and explain flexible public transportation services.Appendix C of the contractor’s final report for TCRP Project B-35 (available by going towww.trb.org and searching for “TCRP Report 140”) contains a large array of marketing materialsfound on websites regarding flexible public transportation services.
In addition to presentations and websites, agencies include information on their flexible pub-lic transportation services on system maps, individual route timetables, and/or brochures. Feweragencies reported using paid advertising in print media or using direct mail as a method of pro-moting their service. One agency, JTA, used posters to promote flexible public transportation todifferent markets. An example of one poster is shown as Figure 20.
In summary, it is important for an agency to include information on flexible public trans-portation in its general marketing material. However, this type of service is usually communitybased, so marketing efforts should be focused on the target area. Making personal presentationsand distributing materials in the affected area are considered to be the most effective ways toreach potential riders.
40 A Guide for Planning and Operating Flexible Public Transportation Services

Implementing New Flexible Public Transportation Services 41
Source: JTA
Figure 20. Poster advertising flexible public transportation services.

This chapter summarizes the results of the best practices of successful flexible public transporta-tion services throughout the country. Using the results of the initial survey of public transporta-tion agencies, candidate flexible public transportation service agencies were identified for a moredetailed analysis. The agencies represented a broad cross section of transportation providers thathave implemented some type of flexible public transportation service. The following factors wereconsidered in identifying current flexible public transportation agencies for best practices:
• Geography (agencies selected from all regions of the United States)• Agency Type (both public and non-profit agencies)• Density (agencies serving both high- and low-density areas)• Number of Vehicles (a standard measure of the size of an agency)• Area Served by Flexible Service (urban, rural, or suburban areas)• Type of Flexible Public Transportation Operated (each of the six major types of flexible pub-
lic transportation service should be represented)• Participation in TCRP Synthesis 53 (Koffman, 2004) (further study of selected participants)
Twenty-six candidate agencies were initially identified and the following 10 agencies, shownin Table 19, agreed to participate in this research effort:
Nine of the agencies were public bodies and one was a private non-profit (South Central AdultServices). Three of the agencies (Mason County Transportation Authority, Pierce Transit, andPRTC/Omniride) had participated in the research reported in TCRP Synthesis 53: OperationalExperiences with Flexible Transit Services (Koffman, 2004).
For each participating agency, the following detailed information was collected:
• Agency Name– Type of agency, e.g., city or county department, private not-for-profit– Type of flexible public transportation service(s) operated
• Overall Service Area Characteristics– Population (transit-related demographics such as youth, income, senior citizen)– Area (square miles, topography)– Population densities (residential, employment)
• Flexible Public Transportation Service(s) Area Characteristics– Population (transit-related demographics such as youth, income, senior citizen)– Area (square miles, topography)– Population densities (residential, employment)
• Transit System Description for All Modes– Modes operated– Fleet size and type– Ridership
42
C H A P T E R 4
Best Practices of Successful FlexiblePublic Transportation Services
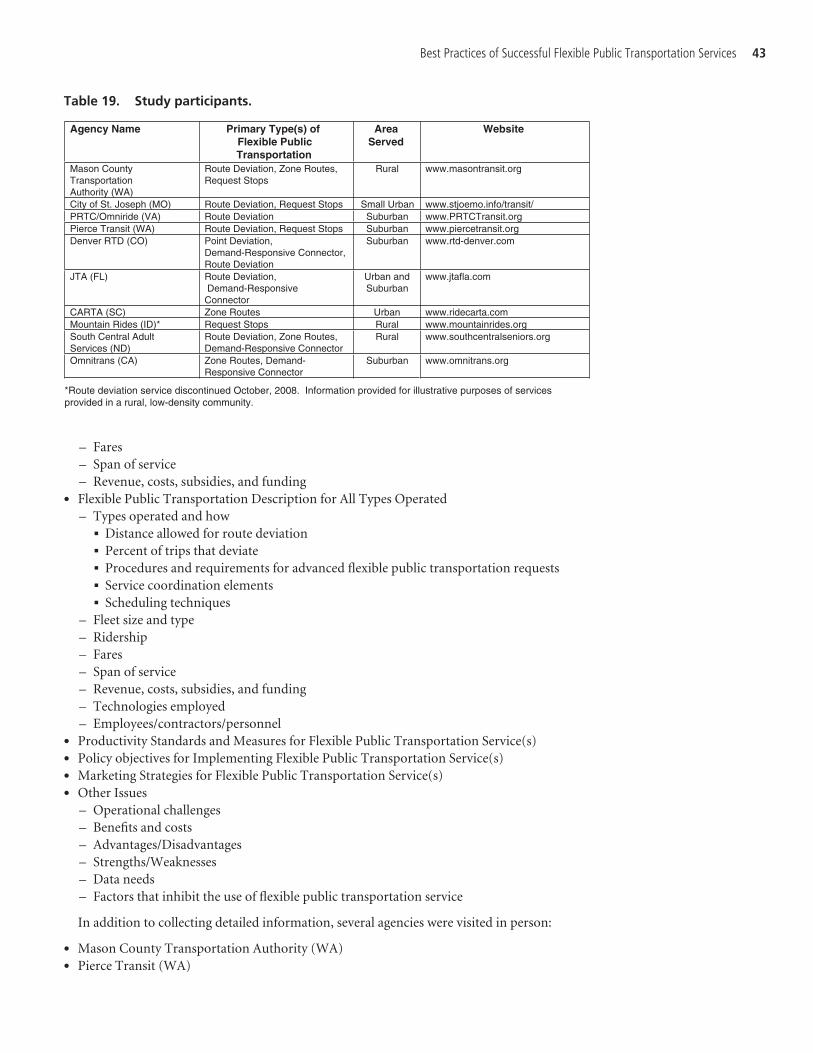
– Fares– Span of service– Revenue, costs, subsidies, and funding
• Flexible Public Transportation Description for All Types Operated– Types operated and how
� Distance allowed for route deviation� Percent of trips that deviate� Procedures and requirements for advanced flexible public transportation requests� Service coordination elements� Scheduling techniques
– Fleet size and type– Ridership– Fares– Span of service– Revenue, costs, subsidies, and funding– Technologies employed– Employees/contractors/personnel
• Productivity Standards and Measures for Flexible Public Transportation Service(s)• Policy objectives for Implementing Flexible Public Transportation Service(s)• Marketing Strategies for Flexible Public Transportation Service(s)• Other Issues
– Operational challenges– Benefits and costs– Advantages/Disadvantages– Strengths/Weaknesses– Data needs– Factors that inhibit the use of flexible public transportation service
In addition to collecting detailed information, several agencies were visited in person:
• Mason County Transportation Authority (WA)• Pierce Transit (WA)
Best Practices of Successful Flexible Public Transportation Services 43
Agency Name Primary Type(s) ofFlexible PublicTransportation
AreaServed
Website
Mason County Transportation Authority (WA)
Route Deviation, Zone Routes, Request Stops
Rural www.masontransit.org
City of St. Joseph (MO) Route Deviation, Request Stops Small Urban www.stjoemo.info/transit/PRTC/Omniride (VA) Route Deviation Suburban www.PRTCTransit.org Pierce Transit (WA) Route Deviation, Request Stops Suburban www.piercetransit.org Denver RTD (CO) Point Deviation,
Demand-Responsive Connector, Route Deviation
Suburban www.rtd-denver.com
JTA (FL) Route Deviation, Demand-Responsive Connector
Urban and Suburban
www.jtafla.com
CARTA (SC) Zone Routes Urban www.ridecarta.com Mountain Rides (ID)* Request Stops Rural www.mountainrides.org South Central Adult Services (ND)
Route Deviation, Zone Routes, Demand-Responsive Connector
Rural www.southcentralseniors.org
Omnitrans (CA) Zone Routes, Demand-Responsive Connector
Suburban www.omnitrans.org
*Route deviation service discontinued October, 2008. Information provided for illustrative purposes of services provided in a rural, low-density community.
Table 19. Study participants.

• City of St. Joseph (MO)• PRTC/Omniride (VA)• Denver RTD (CO)• JTA (FL)
These in-person site visits were conducted to observe firsthand the actual delivery of flexiblepublic transportation service. The visits included observing the service planning and schedulingfunctions. It also included riding the service to ascertain the actual operations and operatingenvironment. Interviews were conducted with agency staff and riders to better understand theperceived benefits and constraints of flexible public transportation service.
The results of the agency evaluations are presented in the remainder of this chapter.
4.1 Mason County Transportation Authority
Flexible Transportation Services: Systemwide Route Deviation, Zone Routes, and Request Stops
The Mason County Public Transportation Benefit Area is a special purpose district, authorizedby the State of Washington in 1975. Mason County voters approved the district in late 1991 and theMason County Transportation Authority began operating general public demand-responsivetransit service throughout the County, with connections to adjacent counties, in December 1992.
The following Mason County Transportation Authority staff met with the researchers duringan on-site visit to provide the information and background used for this case study:
• Dave O’Connell, General Manager• Jay Rosapepe, Operations Manager
Overall Public Transportation Service Area Characteristics
The Mason County Transportation Authority service area covers 961 square miles of land and90 square miles of water, with a 2008 estimated population of 57,846 persons. The density of theentire service area is approximately 51 persons per square mile. The racial makeup of the Countywas 90.8 percent white, 3.6 percent American Indian or Alaskan Native, 1.3 percent Black and1.2 percent Asian. Hispanics or Latinos of any race were 6.2 percent of the population. Themedian household income in 2007 was $47,200 and 17.1 percent of the population was age 65 andolder. The county seat is Shelton, the only incorporated city in the County. The topography rangesfrom sea level to 6,255 feet at the peak of Mount Washington. In 2006, the County received a nearrecord 81 inches of precipitation. The largest employer in the County is the Squaxin Indian Tribewith 700 employees. Many of the area residents travel outside of the County to jobs in Seattle (viaferry), Brinnon, Olympia, and Bremerton, WA.
Flexible Public Transportation Service Area Characteristics
The flexible public transportation service area characteristics are the same as the overall ser-vice area characteristics, since the flexible services are operated countywide.
Transit System Description for All Modes
According to its Transit Development Plan 2009–2014 and 2008 Annual Report (2009), Trans-portation Authority made 377,706 passenger trips and operated 35,545 revenue vehicle hours on itsroute deviation services in 2008. Mason County Transportation Authority also provided 57,286 pas-
44 A Guide for Planning and Operating Flexible Public Transportation Services
senger trips on its dial-a-ride service and 53,114 trips on vanpools in 2008. Mason County Trans-portation Authority operates nine deviated fixed routes on weekdays. One of these routes also oper-ates on Saturday. Most routes operate from 7:00 a.m. until 8:30 p.m. Mason County Transporta-tion Authority offers a number of regional transit connections at the following locations:
• Olympia Transit Center• Bremerton Transportation Center• Brinnon Store (with connections to ferries, Amtrak, and Greyhound)• Kimilche Transit Center (connecting to Squaxin Island Transit)
Over 54,000 of the deviated fixed-route passenger trips (14 percent) are worker/driver trips,where a worker at the local naval shipyard drives the bus and his/her co-workers to the shipyard.Some riders connect to the Washington State Ferries, while others work in the shipyard. Thevehicle stays at the shipyard for the return trip in the evening.
Transit service within Mason County is free of charge. Full cash fares to areas outside of theCounty are $1.00. Annual operating expenses for the entire system were $5.2 million. The primarysource of revenue for the service is sales tax revenue. Farebox revenue accounts for less than 10 per-cent of operating costs ($435,577). The bus fleet includes 19 buses ranging in size from 40-foot,low-floor Gilligs to 30-foot high-floor Bluebirds. Twenty-one cut-away vehicles are used for bothdial-a-ride and deviated fixed-route service. Thirty-three 12-passenger vans are used for vanpoolservice. As of December 31, 2008, Mason County Transportation Authority had 66 employees.
Flexible Public Transportation Service Description for All Types Operated
Route Deviation
Mason County Transportation Authority allows a deviation (up to 1 mile) off of the regular busroutes for those who experience difficulty getting to bus stops. Availability depends on road condi-tions and the number of requested deviations. The Mason County Transportation Authority maysuggest alternate pick-up locations if the bus cannot get to the stop initially requested by the passen-ger. Passengers are required to call the Mason County Transportation Authority Customer ServiceCenter a minimum of 2 hours in advance for this service. The dispatcher notifies the driver of same-day requests via two-way radio. The Mason County Transportation Authority does not collect infor-mation on the number or percentage of passengers that request a deviation. Figure 21 presents agraphic of the entire Mason County Transportation Authority service area, and Figure 22 shows anexample of a deviated fixed route.
Zone Routes
In addition to general public dial-a-ride service, the Mason County Transportation Author-ity also operates service that is limited to a geographic area (zone) and is limited to a specific timeof day or day of the week. Much of this service is known as After School Activity (ASA) serviceand operates on weekdays after 5:00 p.m. The Shelton and Pioneer School Districts operate fourafternoon general public deviated routes under contract to the Mason County TransportationAuthority. These routes have a scheduled start in downtown Shelton and transport the generalpublic (including students involved in afterschool activities), taking passengers directly to theirdestinations within the zone or to a connecting route.
Request Stops
At any time of the day, Mason County Transportation Authority passengers may flag busesat any safe location on the same side of the road the bus is travelling. Two of Mason CountyTransportation Authority’s deviated routes also have call/request stops located off of the fixed
Best Practices of Successful Flexible Public Transportation Services 45

route, where customers are required to call the Customer Service Center a minimum of 2 hoursin advance to request a ride at the designated call/request location.
Productivity Standards and Measures for Flexible Public Transportation Service
The Mason County Transportation Authority does not have established service productivitystandards for any of its transit services. In its 2009–2014 Transit Development Plan and 2008Annual Report (2009) the Mason County Transportation Authority noted the following produc-tivity data for 2008:
• 10.6 passengers/hour for route-deviated service• 2.3 passengers/hour for dial-a-ride service• 1.9 passengers/hour for vanpooling
Policy Objectives for Implementing Flexible Public Transportation Service
The Mason County Transportation Authority began as a countywide general public dial-a-rideservice. As transit ridership increased and as travel patterns became more distinct, the MasonCounty Transportation Authority made a decision to operate fixed routes, while allowing for theflexibility of the demand-responsive features of deviations off the fixed routes.
46 A Guide for Planning and Operating Flexible Public Transportation Services
Source: Mason County Transportation Authority
Figure 21. Mason County Transportation Authority service area.
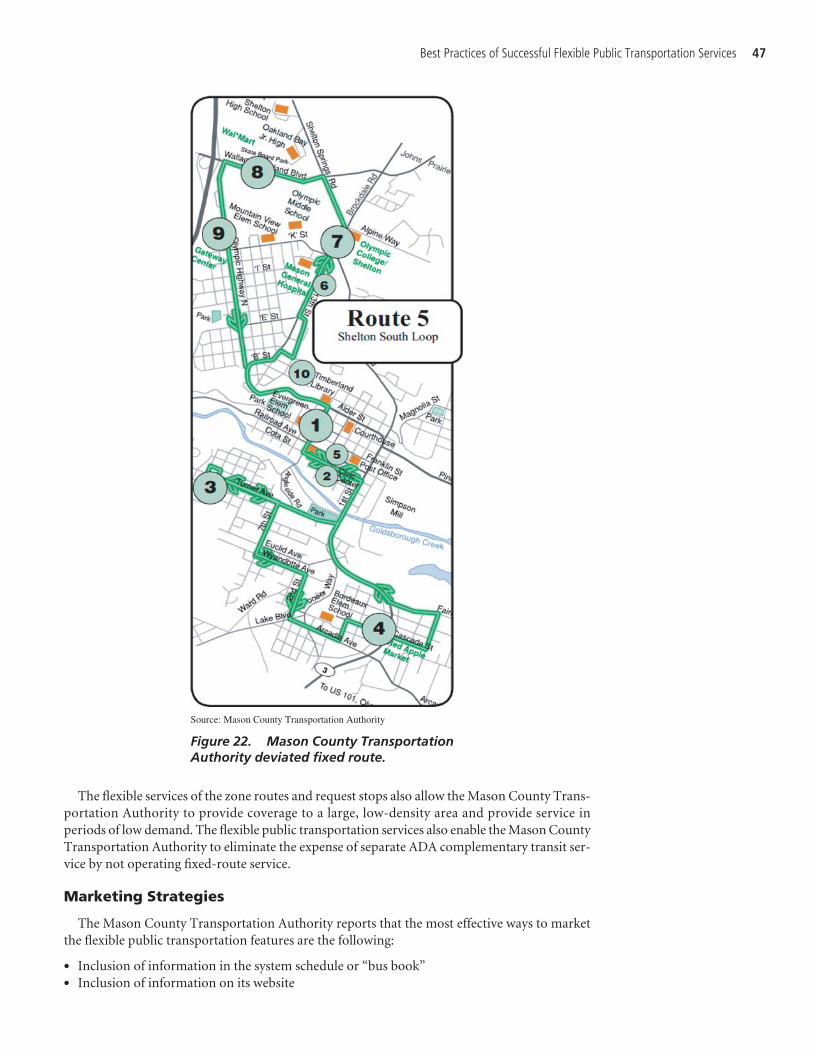
The flexible services of the zone routes and request stops also allow the Mason County Trans-portation Authority to provide coverage to a large, low-density area and provide service inperiods of low demand. The flexible public transportation services also enable the Mason CountyTransportation Authority to eliminate the expense of separate ADA complementary transit ser-vice by not operating fixed-route service.
Marketing Strategies
The Mason County Transportation Authority reports that the most effective ways to marketthe flexible public transportation features are the following:
• Inclusion of information in the system schedule or “bus book”• Inclusion of information on its website
Best Practices of Successful Flexible Public Transportation Services 47
Source: Mason County Transportation Authority
Figure 22. Mason County TransportationAuthority deviated fixed route.

• Presentations to community groups• Targeted mailings
Other Issues
The top area of concern for the Mason County Transportation Authority is the need forimproved technology to allow for better dispatching and scheduling of flexible public transporta-tion services. Current AVL technologies are ineffective given the differing geographic topographythroughout the service area.
4.2 St. Joseph Transit
Flexible Transportation Services: Route Deviation and Request Stops
St. Joseph Transit is the name of the municipal bus company for the City of St. Joseph, Missouri.St. Joseph Transit is an operating unit in the City’s Department of Public Works and Transporta-tion. St. Joseph is the largest city in northwest Missouri and is the county seat of Buchanan County.
The following St. Joseph Transit staff met with the researchers to provide the information andbackground used for this case study:
• Andy Clements, Assistant Director for Public Works and Transportation• Kurt Janicek, Resident Manager• Michelle Schultz, Operations Manager
Overall Public Transportation Service Area Characteristics
The St. Joseph Transit service area covers 49.5 square miles with a 2008 population of 75,000 per-sons. St. Joseph Transit serves the downtown business district and city neighborhoods, as well as sev-eral employment centers. The City of St. Joseph is located along the Missouri River, 35 miles northof Kansas City. Interstate 29 runs through St. Joseph, providing a corridor from Canada to Mexico.According to the 2000 Census, there were 29,026 households and 18,460 families residing in the City.The population density was 1,688 people per square mile. There were 31,752 housing units at anaverage density of 724.2 per square mile. The racial makeup of the City was 91.88 percent White,5.03 percent African American, 0.46 percent Native American, 0.47 percent Asian, 0.03 percentPacific Islander, 0.69 percent from other races, and 1.44 percent from two or more races. Hispanicor Latinos of any race were 2.61 percent of the population. The median household income in 1999was $32,663. St. Joseph Transit also serves Elwood, Kansas, a small city with a population of 1,145.Elwood, Kansas, is located just one mile from the city limits of St. Joseph.
Flexible Public Transportation Service Area Characteristics
Same as overall service area characteristics, since the flexible services are operated throughoutthe City.
Transit System Description for All Modes
St. Joseph Transit operates flexible public transportation service on each of its eight regularroutes. The system is known as The Ride and provides a fixed-route system with route deviationand request stops.
According to its Riders Guide (2007), in 2007, St. Joseph Transit carried 417, 906 passengersalong eight bus routes. The bus fleet includes 20 buses, with 16 in daily use and 4 in reserveas spares. There are three transfer centers, one intermodal transit center, and over 460 bus stops.
48 A Guide for Planning and Operating Flexible Public Transportation Services

St. Joseph Transit also provides bus service to Elwood, Kansas. In addition to its eight local routes,St. Joseph Transit operates a limited night schedule on three routes. Route deviation is not offeredon these three routes. This service is called Nite Ride and provides job access and reverse commuteopportunities to St. Joseph citizens living in the U.S. Census designated low-income areas of theCity. Nite Ride operates Monday through Saturday from 9:15 p.m. to 5:15 a.m.
St. Joseph Transit operates six days a week on its eight fixed routes, and five nights on its threeNite Ride routes. St. Joseph Transit’s FY 2009 Operating Budget projected $246,000 of operat-ing revenue to cover operating expenditures of $4 million. The base cash fare for all routes is$1.00, with a $.50 charge for route deviation. Discounted cash fares are available for seniors,youth, and individuals with disabilities.
Flexible Public Transportation Service Description for All Types Operated
Fixed-Route Deviation
Each of St. Joseph Transit’s eight local routes operates as a deviated fixed route. St. Joseph Tran-sit implemented this service in 1999 and calls its bus service The Ride. These routes are operatedusing a fleet of 30-foot, Gillig low-floor vehicles that have a seating capacity of 25 passengers. Priorto 1999, St. Joseph Transit operated a point-deviation system. The point-deviation system oper-ated along with a separate ADA complementary paratransit service. The City surveyed its citizensand determined that a single-route deviation system would provide better service than the sepa-rate point-deviation and paratransit systems. Figure 23 displays the system map for The Ride.
Best Practices of Successful Flexible Public Transportation Services 49
Source: St. Joseph Transit
Figure 23. St. Joseph Transit system map for The Ride.

Under the current route-deviation system, buses follow a fixed route and schedule but devi-ate into neighborhoods upon request, always returning to their regular routes. Riders have theoption of being picked up at a regular bus stop or scheduling a pick-up at other pre-approvedlocations. The deviation can be up to 3⁄4 mile from its designated fixed route, depending upondemand. A maximum of 10 deviations per trip are allowed. All of the buses are ADA compliant.St. Joseph Transit does not operate a separate complementary ADA paratransit service since itsentire service is route deviation. St. Joseph Transit reports that of approximately 1,400 daily pas-sengers, 300, or 25 percent of its passengers, actively use route deviation. St. Joseph Transit esti-mates that 4 percent of these passengers are ADA clients.
Monthly ridership data for the eight routes are provided in Table 20.
Customers requesting pick-up at an off-route designated bus stop are advised to call at least 1 day in advance of the requested trip. St. Joseph Transit will take same-day reservations forpick-ups, but passengers may have to wait at least 1 hour before a pick-up on weekdays andup to 2 hours on Saturday. Once on board a bus, riders can simply inform the driver of thelocation of the stop where they wish to be dropped off. The driver will honor an off-routestop if schedules allow and the street location is suitable for the vehicle. There is a $.50 sur-charge for on-route or deviated services. The Ride operates on weekdays and Saturdays, withno service on Sundays.
Productivity Standards and Measures for Flexible Public Transportation Service
St. Joseph Transit did not identify specific productivity standards but provided performanceindicators (presented in Table 21).
50 A Guide for Planning and Operating Flexible Public Transportation Services
Route Name
St. Joseph Avenue Lovers Lane Fredrick Avenue Faraon/Jules MO Western Industrial Park Stockyards King Hill
JuneFY 2007Monthly
Ridership
2,998 3,051 6,923 5,285 4,524 2,499 3,840 1,940
JuneFY 2008Monthly
Ridership
2,563 2,431 6,127 4,810 4,588 3,193 3,185 1,915
JuneFY 2009Monthly
Ridership
2,617 2,134 5,736 4,378 4,388 2,280 2,614 1,516
Table 20. St. Joseph Transit ridership.
All Routes FY 2007 FY 2008 FY 2009
Passengers 417,906 408,696 382,039 Total Expenses $3,820,636 $4,207,971 $3,059,678 Route Deviations 99,939 76,269 52,400 Revenue Hours 70,528 70,272 52,896 Revenue Per Passenger $0.32 $0.35 $0.65 Expense Per Hour $54.17 $57.84 $57.88 Total Expense per Passenger $8.82 $9.75 $10.00
Table 21. Performance indicators.

Policy Objectives for Implementing Flexible Public Transportation Service
• Provide coverage to a large, low-density area• Reduce or eliminate the expense of providing an ADA-complementary paratransit service• Respond to community preferences and geography
Marketing Strategies
• Specially designed brochures• Television and radio advertisements• Presentations to community groups• Implementation of a Riders Advisory Committee (future)
Other Issues
• Financial constraints limit the number of routes, and the 1-hour headways mean that a roundtrip takes 2 hours of travel time for passengers and operators.
• There is no service on Sundays, which may leave disabled persons without any means ofaccessing emergency or social trips.
• The flexible public transportation service may be dependable, but it is not convenient forchoice or captive riders.
4.3 Potomac and Rappahannock Transportation Commission
Flexible Transportation Services: Route Deviation
The Potomac and Rappahannock Transportation Commission (PRTC) is a multi-jurisdictionalagency representing Prince William and Stafford Counties and the cities of Manassas, ManassasPark, and Fredericksburg. PRTC operates a number of transportation services to meet the needsof area residents. These services are known locally as
• OmniRide• Metro Direct• OmniLink• Cross Country Connector• OmniMatch• Virginia Railway Express
PRTC provides commuter bus service along the busy I-95 and I-66 corridors to points north(OmniRide and Metro Direct) and bus services in Prince William County and the cities of Man-assas and Manassas Park (OmniLink and Cross County Connector). PRTC also offers Omni-Match, a free ridesharing service. Operated by PRTC in partnership with the Northern VirginiaTransportation Commission (NVTC), the Virginia Railway Express (VRE) provides commuterrail service along the Manassas and Fredericksburg lines, connecting to transit providers at sta-tions in Virginia and the District of Columbia.
The following PRTC staff met with the researchers to provide the information and back-ground used for this case study:
• Eric Marx, Director of Planning and Operations• Joan Martin-Morris, Customer Service Supervisor
Best Practices of Successful Flexible Public Transportation Services 51

Overall Service Area Characteristics
The PRTC transit service area covers 360 square miles with a population of over 425,000 per-sons. PRTC is located in Northern Virginia, about 25 miles southwest of Washington, DC. ThePRTC transit system serves two basic demographic groups—commuters into Washington, DC,and Arlington, VA, and transit-dependent local services in five jurisdictions that include twocounties and three cities. The service area population density is 1,180 persons per square mile.OmniRide and Metro Direct bus riders tend to be choice riders, meaning that although they mayhave an automobile available to them, they choose to ride the bus to reduce trip times and costs.Conversely, OmniLink, the flexible bus service, tends to serve disadvantaged populations andthose without access to an automobile, such as senior citizens, persons with disabilities, youth,and low-income workers.
Flexible Public Transportation Service Area Characteristics
PRTC operates OmniLink, a flexible public transportation service on six routes. OmniLink isa local demand-responsive bus service operating through the more heavily populated parts ofPRTC’s service area. It is a route-deviation system blended with fixed-route characteristics toprovide transit services for all area residents without operating a separate ADA paratransit sys-tem. Prior to 1995, there was no local public transportation in the PRTC area, and OmniLinkbegan as a flex route operation, i.e., there never was fixed-route service with complementaryparatransit. PRTC estimates that it achieves a 25- to 50-percent savings by operating one serviceversus two separate services.
Transit System Description for All Modes
PRTC operates commuter bus service with its OmniRide and Metro Direct routes betweenthe PRTC local service area and Metrorail stations, local bus service with its six OmniLink flex-ible routes and one Cross County Connector route.
OmniRide is a commuter bus service for residents of Prince William County, Manassas, andManassas Park, VA, traveling to Washington, DC, Arlington, VA, and suburban Tysons Cornerin Fairfax County, VA (service to Tyson’s corner was added recently). OmniRide operates inboth the I-95 and I-66 corridors on weekdays, with service inbound to Washington in the morn-ing and outbound in the evening. Some routes have limited midday service. OmniRide serviceis provided using 57-seat over-the-road coaches.
Metro Direct is a commute and reverse-commute bus service with limited stops from PrinceWilliam County, Manassas, and Manassas Park to the West Falls Church and Franconia-Springfield Metrorail stations. Service on two routes operates throughout the day on week-days with increased frequency during the normal commuting hours. The third route runs onlyin the peak direction during normal commuting times. Service is provided using 45-seat tran-sit buses.
Cash and the regional SmarTrip card may be used to board OmniRide and Metro Direct buses.Reduced fares are available for senior citizens and persons with disabilities during off-peak hours.Local trips on OmniRide and Metro Direct can be paid for with cash, SmarTrip card, pre-paidtoken, or day pass. Commuter bus fares are $4.75 if paid using SmarTrip and $6.50 if paid in cash.Metro Direct fares are $2.40 and $3.00, respectively.
OmniLink is a local demand-responsive bus service within Prince William County, Manassas,and Manassas Park. PRTC operates six OmniLink routes from around 5:40 a.m. to 10:45 p.m. on
52 A Guide for Planning and Operating Flexible Public Transportation Services

weekdays on most routes. Manassas area routes end around 8:00 p.m. Eastern area routesoperate on 45-minute headways (30 minutes during peak periods), while Manassas area routesoperate every 60 minutes throughout the day. Saturday service is provided from 7:30 a.m. to10:30 p.m. only in the eastern part of the County with mostly 90-minute headways. The differ-ence between eastern-area and Manassas-area service operating parameters is dictated by localgovernment preference.
Passengers may pay OmniLink fare using cash, pre-paid tokens, a local bus day pass, or aregional SmarTrip card. Fares are $1.10 for cash, tokens, or SmarTrip, while the local bus day passis $2.50 (cash only). Discounted cash fares are available for senior citizens, youth, and personswith disabilities at all times. There is a $1.00 surcharge for off-route deviations for able-bodiedcustomers and those under the age of 60.
For all modes for 2009, PRTC’s ridership was 3.1 million with annual vehicle revenue hoursof 160,000. During this period, an average of 108 vehicles of varied sizes operated during peakperiods. PRTC’s operating budget was $26.8 million, and it had a total of 235 full- and part-timeemployees—45 were PRTC employees and 190 were contracted employees.
Flexible Public Transportation Description for All Types Operated
Route Deviation
The six OmniLink routes operate as local deviated fixed routes. These routes use a fleet of 30-foot Gillig vehicles, which seat 30 passengers each. Buses follow a fixed route and schedule butdeviate off route upon request, always returning to the regular route. A deviated bus is notrequired to return to the route departure point but must serve all stops. In addition to the desig-nated bus stops, riders have the option of being picked up or dropped off at an off-route locationif they cannot get to an OmniLink stop or if their destination is not close to a bus stop. Deviationservice is provided within a corridor of 3⁄4 mile on both sides of each route. It is recommended thatreservations be made 1 to 2 days in advance. Nonetheless, trips may be scheduled with as little as2 hours advance notice. Riders can also make a standing order for recurring trips. All off-routetrips are subject to availability, which is limited by the need to maintain acceptable on-time per-formance. Additionally, there are a number of designated off-route locations on each route calledon-demand bus stops. Riders on board buses may be dropped at on-demand bus stops withoutprior reservation. Those waiting at on-demand bus stops call PRTC, and the next available bus isrouted to pick them up.
All of the OmniLink buses are ADA compliant, and PRTC does not operate a separate comple-mentary ADA paratransit service. PRTC reports that annual OmniLink ridership is approximately960,000, and its annual vehicle revenue hours are 61,000. In FY 2009, approximately 250 dailytrips, or 7.4 percent of total OmniLink ridership, used the flexible public transportation feature,with subscriptions accounting for about 40 percent of off-route trips. Figure 24 and Figure 25show two of OmniLink’s routes.
OmniLink’s annual budget in 2009 was $8.9 million. Average daily ridership for each of thesix OmniLink bus routes is provided in Table 22.
OmniLink buses operate on weekdays and Saturdays, with no service on Sundays.
Productivity Standards and Measures for Flexible Public Transportation Service
Selected performance indicators for PRTC’s OmniLink are presented in Table 23.
Best Practices of Successful Flexible Public Transportation Services 53

54 A Guide for Planning and Operating Flexible Public Transportation Services
PotomacRiver
OccoquanReservoir
LAKERIDGE
WOODBRIDGE
POTOMACMILLS
The GlenShopping Ctr.
Old Bridge FestivalShopping Ctr.
Lake RidgeCommons
Shopping Center
WoodbridgeHigh School
OakwoodComunity Ctr.
Tackett’s MillCommuter Lot
BrookeCenter S.C.
MarumscoPlaza
CVS
Marketat OpitzCrossing
PotomacLibrary
2200Opitz
McDonald’s
PotomacMills Mall
RiverRun Apts. Smoketown
Plaza
ElmFarm Virginia
EmploymentCommission
Ikea
Potomac Festival
Chinn Rec. Center(On Demand stopfor Loop A)
CarWash
START &END
1
Opitz Blvd.
PotomacHospital
Old B ridge Rd.
MinnievilleRd.
Smoketown
Lake RidgeCommuter Lot
Occoquan E.S.
ElmFarm
Route 123/I-95Commuter Lot
Maryland
Old Bridge & Route 123Commuter Lot
ClipperD
r.
WoodfernOakw
ood
Deepford
Cotton
Poto mac Mills Cr.Telegraph Rd.
Woo
d-ho
llow
Antie
tam
Harb
orDr.
Seminole
Mill Dr.
Griffi
th
CricketHedges
Run La.Sm
oketown Rd.
Wor
th
ReddyFeatherstone Rd.
Bayside
Longview Dr.
Mt. PleasantD r.
OccoquanGordon
Colby
Westridge
Dale Blvd.
Touc
hston
e
Bel AirSandra
Marys Way
Village Dr.
Horner Rd.
PRTC TransitCenter
Potomac
Mills
Dawson Beach
Hylton
Devil’s
Reach
Penn
ington
Hoffman
Shop
per’s
Bes
t
Hillendale
Teleg
raph
OldBridgeTitania
Dilli
ngha
m S
q.
Montgomery
PotomacWoods
LOOP A LOOP B
Loop Aonly
He
rndon
Ely
sian
Prince William Pkwy.
Jeffe
rson
Davis
Hw
y.
Moh
ican
Rd.
PrinceWilliam Pkwy.
784
95
640
641
123
1
3000
123
1
1
4
6
5b
5a
3a
3b
2
Loop A stops at Potomac Mills before the PRTC Transit Center.Loop B stops at Potomac Mills after the PRTC Transit Center.
The solid, colored line indicates the basic route OmniLink vehicles travel.
The shaded, colored areasindicate how far OmniLink vehicles may travel from the basic route (up to 3/4 mile) to pick up or discharge passengers.
OmniLink Service Area
See the other side of this schedule for more complete information on how to use OmniLink services.
T T(Route runs a Clockwise and Counterclockwise Loop —
See timetable for each direction)
NORTH
Map notto scale
Bus Stop(Bus also stops at the numbered timepoints)
On-Demand Stop
Transfer Point
Commuter Lot
Point of Interest
VRE Train Station
©2010, Potomac and RappahannockTransportation CommissionDesign by Smartmaps, Inc.
Connecting services:Amtrak, Greyhound(Subject to change
without notice)
WoodbridgeVRE Station
Source: PRTC
Figure 24. PRTC Woodbridge/Lake Ridge OmniLinkroute.
Welling ton Rd.
Stonehouse
Balls Ford
Balls Ford Rd.
Ashto nAve.
Battleview
Williamson
Seym
ourR
d.
Rosemary
Rixle
wLn
.
Digg
es
Bartlow
Sudley Rd.
NovaWayMiram
ar
Purdue
Emerald
Sage
Coverstone
Tremayne
Blendia
Ashl
and
Lomond
Ports
mouth
Ashton
Sudley Rd.Crestwood Dr.
Sudle
y Man
or
Bann
erwoo
dGo
dwin
Burn
side
Rollin
g
Plantation La.
Liberia Ave.
Sudley
Jack
son
GrantSton
ewal
l Rd.
Center St.
EastW
est
Portn
er
Liberia Av.
Cent
ervil
le Rd
.
Mat
his A
v.
QuarryeedebeZ Center St.
Center
Church
S. Main
Byrd
GrantHendley
Prince William Pkwy
29
234
234
234
28
28
66
3000
MANASSAS
MANASSASPARK
Manassas National Battlefield Park
ParkridgeShopping
Center
Northern VirginiaCommunity College (Nova)
Oaks ofWellington
Wellington Station
Quarry StationSenior Housing
Courthouse
ManassasSenior Ctr. CVS
ManassasShopping
Center
CanterburyVillage S.C.
PrinceWilliamHospital
Manassas Mall
PortsmouthCommuter LotK-Mart
Wal-Mart(Promenade at
Manassas)
Manassas VRE Train Station
START&
END
2
3
1
5
4
The solid, colored line indicates the basic route OmniLink vehicles travel.
The shaded, colored areasindicate how far OmniLink vehicles may travel from the basic route (up to 3/4 mile) to pick up or discharge passengers.
OmniLink Service Area
See the other side of this schedule for more complete information on how to use OmniLink services.
Courthouse is regular stop on southbound trips and on-demand on northbound trips.
Stop at Wal-Martonly served by southboundbuses leavingNOVA going to WellingtonStation.
NORTH
Map notto scale
Bus Stop(Bus also stops at the numbered timepoints)
On-Demand Stop
Transfer Point
Commuter Lot
Point of Interest
VRE Train Station
©2010, Potomac and RappahannockTransportation CommissionDesign by Smartmaps, Inc.
MANASSAS
Source: PRTC
Figure 25. PRTC Manassas OmniLink route.

Best Practices of Successful Flexible Public Transportation Services 55
Policy Objectives for Implementing Flexible Public Transportation Service
• Provide coverage to a large, low-density area• Balance customer access and routing efficiency• Provide one service for all riders on more routes, with more frequent service, and for a longer
service span than would be possible if operating both fixed-route and ADA-complementaryparatransit service
• Respond to community preferences and geography
Marketing Strategies
• Use specially designed brochures• Include information on flexible public transportation services in system maps or “bus books”• Provide information on website• Use paid newspaper advertisements• Use presentations to community groups• Distribute targeted mailings• Cross-promoting services through email
Other Issues
• PRTC has invested heavily in ITS technology for scheduling and dispatching as well as com-municating with bus operators and dispatchers.
• PRTC had the first automated flex-route project in the United States.• Annualized ITS investment cost of $165,000 is more than offset by capital savings alone and
allows PRTC to provide more service.• Real-time information allows for shorter advance notices, dispatcher knowing location of
vehicles, and drivers knowing where they are and whether they are on schedule.• Demand-response riders tend to be more tolerant of late trips than commuter riders.• Current OmniLink policy is to be no more than 5 minutes late due to trip deviations• There is no service on Sundays, which may leave transit-dependent persons without any
means of accessing jobs or making other trips.• The flexible service may be dependable, but it is not convenient for choice or captive riders.
Route Name FY 2007 FY 2008 FY 2009
Dale City 690 667 663Dumfries 629 691 761Manassas 331 369 356Manassas Park 902 329 290Woodbridge/Lake Ridge 1,193 1,307 1,287Route 1 300 317 392
Table 22. PRTC OmniLink average daily ridership.
All Routes FY 2007 FY 2008 FY 2009
Riders per Day 3,433 3,680 3,821Trips per Revenue Hour
15.4 15.8 16.1
Operating Costs $295,004 $315,600 $329,850Revenue Hours 70,528 70,272 52,896Gross Cost per Trip $5.38 $5.42 $5.59Net Cost per Trip $4.67 $4.71 $4.83
Table 23. Selected PRTC OmniLink performance indicators.

4.4 Pierce County Public Transportation Benefit Area Corporation
Flexible Transportation Services: Route Deviation and Request Stops
The Pierce County Public Transportation Benefit Area Corporation (Pierce Transit) formedin 1979 and is a municipal corporation with taxing authority. Pierce Transit is the second largesttransit agency in Washington State.
The following Pierce Transit staff met with the researchers to provide the information andbackground used for this case study:
• Kelly Hayden, Director of Planning• Jean Archer, Senior Planner• Jerri Kelly, Systems Analyst
Overall Service Area Characteristics
The Pierce Transit service area covers 414 square miles with a population of 767,000 per-sons. The transit system serves the cities and towns of Bonney Lake, Buckley, DuPont, Fife,Fort Lewis, Edgewood, Fircrest, Gig Harbor, Graham, Lakewood, McChord Air Force Base,Milton, Orting, Puyallup, Ruston, Spanaway, Steilacoom, Sumner, Tacoma, and UniversityPlace, along with some areas in unincorporated Pierce County. Pierce Transit operates onmore than 900 miles of city streets, county roads, and state highways from Seattle throughTacoma and on to the state capital of Olympia. The most densely populated areas of theCounty have densities of over 6,000 persons per square mile and include Tacoma, Lakewood,and University Place. Large portions of Pierce County have population densities of fewer than1,800 persons per square mile.
Flexible Public Transportation Service Area Characteristics
At the time of this study, Pierce Transit operated flexible public transportation on fourroutes. These routes were located in middle- to low-density areas known locally as Key Peninsula,Parkland/Spanaway, South Hill/Spanaway, and Mid-County. These areas were generally locatedon the outskirts of the service area. Pierce Transit planned to eliminate one of the routes, SouthHill/Spanaway, in February 2010.
Transit System Description for All Modes
According to its website, in 2008, Pierce Transit carried nearly 19 million passengers along 63 bus routes, including 52 local routes and 11 regional routes, operated under contract to theregional bus operator, Sound Transit. The bus fleet includes 272 buses (77 owned by SoundTransit). Eleven transit centers and stations and over 3,300 bus stops, 626 bus shelters, and 28 park-and-ride lots are part of the overall system. Pierce Transit provides connections for residents ofPierce County to other transportation services in the region, including the following:
• Sound Transit (serving Snohomish, King, and Pierce counties)• Intercity Transit (serving Pierce and Thurston counties)• King County Metro (serving the Seattle metropolitan area and cities within King County)• Pierce County ferries (in Steilacoom)• Washington State ferries (at Point Defiance)
In addition to local and regional bus routes, Pierce Transit operates public vanpools serving130 employers with over 13,000 customers in the regional ridematch database. Complementaryparatransit service, known as SHUTTLE, serves 7,968 ADA-eligible, registered users. Pierce alsooperates three express routes—one to downtown Seattle, one to Sea-Tac Airport, and the third
56 A Guide for Planning and Operating Flexible Public Transportation Services

to the University of Washington in Seattle—all under contract to Sound Transit. Pierce Transitoperates 7 days a week, with many routes operating over 18 hours per day. Pierce Transit’s FY2009 operating budget projects $121 million of operating revenue to cover operating expendi-tures of $115 million. In 2008, Pierce Transit calculated its fully allocated costs for local transitservice to be $103.88 per platform hour. Pierce Transit offers a wide range of transit passes andparticipates in a regional fare card system. The basic cash fare for local routes is $1.75. Express serv-ices are zone-based fares, ranging from $1.50 to $3.00. The cash fare for ADA-complementaryparatransit service, the SHUTTLE, is $0.75. Discounted cash fares are available for seniors, youth,persons with disabilities, and Medicare cardholders.
Flexible Public Transportation Service Description for All Types Operated
Route Deviation
Of Pierce Transit’s 52 local routes, 4 operated as deviated fixed routes at the time of thisstudy. Pierce Transit calls this type of service Bus PLUS. These routes are operated using afleet of 25-foot, Ford El Dorado vehicles, which seat 14 to 16 passengers. Buses follow a fixedroute and schedule but deviate into neighborhoods upon request, always returning to theirregular routes. Riders have the option of being picked up at a scheduled stop or scheduling apick-up at other pre-approved locations. The deviation can be up to 3⁄4 mile from its desig-nated fixed route, depending upon demand. All Bus PLUS vans are ADA compliant. PierceTransit does not operate its complementary ADA paratransit service (SHUTTLE) in areasserved by Bus PLUS routes. Pierce Transit reports that approximately 300 passengers or 5 per-cent of Bus PLUS passengers actively use off-route stops. Twenty-two percent of these pas-sengers are ADA clients and the rest are the general public. Ridership data for the four BusPLUS routes are provided in Table 24.
Customers requesting pick-up at an off-route designated bus stop must call at least 2 hours inadvance of the requested trip. Bus PLUS by request service is limited by space availability. Onceon board Bus PLUS, riders can simply inform the driver of the stop where they wish to be droppedoff. Bus PLUS can only serve a stop designated with a Pierce Transit bus stop sign. There are nosurcharges for Bus PLUS on-route or deviated services. Bus PLUS services operate only on week-days, often only during peak periods.
The maps for the Key Peninsula and Mid-County Bus PLUS routes, as operated in 2009, areshown as Figure 26 and Figure 27.
Request Stops (Night Stop)
Request-Stop service is provided on Pierce Transit’s local bus routes; the service does not applyto Bus PLUS routes. After 9:00 p.m., a passenger may request to be let off at any point along alocal bus route, even if it is not a regular bus stop. The passenger must let the operator know atleast a block ahead, and the operator will decide—depending on weather and street and trafficconditions—whether the stop can be made safely.
Best Practices of Successful Flexible Public Transportation Services 57
Route Name Passengers per
RevenueHour
2007 Average WeekdayBoardings
2008 Average WeekdayBoardings
Key Peninsula 3.10 56 51Parkland/Spanaway 4.20 71 72S Hill/Spanaway 2.60 40 52Mid County 2.80 31 46
Table 24. Pierce Transit Bus PLUS ridership.
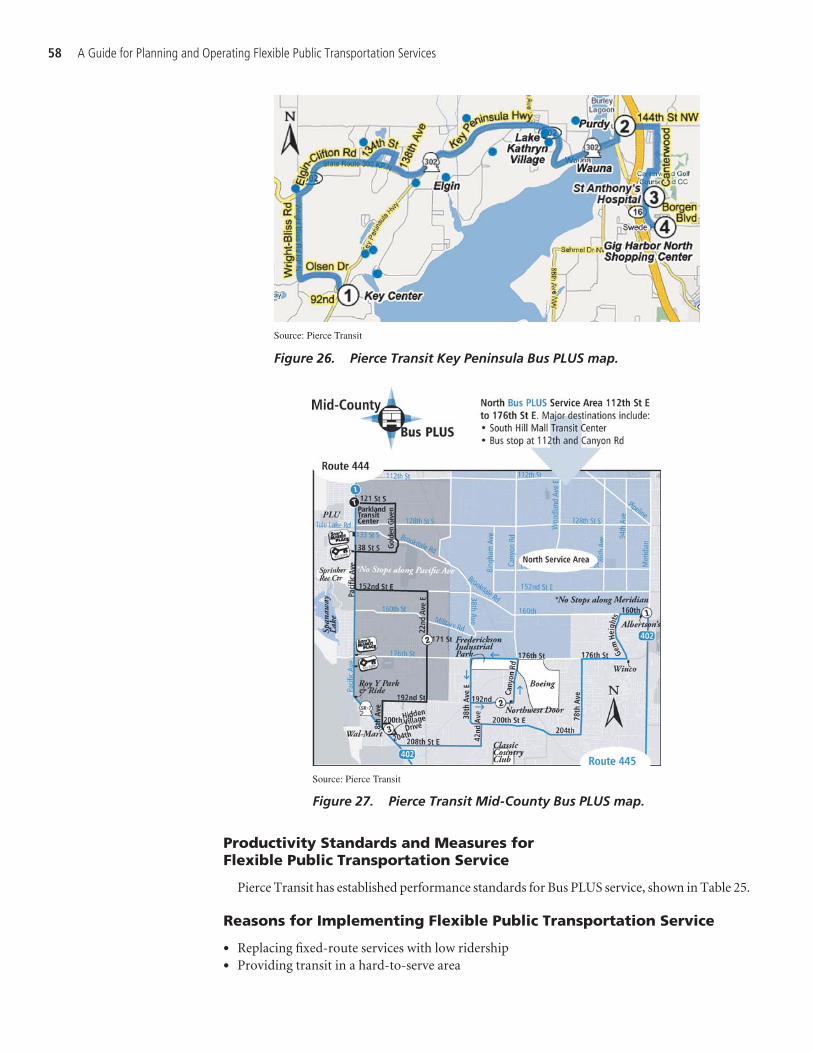
Productivity Standards and Measures for Flexible Public Transportation Service
Pierce Transit has established performance standards for Bus PLUS service, shown in Table 25.
Reasons for Implementing Flexible Public Transportation Service
• Replacing fixed-route services with low ridership• Providing transit in a hard-to-serve area
58 A Guide for Planning and Operating Flexible Public Transportation Services
Source: Pierce Transit
Figure 26. Pierce Transit Key Peninsula Bus PLUS map.
Source: Pierce Transit
Figure 27. Pierce Transit Mid-County Bus PLUS map.

Best Practices of Successful Flexible Public Transportation Services 59
Marketing Strategies
• Include information on flexible public transportation services in “The Bus Stops Here” (busschedule book)
• Include information on flexible public transportation services on website• Use presentations• Do targeted mailing• Provide complete rider information at each stop
Other Issues
• Financial constraints required elimination of deviations from one route (Northeast Tacoma)in 2009 and the planned elimination of a second Bus PLUS route (South Hill/Spanaway) inFebruary 2010.
• The current scheduling system, Route Builder, is a hybrid of fixed route and paratransit. Fordeviations, it schedules the bus at the appropriate point along the fixed route to the deviatedpickup, then immediately returns the bus to the fixed portion of the route.
4.5 Regional Transportation District
Flexible Transportation Services: Point Deviation and Demand-Responsive Connector (on a limited number of routes)
The Regional Transportation District (RTD) was created in 1969 by the Colorado GeneralAssembly to develop, operate, and maintain a mass transportation system for the benefit of2.6 million people in RTD’s district. RTD’s governing body is a publicly elected 15-memberBoard of Directors, with directors elected by their districts to a 4-year term. Each director’s dis-trict contains approximately 173,000 residents.
The following RTD staff met with the researchers during an on-site visit to provide the infor-mation and background used for this case study:
• Jeff Becker, Service Development Manager
RTD’s website, www.rtd-denver.com, contains significant data on all services.
Overall Service Area Characteristics
RTD serves a population of 2.6 million people residing in a 2,377 square mile district includ-ing all or parts of eight counties: the City and County of Denver, the City and County of Broom-
Routes Passengers per VehicleHour
Cost per BoardingPassenger* ($)
New Routes (< 1 year old)SatisfactoryUnsatisfactory
>3.0<3.0
<11.30>11.30
Older Routes (1-2 years old)SatisfactoryUnsatisfactory
>4.0<4.0
<8.50>8.50
Established Routes (> 2 years old)SatisfactoryUnsatisfactory
>5.0<5.0
<6.80>6.80
*All costs in 2003 dollars.
Table 25. Pierce Transit Bus PLUS performance standards.

field, Boulder and Jefferson Counties, the western portions of Adams and Arapahoe Counties,the northeastern portion of Douglas County, and portions of Weld County annexed by Long-mont and Erie. According to the 2007 Census Estimate, the racial makeup of the RTD servicearea was 84.1 percent White, 0.7 percent American Indian or Alaskan Native, 4.8 percent Black,and 3.5 percent Asian. Hispanics or Latinos of any race were 21.6 percent of the population. Thedensity of the service area is 1,093 persons per square mile. The most densely populated areas ofthe service area are found in Denver, where the density is 3,616 persons per square mile, andBoulder, where the density is 3,885 persons per square mile. Denver, known as the mile-high city,is located in the Rocky Mountains, and the City is 5,280 feet above sea level.
Flexible Public Transportation Service Area Characteristics
RTD operates flexible public transportation service, known locally as call-n-Ride, in areasdefined as the following:
• A geographic area where residents and employees do not have convenient access to one ofRTD’s fixed-route services.
• Geographic areas with generally modest population and employment density, poor streetconnectivity, and poor building access.
Table 26 shows the demographics, including population density per acre, of areas served byflexible public transportation.
Figure 28 displays a map of the call-n-Ride service areas and the densities.
60 A Guide for Planning and Operating Flexible Public Transportation Services
Flexible
Route
Gateway
Orchard
N Inverness
Meridian
Interlocken
S Inverness
Superior
Brighton
Broomfield
Evergreen
Arapahoe
Louisville
Aurora
Dry Creek
N Thornton
S Thornton
Lone Tree
Longmont
Arvada
Parker
Highlands Ranch
Population
Density
Per Acre
2.67
3.61
0.28
1.94
2.76
0.75
2.69
2.57
5.45
1.17
6.09
3.58
9.58
6.13
7.85
8.86
4.79
4.50
6.42
3.17
5.52
Employment
Density
0.57
13.72
5.31
11.29
1.35
9.20
2.92
1.04
1.98
0.46
3.08
2.25
6.08
6.64
2.31
2.54
3.83
2.07
3.38
1.68
1.11
Zero
Vehicle
Household
Density
0.00
0.00
0.00
0.00
0.00
0.00
0.00
0.08
0.05
0.00
0.00
0.00
0.21
0.00
0.08
0.03
0.00
0.08
0.16
0.00
0.00
Median
Income
$54,800
$98,000
$80,000
$46,000
$64,400
$23,000
$79,700
$50,700
$67,600
$84,200
$103,500
$76,600
$50,000
$82,000
$62,800
$47,800
$88,400
$56,000
$45,000
$80,000
$96,600
Senior
Density
0.04
0.35
0.05
0.01
0.19
0.01
0.03
0.66
0.54
0.09
0.33
0.26
1.09
0.54
0.45
0.65
0.15
0.70
1.17
0.12
0.23
Youth
Density
0.33
1.43
0.50
0.00
2.14
0.00
0.60
1.42
1.68
0.20
1.55
1.07
1.86
1.80
1.93
2.03
1.22
1.67
1.75
0.60
1.43
Source: Transportation Management & Design, Inc., 2008.
Table 26. Denver RTD flexible transportation service area demographics.
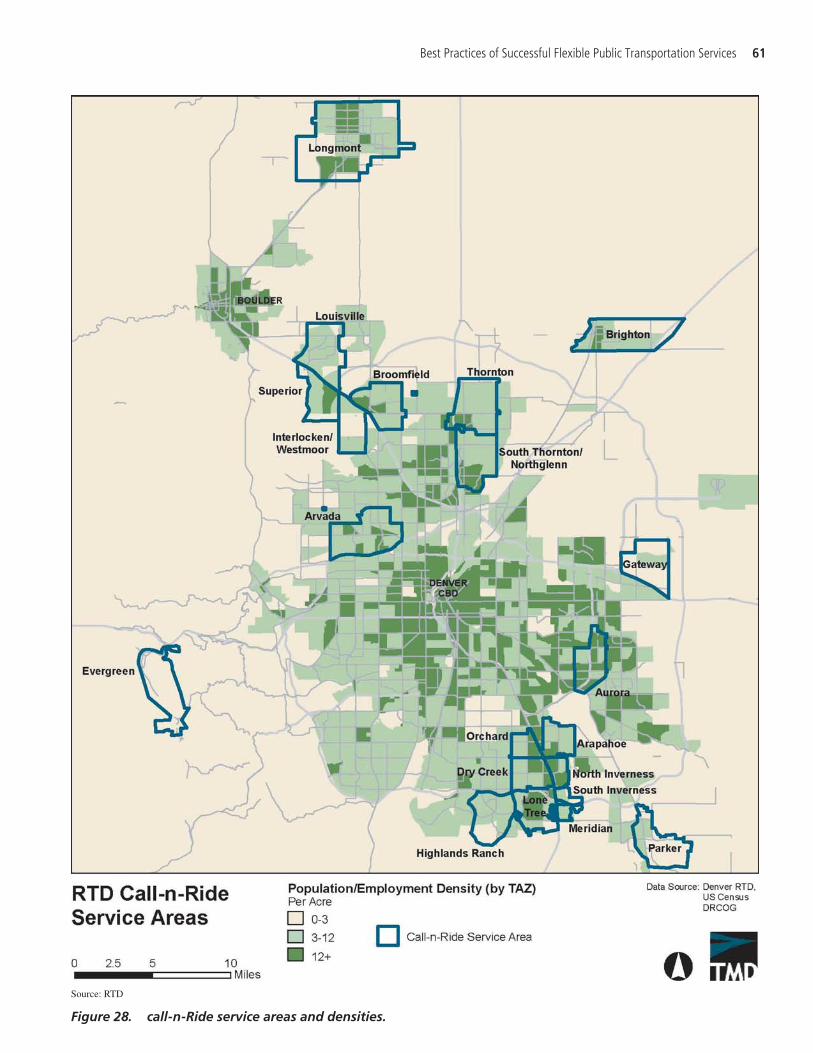
Best Practices of Successful Flexible Public Transportation Services 61
Source: RTD
Figure 28. call-n-Ride service areas and densities.

Transit System Description for All Modes
RTD is a multimodal, regional transit system, consisting of three primary categories: fixed-route bus, special services, and light rail. All fixed-route bus and rail services travel 163,987 mileseach weekday. RTD serves 10,199 bus stops and 74 park-and-ride facilities.
RTD operates a total of 154 fixed bus routes, including 72 local routes, 13 limited-serviceroutes, 24 express routes, 18 regional routes, and 5 routes serving the Denver International Air-port. These routes also include 15 local routes in the City of Boulder and 7 routes in the City ofLongmont. Other fixed-route bus services include a free shuttle along the 16th Street Transit Mallin downtown Denver, known as the FREE MallRide. RTD has an active bus fleet of 1,039 buseswith a peak requirement of 862 buses.
RTD operates six light rail lines. The light rail lines cover 35 miles of track and serve 37 stations,as shown in Figure 29. Approximately 55,717 passenger trips are made on the light rail lines eachweekday, with a fleet of 117 vehicles.
RTD also operates a number of special services, including its complementary ADA paratran-sit service, known as access-a-Ride, call-n-Ride, special shuttles to sporting events, a service calledseniorRide, and vanpools. The call-n-Ride services will be described in more detail in the sectionon flexible transportation. RTD uses 301 cutaway vehicles for its access-a-Ride services andboards 2,220 passengers per weekday.
62 A Guide for Planning and Operating Flexible Public Transportation Services62 A Guide for Planning and Operating Flexible Public Transportation Services
Source: RTD
Figure 29. RTD Denver light rail transit.

RTD’s annual operating budget in 2008 was $372.9 million. RTD employs 2,500 persons directlyand an additional 1,600 private contractor employees.
Flexible Public Transportation Service Description for All Types Operated
In 2000, RTD introduced call-n-Ride service as a supplement to its fixed-route bus service.The service was designed for areas with low passenger density where traditional fixed-route servicewas inefficient. Today, call-n-Ride features small, wheelchair-accessible, body-on-chassis busesthat provide curb-to-curb service in 20 geographic areas. In October 2008, all 20 call-n-Ride serviceareas combined averaged about 2,150 weekday boardings and close to 500 weekend boardings.Hours of service vary but are generally Monday through Friday, 5:30 a.m. to 8:00 p.m. Three call-n-Rides offer Saturday service between 9:00 a.m. and 6:00 p.m.
Table 27 presents the call-n-Ride service performance data and service information for 2008.The call-n-Ride routes are listed in descending order based upon boardings per service hour.
Passengers wishing to use the call-n-Ride service must first locate the service in their area. Eachservice area has a designated call-n-Ride phone number that goes directly to the driver’s cellphone during normal operating hours. At a safe time, the driver pulls over to the side of the roadand accepts the call and schedules the pick-up time. For same-day service, passengers arerequested to call at least 2 hours in advance. Trips can also be scheduled up to 2 weeks in advance.Recurring trips may be scheduled in advance with the call-n-Ride driver. In practice, drivers canpick-up passengers with less than 1 hour notice if time permits.
Best Practices of Successful Flexible Public Transportation Services 63
Performance Data Service InformationNumber of
ConnectionsRoute
BoardingsPer
ServiceHour
BoardingsPer Acre
In-ServiceHours
AreaCoverage
(acres)
PeakHeadway
Milesof
ExistingRTD
Route*
TimedTransfer
Non-Timed
Transfer
Number ofConnections(weighted)
Gateway 19.1 0.113 29.0 4,914 30 2.9 7 – 7Orchard 9.7 0.024 20.5 1,715 – 1.1 2 – 2
NInverness
9.5 0.034 26.5 1,414 10 1.2 2 –
2
Meridian 8.7 0.278 21.0 713 15 0.7 2 – 2Interlocken 7.7 0.036 16.5 3,593 30 3.1 7 – 7S Inverness 7.4 0.125 20.5 742 10 0.7 2 – 2
Superior 5.7 0.041 14.5 3,699 30 4.7 8 – 8Brighton 4.5 0.009 14.5 7,340 – 1.4 – 4 1.3
Broomfield 4.5 0.014 14.5 4,752 30 4.4 11 – 11Evergreen 4.4 0.020 29.0 6,268 – 1.1 – 3 1Arapahoe 4.4 0.023 14.5 2,766 – 0.7 3 – 11Louisville 4.1 0.046 16.5 5,469 30 3.9 8 – 8
Aurora 4.0 0.015 14.5 3,962 60 5.5 11
(partial) –3
Dry Creek 3.8 0.017 14.5 3,1576,044
30 1.2 3 – 3N Thornton 3.8 0.014 14.5 – 1.8 – 6 2S Thornton 3.5 0.010 14.5 5,567 – 3.7 7 2.3Lone Tree 3.3 0.016 14.5 4,235 60 2.4 5 – 5Longmont 3.0 0.010 32.5 17,599 – 2.5 – 6 2
Arvada 2.9 0.006 14.5 6,716 – 3.9 – – 0Parker 2.9 0.010 14.5 5,126 – 1.4 – 3 1
HighlandsRanch
2.7 0.008 14.5 4,861 – 1.5 –
9 3
*Miles of route per square mile of service area– = Not applicable to this route.
Table 27. 2008 RTD call-n-Ride service characteristics.
At the time of the case study site visit, RTD was phasing in a computerized system that allowedpassengers the opportunity to book call-n-Ride trips online. This new technology will bedescribed later in this case study.
call-n-Ride services cost the same as cash fares for local bus services, with free transfersallowed. Riders can also present RTD passes and tickets when boarding.
In 2008, RTD conducted a survey, RTD Call-N-Ride Customer Satisfaction & Travel Character-istics (The Howell Research Group, 2009), of all of its services, including call-n-Ride. Some of thekey findings of the survey relating to call-n-Ride are presented below.
With regard to evaluation of service, some of the survey’s key findings were the following:
• call-n-Ride service was rated exceptionally high. More than 7 out of 10 riders (71 percent)rated overall service as excellent, while 23 percent rated it good. A very small percentage of riders(4 percent) rated the service as fair, and only 1% rated it poor.
• In addition to overall service, there were 24 specific dimensions of service in 8 performancecategories that were evaluated by call-n-Ride passengers. Seven of the eight performance cat-egories received an average rating of better than good. The composite ratings for five perfor-mance areas approached a rating of excellent: bus driver performance, security, comfort,reservations, and customer information. Convenience received a composite rating slightlybelow good due to relatively lower ratings regarding availability of weekend service and avail-ability of evening service.
• When asked which performance category was most in need of improvement, 31 percent of thecall-n-Ride passengers said none. The most frequently selected area for improvement waspricing/fares (21 percent), followed by convenience (13 percent), and travel time (10 percent).
• The majority of specific service dimensions (15 of 24) received average ratings thatapproached excellent. Only two service dimensions received an average rating below good:availability of weekend service and availability of evening service. Only a few call-n-Rides offerservice on Saturday and/or Sunday, and there is no call-n-Ride service after 8:00 p.m. onany day.
With regard to trip characteristics, some of the survey’s key findings were the following:
• Nearly three out of four riders (74 percent) rode call-n-Ride for commuting to/from work.The largest percentage of work commuters were traveling to/from the Southeast businessparks (30 percent of all riders).
• The remaining passengers rode call-n-Ride for a variety of non-work purposes: shopping/eating out (8 percent), school/college (7 percent), personal business (5 percent), social/recreation(3 percent), and medical appointments (3 percent).
• In 2008, two-thirds of the call-n-Ride riders (67 percent) paid their fare with some form ofprepayment, and 28 percent paid by cash. Monthly pass/ValuPass (36 percent), Eco Pass (13 per-cent), and 10-Ride Ticketbook (11 percent) were the most frequently used types of prepayment.
• A large portion of call-n-Ride passengers (19 percent) used a special fare discount: primarilya senior discount (8 percent) followed by disabled (7 percent) and student—19 and under(4 percent).
• The vast majority of riders caught their call-n-Ride bus either at home (44 percent) or at anRTD park-and-ride, rail station, or bus stop (42 percent).
• On average, call-n-Ride passengers traveled 11.9 miles one way (including all modes of travel) and took 32.5 minutes to reach their final destination when using call-n-Rideservice.
• The majority of call-n-Ride passengers (62 percent) made one or more transfers to/from a reg-ular RTD bus for their trip, while nearly one-half (49 percent) used light rail for a portion oftheir trip.
64 A Guide for Planning and Operating Flexible Public Transportation Services

• In 2008, call-n-Ride riders had taken, on average, 6.1 one-way trips on RTD call-n-Ride duringthe past week.
• It appears that call-n-Ride has been successful in introducing RTD to new riders (those whohave ridden RTD for 1 year or less). Nearly one-third of the call-n-Ride passengers (32 percent)were new riders.
With regard to rider characteristics, some of the survey’s key findings were the following:
• RTD call-n-Ride passengers represent all demographic and socio-economic segments of theDenver Metro Area, and their characteristics are comparable to regular RTD bus riders. As awhole, call-n-Ride passengers are more likely to be female, single, 45 years or older, have somecollege education or higher, be employed in a professional/managerial occupation, be a non-minority, have an annual household income under $50,000, and be transit dependent.
• While 12 percent of all call-n-Ride riders were Hispanic, only 3 percent of all riders spokeSpanish and had difficulty with English.
• The majority of all call-n-Ride riders (56 percent) are classified as “captive” or transit depend-ent. Captive riders are defined as those who do not have a car available at the time they rideRTD or have a physical/mental disability that prevents them from driving a car. “Choice” riders (those who have a car available and are able to drive it) account for 44 percent of all call-n-Ride passengers.
• call-n-Ride riders were heavy users of other RTD services. Nearly two out of three (65 per-cent) had ridden a regular RTD bus during the past week (an average of 5.2 one-way trips),while 74 percent had ridden a regular bus at least once in the past 12 months. The majorityof all call-n-Ride riders (52 percent) had ridden RTD light rail during the past week (anaverage of 4.2 one-way trips), while 71 percent had ridden light rail at least once in the past12 months.
• The majority of call-n-Ride passengers (62 percent) had used one or more of RTD’s specialservices within the past 12 months—primarily the 16th Street Mall Shuttle (51 percent) andskyRide (20 percent).
• Consistent with the high percentage of transit-dependent riders, 51 percent of all call-n-Ridepassengers said “no car available/do not drive” was their most important reason for riding call-n-Ride. The second most frequently cited reason was “cheaper than driving” (21 percent).
Productivity Standards and Measures for Flexible Public Transportation Service
According to RTD’s 2008 service performance report, RTD routes that fit into the followingparameters need to be evaluated for marketing, revision, or elimination: the least productive 10 per-cent of routes by the measure of subsidy per boardings or the measure of boardings per hour and/orroutes for which both of these measures have fallen below 25 percent of the average for all routes.The performance charts illustrate the acceptable performance domain containing all routes meetingthe 10-percent minimums for each class of service. The calculation of the 10-percent and 25-percentstandards are made from the annual, unweighted data (assuming the data have a normal distribu-tion) and by using the appropriate formulas for standard deviation and confidence intervals; how-ever, the standard deviation is applied to the weighted average. Table 28 gives the current yearweighted averages and standards by class of service.
Policy Objectives for Implementing Flexible Public Transportation Service
As previously mentioned, RTD introduced call-n-Ride service in 2000, as a supplement to itsfixed-route bus service. The service was and is designed for service in areas with low passenger
Best Practices of Successful Flexible Public Transportation Services 65

density, where traditional fixed-route service was less cost-effective. While a few routes wereintroduced to replace poorly performing fixed routes, most of the routes were designed to reachmembers of RTD’s service area without service. According to its 2008 passenger survey, call-n-Ride is frequently a person’s first encounter with RTD’s family of services. It therefore serves anadditional objective, to bring riders to transit for the first time.
Marketing Strategies
RTD does extensive market research and outreach with community groups prior to imple-menting call-n-Ride or any other services. RTD generally relies on its website, printed brochures,direct mail, local promotions, and other standard marketing strategies to inform the public ofits flexible public transportation services.
Other Issues
In early 2008, in order to meet budget constraints and to ensure that services are evaluated inaccordance with the service standards, RTD made a decision to eliminate the Arvada call-n-Rideservice, effective May 4, 2008. This route was implemented in 2005 when the City of Arvadaapplied for and received a Congestion Mitigation Air Quality (CMAQ) grant. The grant covered80% of all operating costs. The City of Arvada and RTD each contributed 10 percent to cover thecall-n-Ride costs. The minimum service standard is three passenger boardings per hour. TheArvada call-n-Ride had averaged 2.5 passengers per hour since its implementation. The CMAQgrant expired in May 2008, and the service was discontinued. The Gateway call-n-Ride becameso successful that ridership warranted higher-capacity fixed-route service. It was replaced byextending two bus routes into the service area in May 2009.
At the time of the site visit for this case study, RTD was in the process of implementing a newtechnology system for trip booking and vehicle scheduling. The system, marketed as Mobility DR,is intended to manage demand-responsive transit operations for different service types. Accordingto its literature, Mobility DR encompasses the following:
• Automated reservations and vehicle scheduling• Mobile driver manifest management with automated data collection• Real-time operations supervision• Extensive data analysis and reporting
66 A Guide for Planning and Operating Flexible Public Transportation Services
Subsidy Per Boarding ($) Boardings Per HourService Class Average 10%
Max25%Max
Average 10% Min
25%Min
CBD Local 2.68 5.70 4.26 38.5 18.6 28.1Urban Local 3.51 9.14 6.46 30.5 17.6 23.8Suburban Local 6.92 13.49 10.36 17.6 9.0 13.1Express 4.53 10.10 7.45 46.7 19.6 32.5Regional 5.28 18.08 11.98 27.1 16.0 21.3skyRide 3.91 5.68 4.83 23.3 17.7 20.3call-n-Ride 11.14 18.19 14.83 4.9 2.7 3.8Mall 0.66 – – 261.7 – – Light Rail 3.77 – – 129.7 – – access-a-Ride 45.76 – – 1.4 – – Vanpool 1.84 – – 3.5 – – System 2008 3.52 – – 33.7 – – System 2007 3.70 – – 31.8 – –
– = services not subject to the threshold.
Table 28. 2008 RTD service standards.
• Web booking and real-time customer notifications• A true mobile Internet solution, with fully integrated Web and server-based applications
The system uses Internet-connected mobile (tablet-sized) computers to continuously informdrivers of changes in the trip manifest. The application includes map-based navigation, collectsoperational data for reporting, and handles direct-to-driver telephone trip requests. During thesite visit, the tablet computers were observed on board vehicles, with drivers making the expectedadjustments from the previous routine of making scheduling decisions independently. Additionalinformation on this technology is available from RTD.
4.6 Jacksonville Transportation Authority
Flexible Transportation Services: Route Deviation and Demand-Responsive Connector
The Jacksonville Expressway Authority was founded in 1955 and funded by toll revenues tobuild bridges and expressways in Duval County, Florida. In 1971, a merger of the originalExpressway Authority and several private bus companies created what is now known as the Jack-sonville Transportation Authority (JTA). JTA provides public transportation services for resi-dents and visitors throughout the Jacksonville area. Approved in 1988, a half-cent sales tax ref-erendum was passed to eliminate the original toll funding. An additional voter-approvedhalf-cent sales tax was passed in September 2000 to fund The Better Jacksonville Plan, a $2.2 bil-lion infrastructure and quality-of-life improvement initiative.
Overall Service Area Characteristics
JTA is an independent state agency created by the state of Florida. JTA designs and constructsbridges and highways and provides public transportation services in Duval County, Florida,which includes the City of Jacksonville. The Jacksonville metropolitan area is located in thenortheast corner of Florida, with three beach cities to the east bordering the Atlantic Ocean. NassauCounty is located to the north, Baker County is located to the west, Clay County is southwest,and St. Johns County is southeast and borders the Atlantic Ocean.
According to the 2000 Census, the area has a population of 795,566 and has three major Inter-state highways: I-295 around Jacksonville, I-95 north and south, and I-10 west. There are eightmajor bridges in the metropolitan area that span the St. Johns River, a waterway that flowsthrough downtown Jacksonville and splits downtown into the Northbank and the Southbank.There are numerous other bridges that span the rivers that are located in the area.
The City of Jacksonville consolidated with Duval County to encompass a land area of 841 square miles, making it the largest city in the continental United States in terms of land mass.Jacksonville ranks as the 14th largest city in the United States in population, with more than850,000 residents. Jacksonville’s topography is flat, with a considerable amount of water, includ-ing the St. Johns and Trout Rivers, the Intercoastal Waterway, the Atlantic Ocean, and othercreeks and marshlands. Jacksonville also has numerous railroad tracks that have impacts on liv-ing patterns and travel. CSX Transportation has its headquarters in downtown Jacksonville. Sev-eral military installations, including Mayport Naval Base on the northeast side and NAS (NavalAir Station) on the southwest side, are located in and around Jacksonville.
The population density of the City of Jacksonville is approximately 1,000 people per square mile.The racial makeup of the City, as shown in Table 29, was 65.8 percent White, 27.8 percent AfricanAmerican, 0.3 percent American Indian, 2.7 percent Asian, 0.1 percent Pacific Islander, and2.7 percent from other races. Hispanic or Latinos of any race were 4.1 percent of the population.
Best Practices of Successful Flexible Public Transportation Services 67

Flexible Public Transportation Service Area Characteristics
The demand-responsive connector service areas are large in land mass and are in the suburbanareas to the north and south of downtown. The population densities in these areas are low, andthere is a considerable amount of water and a number of Interstate highways and railroad tracksthat affect travel. To the north of downtown, the Oceanway and Highlands-Airport Ride Requestarea, as shown in Figure 30, is bounded by water to the south (e.g., St. Johns and Broward Rivers,Dunn Creek), contains an island (Blount Island) and the Jacksonville International Airport, istraversed by Interstates I-95 and I-295 and numerous railroad tracks, and is far less dense thanaverage for the Jacksonville area.
To the south of downtown, the Avenues South Ride Request area has water to the south (Jul-ington Creek), also is traversed by Interstates I-95 and I-295 and numerous railroad tracks, and isfar less dense than average for the Jacksonville area. The adjacent connector service, San Jose RideRequest is bounded by water to the west and south (St. Johns River and Julington Creek), is tra-versed by Interstate I-295 and numerous railroad tracks, and is far less dense than average for theJacksonville area.
The route deviation service, the Arlington Community Shuttle, is bounded by water to the northand west (St. Johns River), an airport to the east (Craig Muni), and a major highway to the south(Route 90). The service area is less dense than average for the Jacksonville area. The second routedeviation service, the Baldwin Commuter Shuttle, parallels I-10 and railroad tracks to the west ofdowntown Jacksonville along Route 90 and services two low-density communities.
Transit System Description for All Modes
With its 762 employees, JTA operates several public transit services, including express and reg-ular bus service, the downtown 2.5-mile Skyway, trolley services, a Stadium Shuttle for varioussporting and entertainment events at the Jacksonville Municipal Stadium and Coliseum, JTA
68 A Guide for Planning and Operating Flexible Public Transportation Services
Racial/ Ethnic Group
DuvalCountyNumber
DuvalCountyPercent
White512,469 65.8
Black216,780 27.8
American Indian and Alaska Native
2,598 0.3
Asian21,137 2.7
Hawaiian/PacificIslander
466 0.1
Other Race 10,170 1.3
Hispanic Origin*31,946 4.1
Total Population 795,566
Source: 2000 U.S. Census.*Per the 2000 Census, people of Hispanic origin can be, and inmost cases are, counted in two or more race categories.
Table 29. Racial/ethnic breakdown of theCity of Jacksonville, Duval County, Florida.

Connexion for persons with disabilities and senior citizens, and Ride Request, which providesflexible public transportation service in several areas throughout the region.
JTA operates a network of 47 fixed bus routes and four trolley routes that provide serviceweekdays from 3:34 a.m. to 1:45 a.m. Saturday and Sunday service is operated from 4:27 a.m. to1:00 a.m. JTA’s Connexion operates during the same days and hours as the fixed-route service.Additionally, JTA’s Skyway service is provided from 6:00 a.m. to 9:00 p.m. on weekdays. Serviceon the Skyway is only provided on Saturdays and Sundays in connection with special events.
JTA operates a fleet of 162 buses for fixed-route service. The current peak requirement is for135 vehicles. JTA has a fleet of 12 trolley buses for its trolley services and 9 vehicles for RideRequest service. JTA also has a fleet of 102 vans that are operated by its contractors for the Con-nexion. JTA has a fleet of 10 vehicles for the Skyway service.
JTA operates the fixed-route service from the facility located at 100 Myrtle Avenue in the Cityof Jacksonville. Its fixed-route bus service is oriented to downtown Jacksonville and to six transferstations. The Skyway system has eight stations. The Skyway operations and maintenance facilitiesare located at 725 Leila Street and 312 Bay Street in Jacksonville.
The basic adult fare for fixed-route bus service is $1.00. Reduced fares are offered to senior cit-izens, persons with disabilities, and Medicare Card holders. Senior citizens ages 60 and older ridefree with a Senior Identification Card or Medicare Card. Persons with disabilities pay $0.25 with
Best Practices of Successful Flexible Public Transportation Services 69
Source: JTA
Figure 30. Oceanway and Highlands-Airport Ride Request area.

a Reduced Fare Card or Medicare Card. The fare on the Skyway system is $0.50 with a reducedfare of $0.10 for senior citizens and persons with disabilities. The fare for ADA paratransit ser-vice is zone-based but does not exceed twice the regular fixed-route fare.
Table 30 shows the following financial and operating statistics for its fixed-route and paratransitservice, as reported in JTA’s National Transit Database Report for FY 2008:
JTA reported an annual ridership of 473,927 and annual vehicle revenue hours of 259,491 forits demand-responsive service.
Table 31 shows key performance measures for all JTA services for FY 2007, 2008, and 2009.
Flexible Public Transportation Service Description for All Types Operated
Demand-Responsive Connector
Ride Request is JTA’s demand-responsive connector service available upon reservation orrequest within a defined area and timeframe. Each Ride Request area has a telephone numberfor passengers to call to let the service know where to pick up and drop off and the time of travel.Customers requesting a trip are advised to call at least 2 hours in advance and are limited to nomore than three grocery-sized bags. The rider must be near the curb at least 5 minutes prior tothe arranged time. JTA also takes subscriptions for recurring trips.
JTA operates all three of its demand-responsive connector services on weekdays and theOceanway and Highlands Ride Request on weekdays and Saturdays. JTA offers a wide range oftransit passes and tickets. The base cash fare for Ride Request is $2.00 each way per person. Thefare is $1.00 for persons over 60 years of age and persons with disabilities. Children, ages 5 yearsand under, or less than 42 inches tall, ride free with an accompanying adult. All of the route devi-ation connector vehicles are ADA compliant.
70 A Guide for Planning and Operating Flexible Public Transportation Services
Finance and OperationCategories
Fixed-RouteService
Fixed Guideway Paratransit Service
UnlinkedPassengers
10,290,987 502,364 347,088
Revenue Hours 630,403 17,430 204,747 Operating Expenses $65,639,903 $6,249,168 $18,620,626
Table 30. 2008 National Transit Data Report for JTA.
All Routes FY 2007 FY 2008 FY 2009(Estimates)
Passengers10,174,120 10,290,987 8,502,824
Total Expenses $60,981,288 $65,639,903 $65,639,903
Revenue Hours 633,474 657,530 549,790
Passenger Per Revenue Hour 16.1 15.7 15.5 Expense Per Hour
$96.26 $99.83 $119.39 Total Expense per Passenger $6.00 $6.38 $7.72
Table 31. Selected performance measures for JTA.

Route Deviation
JTA operates two route deviation routes, known as Shuttle routes. One of the routes, the BaldwinCommuter Shuttle, shown in Figure 31, operates as a deviated fixed route, with service between twoareas, Macclenny and Baldwin, and downtown Jacksonville.
The Arlington Community Shuttle operates primarily as a loop route in the Arlington com-munity, with route deviations in a specific area around the route.
The Shuttles follow a fixed route within zones but may deviate off route upon request, alwaysreturning to their regular routes. Riders have the option of being picked up at a regular bus stopor scheduling a pick-up at other pre-approved locations and by advanced reservations. Off-routedrop-offs are made by reservation, and locations are negotiated between the dispatcher and cus-tomer, as necessary. All of the route-deviation vehicles are ADA compliant. JTA reports that lessthan 1 percent of its total passenger trips involve the flexible or route-deviation feature.
Customers requesting pick-up at an off-route designated bus stop are advised to call at least 2 hours in advance of the requested trip. JTA also takes subscriptions for recurring trips. Onceon board a bus, riders can simply inform the driver of the location of the stop where they wish tobe dropped off. The driver will honor an off-route stop if schedules allow and, in the case of theBaldwin Commuter Shuttle, will deviate one-half mile off Beaver Street.
The base cash fare for the Baldwin Commuter Shuttle is $2.00 each way per person. The fareis $1.00 for persons over 60 years of age and persons with disabilities. There are $12 weekly passesand $40 monthly passes. There is not a surcharge for the Baldwin Commuter Shuttle off-routedeviations. The base cash fare for the Arlington Community Shuttle is $1.00 each way per per-son. The fare is $0.25 for persons with a Connexion ID and free for persons 60 years of age andolder. All route deviations are $0.50 per deviation.
Productivity Standards and Measures for Flexible Public Transportation Service
JTA provided draft service design standards for its Request Ride service, shown in Table 32.In areas of high density and low automobile ownership, JTA would operate fixed-route servicewithin 1⁄4 mile of most residences. However, as densities decrease, JTA would operate more flex-ible service or no service.
Best Practices of Successful Flexible Public Transportation Services 71
Source: JTA
Figure 31. Baldwin Commuter Shuttle.

Ridership for flexible public transportation service routes are increasing annually, as shownin Table 33:
Policy Objectives for Implementing Flexible Public Transportation Service
• Provide coverage to a large, low-density area• Reduce or eliminate the expense of providing an ADA-complementary paratransit service• Serve low demand times• Balance customer access and routing efficiency• Lay the groundwork for future fixed-route service• Respond to community preferences and geography
Marketing Strategies
• Ride Request information is included in system maps or “bus books” and on JTA’s website• Specially designed brochures are used• Presentations are made to community groups• Specially designed print ads for Ride Request are posted
72 A Guide for Planning and Operating Flexible Public Transportation Services
Flexible RouteName
FY 2007 Average
DailyRidership
FY 2008 Average
DailyRidership
FY 2009 Average Daily Ridership (to July 2009)
Highlands Airport 96.4 108.6 120.3 Oceanway 16.4 62.5 45.3 Northside Weekend (Started Oct. 2007) 31.6 27.6 28.5San Jose 23.3 24.5 26.5 Avenues South 39.4 52.4 60.2 Baldwin Commuter Shuttle 3.3 16.6 24.5Arlington Community Shuttle (start Aug. 2008)
N/A 101 96.0
Total Daily Ridership by Year
210.4 393.2 401.3
Table 33. JTA ridership for flexible transportation routes.
Population Density (Persons Per Square Mile)Average Number of
Automobiles per Household 4,000 and
above2,500–3,999
1,000– 2,499
Under 1,000
Under 1.0 Fixed-route(1/4 Mile)
Fixed-route(1/4 Mile)
Connectors/Loopers
RideRequest
1.0–1.5 Fixed-route(1/4 Mile)
Fixed-route(1/4 Mile)
Connectors/Loopers
No service
1.6–2.0 Fixed-route(1/4 Mile)
Fixed-route(1/2 Mile)
RideRequest
No service
Over 2.0 Fixed-route(1/2 Mile)
Fixed-route(1/2 Mile)
RideRequest
No service
Table 32. Draft JTA service design standards.
Other Issues
JTA did not report any other issues associated with its flexible public transportation services.
4.7 Charleston Area Regional Transportation Authority
Flexible Transportation Services: Zone Routes
The South Carolina Electric and Gas Company operated the bus system in Charleston, SouthCarolina, until 1997 when the City of Charleston, City of North Charleston, Town of MountPleasant, and Charleston County joined together to create the Charleston Area Regional Trans-portation Authority or CARTA. CARTA provides public transportation services for residents andvisitors throughout the Charleston area. In November 2004, a half-cent sales tax referendum waspassed, providing CARTA with the revenue source to relaunch many of the services that had beeneliminated or consolidated due to a lack of funding. CARTA added new routes and services suchas CARTA Express and CARTA at Night, a premium zone route flexible transportation service.
Operation and maintenance of CARTA’s fleet of vehicles, including the staffing and manag-ing of drivers as well as bus scheduling, is contracted out to two for-profit companies.
Overall Service Area Characteristics
The CARTA service area covers 73 square miles with a 2007 service area population of630,100 persons. The CARTA system serves the downtown business district of the City of Charlestonas well as neighborhoods and employment centers in North Charleston, Mount Pleasant, andCharleston County. According to the 2000 Census update, there were 207,957 households and apopulation density of 996.5 people per square mile. The racial makeup of the CARTA service areawas 65.1 percent White, 30.8 percent African American, 1.30 percent Asian, and 2.8 percent fromother races. Hispanic or Latinos of any race were 2.40 percent of the population.
Flexible Public Transportation Service Area Characteristics
CARTA operates four flexible zone routes that serve distinct areas in the Charleston Area. ZoneRoute 1, shown in Figure 32, is operated in North Charleston, which is a primarily suburban areabounded by the Ashley River on the west and the Cooper River on the east.
CARTA at Night, Zone Route 2, shown in Figure 33, operates in an area known locally as thePeninsula. This area serves the original Charleston peninsula that includes the downtown areaand extends to the Zone 1 boundaries.
CARTA at Night, Zone Route 3, shown in Figure 34, operates in an area known locally as WestAshley. This area serves the city area west of the Peninsula and across the Ashley River fromdowntown.
CARTA at Night, Zone Route 4, shown in Figure 35, operates in an area known locally as Mt. Pleasant. This area serves the area east of the Peninsula across the Cooper River and includesMt. Pleasant, Sullivan’s Island, Fort Moultrie, and Isle of Palms.
Transit System Description for All Modes
CARTA operates local, express, and neighborhood routes from North Charleston to his-toric downtown Charleston and Mt. Pleasant to West Ashley. CARTA operates 24 fixed routes, two Express routes, and four flexible transportation routes known as CARTA at Night. CARTA
Best Practices of Successful Flexible Public Transportation Services 73

74 A Guide for Planning and Operating Flexible Public Transportation Services
Source: CARTA
Figure 32. CARTA at Night Zone Route 1—North.
Source: CARTA
Figure 33. CARTA at Night Route 2—Peninsula.
Source: CARTA
Figure 34. CARTA at Night Zone Route 3—West Ashley.
Source: CARTA
Figure 35. CARTA at Night Zone Route 4—Mt. Pleasant.

operates an ADA paratransit service known as Tel-A-Ride for passengers unable to get to a reg-ular bus stop. Tel-A-Ride operates a curbside service in a defined service area for those who meetthe requirements under the Americans with Disabilities Act. The agency also operates CARTAat Night, a flexible transportation service in four zones only during nighttime hours on week-days and Saturday.
The regular fare is $1.50 for the fixed-route buses and the downtown area shuttles. The Expressfare is $2.50. The CARTA at Night fare is $2.00 cash, or a CARTA Express Pass may be used. Allother passes can be used with a $0.75 surcharge. Low income discount fares are available forthose who qualify through an eligibility determination. Senior citizens aged 55 and above pay$0.75 for fixed-route and downtown shuttle services during off-peak hours on weekdays and allday Saturdays, Sundays, and holidays. Disabled patrons may ride fixed-route buses for $0.40 allday, every day of the week. Tel-A-Ride fares are $3.00 per trip.
For all modes for 2008, CARTA’s ridership was 3,023,403, with annual vehicle revenue hoursof 250,000. CARTA operated 57 peak-hour vehicles of varied sizes. CARTA’s operating budgetwas $12,263,988, and it had a total of 212 full- and part-time employees.
Flexible Public Transportation Service Description for All Types Operated
Zone Routes
CARTA uses a fleet of six buses on its four flexible zone routes that operate after most regularbus service has ended. These routes serve urban and established suburban neighborhoods pri-marily in hard-to-serve areas in Mount Pleasant, the Peninsula, downtown, West Ashley, andNorth Charleston. Passengers may be transported to any point within the same zone or transferto a vehicle serving another zone. All buses meet downtown at the Meeting and Saint Mary Streetbus stop. The CARTA at Night service starts at 9:30 p.m. and ends at 1:00 a.m. Round trips take60 to 90 minutes depending on the route. The buses meet and depart at set prescribed times atthe downtown bus stop. CARTA at Night service is operated weekdays and Saturdays. CARTAAt Night riders pay a single cash fare of $2.00 or use the CARTA Express Pass; all other passesmay be used with a $0.75 surcharge.
For 2008, CARTA at Night reported 32,239 in total ridership, 12,792 annual vehicle revenuehours, and an operating budget of $767,520.
Passengers may ride within a zone or transfer to another vehicle serving a different zone. Pas-sengers may call and make a reservation for service or board at any established stop along the route.Passengers may also board any of the flexible route (zone) vehicles at the downtown transfer pointwithout a reservation and just tell the driver where they wish to be taken. CARTA at Night does notserve off-route requests; pick-ups and drop-offs are only at established bus stops. Reservations canbe made in advance to a reservation agent, and the agent can communicate with the driver via radiofor pick-ups on short notice. CARTA uses small body-on-chassis vehicles for its late night zoneflexible service. All of the buses are ADA compliant. CARTA operates a separate complementaryADA paratransit service. CARTA reports that it averages three riders per vehicle revenue hour onits flexible zone route service. Ridership has steadily increased, as shown in Table 34.
CARTA at Night operates on weekdays and Saturdays, with no service on Sundays.
Productivity Standards and Measures for Flexible Public Transportation Service
CARTA did not report specific productivity standards for its flexible public transportationservice.
Best Practices of Successful Flexible Public Transportation Services 75

76 A Guide for Planning and Operating Flexible Public Transportation Services
Route Name
North CharlestonDowntownWest AshleyMount PleasantTotals
FY 2007 Ridership
6,8866,8865,0083,130
21,910
FY 2008 Ridership
10,9556,5736,5738,138
32,239
FY 2009 Projected Ridership
11,89410,9556,2607,512
36,621
Table 34. CARTA at Night ridership.
Policy Objectives for Implementing Flexible Public Transportation Service
• Provide coverage to a large, low-density area• Serve low demand times• Lay the groundwork for future fixed-route service• Respond to community preferences and geography
Marketing Strategies
• Include information on CARTA at Night in system maps or “bus books” and on its website• Use specially designed brochures• Use presentations to community groups
Other Issues
• Funding has been an issue but seems to be solved with the half-cent referendum for publictransit.
• Comprehensive performance standards have been lacking.• There are low ridership numbers on flexible routes.• Reduced fares and farebox recovery ratios may hurt prospects for expanding fixed and flexi-
ble routes.
4.8 Mountain Rides Transportation Authority
Flexible Transportation Services: Request Stops (Service Discontinued)
Mountain Rides Transportation Authority (Mountain Rides) is the merged entity that wasformerly known as Kart/Peak Bus and Wood River Rideshare, located in Blaine County, Idaho.Mountain Rides provides public transportation services for residents and visitors throughoutBlaine County and its adjacent communities. Mountain Rides provides a commuter bus route,a town bus route, ADA paratransit service, and a vanpool service.
Mountain Rides previously provided a flexible transportation service but discontinued thisservice in October 2008. Even though Mountain Rides no longer provides a flexible transporta-tion service, this case study has been included for illustrating services provided in a rural, low-density community.
Overall Service Area Characteristics
The Mountain Rides service area covers 30 square miles with a 2008 population of 15,000 per-sons. The Mountain Rides system serves portions of Blaine County and the surrounding areas

Best Practices of Successful Flexible Public Transportation Services 77
of Ketchum, Bellevue, Hailey, Shoshone, Twin Falls, and Sun Valley. According to the 2000 Cen-sus, Blaine County had a population of 18,991 (2007 estimate: 21,560). The county seat andlargest city is Hailey. There were 7,780 households and 4,839 families residing in the county.The population density of the service area was 500 people per square mile. The racial makeupof the county was 90.73 percent White, 0.13 percent Black or African American, 0.33 percentNative American, 0.73 percent Asian, 0.07 percent Pacific Islander, 6.43 percent from other races,and 1.57 percent from two or more races. Nearly 11 percent of the population was Hispanic orLatino of any race.
Flexible Public Transportation Service Area Characteristics
The area served by the request stop service was a sparsely populated mountainous area withwinding roads.
Transit System Description for All Modes
MountainRidescurrentlyoperates two fixed routes, a vanpool service, and ADA-complementaryparatransit service. The Valley Route is a commuter bus route that provides service betweenBellevue and Sun Valley, with connecting stops through Ketchum and Hailey. The Valley Routeoperates weekdays, weekends, and holidays from 6:00 a.m. to 10:00 p.m. The Town Route oper-ates fare-free service serving Warm Springs, Ketchum, Dollar, Elkhorn, Sun Valley, and RiverRun. The Town Route operates year round from 7:00 p.m. to 9:30 p.m. Mountain Rides alsooperates a vanpool service in Blaine County for employees commuting into the Wood River Valley,including Ketchum, Twin Falls, Hailey, Shoshone, Jerome, and Sun Valley. Monthly fares rangefrom $60 to $190.
Mountain Rides also operates a door-to-door ADA paratransit service for residents in Ketchumand Sun Valley city limits. This service is provided free of charge to those who qualify under theAmericans with Disability Act of 1991.
The agency’s fiscal 2009 budget is about $2.3 million, provided by Blaine County and localmunicipalities, federal grants, rider fares, and Sun Valley.
For all services in FY 2008, Mountain Rides reported an annual ridership of 320,000, annualvehicle revenue hours of 24,000, and an operating budget of $2,023,500. Mountain Rides operated11 peak-hour vehicles with 29 full- and part-time employees.
Flexible Public Transportation Service Description for All Types Operated—Request Stops
In 2008, Mountain Rides operated two summer bus routes, River Run and Warm Springs. TheWarm Springs bus service operated at half-hour service frequencies from 7:30 a.m. to 12:00 p.m.,7 days a week. On the end of the Elkhorn Village portion of the route, passengers could requestservice to and from the Morning Star loop/Harker Center area. For pick-ups, passengers wouldcall a telephone number in advance and the bus would be dispatched to the loop. To return tothe loop, riders would request that the bus driver take them to the requested stop. There was noadditional fare for the request stop service.
Productivity Standards and Measures for Flexible Public Transportation Service
Selected performance indicators for Mountain Rides are presented in Table 35.

78 A Guide for Planning and Operating Flexible Public Transportation Services
Policy Objectives for Implementing Flexible Public Transportation Service
There was only one policy objective, to serve low demand times.
Marketing Strategies
• Included information about flexible transportation in system maps or “bus books”• Used presentations to community groups• Used targeted mailings
Other Issues
The primary reason Mountain Rides discontinued its flexible transportation service in Octo-ber 2008 was that they did not have the dispatch services to support the calls for pick-up.Requested drop-offs were fine once a passenger was on board, but having customers call torequest a pick-up was cumbersome and ineffective for their organization, which has a limitedadministrative staff. Handling pick-up requests was especially hard after hours, when no one wasin the office. Passengers were calling the driver’s cell phone, which was unsafe, and the calls didnot always get answered.
4.9 South Central Adult Services Council, Inc.
Flexible Transportation Services: Route Deviation, Zone Routes, and Demand-Responsive Connector
South Central Adult Services located in North Dakota, is a not-for-profit corporation that hasbeen in operation since May 1983. Its purpose is to create public awareness of elderly persons andtheir needs; to create an atmosphere in which elderly persons, with help, solve their own problemsand meet their own needs; and to coordinate existing services and agencies.
Overall Service Area Characteristics
South Central Adult Services provides its transportation services to residents in the countiesof Barnes, LaMoure, Foster, Logan, McIntosh, and Griggs. The population of the South CentralAdult Services service area is approximately 28,687 and covers over 5,950 square miles for anoverall density of less than five persons per square mile. Table 36 lists selected demographic char-acteristics of each county.
Flexible Public Transportation Area Characteristics
The flexible public transportation area characteristics are the same as the overall service areacharacteristics since the flexible services are operated throughout the entire service area.
All Routes FY 2006 FY 2007 FY 2008 FY 2009
Passengers 321,157 305,086 355,431 276,672
TotalExpenses
$1,300,000 $1,650,000 $1,920,000 $1,750,000
Table 35. Mountain Rides performance indicators.

Best Practices of Successful Flexible Public Transportation Services 79
Transit System Description for All Modes
Transportation services are available throughout the counties served by South Central AdultServices. Transportation is available to take the general public to and from meal sites and forother purposes including medical appointments, shopping, recreation, schools, and personalneeds. Figure 36 shows a sample of how information on the South Central Transit Network isprovided to the public.
South Central Adult Services provides several types of flexible public transportation servicesincluding demand-responsive connector, zone routes, route deviation for persons with disabil-ities, and route deviation for the general public in the counties served.
South Central Adult Services provides rides on a first-call-first-served basis. Riders mustschedule trips in advance since some vehicles will not operate service if there are no reservationsor passengers. Riders are asked to call for reservations as far in advance as possible. Fares vary bytrip type (medical, within cities, within zones, etc.) and county. The flexible service features areprovided mostly in rural, hard-to-serve areas, with senior citizens and persons with disabilitiesas the primary users. Route deviation is allowed without any distance restrictions within the ser-vice area of a particular route. South Central Adult Services averages between one and four pas-sengers per revenue hour for its flexible service, depending upon the route, day of week, and loca-tion of service (county). Passengers desiring flexible transportation service must have a priorreservation or a called in request. Unscheduled transportation needs may be accommodatedupon request by contacting a county outreach worker.
In Barnes County, South Central Adult Services operates a demand-responsive service in ValleyCity weekdays from 8:00 a.m. to 5:00 p.m. and weekends from 9:00 a.m. to 2:00 p.m. for a fareof $1.50 each way. There is also service from Valley City to Jamestown, Oriska, Sanborn, Rogers,Leal, Nome, Hastings, Fargo, and other locations on alternating days of the week and month.Fares range from $3.00 to $15.00 per round trip. In addition, taxi services are provided throughSouth Central Adult Services in Valley City every day, 24 hours a day.
InFosterCounty,demand-responsive service is provided within Carrington on weekdays only for$1.00 per trip. Demand-responsive connector service is provided to Fargo on the first Wednesdayand third Tuesday of the month for $15.00 per round trip and to Bismarck on the third Wednesdayof the month for $15.00 per round trip. Demand-responsive zone service is provided within FosterCounty for $5.00 per round trip, to Jamestown on various weekdays for $8.00 per round trip, andto New Rockford every Monday upon request for $5.00 per round trip.
In Griggs County, demand-responsive service is provided within Cooperstown weekdays onlyfor $1.00 per trip. Demand-responsive connector service is provided to Fargo every Thursday for$8.00 per round trip; to Valley City every second Tuesday for $6.00 per round trip; to Jamestownon the first and third Tuesday of the month for $3.00 per round trip; to Grand Forks, Mayville,
County Population2008
EstimatesHouseholds
Land AreaSquare Miles
Population Density
Per SquareMile
Barnes 10,282 4,884 1,4921.6 7.9 Foster 3,447 1,540 635.2 5.9 Griggs 2,358 1,178 708.5 3.9 LaMoure 3,986 1,942 1,147.2 4.1 Logan 2,308 963 992.6 2.3 McIntosh 2,639 1,467 975.2 3.5
Table 36. Selected South Central Adult Services area demographics.

80 A Guide for Planning and Operating Flexible Public Transportation Services
and Hillsboro every fourth Tuesday for $8.00 per round trip. In addition, upon request, service isprovided between Cooperstown and Binford, Sutton, and Hannaford for $3.00 per round trip.
In LaMoure County, demand-responsive zone service is provided in LaMoure City weekdaysonly for $1.00. Demand-responsive connector service is provided to Fargo (second and fourthThursdays) and to Bismarck (third Thursday) for $15.00 per round trip. Demand-responsiveservice is also provided to Valley City, Oakes, and Jamestown on alternate weekdays for $8.00 perround trip. Service is also provided to Aberdeen upon request for $10.00 per round trip.
South Central Transit Network
Transportation services are available throughout the counties served by South Central Adult Services. All vehicles display the name South Central Transit Network. Transportation is available to take the general public to and from meal sites and for other purposes which include: medical appointments, shopping, recreation, schools and personal needs. Wheelchair accessible vehicles are available. Please make the dispatcher aware of this need when scheduling your ride. Normally, transportation services will not be available on legal holidays.
Rides are provided on a first-call-first-served basis. You must schedule in advance since some trips do not go if there are nopassengers. Call for reservations at the following numbers as far in advance as possible. Charges for each trip are posted in each vehicle.
Barnes County
DESTINATION SCHEDULE RESERVATIONS
Jamestown Tuesdays, Thursdays & Saturdays 845-4300
Fargo Thursdays 845-4300
Local route to Rogers, Wimbledon, Sanborn, Leal, & Dazey
2nd & 4th Fridays. Reservations required845-4300
1-800-472-0031
Local route to Kathryn, Nome, Fingal & Oriska
1st & 3rd Fridays. Reservations required.845-4300
1-800-472-0031
Valley City(Local Service)
Monday through Friday - 8:00 am to 4:00 pm and Saturday & Sunday - 9:00 am to 1:45 pm
845-4300
All Barnes county routes originate from Valley City.
For special transportation needs, contact the Valley City Center at 845-4300.
LaMoure County
DESTINATION SCHEDULE RESERVATIONS
Jamestown Tuesdays & Wednesdays. Reservations required. 742-2885 or 710-0745
Fargo 2nd & 4th Thursdays. Reservations required 742-2885 or 710-0745
Bismarck 3rd Thursdays. Reservations required. 742-2885 or 710-0745
Aberdeen, Ashley,Oakes, Wishek & Valley City, etc.
1st Thursday or each Monday or Friday of the month upon request. Reservations required.
742-2885 or 710-0745
Meal Sites: LaMoure, Kulm, & Edgeley
Monday through Friday on serving days. 742-2885 or 710-0745
For special transportation needs, contact the outreach worker at 883-5088.
Source: South Central Adult Services Council, Inc.
Figure 36. South Central Adult Services sample schedules.

Best Practices of Successful Flexible Public Transportation Services 81
In Logan County, demand-responsive service is provided within Napoleon every Tuesday,Wednesday, and Thursday for $1.00 per round trip. Demand-responsive connector service isprovided to Bismarck every Wednesday and Friday for $8.00 per round trip and to Jamestownevery Monday and the second and fourth Thursday for $10.00 per round trip. Service is providedto Wishek and Linton every Tuesday and Thursday upon request for $5.00 per round trip andto Aberdeen as needed for $10.00 per round trip.
In McIntosh County, service is provided within Ashley every Monday, Wednesday, and Fri-day for $1.00 per round trip and within Wishek every Tuesday, Wednesday, and Thursday for$1.00 per ride. Demand-responsive connector service is provided from Wishek to Bismarckevery Monday for $15.00 per round trip and from Wishek to Jamestown every Monday and thirdThursday for $10.00 per round trip. Service is provided from Ashley to Bismarck every Thurs-day for $15.00 per round trip and between Ashley and Zeeland upon request for $3.00 per roundtrip. A shuttle service is provided to Zulm for connections to Jamestown and Fargo every Tues-day and the second and fourth Thursdays for $5.00 per round trip. Upon request, service is pro-vided to Aberdeen as needed for $10.00 per round trip.
Flexible Public Transportation Service Description for All Types Operated
South Central Adult Services estimates that approximately one-third of its total ridershipstems from the flexible service. South Central Adult Services reported annual ridership for flex-ible services at approximately 16,900 and annual vehicle hours of 10,400. For the flexible servicesprovided, South Central Adult Services operated 11 vehicles (vans and small chassis buses) with anannual budget of $166,900 and 16 full- and part-time employees.
Productivity Standards and Measures forFlexible Public Transportation Service
In FY 2008, South Central Adult Services reported an annual ridership of 62,738, annual vehi-cle revenue hours of 30,680, and an operating budget of $650,853. South Central Adult Servicesoperated 22 vehicles with 33 full- and part-time employees. Table 37 shows selected operationalstatistics for transportation services provided by South Central Adult Services in FY 2008.
In FY 2008, average passengers per hour were 1.1, which is comparable to many purelydemand-response services in urban areas.
Reasons for Implementing Flexible Public Transportation Service
• Provide coverage to a large, low-density area• Respond to community preferences and geography
County Name Ridership Vehicle Miles AverageCost Per Ride ($)
Barnes 38,981 182,074 7.02Foster 4,041 23,369 19.29Griggs 4,014 41,719 14.01LaMoure 3,420 45,837 16.48Logan 3,647 58,264 24.51McIntosh 8,635 72,894 7.67
Table 37. Selected FY 2008 South Central Adult Services operational statistics.

82 A Guide for Planning and Operating Flexible Public Transportation Services
Marketing Strategies
• Information on flexible services included on website• Information on flexible services presented to community groups
Other Issues
South Central Adult Services did not report any other issues.
4.10 Omnitrans
Flexible Transportation Services: Zone Routes, Demand-Responsive Connector
Omnitrans was created in 1976 by a Joint Powers Agreement (JPA) among the County of SanBernardino and the cities of Chino, Colton, Fontana, Loma Linda, Montclair, Ontario, Redlands,Rialto, San Bernardino, and Upland. Since that time, five additional cities (Chino Hills, High-land, Grand Terrace, Rancho Cucamonga, and Yucaipa) have joined and make up the currentJPA. Omnitrans was created primarily to provide a standardized system of fares, a universal sys-tem of transfers, and expanded transit services and facilities for the benefit of the residents of itsmember cities.
Overall Service Area Characteristics
San Bernardino County can be divided into three distinct regions. The High Desert representsapproximately 90 percent of the county area. The Mountain region encompasses the SanBernardino National Forest and portions of the San Gabriel National Forest to the south of thedesert regions. The San Bernardino Valley encompasses the valley south of the Mountain region,bordered by the Los Angeles County line to the west and the Riverside County line to the south.Orange County also borders San Bernardino County at the southwestern end of the county atChino Hills State Park.
The Omnitrans service area covers over 456 square miles and serves the urbanized area of theSan Bernardino Valley region of the county with a population close to 1.3 million. The servicearea includes the cities of Colton, Fontana, Grand Terrace, Highland, Loma Linda, Redlands,Rialto, San Bernardino, and Yucaipa in the East Valley (east of I-15) and Chino, Chino Hills,Montclair, Ontario, Rancho Cucamonga, and Upland in the West Valley (west of I-15). Theoverall population density of the service area is 3,070 persons per square mile.
According to the 2000 Census, the racial makeup of the San Bernardino Valley was 55.4 per-cent White, 9.7 percent African American, and 5.5 percent Asian. Hispanic or Latinos of any racewere 44.6 percent of the population. The City of San Bernardino has a high percentage of per-sons that live below the poverty level (27.6 percent) and have limited access to private vehicles.On the other hand, Chino Hills has the lowest rate of poverty (5.1 percent) and a higher rate ofmultiple private vehicle ownership per household when compared to other areas. Yet the pro-portion of public transportation use is not as low in Chino Hills (2.0 percent) as it is in otherareas in the Valley. Both Yucaipa (0.7 percent) and Grand Terrace (0.8 percent) residents tendto use public transit less and tend to drive alone to work. This is the result of numerous trans-portation options (e.g., commuter rail, express bus service, etc.) into job-rich destinations to thewest and limited transit options and job opportunities to the east.
The demographics of the Omnitrans’ member cities are presented in Table 38.

Best Practices of Successful Flexible Public Transportation Services 83
Flexible Public Transportation Service Area Characteristics
Omnitrans currently operates flexible public transportation service on two routes in the com-munities of Chino Hills and Yucaipa. As shown in Table 38, Chino Hills encompasses 44.88 squaremiles with a population of 71,849 persons. The population density is 1,600 persons per square mile.The median age in Chino Hills is 32. Eighty-five percent of residents live in owner-occupied homes,and residents have an average median income of $93,133 per year. Yucaipa is a comparable com-munity of 27.5 square miles with a population of 49,388 and densities of 1,796 persons per squaremile. The median age of Yucaipa residents is 36. Seventy-six percent of residents live in owner-occupied homes, and residents have an average median income of $45,044 per year. Over 90 per-cent of residents in both communities have access to at least one vehicle.
Transit System Description for All Modes
According to its Short Range Transit Plan: FY 2008–2013 (IBI Group et al. 2007), Omnitranscarried nearly 15 million passengers and operated nearly 800,000 revenue hours. It used a fleetof 273 vehicles and employed 719 persons with a total operating budget of $72,279,817. The basiccash fare was $1.35.
Omnitrans’ fixed-route transit system provides scheduled, general public service alongplanned, predetermined routes in accordance with established frequencies. Those frequenciesare generally based on passenger volumes: enough people have to ride each bus so that produc-tivity and farebox recovery standards are met.
Based on the 2006 Omnitrans On-Board User Intercept Survey (Omnitrans, 2006), the typicalOmnitrans fixed-route rider is between the ages of 20 and 49 (66 percent), has an income lessthan $20,000 (52 percent), and is equally likely to be male or female. The typical user is classifiedas transit-dependent, meaning they do not have access to an automobile to complete the neededtrip. Only 15 percent of those surveyed reported that an automobile was available for their trip.Only 36 percent of users are in possession of a driver’s license; of the remainder, 73 percent haveat least one licensed driver in their household.
City SquareMiles
2006Population
Density(personsper sq. mile)
MedianIncome
($)
%>65
Years
% With No
Vehicles
Chino 18.59 73,343 3,945 68,705 5.4 4.8 Chino Hills 44.88 71,849 1,600 93,133 6.3 1.4
Colton 15.90 51,045 3,210 42,362 10.8 10.8 Fontana 35.78 160,015 4,472 58,481 3.0 3.0 Grand
Terrace3.60 12,227 3,396 64,552 10.7 3.5
Highland 13.62 50,236 3,688 48,050 6.5 9.9 Loma Linda 7.80 21,592 2,767 43,856 15.4 11.2 Montclair 5.20 34,679 6,669 47,026 8.3 8.6 Ontario 36.76 170,373 4,635 46,344 7.5 5.0 Rancho
Cucamonga37.70 141,586 3,755 71,967 7.1 4.9
Redlands 35.98 70,324 1,954 52,111 9.9 4.9 Rialto 21.80 97,524 4,473 50,446 4.5 5.8 San
Bernardino59.85 198,322 3,313 33,915 6.9 10.5
Upland 15.01 73,697 4,909 57,194 11.1 4.7 Yucaipa 27.50 49,388 1,796 45,044 15.5 8.4
Table 38. Selected demographics of Omnitrans’ member cities.

84 A Guide for Planning and Operating Flexible Public Transportation Services
Omnitrans operates 29 fixed bus routes, including 17 routes in the East Valley (east of I-15),11 routes in the West Valley (west of I-15), and one regional express route to the City of River-side. TransCenters are a key component of Omnitrans service. Omnitrans’ service is designed ona hub-and-spoke principle where the TransCenter functions as the hub and routes radiate out tomajor destinations. Transfers typically occur at these hubs but also occur at timed transfer pointsthroughout the region. There are two types of TransCenters: on-street facilities and off-streetfacilities. TransCenters are located near major destinations, downtowns, and civic centers. Withthe opening of the Chino TransCenter in FY 2005, Omnitrans has a total of 13 TransCenters,including TransCenters located in Pomona, Montclair, Ontario, and South Fontana, and theFourth Street Transit Mall located in downtown San Bernardino. The remaining TransCentersinclude Montclair Plaza, Redlands Mall, Inland Center Mall, Ontario Mills Mall, Chino Trans-Center, Fontana Metrolink Station, Ontario Airport, and the Arrowhead Regional Medical Cen-ter. Each TransCenter varies in size and amenities.
Omnitrans operates complementary paratransit services known as Access, in accordance withADA requirements.
Flexible Public Transportation Service Description for All Types Operated
Zone Routes and Demand-Response Connector
OmniLink is a general public dial-a-ride service designed for low-density service areas. OmniLinkwas introduced as a new Omnitrans program in Yucaipa in 1993 to provide coverage in low-densityand low-demand areas that are difficult to serve with fixed-route transit. Service in Chino Hills wasstarted in January 2002. Both OmniLink services are described below.
Chino Hills OmniLink. This is a dial-a-ride service for Chino Hills west of SR-71 to thecounty line. Chino Hills OmniLink is pulsed (formally scheduled) to meet OmniLink Route 65at the Chino Hills Marketplace. Chino Hills OmniLink provides demand-response service withinthe corporate boundaries of Chino Hills (see Figure 37). A shuttle service is operated on weekdaysbetween Chino Hills and the City of Chino to provide access to the Chino Senior Center. Theweekday service is scheduled to depart outbound from Chino Hills at 10:00 a.m. and inboundfrom the Chino Senior Center at 1:00 p.m. and only operates if requested in advance.
Yucaipa OmniLink. Yucaipa OmniLink serves Yucaipa and Calimesa (areas served origi-nally by the Yucaipa/Calimesa Dial-A-Ride, which started in 1993). Yucaipa OmniLink providesdemand-response service within the corporate boundaries of Yucaipa and for trips betweenYucaipa and neighboring Calimesa (see Figure 38). Service is provided for Calimesa trips that eitheroriginate or end in Yucaipa. Service is not provided for trips that begin and end within Calimesa.
In both Chino Hills and Yucaipa, service is provided Monday to Friday, 7:00 a.m. to 6:00 p.m.Service is not provided on New Year’s Day, Memorial Day, Independence Day, Labor Day,Thanksgiving, and Christmas.
Trip bookings can be made 30 minutes before and after service start and end times. Advancereservations can be made up to 3 days in advance. “Repeater” subscription bookings can be madefor one calendar month for trips that occur at least 3 days a week (same time between the sameorigin and destination). Same day bookings are accommodated on a space-available basis.
All advance and repeater bookings are confirmed at the time of the booking and entered intoTrapeze PASS as an unassigned trip (not assigned to a run). There is no route optimization usingTrapeze PASS. OmniLink route optimization can be implemented in conjunction with Access

Best Practices of Successful Flexible Public Transportation Services 85
operating procedures. Additional Trapeze PASS training may be required for those First Tran-sit staff responsible for OmniLink scheduling and dispatch.
A single scheduler/dispatcher handles both OmniLink services. The scheduler/dispatcher isresponsible for booking, scheduling, and dispatching each trip. With Yucaipa OmniLink, all tripsare assigned to a run on the day of service. With Chino Hills OmniLink, most assignments aremade the day before service is required. For Chino Hills, driver manifests are posted at 5:00 p.m.the night before. Same day bookings in Chino Hills are assigned by the dispatcher on the day ofservice.
Trip assignments are made via Mobile Data Terminals (MDTs) and cell phone voice dispatch.Trip assignments are often made 1 or 2 hours out from the pick-up time. A 40-minute pick-up window is used for trip assignment. Using Trapeze PASS software and a split screen, the schedulers/dispatchers drag individual trips from the unassigned list to a particular route. Tripassignments appear on the MDT screen. Drivers update the electronic dispatch lists via theMDTs and maintain a paper trip sheet as backup. Although vehicles are equipped with Auto-matic Vehicle Locator (AVL) technology, this technology is not fully used in the trip assignmentprocess. Both service areas are rather compact, and the dispatchers assign trips based on theirknowledge of the service area.
OmniLink is a general public, dial-a-ride service. No preregistration is required. Trip book-ing information is recorded when a passenger books the first trip.
Source: Omnitrans
Figure 37. OmniLink Chino Hills service area.

86 A Guide for Planning and Operating Flexible Public Transportation Services
In addition to providing policy-based service coverage in low-density areas, OmniLink ser-vice is designed to provide feeder service to/from Omnitrans fixed-route bus service. Currently,only Chino Hills is pulsed to make connections with fixed-route service. Both OmniLink ser-vices are operated under contract, currently with First Transit. Under the terms of the serviceagreement, Omnitrans is responsible for service vehicles and the provision of facilities, schedul-ing hardware and software, service and policy planning, administrative oversight, customer rela-tions, and budget planning. First Transit is responsible for hiring, training, and supervising allscheduling/dispatch and operations and maintenance staff; processing all trip requests; andmaintaining and operating all service vehicles in accordance with Omnitrans specifications.
The cash fare for OmniLink routes is $3.00, with 10-ticket booklets available at a 10-percentdiscount. Farebox recovery ratios in FY 2009 were 7.66 percent for the Chino Hills OmniLinkand 8.91 percent for the Yucaipa OmniLink. A total of eight vehicles are used on the Yucaipa andChino Hills OmniLink routes during peak periods.
According to the 2007 Short-Range Transit Plan, OmniLink dispatchers identified school,shopping, and medical trips as the key trip purposes for both OmniLink services. The dispatch-ers identified students and senior citizens as key market segments. The data suggest a high useby seniors (over 59 percent for Chino Hills and 52 percent for Yucaipa). A review of an OmniLinktrip report produced by Trapeze PASS in November 2006 strongly suggested the underrepresen-tation of general public passengers and a possible overrepresentation of senior citizen ridership.From the review of November 2006 data, 59 percent of Chino Hills OmniLink trips and 21 percentof Yucaipa OmniLink trips were made by students.
Source: Omnitrans
Figure 38. OmniLink Yucaipa service area.

Best Practices of Successful Flexible Public Transportation Services 87
Productivity Standards and Measures for Flexible Public Transportation Service
Omnitrans has established the following performance standards for OmniLink routes, shownin Table 39.
A schedule of liquidated damages and incentives has been established for each OmniLink ser-vice based on productivity and on-time performance.
Policy Objectives for Implementing Flexible Public Transportation Service
OmniLink was introduced as a new Omnitrans program in 1993 to provide coverage in low-density and low-demand areas that are difficult to serve with fixed-route transit.
Marketing Strategies
• Include information on OmniLink in system map or “bus book”• Use specially designed brochures• Use presentations to community groups
Other Issues
Omnitrans’ 2007 SRTP identified a decrease in farebox recovery ratios for both OmniLinkroutes, even as ridership increased. Omnitrans did not decrease service, but hopes to make pro-ductivity enhancements through scheduling improvements.
Passengers Per Revenue Hour Route Goal Minimum FY 2009
ActualChino Hills 3.00 2.30 2.91 Yucaipa 4.20 3.5 3.12
Table 39. Omnitrans’ OmniLink performance standards.

Arrillaga, B. and G. E. Mouchahoir (1974). Demand-Responsive Transportation System Planning Guidelines,UMTA-VA-06-0012-74-6. Washington, DC: Urban Mass Transportation Administration.
Bureau of Public Transportation (1988). Handbook for Purchasing a Small Transit Vehicle. Pennsylvania Depart-ment of Transportation, Urban Mass Transportation Administration, U.S. DOT.
Burkhardt, J. E., B. Hamby, A. T. McGavock, ATE Management & Service Company, Inc., and Urbitran Asso-ciates, Inc. (1995). TCRP Report 6: Users Manual for Assessing Service-Delivery Systems for Rural PassengerTransportation. Washington, DC: Transportation Research Board, National Research Council.
Burkhardt, J. E., C. A. Nelson, G. Murray, and D. Koffman (2004). TCRP Report 101: Toolkit for Rural Commu-nity Coordinated Transportation Services. Washington, DC: Transportation Research Board of the NationalAcademies.
Cervero, R. and C. Beutler (1999). Adaptive Transit: Enhancing Suburban Transit Services, Report 424. Berkeley,CA: University of California Transportation Center.
Cole, L. M. (1968). Tomorrow’s Transportation: New Systems for the Urban Future. Washington, DC: U.S. Depart-ment of Housing and Urban Development.
Flusberg, M. (1976). “An Innovative Public Transportation System for a Small City: The Merrill, Wisconsin, CaseStudy.” In Transportation Research Record 606, Transportation Research Board, National Research Council,54–59.
IBI Group, Arellano Associates, and Connetics Transportation Group (2007). Short Range Transit Plan: FY2008–2013. San Bernardino County, CA: Omnitrans.
KFH Group, Inc., Urbitran Associates, Inc., McCollom Management Consulting, Inc., and Cambridge Systematics(2008). TCRP Report 124: Guidebook for Measuring, Assessing, and Improving Performance of Demand-ResponseTransportation. Washington, DC: Transportation Research Board of the National Academies.
Koffman, D. (2004). TCRP Synthesis 53: Operational Experiences with Flexible Transit Services. Washington, DC:Transportation Research Board of the National Academies.
Mason County Transit Development Plan, 2009–2014 and 2008 Annual Report (2009). Shelton, WA: MasonCounty Public Transportation Benefit Authority.
Mergel, J. (1976). Small City Transit: Merrill, Wisconsin, Point Deviation Service in a Rural Community. Cambridge,MA: Transportation Systems Center.
Mistretta, M., J. A. Goodwill, R. Gregg, and C. DeAnnutis (2009). Best Practices in Transit Service Planning.Washington, DC: U.S. Department of Transportation, Office of Research and Special Programs (Center forUrban Transportation Research, Tampa, FL), available at http://www.ntis.gov or http://www.cutr.usf.edu/.
Neff, J. and M. Dickens (2009). 2009 Public Transportation Fact Book: 60th Edition. Washington, DC: AmericanPublic Transportation Association, available at http://www.apta.com.
Omnitrans (2006). Omnitrans On-Board User Intercept Survey. San Bernardino County, CA, available athttp://www.omnitrans.org.
Pierce Transit Finance, Audit & Administration Department (2009). Pierce Transit Budget, Lakewood, Washington2009. Pierce Transit, available at http://www.piercetransit.org/budget/2009_FINAL_BUDGET.pdf.
St. Joseph Transit Rider’s Guide (2007), available at: http://www.ci.st-joseph.mo.us/transit/Riders%20Guide.pdfThe Howell Research Group (2009). RTD Call-N-Ride Customer Satisfaction & Travel Characteristics. Denver,
CO: Denver Regional Transit District (RTD).Transportation Management & Design, Inc. (2008). RTD Call-N-Ride Performance Review. Denver, CO: Denver
Regional Transit District (RTD).Urbitran Associates, Inc., Multisystems, Inc., SG Associates, Inc., and Robert Cervero (1999). TCRP Report 55:
Guidelines for Enhancing Suburban Mobility Using Public Transportation. Washington, DC: TransportationResearch Board, National Research Council.
88
References

Appendixes to the contractor’s final report for TCRP Project B-35 are not published hereinbut are available on the TRB website (www.trb.org) by searching for “TCRP Report 140”. Theappendix titles are the following:
• Appendix A: Flexible Public Transportation Survey Respondents• Appendix B: Summary of Flexible Public Transportation Survey Responses• Appendix C: Flexible Public Transportation Services Website Information
89
Unpublished Material

Abbreviations and acronyms used without definitions in TRB publications:
AAAE American Association of Airport ExecutivesAASHO American Association of State Highway OfficialsAASHTO American Association of State Highway and Transportation OfficialsACI–NA Airports Council International–North AmericaACRP Airport Cooperative Research ProgramADA Americans with Disabilities ActAPTA American Public Transportation AssociationASCE American Society of Civil EngineersASME American Society of Mechanical EngineersASTM American Society for Testing and MaterialsATA Air Transport AssociationATA American Trucking AssociationsCTAA Community Transportation Association of AmericaCTBSSP Commercial Truck and Bus Safety Synthesis ProgramDHS Department of Homeland SecurityDOE Department of EnergyEPA Environmental Protection AgencyFAA Federal Aviation AdministrationFHWA Federal Highway AdministrationFMCSA Federal Motor Carrier Safety AdministrationFRA Federal Railroad AdministrationFTA Federal Transit AdministrationHMCRP Hazardous Materials Cooperative Research ProgramIEEE Institute of Electrical and Electronics EngineersISTEA Intermodal Surface Transportation Efficiency Act of 1991ITE Institute of Transportation EngineersNASA National Aeronautics and Space AdministrationNASAO National Association of State Aviation OfficialsNCFRP National Cooperative Freight Research ProgramNCHRP National Cooperative Highway Research ProgramNHTSA National Highway Traffic Safety AdministrationNTSB National Transportation Safety BoardPHMSA Pipeline and Hazardous Materials Safety AdministrationRITA Research and Innovative Technology AdministrationSAE Society of Automotive EngineersSAFETEA-LU Safe, Accountable, Flexible, Efficient Transportation Equity Act: A Legacy for Users (2005)TCRP Transit Cooperative Research ProgramTEA-21 Transportation Equity Act for the 21st Century (1998)TRB Transportation Research BoardTSA Transportation Security AdministrationU.S.DOT United States Department of Transportation