tceq water/wastewater training provider seminar tceq water/wastewater training provider seminar...
TRANSCRIPT

1
TCEQ Water/Wastewater Training Provider Seminar
Membrane Separation BasicsTheory, Uses, Types, Styles, and Performance
Membrane Separation Basics
Outline
• Dead End Filtration vs Cross Flow Filtration
• Comparison of MF, UF, NF, RO
• Applications• Applications
• Membrane Types & Configurations
• Formulas
• Troubleshooting
Direct or Dead End Filtration
Membrane Separation Basics
Raw Water
•Mechanical separation. Once plugged, filters are discarded, however membranes may be back flushed.
•Salts can precipitate and foul NF and RO membranes.
Filtered Water
2
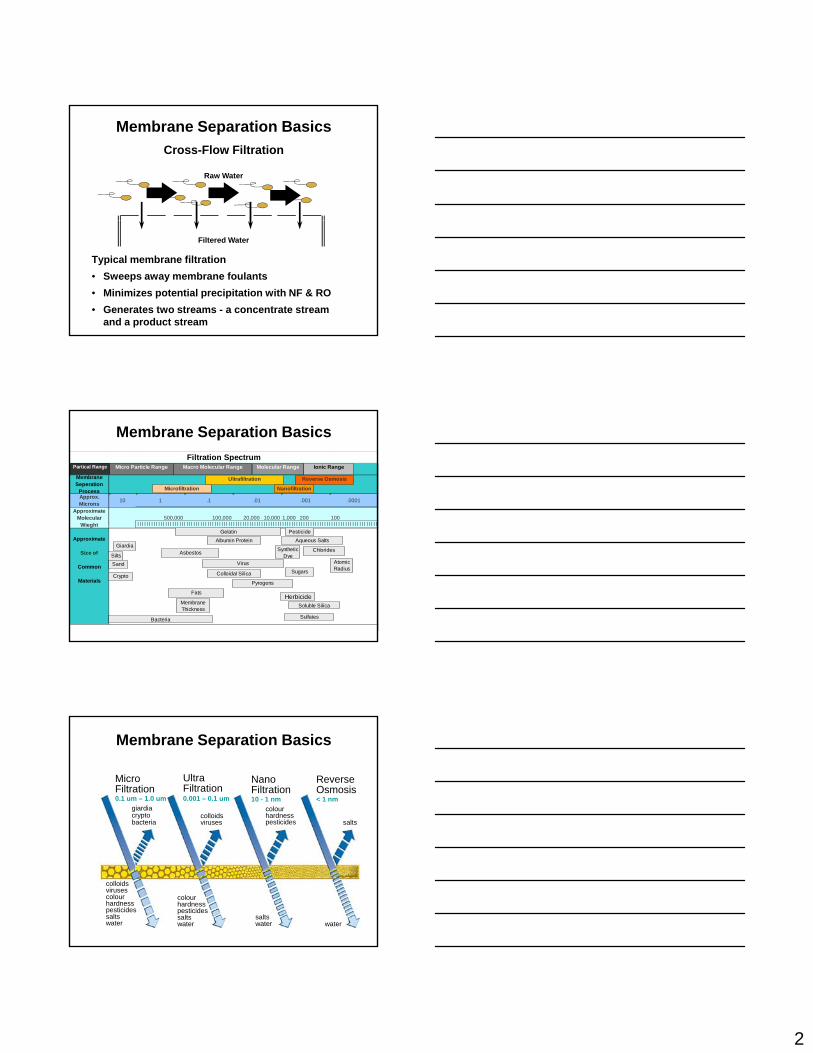
Cross-Flow Filtration
Membrane Separation Basics
Raw Water
Typical membrane filtration
• Sweeps away membrane foulants
• Minimizes potential precipitation with NF & RO
• Generates two streams - a concentrate stream and a product stream
Filtered Water
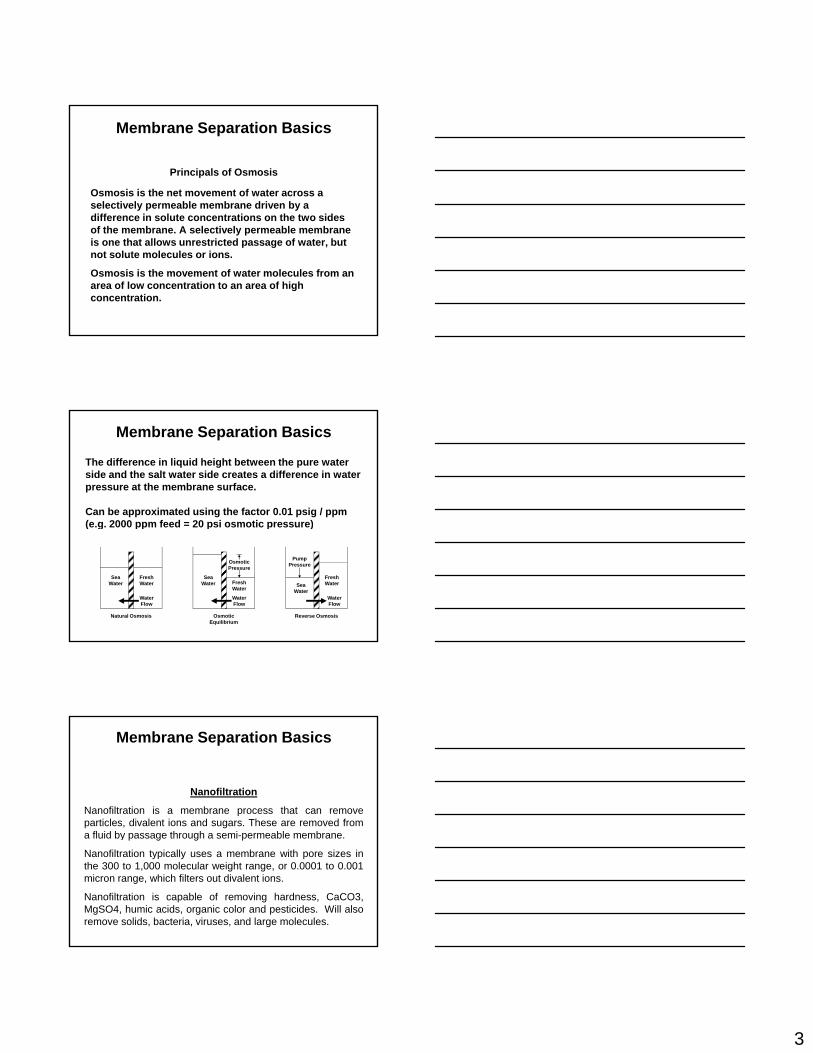
Approx. Microns
10 1 .1 .01 .001 .0001
Approximate Molecular
Wieght500,000 100,000 20,000 10,000 1,000 200 100
Membrane Seperation
Process
Filtration Spectrum
Microfiltration
Ultrafiltration
Nanofiltration
Reverse Osmosis
Ionic RangeMolecular RangeMacro Molecular RangeMicro Particle Range
| | | | | | | | | | | | | | | | | | | | | | | | | | | | | | | | | | | | | | | | | | | | | | | | | | | | | | | | | | | | | | | | | | | | | | | | | | | | | | | | | | | | | | | | | | | | | | | | | | | | | | |
Partical Range
Membrane Separation Basics
Wieght
Approximate
Size of
Common
Materials
Gelatin Pesticide
Aqueous Salts
Synthetic Dye
Sugars
Virus
| | | | | | | | | | | | | | | | | | | | | | | | | | | | | | |
Silts
Albumin Protein
Colloidal Silica
Pyrogens
Herbicide
Asbestos
Fats
Chlorides
Atomic Radius
Bacteria
MembraneThickness
Soluble Silica
Sand
Crypto
Giardia
Sulfates
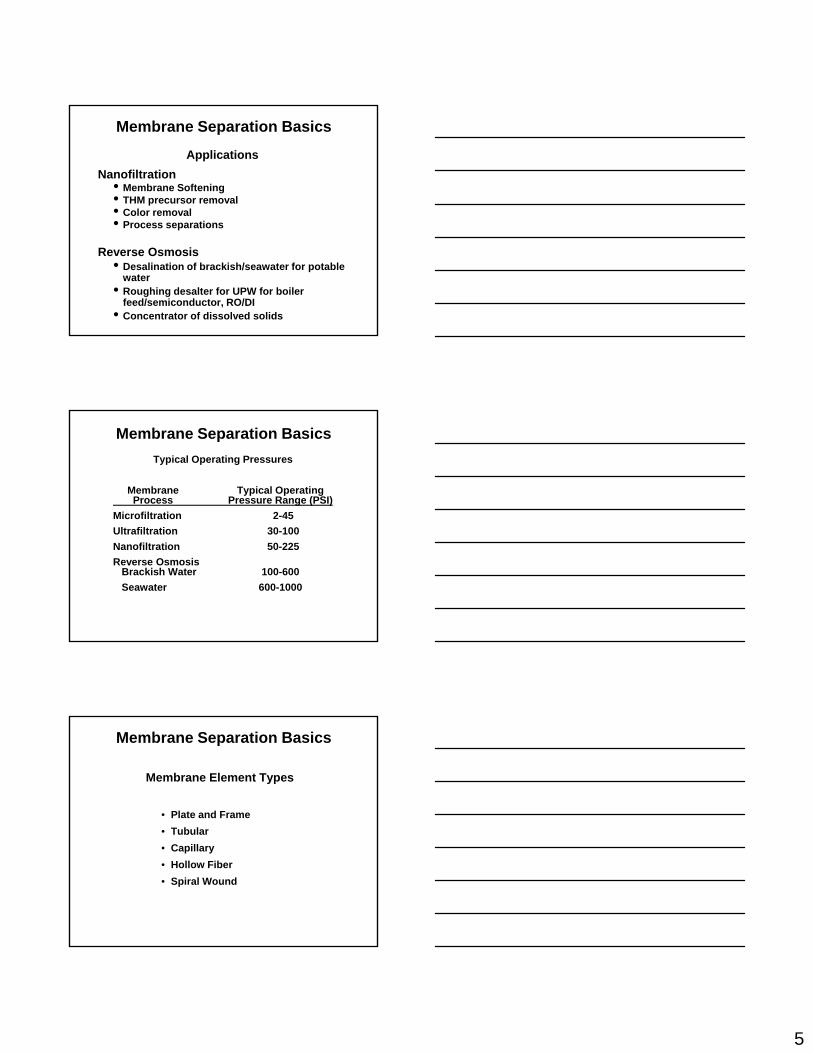
MicroFiltration0.1 um – 1.0 um
UltraFiltration0.001 – 0.1 um
NanoFiltration10 - 1 nm
ReverseOsmosis< 1 nm
giardiacryptobacteria
colloidsviruses
colourhardnesspesticides salts
Membrane Separation Basics
colloids virusescolourhardness pesticides saltswater
colour hardnesspesticidessaltswater
saltswater water
3
Membrane Separation Basics
Osmosis is the net movement of water across a selectively permeable membrane driven by a difference in solute concentrations on the two sides
Principals of Osmosis
difference in solute concentrations on the two sides of the membrane. A selectively permeable membrane is one that allows unrestricted passage of water, but not solute molecules or ions.
Osmosis is the movement of water molecules from an area of low concentration to an area of high concentration.
Membrane Separation Basics
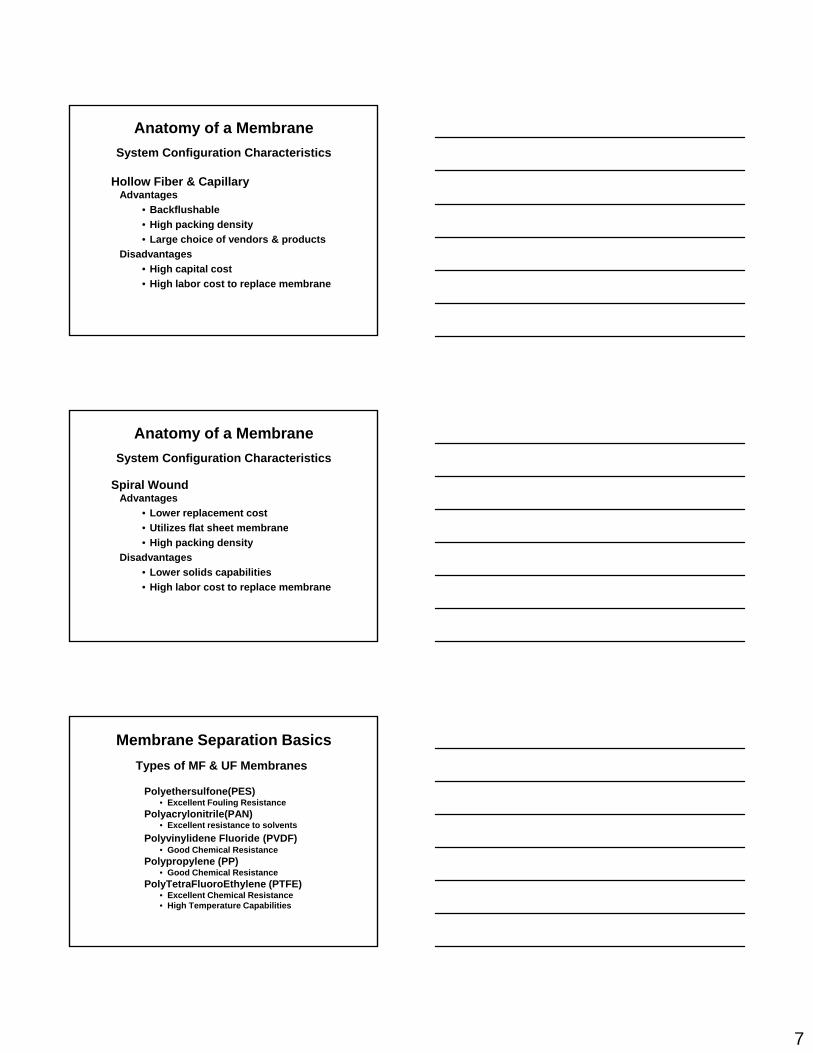
The difference in liquid height between the pure water side and the salt water side creates a difference in water pressure at the membrane surface.
Can be approximated using the factor 0.01 psig / ppm (e.g. 2000 ppm feed = 20 psi osmotic pressure)(e.g. 2000 ppm feed 20 psi osmotic pressure)
Sea Water
Fresh Water
Water Flow
Natural Osmosis
Sea Water Fresh
Water
Water Flow
Osmotic Equilibrium
Sea Water
Fresh Water
Water Flow
Reverse Osmosis
OsmoticPressure
Pump Pressure
Nanofiltration
Nanofiltration is a membrane process that can removeparticles, divalent ions and sugars. These are removed from
fl id b th h i bl b
Membrane Separation Basics
a fluid by passage through a semi-permeable membrane.
Nanofiltration typically uses a membrane with pore sizes inthe 300 to 1,000 molecular weight range, or 0.0001 to 0.001micron range, which filters out divalent ions.
Nanofiltration is capable of removing hardness, CaCO3,MgSO4, humic acids, organic color and pesticides. Will alsoremove solids, bacteria, viruses, and large molecules.

4
Reverse Osmosis
Reverse Osmosis is a process for removal of monovalent ions from a fluid by passage through a semi-permeable membrane.
Membrane Separation Basics
RO is the finest membrane filtration available. RO typically uses a membrane with pores that are measured in molecular weight instead of micron size. 50-300 MW is typical for RO.
RO is capable of removing monovalent ions such as Na, Cl, SO4, HCO3, NO3, ionic and non-ionic, particulate. It is also capable of removing suspended solids, bacteria, colloidal material and viruses.
Membrane Separation Basics
Reverse Osmosis Rule of Thumb
• 100 ppm TDS » 1 psi osmotic pressure
• 1,000 ppm TDS » 10 psi osmotic pressure
• 35,000 ppm TDS » 350 psi osmotic pressure
Applications
Microfiltration• Remove suspended solids• Pretreatment to UF,NF, RO• Remove giardia and cryptosporidium
Membrane Separation Basics
• Remove giardia and cryptosporidium
Ultrafiltration• Remove suspended solids • Pretreatment to NF or RO• Remove bacteria, giardia and cryptosporidium• Special process applications
5
Applications
Nanofiltration• Membrane Softening• THM precursor removal• Color removal
Membrane Separation Basics
• Process separations
Reverse Osmosis• Desalination of brackish/seawater for potable
water• Roughing desalter for UPW for boiler
feed/semiconductor, RO/DI• Concentrator of dissolved solids
Membrane Separation Basics
Typical Operating Pressures
Membrane Typical OperatingProcess Pressure Range (PSI)
Microfiltration 2-45
Ultrafiltration 30-100
Nanofiltration 50-225
Reverse OsmosisBrackish Water 100-600
Seawater 600-1000
Membrane Separation Basics
Membrane Element Types
• Plate and Frame
• Tubular• Tubular
• Capillary
• Hollow Fiber
• Spiral Wound

6
Anatomy of a Membrane
Three Primary Membrane Configurations
Flat SheetUsed in Plate & Frame Design
Used in Spiral Element Design
Capillary or Hollow FiberCapillary or Hollow FiberUsed in Cartridge Style Stand Alone Design
Used in Framed Free Flowing Design
Used in Horizontal pressure vessel design
TubularUsed in very high solids applications
Anatomy of a Membrane
System Configuration Characteristics
Plate and FrameAdvantages
• High solids capability
• Utilizes flat sheet membrane
• Infrequent cleaning required
Disadvantages
• High capital cost
• High labor cost to replace membrane
• Low packing density
Anatomy of a Membrane
System Configuration Characteristics
TubularAdvantages
• High solids capability
• High recovery rates
Disadvantages
• High capital cost
• High labor cost to replace membrane
• Low packing density
7
Anatomy of a Membrane
System Configuration Characteristics
Hollow Fiber & CapillaryAdvantages
• Backflushable
Hi h ki d it• High packing density
• Large choice of vendors & products
Disadvantages
• High capital cost
• High labor cost to replace membrane
Anatomy of a Membrane
System Configuration Characteristics
Spiral WoundAdvantages
• Lower replacement cost
Utilizes flat sheet membrane• Utilizes flat sheet membrane
• High packing density
Disadvantages
• Lower solids capabilities
• High labor cost to replace membrane
Types of MF & UF Membranes
Polyethersulfone(PES)• Excellent Fouling Resistance
Polyacrylonitrile(PAN)• Excellent resistance to solvents
Membrane Separation Basics
Polyvinylidene Fluoride (PVDF)• Good Chemical Resistance
Polypropylene (PP)• Good Chemical Resistance
PolyTetraFluoroEthylene (PTFE)• Excellent Chemical Resistance• High Temperature Capabilities

8
Types of NF & RO Membranes
Cellulose Acetate (CA)• Tolerant of Oxidants• Operate at Higher Pressures• Narrow pH Range
Membrane Separation Basics
Narrow pH Range• Poor Temperature Stability
Polyamide (PA) – Thin Film• Operate at Low Pressures• Higher Flow Capabilities• Broad pH Range• Intolerant of Oxidants• Good Temperature Stability
Anatomy of a Membrane
Flat Sheet Membrane Systems
Flat Sheet Membrane Systems
Anatomy of a Membrane
9
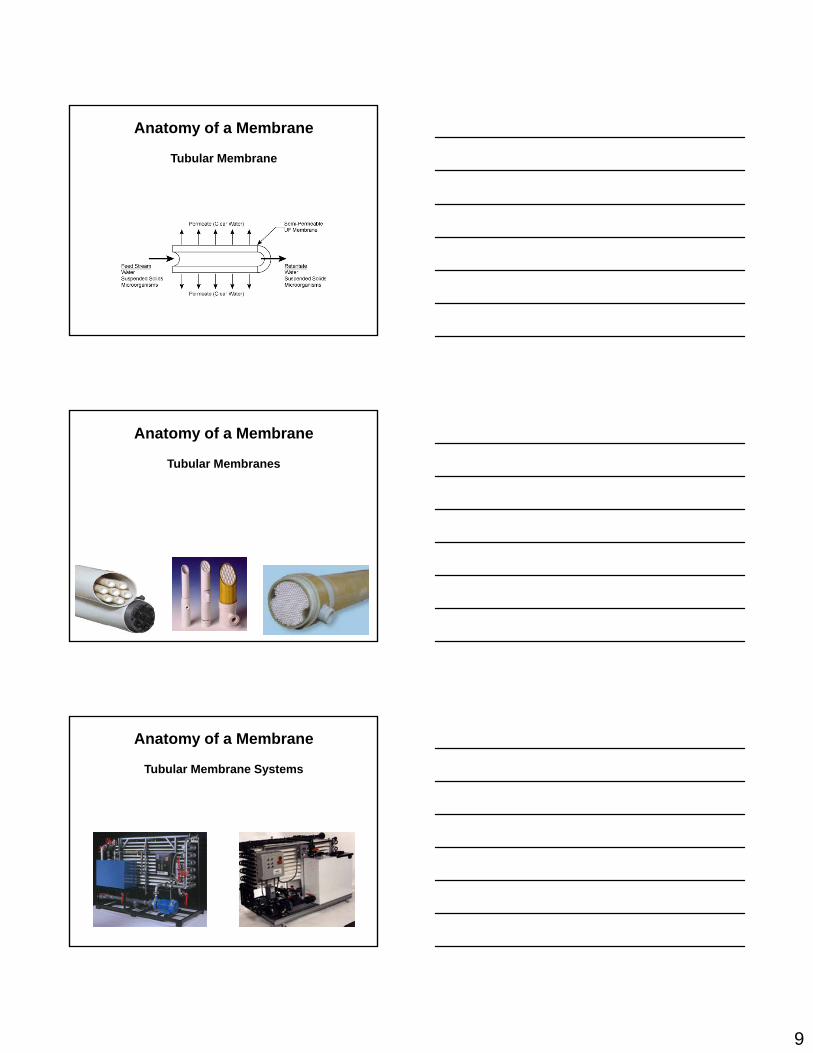
Anatomy of a Membrane
Tubular Membrane
Anatomy of a Membrane
Tubular Membranes
Anatomy of a Membrane
Tubular Membrane Systems

10
Anatomy of a Membrane
Hollow Fiber Membranes
Anatomy of a Membrane
Hollow Fiber Membranes
Anatomy of a Membrane
Inside Out Technology

11
Anatomy of a Membrane
Outside In TechnologyOutside In Technology
Anatomy of a Membrane
Hollow Fiber Membrane Systems
Anatomy of a Membrane
Hollow Fiber Membrane Systems

12
Anatomy of a Membrane
Hollow Fiber Membrane Systems
Anatomy of a Membrane
Flat Sheet Membrane
Anatomy of a Membrane
Spiral Element Illustration
13
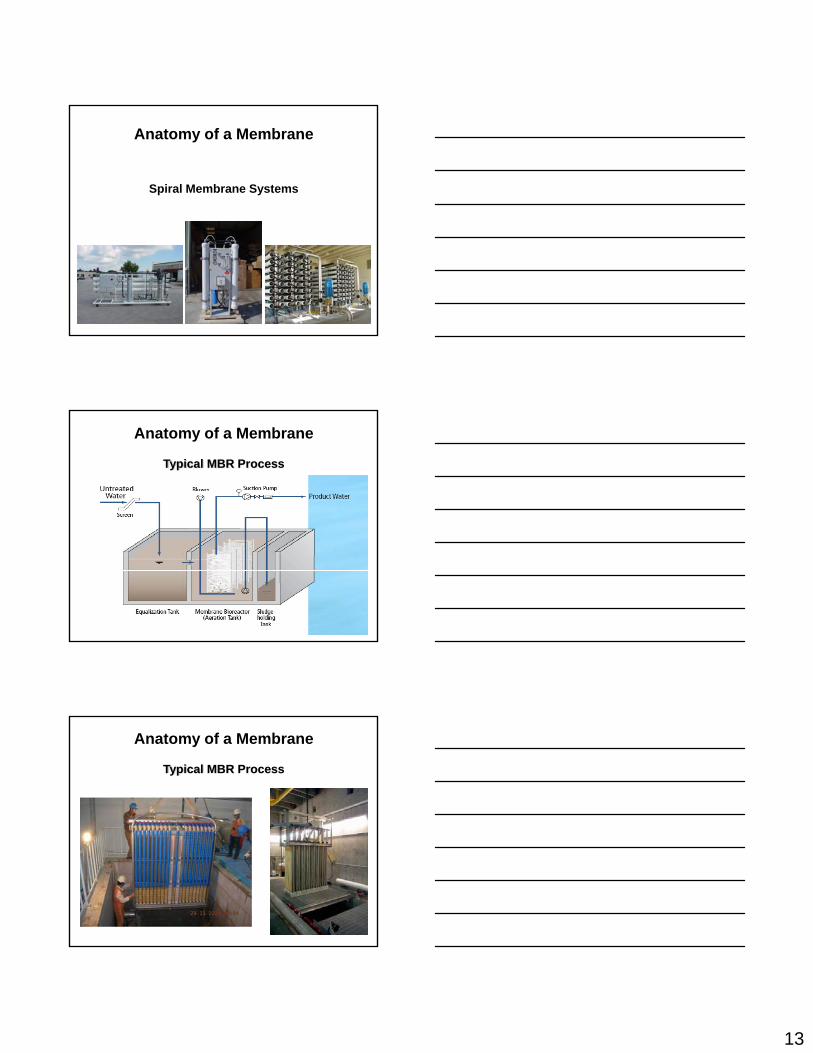
Anatomy of a Membrane
Spiral Membrane Systems
Typical MBR Process
Anatomy of a Membrane
Anatomy of a Membrane
Typical MBR Process

14
Anatomy of a Membrane
Typical MBR Process
Anatomy of a Membrane
Spiral Membrane Systems
Membrane Separation Basics
Net Drive Pressure (NDP)
• Applied Feed Pressure - Permeate Pressure -
Formulas
ppOsmotic Pressure of Feed
Average NDP
• (feed press + conc. Press)/2 - Permeate Pressure -osmotic pressure of ((feed TDS + conc TDS)/2)
15
Membrane Separation Basics
Recovery (%) =Permeate flow
Feed flowx 100
Formulas
Salt Passage (%) =
Salt Rejection (%) = 100 - Salt Passage
Permeate Salt ConcentrationFeed Salt Concentration
x 100
Membrane Separation Basics
• System Recovery = Permeate Flow / Feed Flow
• Concentration Factor
1 / (1 Recovery)
Formulas
– 1 / (1- Recovery)
• 75% Recovery = 4x concentration
• 80% Recovery = 5x concentration
• 85% Recovery = 6.7x concentration
• 90% Recovery = 10x concentration
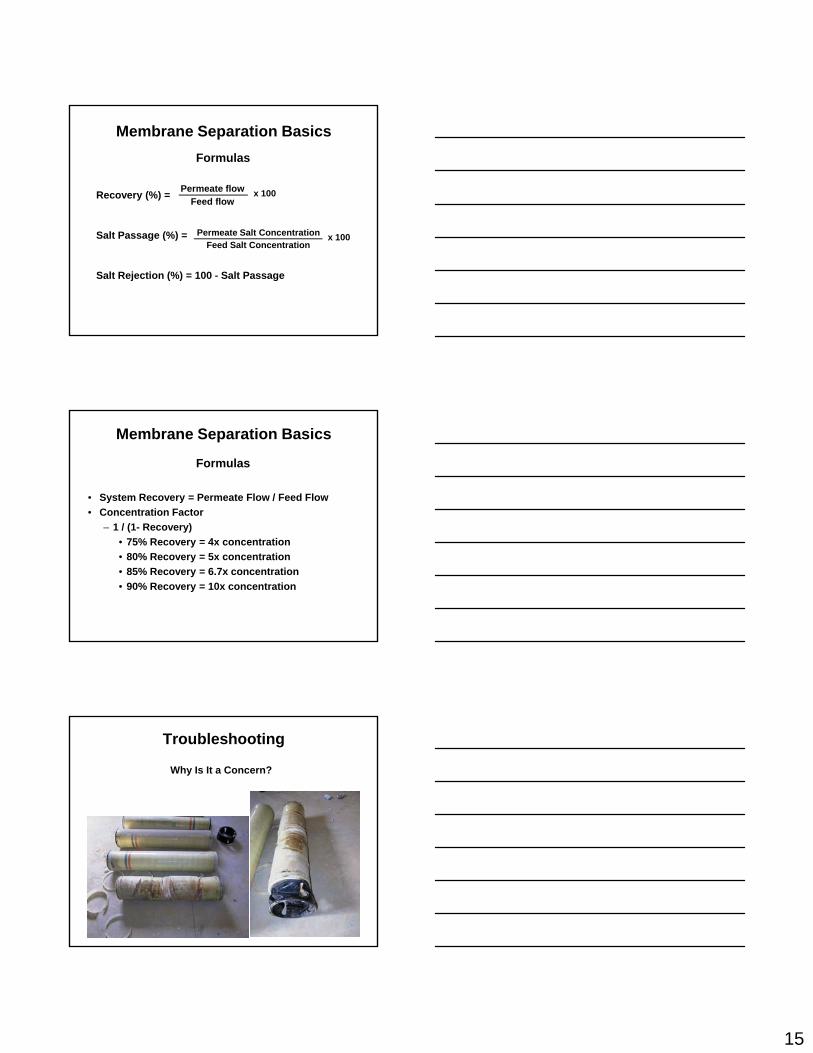
Why Is It a Concern?
Troubleshooting
16
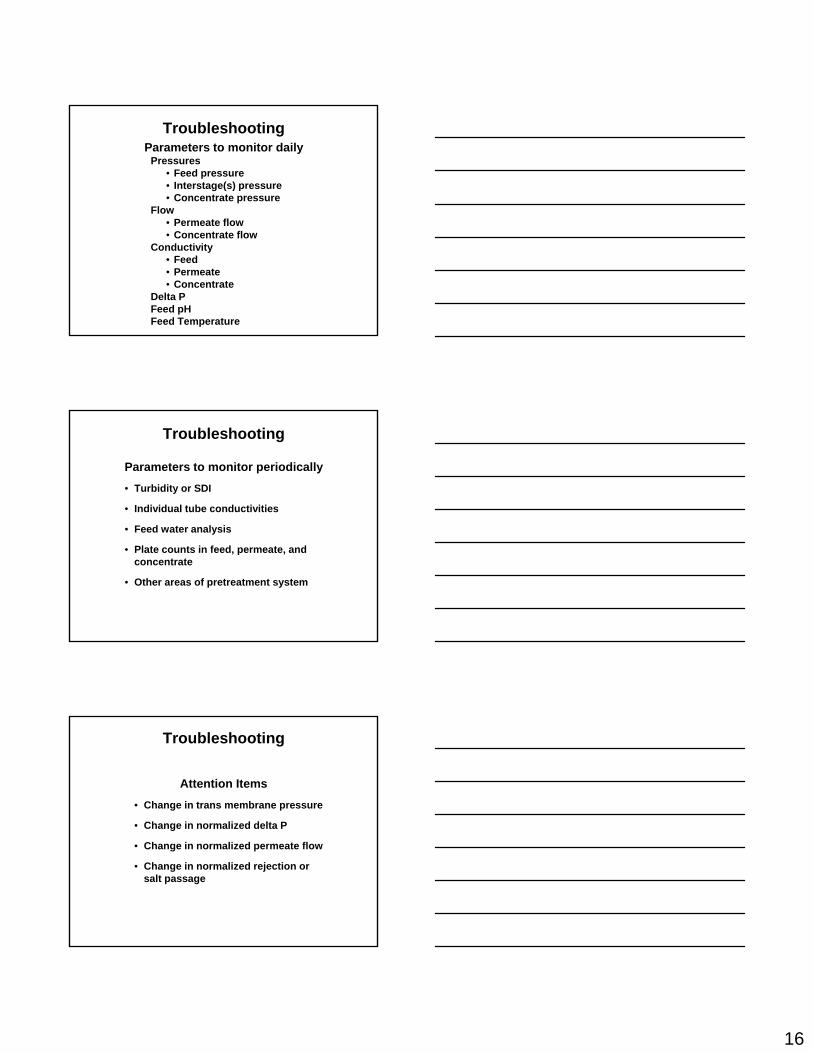
TroubleshootingParameters to monitor daily
Pressures• Feed pressure• Interstage(s) pressure• Concentrate pressure
FlowPermeate flow• Permeate flow
• Concentrate flowConductivity
• Feed• Permeate• Concentrate
Delta PFeed pHFeed Temperature
Troubleshooting
Parameters to monitor periodically
• Turbidity or SDI
• Individual tube conductivities
F d t l i• Feed water analysis
• Plate counts in feed, permeate, and concentrate
• Other areas of pretreatment system
Troubleshooting
Attention Items
• Change in trans membrane pressure
• Change in normalized delta P
• Change in normalized permeate flow
• Change in normalized rejection or salt passage
17
Troubleshooting
Front end increase• Physical Blockage
• Suspended solids - Silts, colloids, clays, sand, etc.
Differential Pressure (delta P) Increase
• Iron / Manganese Fouling - When oxidized, will show up in lead element and pre-filters.
• Biological Growth - Usually is first noticeable in front end vessels.
• Pretreatment polymers, when clarifying, the target should be 0.3 NTU to avoid overdosing polymers.
• Silica Fouling – Colloidal silica can be deposited on front end.
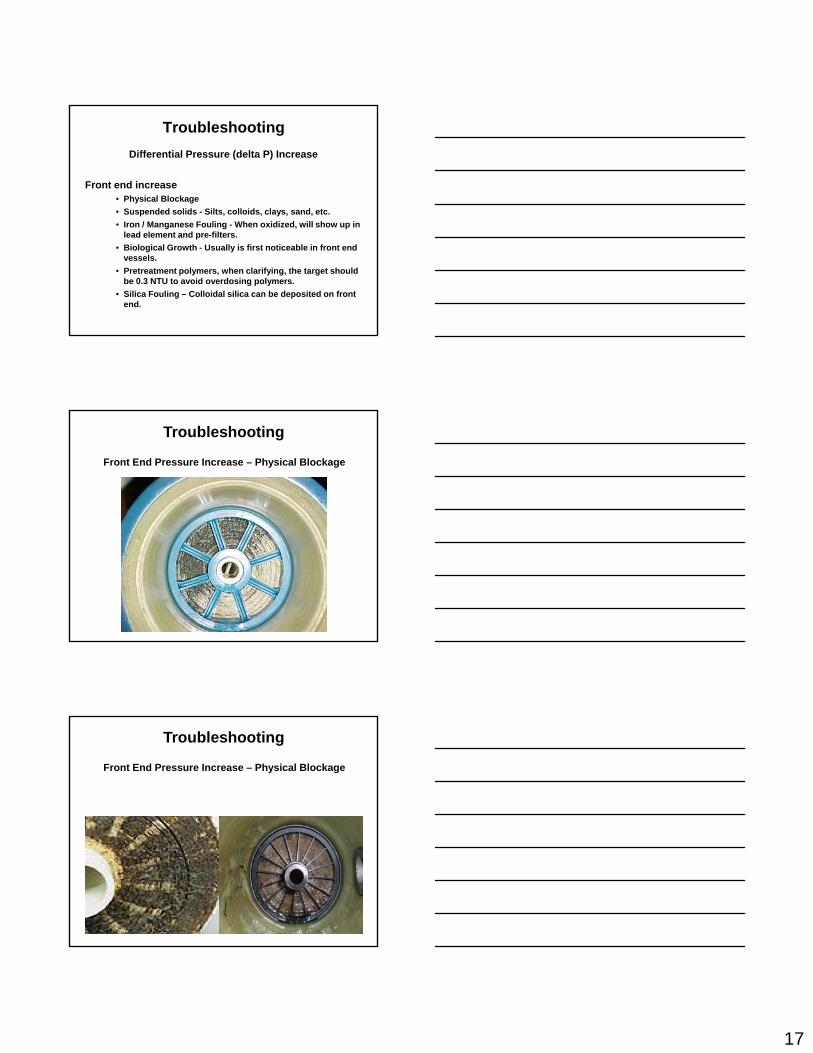
Troubleshooting
Front End Pressure Increase – Physical Blockage
Troubleshooting
Front End Pressure Increase – Physical Blockage

18
Troubleshooting
Pressure Increase – Physical Blockage
Troubleshooting
Tail end pressure drop increase(Mostly NF & RO)
• Scaling - Insufficient scale inhibitor or acid
Differential Pressure (delta P) Increase
g
• Increased Recovery
• Feedwater Chemistry Change
• pH or Temperature Change
Membrane Cleaning
MF/UF Scaled Fouling
19
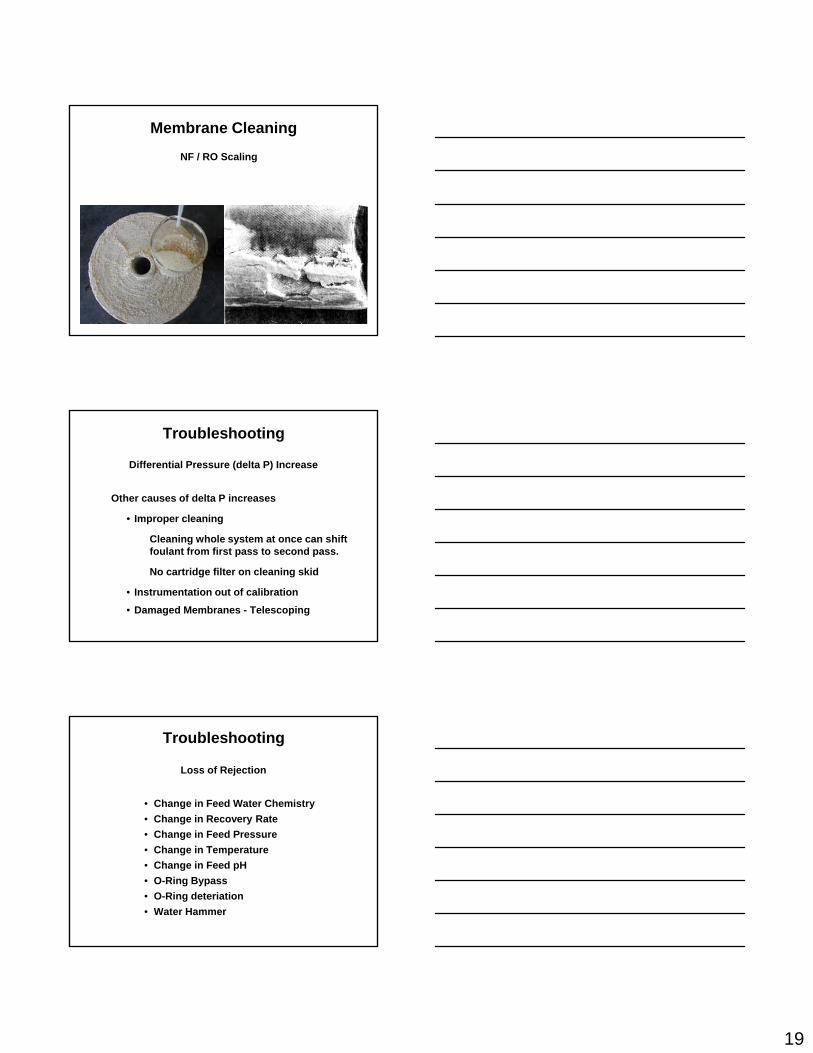
Membrane Cleaning
NF / RO Scaling
Troubleshooting
Other causes of delta P increases
• Improper cleaning
Differential Pressure (delta P) Increase
Cleaning whole system at once can shift foulant from first pass to second pass.
No cartridge filter on cleaning skid
• Instrumentation out of calibration
• Damaged Membranes - Telescoping
Troubleshooting
• Change in Feed Water Chemistry
• Change in Recovery Rate
Ch i F d P
Loss of Rejection
• Change in Feed Pressure
• Change in Temperature
• Change in Feed pH
• O-Ring Bypass
• O-Ring deteriation
• Water Hammer

20
Troubleshooting
• Membrane Scaling• Membrane Fouling
Loss of Rejection
• Instrumentation Calibration• Membrane Failure• Excessive Permeate Pressure• Manifold obstruction
Combined salinity in pressure vessel
300
400
500
pm
TD
S
Troubleshooting
Conductivity Increase Through Pressure Vessel
0
100
200
300
1 2 3 4 5 6 7 8
Element position
Sal
init
y p
p
1 2 3 4 5 6 7 8
Troubleshooting

21
Troubleshooting
Troubleshooting
Troubleshooting
22
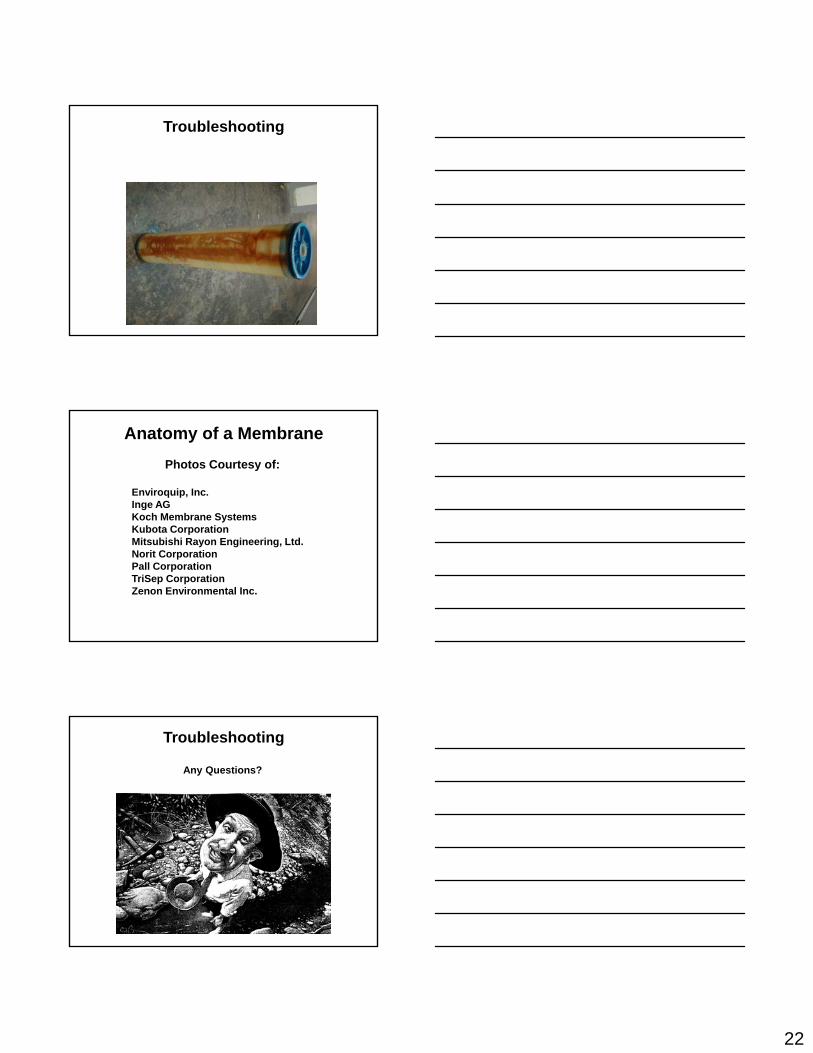
Troubleshooting
Anatomy of a Membrane
Photos Courtesy of:
Enviroquip, Inc.Inge AGKoch Membrane SystemsK b t C tiKubota CorporationMitsubishi Rayon Engineering, Ltd.Norit CorporationPall Corporation TriSep CorporationZenon Environmental Inc.
Troubleshooting
Any Questions?