taylor woodrow blue/slate/media/regions... · 5 while improving value for shareholders % return on...
TRANSCRIPT

Taylor Woodrow International Operations
9 November 2005
Delivering shareholder value
Los Arqueros, Marbella, Spain

2
Agenda
• Introduction Iain Napier
• European Operations Ed Hinchliffe
• Tour of Los Arqueros Javier Ballester
• North American Operations John Peshkin
• Wrap up Iain Napier

3
Successfully completed the transition to a focused homebuilder
0
100
200
300
400
500Group Operating Profit
Housing
Other
2000 2004
UK
North America
Other Housing
£m
We have retained the skills in property and construction necessary for success in today’s homebuilding market

4
A period of tremendous change
• Three acquisitions• Bryant (2001), Journey (2002), Wilson Connolly (2003)
• Restructured and refocused the North America business• Single management team
• Increase in homebuilding
• Profit growth driven by market selection, capital investment andfocus on ROCE
• Built UK housing to a scale operation• 3 restructurings in 3 years
• 3 head offices and 17 regional offices closed
• Significantly rationalised the product range
• Reduced headcount by 550

5
While improving value for shareholders
Return on Equity *%
0
50
100
150
200
250
300
350
2000 2004
Equity shareholders’ funds per share
pence
0
5
10
15
20
25
30
2000 2004
* Pre goodwill and exceptionals, but after tax

6
Strategy to grow Shareholder Value
• Grow profits through the cycle
• Presence in different markets gives us alternative growth channels
• Invest where we see the best opportunities
• Cost management initiatives
• Maintain a balanced business portfolio
• Geography, product type, price point
• Improve capital management
• Disposal of non-core assets
• Improving capital turns through geographical diversity and efficiency

7
Group HousingBalanced Business Portfolio
3 year average ROACE Portfolio Strategy
2005 H1 % Capital
EmployedInvestment
trend
UK 22% Grow through improved operational performance, capital efficiency and targeted investment
76%
22%
2%
North America
29% Grow through investment in selected markets
Spain 54% Grow through investment in selected markets

Community Developments
The Green Building, Manchester
Stamford Brook, AltrinchamSandringham Gardens, Stockport
The Paddocks, Widnes Kentmere Place, Altrincham
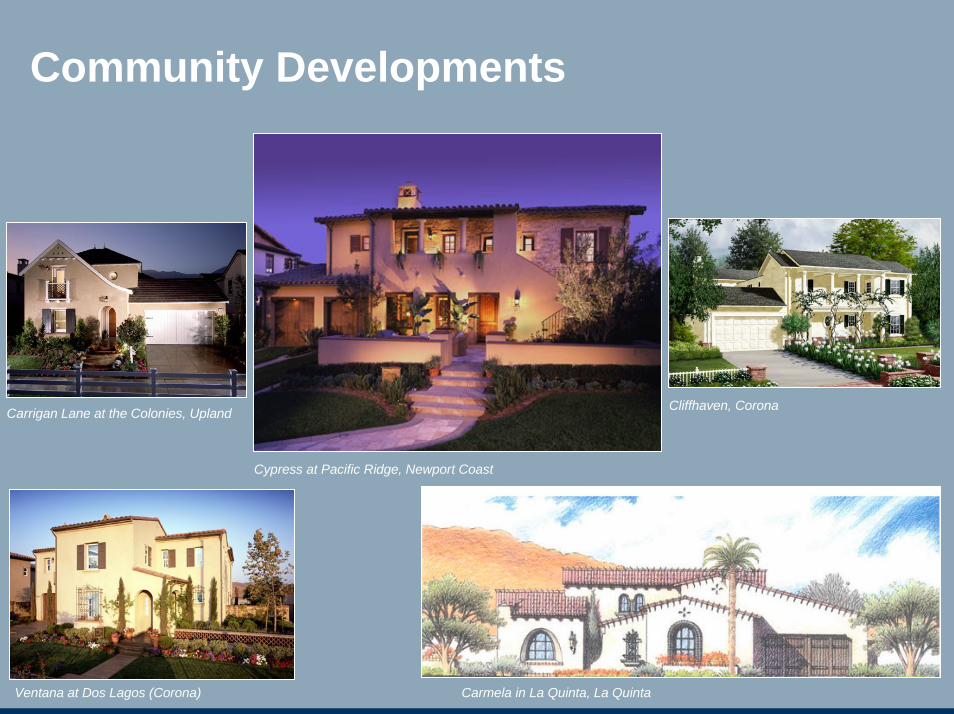
Community Developments
Cypress at Pacific Ridge, Newport Coast
Carmela in La Quinta, La Quinta
Cliffhaven, Corona Carrigan Lane at the Colonies, Upland
Ventana at Dos Lagos (Corona)

10
Group Housing Making good progress on strategy
Grown profit from operations and margins*
• Profit from operations up 0.6% to £195.4 million
• Operating Margin up 0.8 ppts to 16.8%
Provided a base for future profit growth
• Invested £358 million in the land bank
• Landbank up 17% to 74,567 plots
• Order book up 9% at £1.59 billlion
* Pre-exceptional items and before joint ventures’ interest and tax
Taylor Woodrow European Operations
9 November 2005
Delivering shareholder value

12
Agenda
• History of Taylor Woodrow in Europe
• Spanish market
• Strategy in Spain
• Regional overview• Strategy
• Land position
• Current and future developments
• Summary and Questions
13
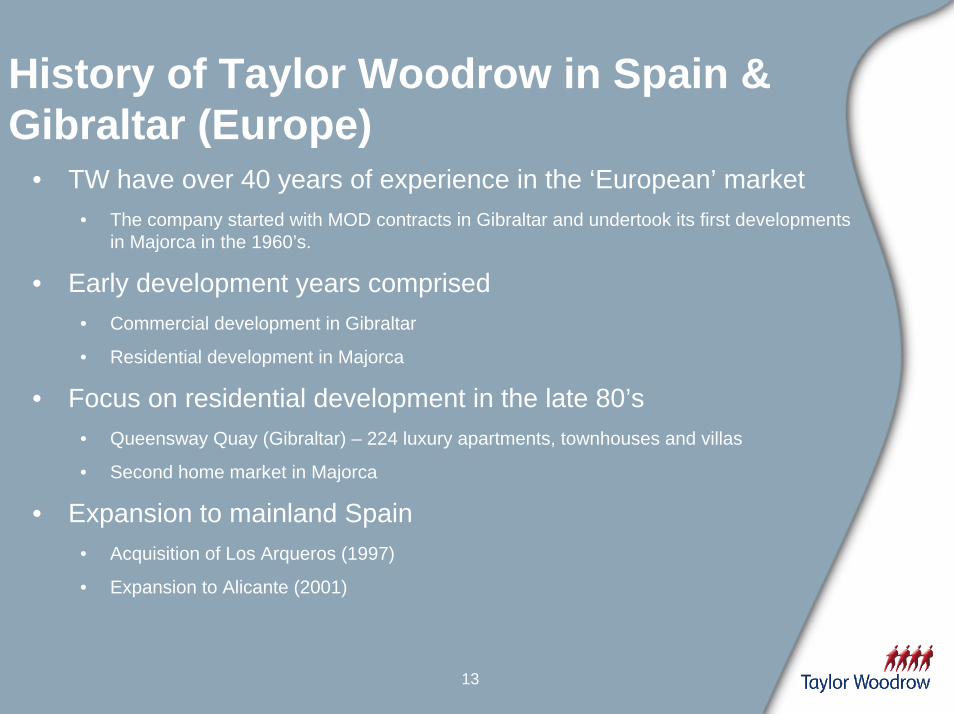
History of Taylor Woodrow in Spain & Gibraltar (Europe)
• TW have over 40 years of experience in the ‘European’ market• The company started with MOD contracts in Gibraltar and undertook its first developments
in Majorca in the 1960’s.
• Early development years comprised• Commercial development in Gibraltar
• Residential development in Majorca
• Focus on residential development in the late 80’s• Queensway Quay (Gibraltar) – 224 luxury apartments, townhouses and villas
• Second home market in Majorca
• Expansion to mainland Spain• Acquisition of Los Arqueros (1997)
• Expansion to Alicante (2001)

14
Where we operate today
Alicante
Malaga
Baleares
Gibraltar
10 active sites
4 active sites
4 active sites
4 active sites
15
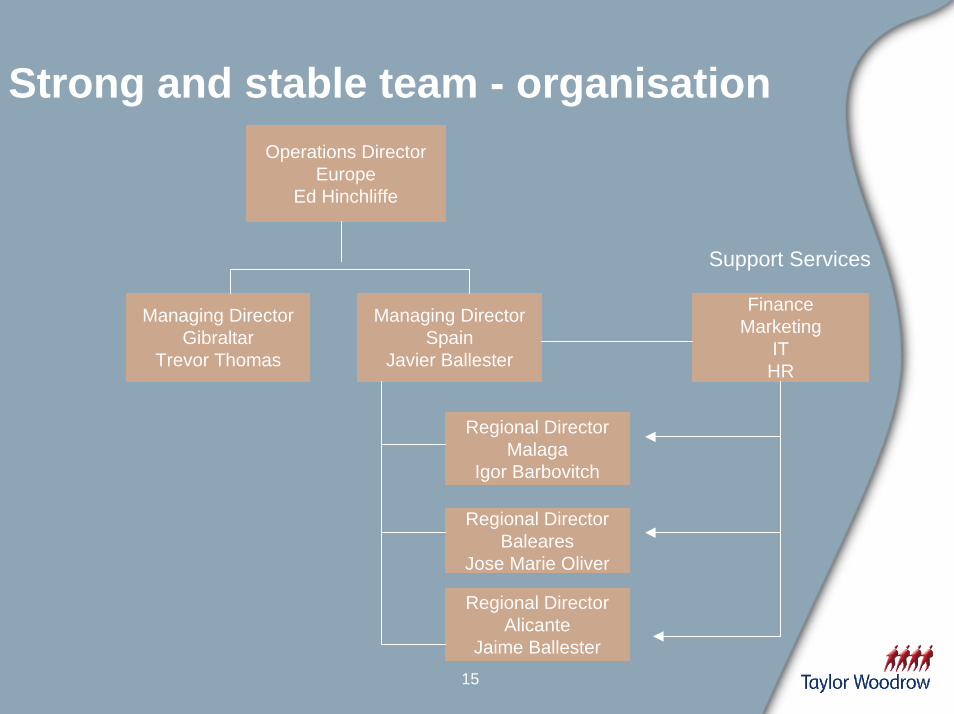
Strong and stable team - organisationOperations Director
EuropeEd Hinchliffe
Support Services
Managing DirectorGibraltar
Trevor Thomas
Managing DirectorSpain
Javier Ballester
FinanceMarketing
ITHR
Regional DirectorAlicante
Jaime Ballester
Regional DirectorBaleares
Jose Marie Oliver
Regional DirectorMalaga
Igor Barbovitch
16
We have three major categories of customer
• Second home buyers• Mainly British, focused on ‘traditional’ holiday locations
• Seeking a ‘Mediterranean’ lifestyle, preferably with investment capital uplift
• Low cost airlines ease accessibility and determine location
• First home buyers• Mainly Spanish
• Limited to urban developments in Majorca (Manacor, Palma) and Malaga
• Investors• High net worth individuals (tax exiles in Gibraltar)
• Buy to let investors

17
A record of success
£m 2000 01 02 03 04 CAGR%
ASP (£’000s) 109 127 154 186 178 13.0
Completions 253 326 306 345 415 13.2
76.5
20.1
26.3
43.1
52.1
28.7
34.7
4.7
18.6
12.4
Turnover 27.9 42.0 48.3 65.9
Operating Profit 6.1 8.7 11.6 20.3
Operating Margin (%) 21.9 20.7 24.0 30.8
Capital Employed 21.8 25.5 27.7 34.0
ROACE (%) 32.7 36.8 43.6 65.7

Spain
Javier Ballester

19
Spanish Market
• 740,000 new units in Spain in 2004
• 330,000 Mediterranean coastline units in 2004
• Inventory of 2nd home market units estimated at 3.5 m
• 40% owned by foreigners
Source: Richard Ellis CB

20
Spanish second home market is forecast to grow steadily
Source – Grupo i 2005
0
20
40
60
80
100
120
140
160
2005 2006 2007 2008 2009 2010
ForeignNational
‘000annual completions
• Foreign investment in Spanish homes has grown to >€6bn per year

21
British buyers have been fuelling demand
Source: AFI
UK36%
Germany23%
France6%
Holland3%
Italy2%
Other30%
Market for second homes owned by foreigners in 2003

22
Spain and Gibraltar – preferred areas for second homes
Balearics
Foreign/Spanish
Costa del Sol (1/1)*Costa Blanca (2/2)Costa Calida (3/3)Balearics (4/8)Costa Azahar (5/4)Costa Luz (6/5)Canaries (7/10)Costa Dorada (8/7)Costa Brava (9/6)Costa Verde (10/9)
* Figures in brackets indicate preference for foreign buyers/Spanish buyers
Airports served by low cost airlines
Del Sol
Calida
Blanca
Aza
har
Dorada
Brava
Verde
De la Luz

23
Competition
• Competitors• Very fragmented in mainland Spain
• Companies are becoming more professional
• Joint ventures with financial institutions
• Poor marketing, high dependence on estate agencies
• TWE competitive position• Sole British plc developer in Spain
• TW brand very strong in Majorca
• Strong British market
• UK sales operation
24
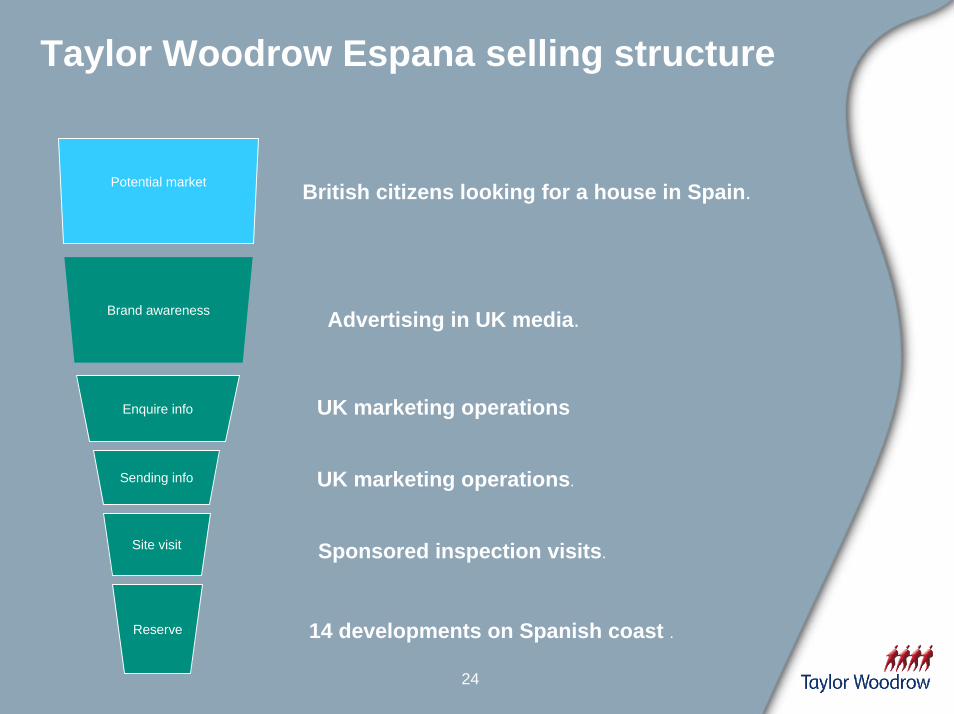
Taylor Woodrow Espana selling structure
Potential market
Brand awareness
Enquire info
Sending info
Reserve
Site visit
British citizens looking for a house in Spain.
Advertising in UK media.
UK marketing operations
UK marketing operations.
Sponsored inspection visits.
14 developments on Spanish coast .

25
Build on successful UK marketing operations • Develop a new more attractive and efficient TW Espana web site
• Focus media investment on proven success
• Create estate agent selling network incorporating two new sales people to manage two key UK regions
• Establish relationship with non real estate partners to improve prospect strike rate
• Working with two third parties on a trial basis
• UK Telesales team focus on increasing inspection visits

26
TWE strategy summary
• Focus on British second home market in three core regions: Baleares, Malaga and Alicante
• Grow organically in areas of strength
• Concentrate on acquiring new sites below 200 units utilising deferred payment terms.
• Average selling prices about €300,000.
• Product mix of apartments and townhouses.
• Build on the success of UK marketing operations• Manage risk by:
• Geographic diversity• Developing sales and marketing to Spanish second home purchasers• Spanish first home developments where land opportunities present themselves• Examine opportunities in the new growth areas

27
Balearics
Alicante
Malaga
Palma
Ibiza
Mahon (Minorca)
Gibraltar
Tarragona

28
Balearics
• 2004 unit completion was 125 from 10 sites (61.6% of FC’s were second homes)
• Reinforce leadership in the second home market by growing the business in Majorca
• Continue with local market (2-3 sites at any one time) in Palma
• Expand to Tarragona (Montbrio site) in mainland Spain
• Explore land opportunities on Menorca and Ibiza

29
Balearics
Las Brisas phase I
• 44 terraced villas
• Priced from €290,000 to €380,000.

30
Balearics
Cala Llonga
• 58 apartments
• Priced from €235,000 to €315,000

31
Alicante
Alicante
Murcia
Malaga
Palma
Gibraltar
Castellon
Almeria

32
Alicante
• 2004 unit completions was 44 from 1 site (100% of FC’s were second homes)
• Concentrate operations in Alicante and Murcia in the first instance
• Consider expansion to Almería and Castellon
• Explore limited opportunity in the first home market in Alicantewhere land opportunities arise
33
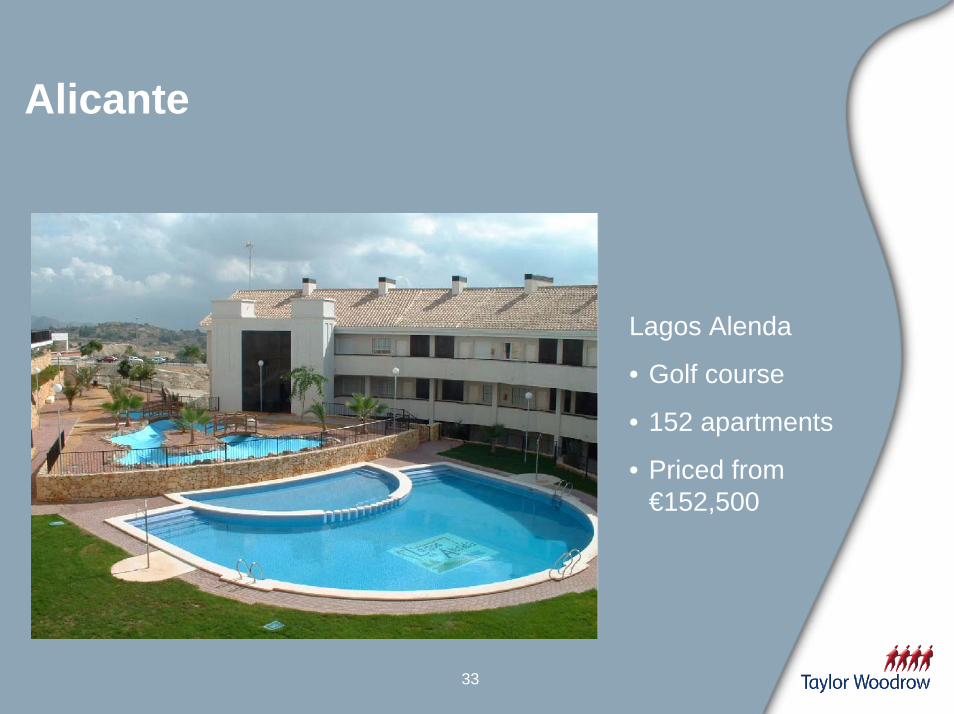
Alicante
Lagos Alenda
• Golf course
• 152 apartments
• Priced from €152,500

34
Malaga
Alicante
Malaga
Palma
GibraltarCadiz
Huelva
35
Malaga
• 2004 unit completions was 231 from 8 sites (67.5% of FC’s were second homes)
• Investment in first home market (30%)
• Selective purchasing land
• Explore development opportunities in Cadiz and Huelva area

36
Malaga
Los Eucaliptos
• 90 apartments
• Priced from €230,000 to €410,000

37
Malaga
Almendros II
• 20 townhouses
• Priced from €460,000

Gibraltar
Ed Hinchliffe

39
Gibraltar
• The Gibraltar market
• Premium/foreign
• Local X
• The premium market is very buoyant• High net worth investors
• Finance and betting industry
• Young local aspirational professionals
• Future traders
• Investors

40
Why are they buying?
• Attractive tax residency scheme for qualifying individuals
• No capital gains tax/no inheritance tax
• Lower buy-in cost than other low tax jurisdictions
• Sterling currency
• UK law and administration
• Excellent long term rental investment
• Mediterranean climate
• Land linked to Spain

41
Gibraltar
• Focus on premium end of the market
• Limit exposure to one or two major projects at any time
• Exploit our reputation as the leading premium developer on the Rock with local land owners and government
• Sell off-plan well in advance of build start• 25% non-refundable deposits

42
Gibraltar
• 25 apartments& penthouses
• priced from£345k to £865k

43
Gibraltar
• 81 apartments andpenthouses
• Priced from £305k to£1.5m

Summary & Questions

45
Summary
• Markets remain strong
• Experienced and capable team of managers with a track record of delivery
• We know and understand our core markets and will continue to focus on the second home opportunity for UK customers
• Robust plans in place to grow our business
Taylor Woodrow North American Operations
9 November 2005
Delivering shareholder value

47
Agenda
• Introduction John Peshkin
• California / Arizona Mike Forsum
• Florida Doug Schwartz
• Texas John Peshkin
• Ontario Brian Johnston
• Outlook & Questions

48
History of Taylor Woodrow in North America
• Long homebuilding history• Canada since 1953
• Florida since 1973
• Texas since 1978
• California since 1978
• Acquired Phoenix operations (Journey Homes) in 2002

49
Active in some of the strongestNorth American markets
Land bank 4,117
Land bank 9,316
Land bank 10,444
Land bank 10,565
Land bank 3,631
Data as at 30 June 2005 (owned and controlled lots)

50
Strong and stable team
John PeshkinNA CEO
Mike ForsumCalifornia / Arizona
Doug SchwartzFlorida
Brian JohnstonCanada
Tim TowellTexas
Support Services• Finance• IT• HR• Commercial

51
Strategy and objectives
• Manage a balanced portfolio through the business cycle• Products• Price points • Geographies
• Operate efficiently, at scale, in markets with strong sustainable growth prospects
• Job growth• Favourable demographics
• Expand in existing markets first; opportunistically evaluate other markets
• Maintain top quartile returns on capital and profit growth

52
Regional Operations
• Arizona • Develop premiere master-planned communities for homebuilding
• Mitigate risks by pre-selling parcels to other builders
• California • Continue to capitalise on prestigious brand and associated premium whilst
maintaining middle-market position
• Canada• Maximise value associated with Monarch respected brand through blend of land
development and high-rise to complement centralised Toronto homebuilding core business
• Florida/Texas• Continue successful land development projects while increasing scale
homebuilding operations in core markets

53
US Housing starts expected to moderate to sustainable levels
Thousands of annual starts
0
200
400
600
800
1000
1200
1400
1600
1800
2000
19861987
19881989
19901991
19921993
19941995
19961997
19981999
20002001
20022003
2004
Total Multi-Family
Total Single-Family
Source: NAHB, U.S. Census Bureau
• Strong growth in starts 2002 through to 2005
• 2005 expected to be 2.0m starts
• NAHB forecasts 5% decrease in 2006 & 2007 (1.8m starts)

54
Long-term housing demand supports projected starts
Note: Historical supply figures represent completions, forecasts use starts.
Source: NAHB, U.S. Census Bureau, Manufactured Housing Institute, and Smith Barney
2004-2013
Low Mid High1,300 1,500 1,650400 400 400185 185 185
1,885 2,085 2,235Low Mid High
1,350 1,500 1,600335 360 400
1,685 1,860 2,000
In thousands
Total StartsMulti-FamilySingle-Family
Sources of Supply:= Net Annual Housing Demand
+ Change in Vacancies+ Demolitions
Ann. Chg. In HouseholdsAnnual Sources of Demand:
1,4781,4641,524285441507
1,1931,0231,017
1,7671,6951,799306275136235104290
1,2261,3161,373’94-’03’84-’93’74-’83

55
Monthly housing payments to remain affordable
0%
1%
2%
3%
4%
5%
6%
7%
8%
9%
10%
11%
12%
1986 1987 1988 1989 1990 1991 1992 1993 1994 1995 1996 1997 1998 1999 2000 2001 2002 2003 2004
Mortgage Rate
30 yr. Fixed rate
1 yr. ARM
Source: Various
• 30-year fixed rates currently around 6.2%; 1 year ARM around 5.4%
• NAHB forecast for 2006 increases 30-year to 6.5%; 1 year ARM to 5.7%
• 2005 House price growth ranged between 5% - 20% in TW markets
• NAHB forecasts 2006 national price growth of 3% -5%
• Expect TW marketsto trend to thislevel

56
Strategy to achieve objectives in a “normal” market
• Maximise forward sales • September 30th : Sold well into Q2 2006
• Aim to be 50% pre sold by end of year
• Position bulk of homes in middle-market
• Keep a disciplined portfolio approach
• Increase operational efficiencies
• Maintain a conservative approach to land acquisitions• Fewer larger long-term land acquisitions
• All land bought has planning in place

57
Balanced portfolio will deliver objectives
18%
31%
18%
29%
Texas, 4%
36%
14%
26%
20%
Texas, 4%
Revenue Splits H1 2005 Home completions H1 2005

58
Product mix will deliver objectives
0%
20%
40%
60%
80%
100%
Price Point Type of Business
70-75%
10-15%
10-15%
Low-rise
High-rise
Land development
Entry-level
Move-up
Luxury
40-50%
40-50%
10-15%

59
Achieving growth objectives
Growth
Increase capitalin strong markets
Exploit niches
Open satellitesAcquire into new markets
e.g. Beach-front condos
e.g. Journey e.g. San Diego Division,
Southern California
e.g. Florida, Arizona, California

60
2004 Performance
Average home selling price (US$k) 374 339 10.3
Home completions 3,635 2,786 30.5
Lot completions 2,323 2,940 (21.0)
Turnover (US$m) 1,581 1,108 39.4
Operating profit (US$m) * 233.5 146.4 54.9
Operating margin (%)* 14.8 13.3 11.3
ROACE (%) * 37.7 26.1 11.6
2004 2003 %
* Pre goodwill amortisation

61
Average home selling price (US$k) 399.2 357.6 11.6
Home completions 1,668 1,500 11.2
Lot completions 1,017 1,492 (31.8)
Turnover (US$m) 823.7 656.2 25.5
Operating profit (US$m) * 137.7 98.1 40.0
Operating margin (%)* 16.7 14.9 12.0
ROACE (%) * 36.7 30.0 22.3
H12005
2005 H1 Performance
H12004 %
* Pre goodwill amortisation

62
Consistent growth in Operating Profit
$77.6$100.7
$150.7
$233.5
$98.1
$137.7
$0
$40
$80
$120
$160
$200
$240
2001 2002 2003 2004 2004 H1 2005 H1
US$m
+30%
+50%
+55%
+40%
* Pre goodwill amortisation and exceptional items
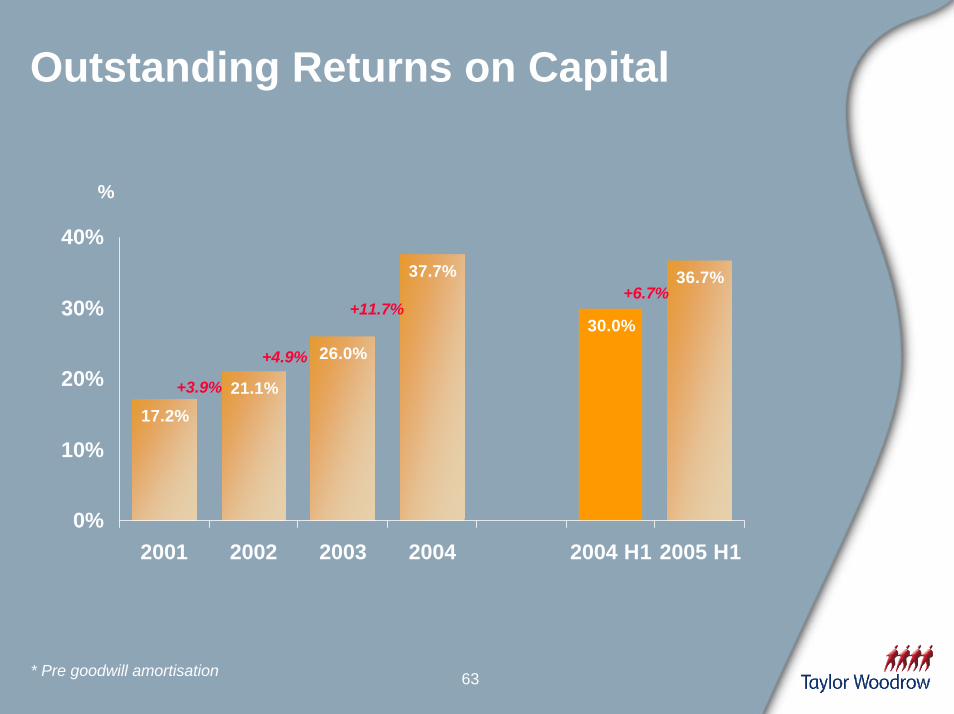
63
Outstanding Returns on Capital
17.2%21.1%
26.0%
37.7%
30.0%
36.7%
0%
10%
20%
30%
40%
2001 2002 2003 2004 2004 H1 2005 H1
%
+3.9%
+4.9%
+11.7%+6.7%
* Pre goodwill amortisation

California
Mike Forsum

65
Market and macro trends
Job GrowthAug 2005
vs Aug 2004
Pop’n Growth2000-2030
Housing Permits2004
House Price Inflation2004
California 1.5% 37% 207,000 20%+
• Californian housing market has been very strong in recent years
• Annual population growth of 250,000 households; continued undersupply of around 50,000 new homes per year
• Other US builders now commenting of softness at luxury price levels in South California but TW product continues to sell well
Source: Department of Labor, Census data, NAHB

66
California land bank and completions
706
2379 2450
4117
241
497
697
273307
0
500
1000
1500
2000
2500
3000
3500
4000
4500
2002 2003 2004 2005 H1
Land bank
0
100
200
300
400
500
600
700
Home Completions
Land bankFY home completionsHY home completions
As at H1 2005; a 3.5 year land bank based on last 12 months home and lot completions

67
California average selling prices
1064
786 776 797
0
200
400
600
800
1000
1200
2002 2003 2004 2005 H1
$k

68
Strategy
• Southern California• Maintain presence in luxury market
• Continue to capitalise in middle-market
• Expansion into Palm Springs
• Northern California• Concentration on San Jose infill market
• Building scale operations through 2005 onwards

69
Southern California
Cypress, Irvine
• From $2.5 million
• Luxury market

70
Northern California
Hawthorn Place, San Jose
• From $700,000
• Move-up

Arizona
Mike Forsum

72
Market and macro trends
Job GrowthAug 2005
vs Aug 2004
Pop’n Growth2000-2030
Housing Permits2004
House Price Inflation2004
Arizona 4.1% 109% 65,000 20%+
• Phoenix housing market has been running at record levels (volumeand price appreciation) in recent years
• Growth in permits in latter part of 2005 have slowed
• Price increases are starting to moderate
Source: Department of Labor, Census data, NAHB

73
Arizona land bank and completions
3649
5947
7119
9316
689
841
211
509
375
2000
4000
6000
8000
10000
2002 2003 2004 2005 H1
Land bank
100
200
300
400
500
600
700
800
900
Home Completions
Land bankFY home completionsHY home completions
As at H1 2005; a 6.6 year land bank based on last 12 months home and lot completions

74
Arizona average selling prices
120132
183
206
0
50
100
150
200
250
2002 2003 2004 2005 H1
$k

75
Strategy
• Active in entry and move-up markets
• Acquire master-planned communities• Complete planning whilst land under option
• Retain best lots for home building
• Sell remaining lots to other builders

76
Arizona
Thompson Ranch, Phoenix
• From $120,000
• Entry-level market

77
Arizona
Shamrock Estates, Phoenix
• From $300,000
• Move-up market

Florida
Doug Schwartz

79
Market and macro trends
Job GrowthAug 2005
vs Aug 2004
Pop’n Growth2000-2030
Housing Permits2004
House Price Inflation2004
Florida 3.4% 80% 256,000 20%+
• Low-rise market has continued in 2005 to be very strong underwrittenby strong demographics; high-rise beachfront condo market started to soften in second half of 2005
• Still a strong seasonal market (Jan-April main selling months)
• Strong deposit structure and good order book
Source: Department of Labor, Census data, NAHB

80
Florida land bank and completions
3405
5213
7632
10586
384
505
305297
202
0
2000
4000
6000
8000
10000
12000
2002 2003 2004 2005 H1
Land bank
0
100
200
300
400
500
600
Home Completions
Land bankFY home completionsHY home completions
As at H1 2005; a 12.1 year land bank based on last 12 months home and lot completions
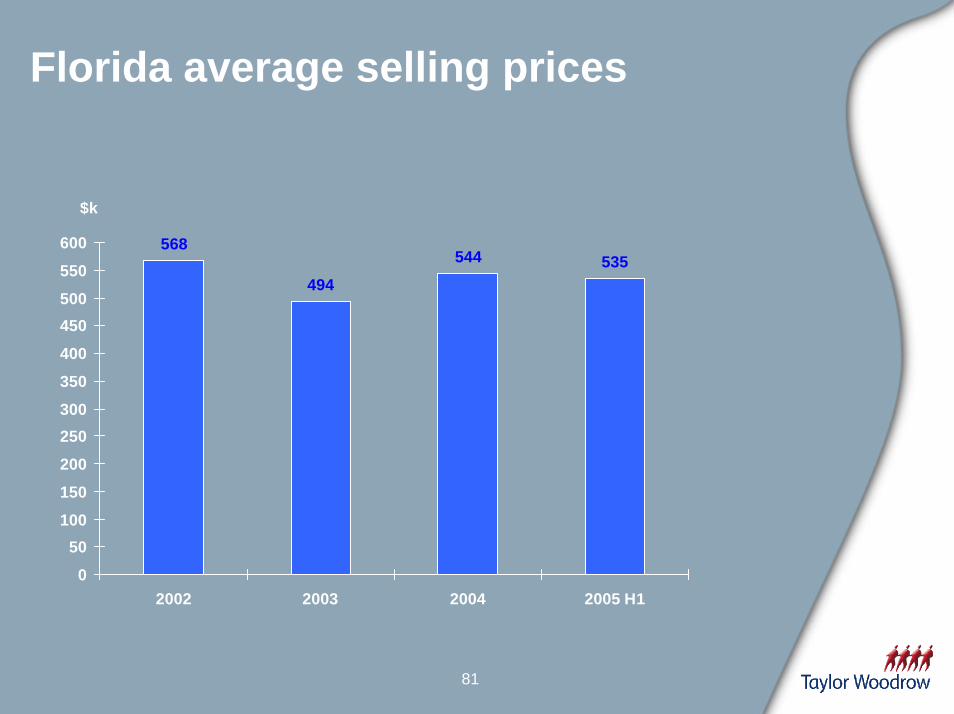
81
Florida average selling prices
568
494
544 535
0
50100
150
200
250300
350
400
450500
550
600
2002 2003 2004 2005 H1
$k

82
Strategy
• Continue to build scale in three local markets
• Keep bulk of product in affordable middle-market segment
• Balance between master-planned communities, lot positions and high-rise
• For high-rise, generally pre-sell buildings to around 50% before construction start, with material deposit levels
• Supplement core business by opportunistic land development projects outside homebuilding markets
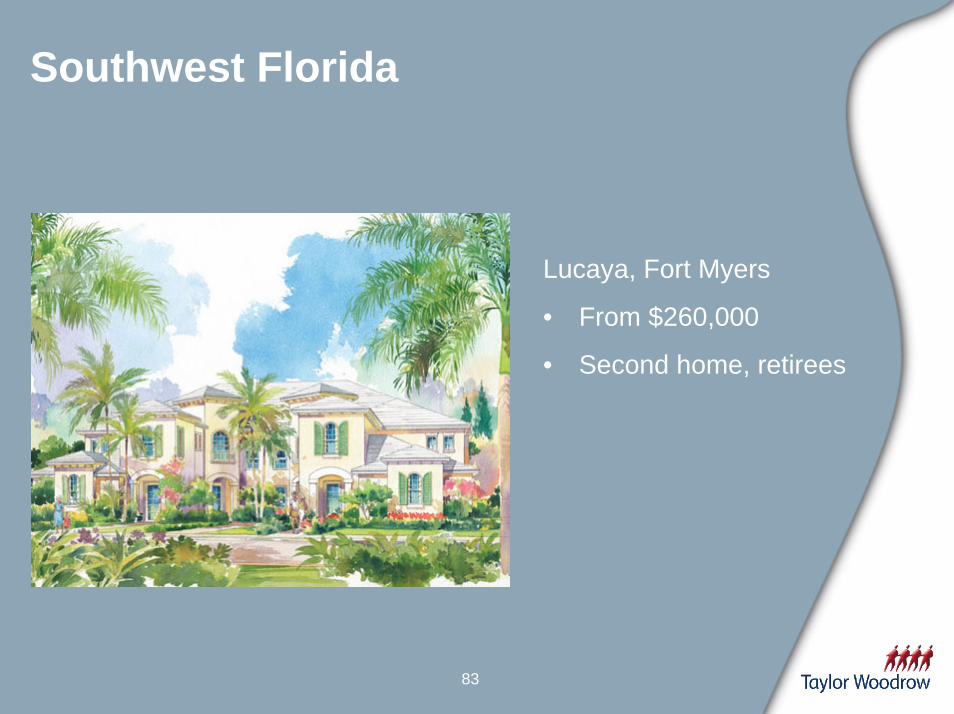
83
Southwest Florida
Lucaya, Fort Myers
• From $260,000
• Second home, retirees

84
Southeast Florida
Mirasol, West Palm Beach
• From $650,000
• Luxury market
85
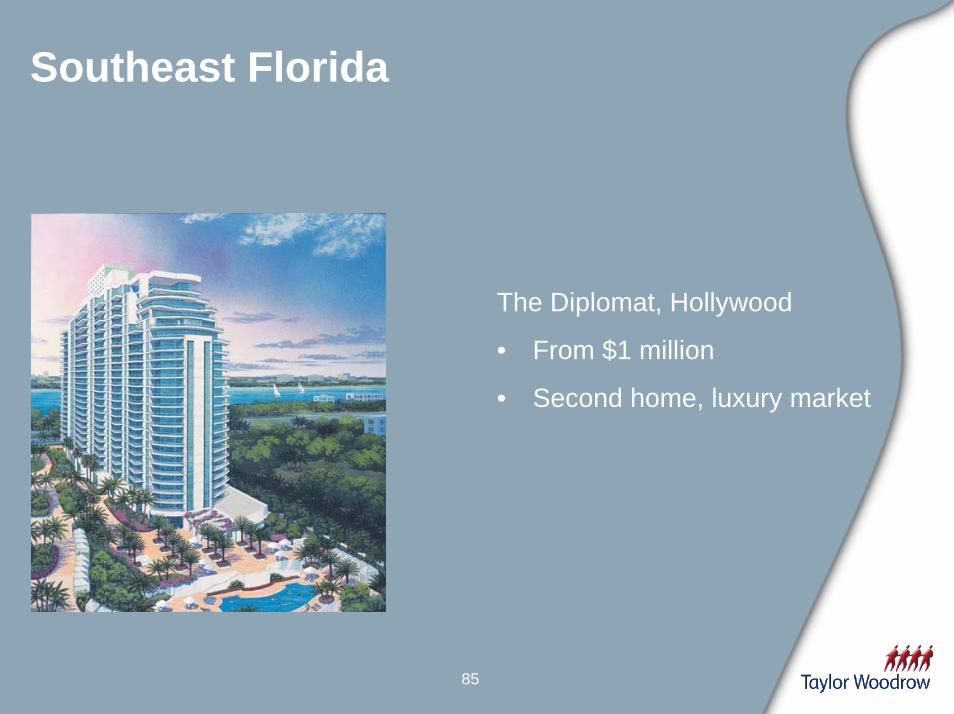
Southeast Florida
The Diplomat, Hollywood
• From $1 million
• Second home, luxury market

86
Central Florida
Waterchase, Tampa
• From $600,000

Texas
John Peshkin

88
Market and macro trends
Job GrowthAug 2005
vs Aug 2004
Pop’n Growth2000-2030
Housing Permits2004
House Price Inflation2004
Texas 1.3% 60% 188,000 3-5%
• Texas markets have not enjoyed the run up in prices as other markets have
• Remain well balanced markets in terms of supply and demand
• Recently experiencing improved demand
Source: Department of Labor, Census data, NAHB

89
Texas land bank and completions
24442329
37683631
94
5952 59
33
1500
2000
2500
3000
3500
4000
2002 2003 2004 2005 H1
Land bank
0
10
20
30
40
50
60
70
80
90
100
Home Completions
Land bankFY home completionsHY home completions
As at H1 2005; a 9.6 year land bank based on last 12 months home and lot completions
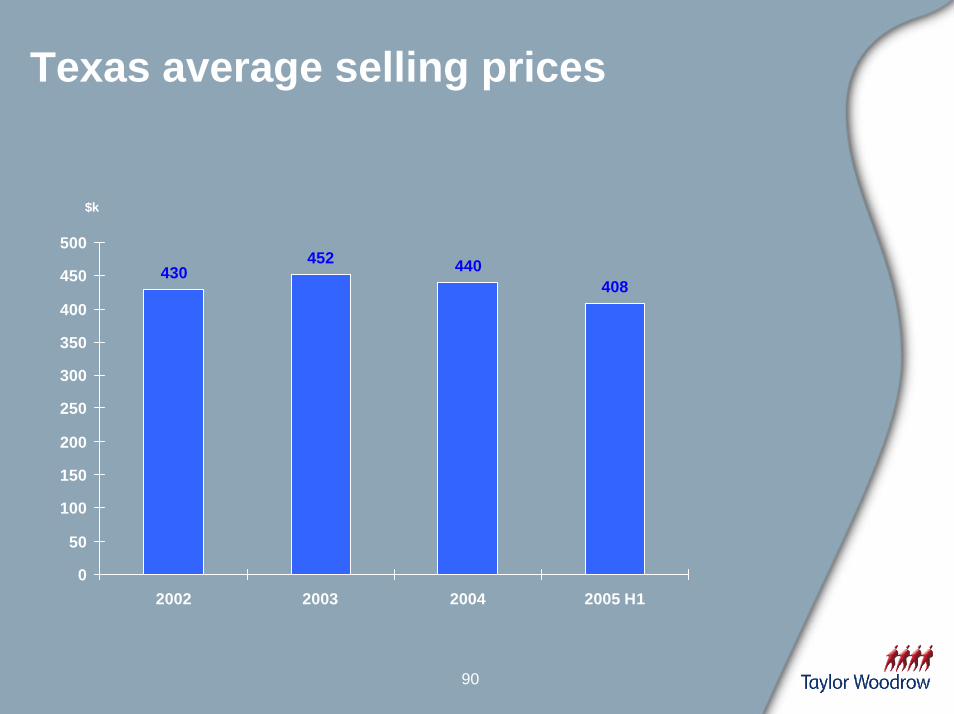
90
Texas average selling prices
430452 440
408
0
50
100
150
200
250
300
350
400
450
500
2002 2003 2004 2005 H1
$k

91
Strategy
• Leverage existing master-planned communities to build scale homebuilding operations in Austin and Houston
• Continue to migrate downward to middle-market homes

92
Austin
Steiner Ranch, Austin
• From $300,000
• Move-up market

93
Houston
Copper Lakes, Houston
• From $265,000
• Move-up market

Ontario
Brian Johnston

95
Market and macro trends
Job GrowthAug 2005
vs Aug 2004
Pop’n Growth2004-2031
Housing Permits2004
House Price Inflation2004
Ontario 1.4% 33% 85,000 5%
• Low-rise market holding up well in 2005
• Land supply in Greater Toronto tight
• High-rise market very active
Source: Department of Labor, Ontario Ministry of Finance

96
Ontario land bank and completions
5280
98909040
104441498
496
1030
1157
617
0
2000
4000
6000
8000
10000
12000
2002 2003 2004 2005 H1
Land bank
0
200
400
600
800
1000
1200
1400
1600
Home CompletionsLand bankFY home completionsHY home competions
As at H1 2005; a 5.8 year land bank based on last 12 months home and lot completions

97
Ontario average selling prices
168
215233
269
0
50
100
150
200
250
300
2002 2003 2004 2005 H1
$k

98
Strategy
• Low-rise• Centralised operations in Toronto and Ottawa
• Leverage advantages from financial strength
• High-rise• Affordable product in downtown Toronto
• Exploit existing relationships
• Lumpy completions profile
99
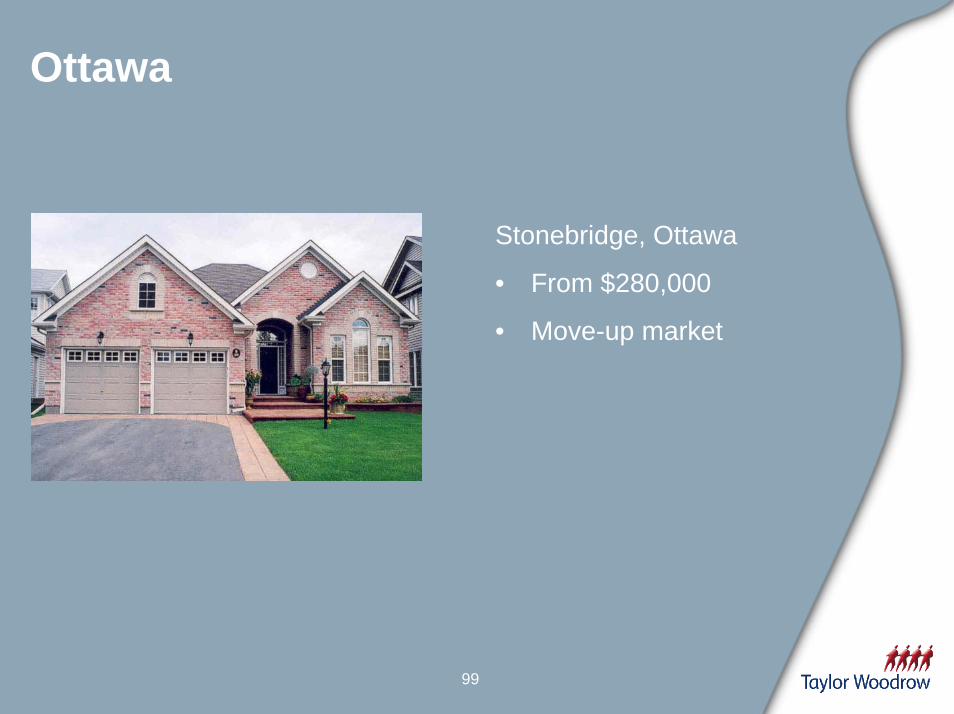
Ottawa
Stonebridge, Ottawa
• From $280,000
• Move-up market
100
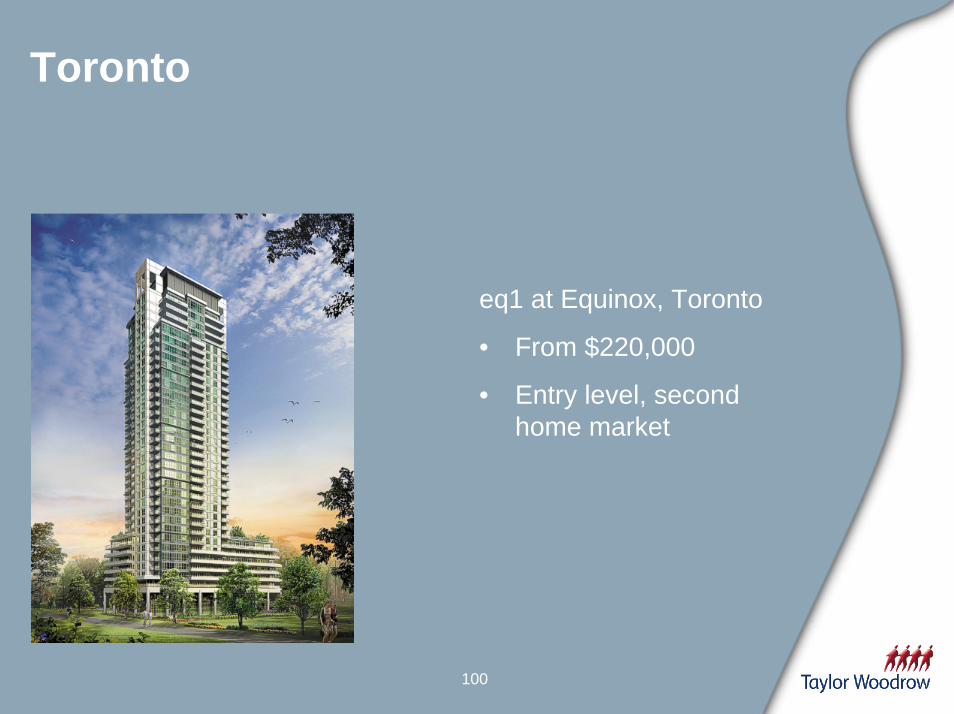
Toronto
eq1 at Equinox, Toronto
• From $220,000
• Entry level, second home market

Summary & Questions
102
Summary
• Long established business, with experienced local management
• Successful track record
• On track to meet our expectations• Market remains strong
• Land bank well placed for 2006 & beyond• 38,073 units at HY 2005
• 100% of land in place for 2006
• 95% of land in place for 2007
• Strong order book for 2006• Sold well into Q2 2006
• Future growth driven by volume
• Actions in place to achieve top quartile returns and profit growth in a more normal market

Taylor Woodrow International Operations
9 November 2005
Delivering shareholder value
Los Arqueros, Marbella, Spain

104
Summary
• Long established international operations
• Strong, experienced local management
• Track record of delivering profit growth and high returns on capital
• Well positioned for continued success• Excellent land positions
• Proven strategy

105
Update on current trading
• Group trading in line with expectations• Prospects remain good and we continue to benefit from our portfolio strategy
• UK demand slightly stronger than last year• Market is competitive, margin pressures remain
• Overall net reservations up 15% from slightly fewer sites
• North America remains strong• Signs of moderation in certain hotspots
• Record order book gives us confidence for 2005 and 2006
• Hurricane Wilma has caused some interruption to build schedules, but do not at this stage anticipate any material profit impact

106
Questions and Answers