taxpayers on the hook - truthinaccounting.org · $1.9 billion $572.6 million $1.3 billion $1.5...
TRANSCRIPT

TAXPAYERS ON THE HOOK
Truth in Accounting has released a new analysis of the 10 most populous U.S. cities that includes their largest underlying government units.
With the exception of New York City, most municipalities do not include in their annual financial report the finances of large, underlying government units that city taxpayers are also responsible for, such as schools districts, and transit and housing authorities.
This report takes into account these underlying government entities and provides residents and taxpayers in these cities with a more accurate and holistic view of their respective city’s finances. When the unfunded debt of these underlying government units is combined with the county, municipal, and state debt, city taxpayers are on the hook for much more than they think.
For example, our Financial State of the Cities report released earlier this year found that Chicago ranked No. 74 out of the 75 most populous U.S. cities with a Taxpayer Burden of
-$36,000, which is each taxpayer’s share of municipal debt. Only New York City fared worse with a Taxpayer Burden of -$64,100.
However, when you combine the debt of these underlying government entities, the county, the city, and the state, Chicago’s Taxpayer Burden skyrockets to -$119,110, while New York City’s Taxpayer Burden rises to -$85,600.
As a result, the City of Chicago is in significantly worse financial shape than it might first appear, and its taxpayers face the highest Taxpayer Burden in the country.
Collectively, taxpayers in these 10 cities face an average combined per-taxpayer burden of nearly $50,000, including county, state, and “off-balance-sheet” city government entities. This compares to a per-taxpayer position of $19,000 for their city government alone.
Here is a ranking of the combined Taxpayer Burden for taxpayers living in the 10 largest cities (from best to worst):
1. Phoenix (-$13,290)2. San Antonio (-$16,660)3. Houston (-$22,940)4. Dallas (-$33,490)5. San Diego (-$35,410)6. San Jose (-$43,120)7. Philadelphia (-$50,120)8. Los Angeles (-$56,390)9. New York City (-$85,600)10. Chicago (-$119,110)
City Combined Taxpayer Burden™ Report: Including Underlying Government Units
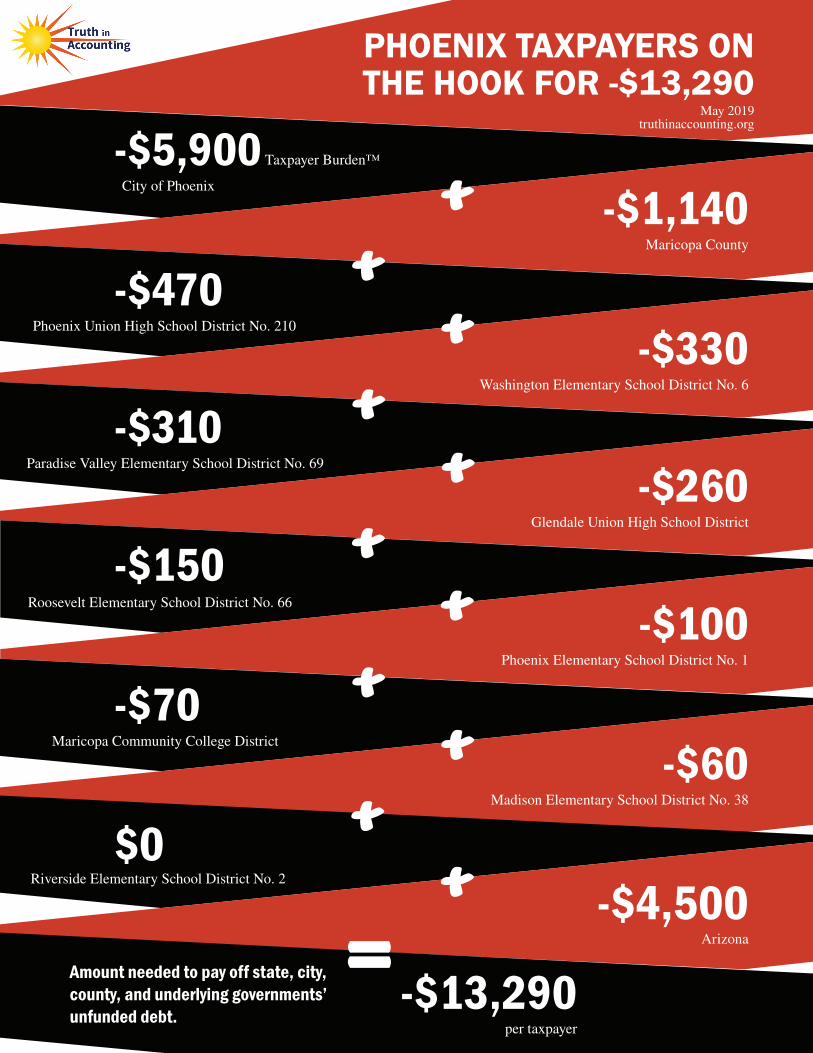
PHOENIX TAXPAYERS ON THE HOOK FOR -$13,290
May 2019truthinaccounting.org
-$5,900City of Phoenix
-$470Phoenix Union High School District No. 210
-$310Paradise Valley Elementary School District No. 69
-$150Roosevelt Elementary School District No. 66
-$70Maricopa Community College District
$0Riverside Elementary School District No. 2
-$1,140Maricopa County
-$330Washington Elementary School District No. 6
-$260Glendale Union High School District
-$100Phoenix Elementary School District No. 1
-$60Madison Elementary School District No. 38
-$4,500Arizona
-$13,290per taxpayer
Amount needed to pay off state, city, county, and underlying governments’unfunded debt.
Taxpayer Burden™

FAST FACTS• Phoenix has a Taxpayer Burden of -$5,900, which is each taxpayer’s share of the city’s debt.
• Phoenix taxpayers also pay taxes to the county and the city’s underlying government units. If these debts are included, each taxpayer’s burden is -$8,790.
• When state debt is combined with this debt, each taxpayer has a burden of -$13,290.
Phoenix’s Combined Taxpayer Burden
Truth in Accounting is committed to educating and empowering citizens with understandable, reliable, and transparent government financial information. To be knowledgeable participants in their government and its budget process, citizens need truthful and transparent financial information.
Government Unit Assets available to pay bills*
Less BillsMoney available (needed) to pay
billsTaxpayer Surplus
(Burden)
GradeUnfunded pension benefits
dueUnfunded OPEB Other bills **
Phoenix $3.8 billion $4.5 billion $185.5 million $1.8 billion ($2.7 billion) ($5,900) D
Maricopa County $957.0 million $2.0 billion ($6.3 million) $360.3 million ($1.4 billion) ($1,140) C
Phoenix Union High School
District No. 210$208.5 million
$271.4 million $57.8 million
$92.3 million ($213.0 million)
($470) C
Washington Elementary School
District No. 6$119.2 million
$183.6 million ($200,000) $83.3 million ($147.5 million) ($330) C
Paradise Valley Elementary School
District No. 69$207.7 million
$240.3 million $12.9 million $95.5 million ($141.0 million) ($310) C
Glendale Union High School
District$79.8 million $127.1 million $22.2 million $45.8 million ($115.3 million) ($260) C
Roosevelt Elementary School
District No. 66 $33.4 million $77.7 million ($100,000) $24.5 million ($68.7 million) ($150) C
Phoenix Elementary School District
No. 1$35.4 million $66.3 million $700,000 $14.5 million ($46.1 million) ($100) C
Maricopa Community College
District$669.4 million
$571.8 million
($700,000) $182.4 million ($84.1 million)
($70) C
Madison Elementary School
District No. 38$77.2 million $41.8 million $800,000 $59.6 million ($24.9 million) ($60) C
Riverside Elementary School
District No. 2$13.5 million $7.2 million
$0 $5.7 million $600,000 $0 C
Arizona $9.8 billion $7.6 billion $1.2 billion $9.8 billion ($8.8 billion) ($4,500) C
* Does not include capital assets or restricted assets** Does not include debt related to capital assets
($13,290)

SAN ANTONIO TAXPAYERS ON THE HOOK FOR -$16,660
May 2019truthinaccounting.org
-$3,200City of San Antonio
-$630North East Independent School District (ISD)
-$270Northside ISD
-$140VIA Metropolitan Transit
-$100South San Antonio ISD
-$10,100Texas
-$1,430Bexar County
-$340San Antonio ISD
-$240Alamo Community College District
-$130Harlandale ISD
-$80Edgewood ISD
-$16,660per taxpayer
Amount needed to pay off state, city, county, and underlying governments’unfunded debt.
Taxpayer Burden™

FAST FACTS• San Antonio has a Taxpayer Burden of -$3,200, which is each taxpayer’s share of the city’s debt.
• San Antonio taxpayers also pay taxes to the county and the city’s underlying government units. If these debts are included, each taxpayer’s burden is -$6,560.
• When state debt is combined with this debt, each taxpayer has a burden of -$16,660.
San Antonio’s Combined Taxpayer Burden
Truth in Accounting is committed to educating and empowering citizens with understandable, reliable, and transparent government financial information. To be knowledgeable participants in their government and its budget process, citizens need truthful and transparent financial information.
* Does not include capital assets or restricted assets** Does not include debt related to capital assets
Government Unit
Assets available to pay bills*
Less BillsMoney
available (needed) to pay
bills
Taxpayer Surplus
(Burden) GradeUnfunded pension
benefits due
Unfunded OPEB
Other bills **
San Antonio $4.5 billion $1.6 billion $1.0 billion $3.3 billion ($1.4 billion) ($3,200) C
Bexar County $2.1 billion $332.7 million $191.8 million $2.4 billion ($784.7 million) ($1,430) C
North East ISD $274.0 million $119.4 million $219.6 million $198.2 million ($263.3 million) ($630) C
San Antonio ISD
$246.3 million $86.1 million $204.9 million $98.3 million ($143.0 million) ($340) C
Northside ISD $683.7 million $202.5 million $333.4 million $261.6 million ($113.8 million) ($270) C
Alamo Community
College District$212.8 million $54.7 million $158.4 million $134.0 million ($134.2 million) ($240) C
VIA Metropolitan
Transit$197.2 million $144.9 million $22.1 million $88.0 million ($57.8 million) ($140) C
Harlandale ISD $130.5 million $35.3 million $57.6 million $91.2 million ($53.7 million) ($130) C
South San Antonio ISD
$40.6 million $20.0 million $35.2 million $27.2 million ($41.8 million) ($100) C
Edgewood ISD $57.1 million $27.6 million $45.9 million $18.4 million ($34.7 million) ($80) C
Texas $76.1 billion $45.0 billion $65.5 billion $47.8 billion ($82.2 billion) ($10,100) D
($16,660)

-$750Harris County
-$320
Alief ISD-$140
$230
Houston Independent School District (ISD)
Port of Houston Authority of Harris County
-$11,300City of Houston
-$390
Metropolitan Transit Authorityof Harris County (METRO)
-$150Spring Branch ISD
-$20
-$10,100
Houston Community College
Texas
-$22,940per taxpayer
HOUSTON TAXPAYERS ON THE HOOK FOR -$22,940
May 2019truthinaccounting.org
Amount needed to pay off state, city, county, and underlying governments’unfunded debt.
Taxpayer Burden™
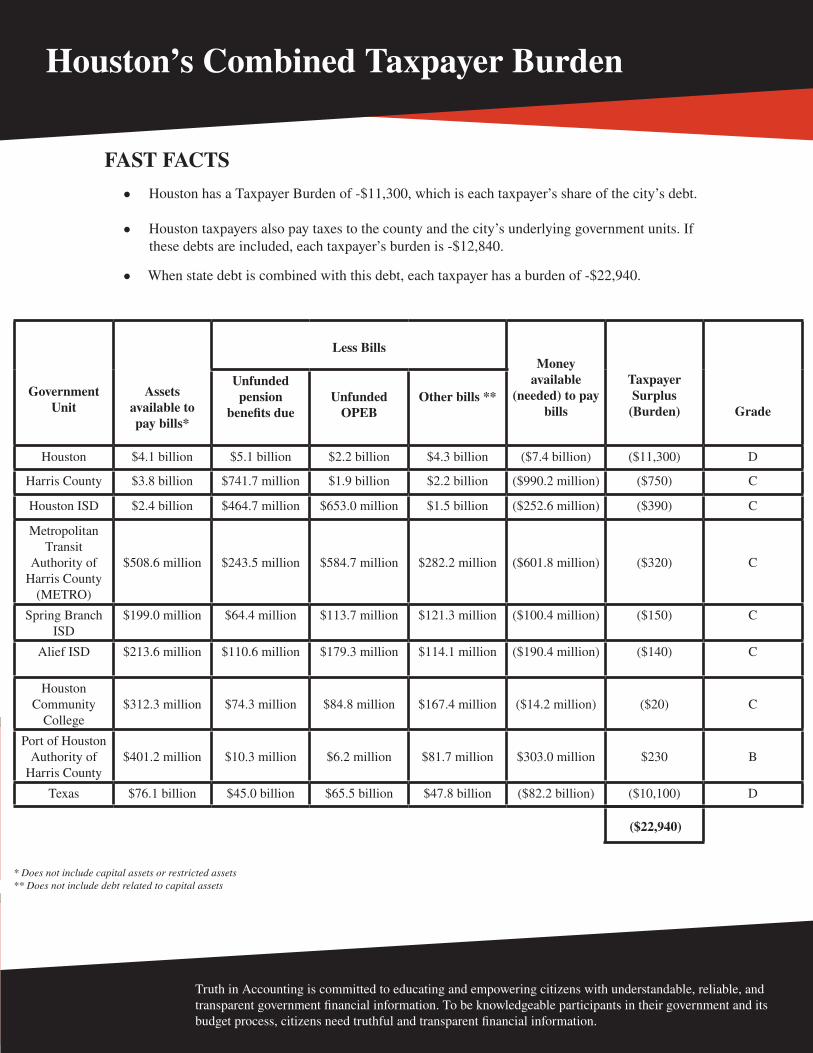
FAST FACTS• Houston has a Taxpayer Burden of -$11,300, which is each taxpayer’s share of the city’s debt.
• Houston taxpayers also pay taxes to the county and the city’s underlying government units. If these debts are included, each taxpayer’s burden is -$12,840.
• When state debt is combined with this debt, each taxpayer has a burden of -$22,940.
Houston’s Combined Taxpayer Burden
Truth in Accounting is committed to educating and empowering citizens with understandable, reliable, and transparent government financial information. To be knowledgeable participants in their government and its budget process, citizens need truthful and transparent financial information.
Government Unit
Assets available to pay bills*
Less BillsMoney
available (needed) to pay
bills
Taxpayer Surplus
(Burden) Grade
Unfunded pension
benefits dueUnfunded
OPEBOther bills **
Houston $4.1 billion $5.1 billion $2.2 billion $4.3 billion ($7.4 billion) ($11,300) D
Harris County $3.8 billion $741.7 million $1.9 billion $2.2 billion ($990.2 million) ($750) C
Houston ISD $2.4 billion $464.7 million $653.0 million $1.5 billion ($252.6 million) ($390) C
Metropolitan Transit
Authority of Harris County
(METRO)
$508.6 million $243.5 million $584.7 million $282.2 million ($601.8 million) ($320) C
Spring Branch ISD
$199.0 million $64.4 million $113.7 million $121.3 million ($100.4 million) ($150) C
Alief ISD $213.6 million $110.6 million $179.3 million $114.1 million ($190.4 million) ($140) C
Houston Community
College$312.3 million $74.3 million
$84.8 million $167.4 million ($14.2 million) ($20) C
Port of Houston Authority of
Harris County$401.2 million $10.3 million $6.2 million $81.7 million $303.0 million $230 B
Texas $76.1 billion $45.0 billion $65.5 billion $47.8 billion ($82.2 billion) ($10,100) D
* Does not include capital assets or restricted assets** Does not include debt related to capital assets
($22,940)
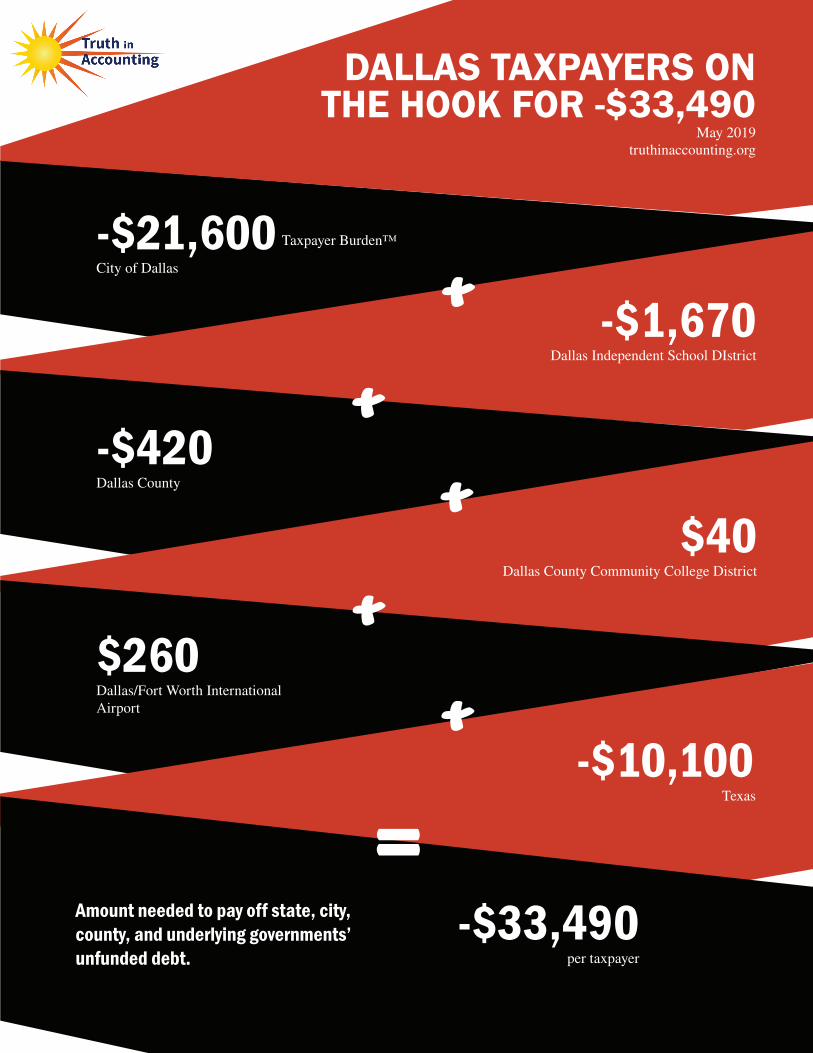
-$1,670Dallas Independent School DIstrict
$40Dallas County Community College District
-$10,100Texas
-$21,600City of Dallas
-$420Dallas County
$260Dallas/Fort Worth International Airport
DALLAS TAXPAYERS ON THE HOOK FOR -$33,490
May 2019truthinaccounting.org
-$33,490per taxpayer
Amount needed to pay off state, city, county, and underlying governments’ unfunded debt.
Taxpayer Burden™

FAST FACTS• Dallas has a Taxpayer Burden of -$21,600, which is each taxpayer’s share of the city’s debt.
• Dallas taxpayers also pay taxes to the county and the city’s underlying government units. If these debts are included, each taxpayer’s burden is -$23,390.
• When state debt is combined with this debt, each taxpayer has a burden of -$33,490.
Dallas’ Combined Taxpayer Burden
Truth in Accounting is committed to educating and empowering citizens with understandable, reliable, and transparent government financial information. To be knowledgeable participants in their government and its budget process, citizens need truthful and transparent financial information.
Government Unit
Assets available to pay bills*
Less BillsMoney
available (needed) to pay
bills
Taxpayer Surplus
(Burden) Grade
Unfunded pension
benefits dueUnfunded
OPEBOther bills **
Dallas $2.2 billion $7.3 billion $499.9 million $2.3 billion ($7.8 billion) ($21,600) F
Dallas Independent
School District$1.5 billion
$371.2 million $629.3 million $1.1 billion ($603.7 million) ($1,670)
C
Dallas County $1.8 billion $652.8 million $300.7 million $1.1 billion ($311.9 million) ($420) C
Dallas County Community
College District $436.0 million $64.0 million $204.3 million $134.6 million $33.1 million $40 B
Dallas/Fort Worth
International Airport
$1.9 billion $176.0 million $6.2 million $1.2 billion $547.1 million $260 B
Texas $76.1 billion $45.0 billion $65.5 billion $47.8 billion ($82.2 billion) ($10,100) D
* Does not include capital assets or restricted assets** Does not include debt related to capital assets
($33,490)

-$2,190San Diego County
-$870Poway Unified School District
-$110San Ysidro School District
$180San Diego County Water Authority
-$5,000City of San Diego
-$4,590San Diego Unified School District
-$730
San Diego Metropolitan Transit District
-$100
San Diego Community College District
-$22,000California
-$35,410per taxpayer
SAN DIEGO TAXPAYERS ON THE HOOK FOR -$35,410
May 2019truthinaccounting.org
Amount needed to pay off state, city, county, and underlying governments’ unfunded debt.
Taxpayer Burden™

FAST FACTS• San Diego has a Taxpayer Burden of -$5,000, which is each taxpayer’s share of the city’s debt.
• San Diego taxpayers also pay taxes to the county and the city’s underlying government units. If these debts are included, each taxpayer’s burden is -$13,410.
• When state debt is combined with this debt, each taxpayer has a burden of -$35,410.
San Diego’s Combined Taxpayer Burden
Truth in Accounting is committed to educating and empowering citizens with understandable, reliable, and transparent government financial information. To be knowledgeable participants in their government and its budget process, citizens need truthful and transparent financial information.
Government Unit
Assets available to pay bills*
Less BillsMoney
available (needed) to
pay bills
Taxpayer Surplus
(Burden) Grade
Unfunded pension
benefits dueUnfunded OPEB Other bills **
San Diego $2.2 billion $2.5 billion $553.9 million $1.4 billion ($2.2 billion) ($5,000) D
San Diego Unified School
District$779.8 million $1.5 billion $179.9 million $1.1 billion ($2.1 billion) ($4,590) C
San Diego County
$3.4 billion $3.4 billion $132.2 million $2.2 billion ($2.3 billion) ($2,190) C
Poway Unified School District
$100.7 million $384.2 million $73.3 million $33.6 million ($390.5 million)
($870) C
San Diego Community
College District$292.1 million $332.6 million $14.3 million $273.9 million ($328.6
million)($730) C
San Ysidro School District
$36.5 million $54.4 million $6.9 million $24.5 million ($49.4 million) ($110) C
San Diego Metropolitan
Transit District$208.3 million $181.3 million $45.4 million $89.2 million ($107.6
million)($100) C
San Diego County Water
Authority$458.4 million $70.1 million ($800,000) $197.3 million $191.7 million $180 B
California $100.1 billion $102.5 billion $107.0 billion $160.4 billion ($269.9 billion) ($22,000) F
* Does not include capital assets or restricted assets** Does not include debt related to capital assets
($35,410)

SAN JOSE TAXPAYERS ON THE HOOK FOR -$43,120
May 2019truthinaccounting.org
-$10,200City of San Jose
-$960East Side Union High School District
-$480San Jose-Evergreen Community College District
-$370Alum Rock Union School District
-$260Franklin-McKinley School District
$20Santa Clara Valley Transportation Authority
-$7,110Santa Clara County
-$870San Jose Unified School District
-$410Evergreen School District
-$350Oak Grove School District
-$130Moreland School District
-$22,000California
-$43,120per taxpayer
Amount needed to pay off state, city, county, and underlying governments’unfunded debt.
Taxpayer Burden™

FAST FACTS• San Jose has a Taxpayer Burden of -$10,200, which is each taxpayer’s share of the city’s debt.
• San Jose taxpayers also pay taxes to the county and city’s underlying government units. If these debts are included, each taxpayer’s burden is -$21,120.
• When state debt is combined with this debt, each taxpayer has a burden of -$43,120.
San Jose’s Combined Taxpayer Burden
Truth in Accounting is committed to educating and empowering citizens with understandable, reliable, and transparent government financial information. To be knowledgeable participants in their government and its budget process, citizens need truthful and transparent financial information.
* Does not include capital assets or restricted assets** Does not include debt related to capital assets
Government Unit
Assets available to pay bills*
Less Bills
Money available (needed) to pay
bills
Taxpayer Surplus
(Burden) Grade
Unfunded pension benefits
dueUnfunded OPEB Other bills **
San Jose $1.6 billion $3.2 billion $1.1 billion $783.2 million ($3.4 billion) ($10,200) D
Santa Clara County
$4.0 billion $4.1 billion $1.3 billion $2.9 billion ($4.4 billion) ($7,110) D
East Side Union High School
District$332.1 million $278.7 million $40.0 million $333.7 million ($320.2 million) ($960) C
San Jose Unified School District $187.0 million $341.4 million $4.3 million
$132.2 million ($290.9 million) ($870) C
San Jose-Evergreen
Community College District
$124.9 million $117.2 million ($10.6 million) $177.4 million ($159.1 million) ($480) C
Evergreen School District $58.0 million $121.0 million $38.1 million $35.8 million ($137.0 million) ($410) C
Alum Rock Union School District $69.6 million $137.3 million $0 $54.6 million ($122.4 million) ($370) C
Oak Grove School District $75.5 million $119.2 million $22.9 million $49.7 million ($116.4 million) ($350) C
Franklin-McKinley School
District$59.4 million $101.7 million $600,000 $45.2 million ($88.1 million) ($260) C
Moreland School District $41.0 million $59.2 million $5.2 million $20.1 million ($43.3 million) ($130) C
Santa Clara Valley
Transportation Authority
$618.3 million $291.9 million ($58.0 million) $372.6 million $11.8 million $20 B
California $100.1 billion $102.5 billion $107.0 billion $160.4 billion ($269.9 billion) ($22,000) F
($43,120)

-$4,220Southeastern Pennsylvania Transportation Authority
(SEPTA)
-$18,800Pennsylvania
-$27,900City of Philadelphia
$800Philadelphia Housing Authority
-$50,120per taxpayer
PHILADELPHIA TAXPAYERS ON THE HOOK FOR -$50,120
May 2019truthinaccounting.org
Amount needed to pay off state, city, county, and underlying governments’unfunded debt.
Taxpayer Burden™

FAST FACTS• Philadelphia has a Taxpayer Burden of -$27,900, which is each taxpayer’s share of the city’s
debt.
• Philadelphia taxpayers also pay taxes to the city’s underlying government units. If these debts are included, each taxpayer’s burden is -$31,320.
• When state debt is combined with this debt, each taxpayer has a burden of -$50,120.
Philadelphia’s Combined Taxpayer Burden
Truth in Accounting is committed to educating and empowering citizens with understandable, reliable, and transparent government financial information. To be knowledgeable participants in their government and its budget process, citizens need truthful and transparent financial information.
Government Unit
Assets available to pay bills*
Less BillsMoney
available (needed) to pay
bills
Taxpayer Surplus
(Burden) Grade
Unfunded pension
benefits dueUnfunded
OPEBOther bills **
Philadelphia $5.1 billion $10.0 billion $2.6 billion $7.4 billion ($15.0 billion) ($27,900) F
Southeastern Pennsylvania
Transportation Authority (SEPTA)
$685.2 million $951.7 million $1.2 billion $797.7 million ($2.3 billion) ($4,220) C
Philadelphia Housing
Authority$639.0 million $78.9 million $0 $129.4 million $430.6 million $800 B
Pennsylvania $38.0 billion $42.8 billion $29.8 billion $47.5 billion ($82.1 billion) (18,800) D
* Does not include capital assets or restricted assets** Does not include debt related to capital assets
($50,120)

-$15,500Los Angeles Unified School District
-$1,080Los Angeles Community College District
$0Metropolitan Water District of Southern California
-$6,000City of Los Angeles
-$11,350Los Angeles County
-$460LA County Metropolitan Transportation Au-thority (LACMTA/Metra)
-$22,000California
-$56,390per taxpayer
LOS ANGELES TAXPAYERS ON THE HOOK FOR -$56,390
May 2019truthinaccounting.org
Amount needed to pay off state, city, county, and underlying governments’ unfunded debt.
Taxpayer Burden™

FAST FACTS• Los Angeles has a Taxpayer Burden of -$6,000, which is each taxpayer’s share of the city’s debt.
• Los Angeles taxpayers also pay taxes to the county and the city’s underlying government units. If these debts are included, each taxpayer’s burden is -$34,390.
• When state debt is combined with this debt, each taxpayer has a burden of -$56,390.
Los Angeles’ Combined Taxpayer Burden
Truth in Accounting is committed to educating and empowering citizens with understandable, reliable, and transparent government financial information. To be knowledgeable participants in their government and its budget process, citizens need truthful and transparent financial information.
Government Unit
Assets available to pay bills*
Less BillsMoney
available (needed) to pay
bills
Taxpayer Surplus
(Burden)Grade
Unfunded pension
benefits dueUnfunded
OPEBOther bills **
Los Angeles $12.7 billion $8.4 billion $2.7 billion $9.2 billion ($7.7 billion) ($6,000) D
Los Angeles Unified School
District$5.1 billion $7.0 billion $15.0 billion $3.1 billion ($19.9 billion) ($15,500)
D
Los Angeles County
$9.8 billion $10.8 billion $26.3 billion $9.8 billion ($37.1 billion) ($11,350) D
Los Angeles Community
College District$619.9 million $744.7 million $591.8 million $677.4 million ($1.4 billion) ($1,080) C
LA County Metropolitan
Transportation Authority
(LACMTA/Metra)
$1.9 billion $572.6 million $1.3 billion $1.5 billion ($1.5 billion) ($460) C
Metropolitan Water District of Southern California
$1.5 billion $660.9 million $240.6 million $622.8 million ($29.3 million) $0 C
California $100.1 billion $102.5 billion $107.0 billion $160.4 billion ($269.9 billion) ($22,000) F
* Does not include capital assets or restricted assets** Does not include debt related to capital assets
($56,390)

-$21,500New York
-$64,100New York City
-$85,600per taxpayer
NEW YORK TAXPAYERS ON THE HOOK FOR -$85,600
May 2019truthinaccounting.org
Amount needed to pay off state, city, county, and underlying governments’ unfunded debt.
Taxpayer Burden™

FAST FACTS• New York City has a Taxpayer Burden of -$64,100, which is each taxpayer’s share of the city’s
debt.
• Unlike other cities, New York City’s underlying government units are already included in the city’s annual financial report.
• When state debt is added to city debt, each taxpayer has a burden of -$85,600.
New York’s Combined Taxpayer Burden
Truth in Accounting is committed to educating and empowering citizens with understandable, reliable, and transparent government financial information. To be knowledgeable participants in their government and its budget process, citizens need truthful and transparent financial information.
Government Unit
Assets available to pay bills*
Less Bills
Money available
(needed) to pay bills
Taxpayer Surplus
(Burden) Grade
Unfunded pension
benefits dueUnfunded
OPEB Other bills **
New York City $58.5 billion $60.4 billion $96.0 billion $87.7 billion ($185.5 billion) ($64,100) F
New York $135.0 billion $15.5 billion $110.7 billion $151.8 billion ($143.0 billion) ($21,500) F
* Does not include capital assets or restricted assets** Does not include debt related to capital assets
($85,600)

-$17,690Chicago Public Schools
-$3,690Chicago Transit Authority
-$560Metro Water Reclamation District
of Greater Chicago
$820Chicago Housing Authority
-$36,000City of Chicago
-$9,890Cook County
-$1,190Chicago Park District
-$110Chicago Community College District
-$50,800Illinois
-$119,110per taxpayer
CHICAGO TAXPAYERS ON THE HOOK FOR -$119,110
May 2019truthinaccounting.org
Amount needed to pay off state, city, county, and underlying governments’ unfunded debt.
Taxpayer Burden™

FAST FACTS• Chicago has a Taxpayer Burden of -$36,000, which is each taxpayer’s share of the city’s debt.
• Chicago taxpayers also pay taxes to the county and the city’s underlying government units. If these debts are included, each taxpayer’s burden is -$68,310.
• When state debt is combined with this debt, each taxpayer has a burden of -$119,110.
Chicago’s Combined Taxpayer Burden
Truth in Accounting is committed to educating and empowering citizens with understandable, reliable, and transparent government financial information. To be knowledgeable participants in their government and its budget process, citizens need truthful and transparent financial information.
* Does not include capital assets or restricted assets** Does not include debt related to capital assets
Government Unit
Assets available to pay bills*
Less BillsMoney
available (needed) to
pay bills
Taxpayer Surplus
(Burden) Grade
Unfunded pension
benefits dueUnfunded
OPEBOther bills **
Chicago $9.5 billion $28.0 billion $842.9 million $13.1 billion ($32.5 billion) ($36,000) F
Chicago Public Schools
$2.8 billion $12.4 billion $2.2 billion $4.2 billion ($16.0 billion) ($17,690) D
Cook County $2.1 billion $14.4 billion $2.0 billion $2.9 billion ($17.2 billion) ($9,890) D
Chicago Transit Authority
$1.3 billion $1.7 billion ($151 million) $3.1 billion ($3.3 billion) ($3,690) C
Chicago Park District $510.7 million $1.2 billion $37.1 million $320.1 million ($1.1 billion) ($1,190) C
Metro Water Reclamation
District of Greater Chicago
$704.8 million $985.1 million $113.5 million $580.2 million ($974.1 million)
($560) C
Chicago Community
College District$172.1 million $0 $123.7 million $150.5 million ($102.0
million)($110) C
Chicago Housing
Authority$925.9 million ($5.9 million) $0 $188.7 million $743.1 million $820 B
Illinois $28.8 billion $134.4 billion $52.5 billion $58.0 billion ($216.1 billion) ($50,800) F
($119,110)