taxes are an assumption too! how taxes are handled… phillip knotts, director of training...
TRANSCRIPT

Taxes Are An Assumption Too!
How taxes are handled…
Phillip Knotts, Director of TrainingWEALTHCARE CAPITAL MANAGEMENT
May 10th, 2004

®
© WEALTHCARE CAPITAL MANAGEMENT, A Division of Financeware, Inc. 1999-2004 – All Rights Reserved PAGE 2
The process of creating financial advice involves many factors…
Including:»The impact of including investment risk in our projections»How the math works»The new set of premises around which we have created the Wealthcare process»Concentration risk to the portfolio »Tax and allocation efficiency risk »Converting goals and resources into cash flows»Capital Market Assumptions – modeling what we intend»Implementation Risk – implementing what we modelled
Today we will cover everyone’s favorite topic… TAXES!

®
© WEALTHCARE CAPITAL MANAGEMENT, A Division of Financeware, Inc. 1999-2004 – All Rights Reserved PAGE 3
When applying these factors to financial advising…there are things that we “know” and things we must “assume”
For example:»We “know” portfolios will not produce the same return each year»We “know” that the timing of deposits/withdrawals and returns impact results»We “know” people would prefer to avoid risk if possible»We “know” people are more comfortable having some level of certainty»We “know” investors would prefer to save as little as possible, spend as much as possible, be financially independent as soon as possible, take as little risk as possible, etc.
The things we “know” result in new premises for a new advisory process
But there are also things we have to “assume”
Like the nature of what might be expected from Capital Markets And, the impact of taxation….

®
© WEALTHCARE CAPITAL MANAGEMENT, A Division of Financeware, Inc. 1999-2004 – All Rights Reserved PAGE 4
What do we “KNOW” about taxes?
We “know”:»Current tax rates that will be applied this tax year»Tax rates in the future will be different
»We don’t know for sure when they will change»Or what future rates or rules will be»All we know is that the future of taxes is uncertain
»We also know people prefer to avoid them»And therefore will tactically and strategically avoid or defer taxes when possible
»The greatest impact of tax efficiency is at the upper end of the potential results»Having little material impact at the lower end where we measure confidence
»We also know whatever we project will be wrong because of uncertainty

®
© WEALTHCARE CAPITAL MANAGEMENT, A Division of Financeware, Inc. 1999-2004 – All Rights Reserved PAGE 5
What do we know about UNCERTAINTY?
There is a wide range of potential results
Results based on the average are far different than confident results
Being TOO AGGRESSIVE in assumptions (i.e. zero volatility, median result) will set us (and clients) up for disappointment
Being TOO CONSERVATIVE compromises the only life the client has
ALSO, with the UNCERTAINTY of results»And the resulting wide range of potential outcomes»At reasonably high confidence levels»What might appear to be material and precise assuming PRECISE (identical) returns
»BECOMES IMMATERIAL WITH LITTLE PRECISION

®
© WEALTHCARE CAPITAL MANAGEMENT, A Division of Financeware, Inc. 1999-2004 – All Rights Reserved PAGE 6
So, in dealing with taxes, what should we ASSUME?
Behavior and preference of investors:»Avoid taxes»Defer taxes»Maintain lifestyle (don’t alter lifestyle to fund taxes)
Uncertainty of markets:»Each simulation (or trial) will have completely different tax impact»This is much different than if we assume the same return each year»Let’s look at an example

®
© WEALTHCARE CAPITAL MANAGEMENT, A Division of Financeware, Inc. 1999-2004 – All Rights Reserved PAGE 7
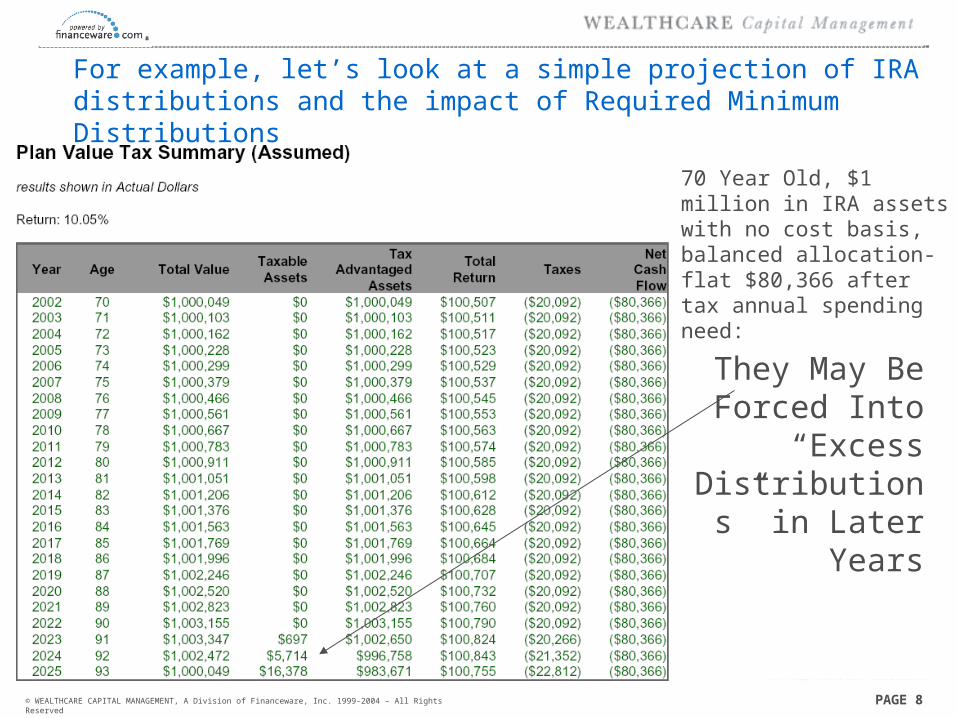
For example, let’s look at a simple projection of IRA distributions and the impact of Required Minimum Distributions
70 Year Old, $1 million in IRA assets with no cost basis, balanced allocation- flat $80,366 after tax annual spending need:
Notice How CERTAIN Taxes
Look
And Returns Appear
®
© WEALTHCARE CAPITAL MANAGEMENT, A Division of Financeware, Inc. 1999-2004 – All Rights Reserved PAGE 8
For example, let’s look at a simple projection of IRA distributions and the impact of Required Minimum Distributions
70 Year Old, $1 million in IRA assets with no cost basis, balanced allocation- flat $80,366 after tax annual spending need:
They May Be Forced Into
“Excess Distributions” in
Later Years
®
© WEALTHCARE CAPITAL MANAGEMENT, A Division of Financeware, Inc. 1999-2004 – All Rights Reserved PAGE 9
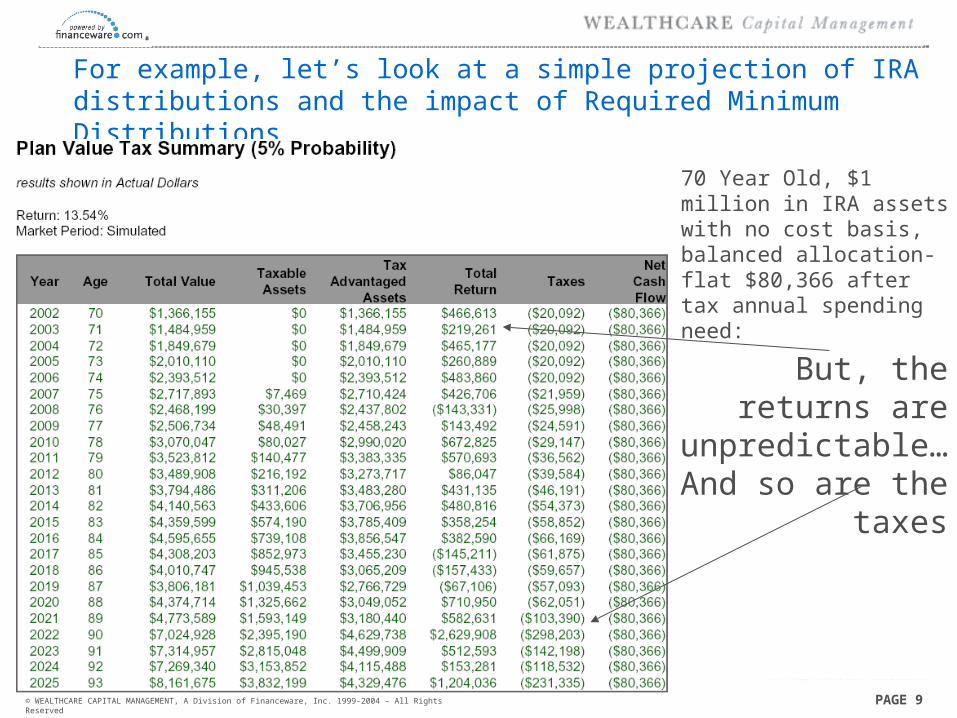
For example, let’s look at a simple projection of IRA distributions and the impact of Required Minimum Distributions
70 Year Old, $1 million in IRA assets with no cost basis, balanced allocation- flat $80,366 after tax annual spending need:
But, the returns are unpredictable… And so are the
taxes

®
© WEALTHCARE CAPITAL MANAGEMENT, A Division of Financeware, Inc. 1999-2004 – All Rights Reserved PAGE 10
For example, let’s look at a simple projection of IRA distributions and the impact of Required Minimum Distributions
70 Year Old, $1 million in IRA assets with no cost basis, balanced allocation- flat $80,366 after tax annual spending need:
Or the taxes could be similar… with
unpredictable returns…
But the ending value could change
®
© WEALTHCARE CAPITAL MANAGEMENT, A Division of Financeware, Inc. 1999-2004 – All Rights Reserved PAGE 11
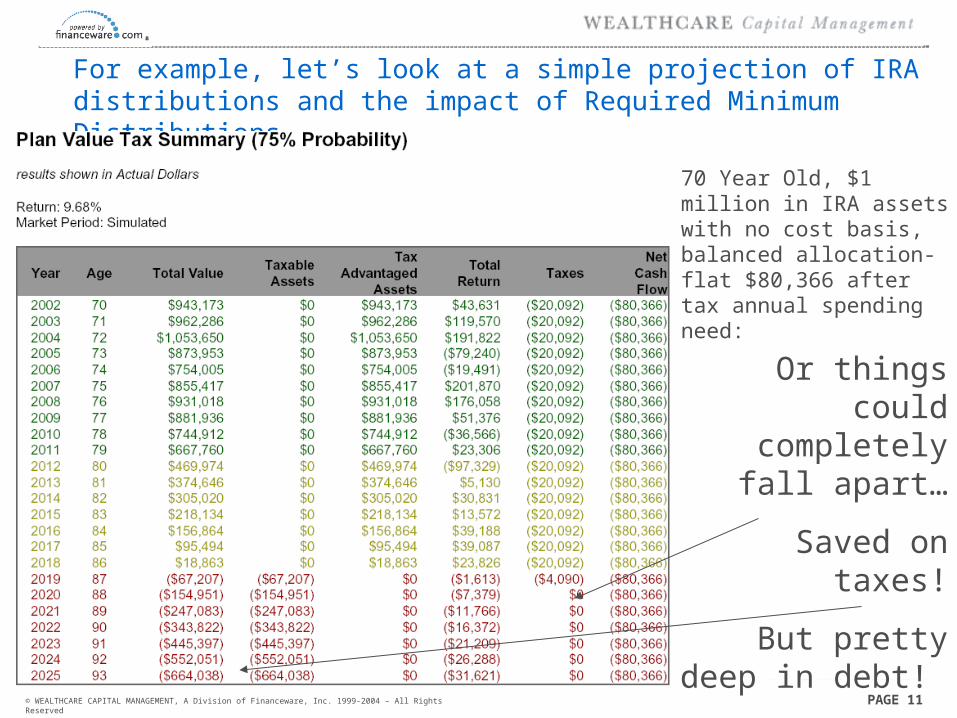
For example, let’s look at a simple projection of IRA distributions and the impact of Required Minimum Distributions
70 Year Old, $1 million in IRA assets with no cost basis, balanced allocation- flat $80,366 after tax annual spending need:
Or things could completely fall
apart…
Saved on taxes!
But pretty deep in debt!

®
© WEALTHCARE CAPITAL MANAGEMENT, A Division of Financeware, Inc. 1999-2004 – All Rights Reserved PAGE 12
Of course, each of these widely different results were based on the SAME tax assumption…
CURRENT TAX RATES & RULES*!
But remember where the impact had…»IMPACT!»When returns were really GREAT…Top 5% result, 13.54% Return - $8.1 Million»Or when the timing of results HURT…75%-tile, 9.68% Return – Broke @ 87»But Taxes were about the same…
»Assuming 10.05% with no volatility - $1 million ending value»Or, FORTUNATE timing of a terrible 6.7% return - $338,000 ending value
Because results are unpredictable, and rates are unpredictable, and rules are unpredictable…false precision here can be a folly.
Let’s revisit our 70 year old with $1 Million in their IRA, and compare results between:
Florida – 0% Income Taxes, Virginia – 5.75%, & California 9.30%
*Marginal rates are updated based on Jobs and Growth Tax Relief Reconciliation Act of 2003 (JGTRRA). Dividends and long term capital gains are taxed based on post sunset rules.

®
© WEALTHCARE CAPITAL MANAGEMENT, A Division of Financeware, Inc. 1999-2004 – All Rights Reserved PAGE 13
Comparison of 9.3% Spread in State Income Taxes
Considering how uncertain the rates and rules are…The differences still are not very material…Even at the upper tail….
At the assumed return the difference appeared more materialFlorida: $1,350,000CA: $820,000Until we understood the range of possible outcomes

®
© WEALTHCARE CAPITAL MANAGEMENT, A Division of Financeware, Inc. 1999-2004 – All Rights Reserved PAGE 14
Comparison of 9.3% Spread in State Income Taxes
Of course, the comfort factor is too low with the higher withdrawal rate…
Very Little Difference in Comfort
But, with a $57,000 withdrawal, the results look like this

®
© WEALTHCARE CAPITAL MANAGEMENT, A Division of Financeware, Inc. 1999-2004 – All Rights Reserved PAGE 15
So…does that mean we are haphazard in our tax assumptions?
No…»Based on the premises of what might be material»The preference for investors to avoid/defer taxes»The fact that there are 1000 different scenarios to model»And the premise that investors will not compromise their goals to avoid taxes»We have pretty detailed assumptions»But, they have been designed around coping with multiple (1000 different) outcomes»Which means that we may have to change the things we focus on compared to when we were dealing with ONE outcome (fixed return assumptions)

®
© WEALTHCARE CAPITAL MANAGEMENT, A Division of Financeware, Inc. 1999-2004 – All Rights Reserved PAGE 16
For example, in our required minimum distribution example, with fixed returns, we assumed the investor would end up with about $1 million at age 93, forcing some excess distributions at age 91.
But in reality, we discovered they may be forced into distributions in excess of their need starting at age 75, and ending up with $8.1 Million ($3.8 million of which is in a taxable account)
Or, they could very well have run out of money (1 in 4 chance) before age 87
Traditionally, when we looked at only one result (fixed return), we might attempt to manage things like avoiding required minimum distributions by:
»Stopping tax advantaged contributions»Or increasing withdrawal amounts (to fund a gifting program for example)
While these “actions” appeared to make sense when these steps APPEARED to have CERTAIN benefit (i.e. when returns were “certain”)…
Uncertainty of the results changes our perspective because these actions may:»Lower confidence to unsatisfactory levels

®
© WEALTHCARE CAPITAL MANAGEMENT, A Division of Financeware, Inc. 1999-2004 – All Rights Reserved PAGE 17
So…What are the assumptions?
1. There are two “main” tax environments during an investor’s lifetime:
Pre-retirement: When one or both are working for substantial income (marginal tax rates MAY BE high…may not though, depending on scenario)
Post-retirement: When earned income is not substantial» The difference between these two is a judgment call» Controlled by “client” retirement age» Pre-retirement rates estimated on household earned income» Post-retirement rates estimated on RETIREMENT SPENDING NEED (will
explain more later)

®
© WEALTHCARE CAPITAL MANAGEMENT, A Division of Financeware, Inc. 1999-2004 – All Rights Reserved PAGE 18
So…What are the assumptions?
2. The system assumes:
Marginal rates for yield and short-term capital gains
Long-term capital gains rates for long-term gains
Effective tax rates on distributions in tax-deferred accounts in post-retirement
Marginal tax rates on distributions in tax-deferred accounts in pre-retirement
State tax rates based on the same pre & post retirement rules
Federal deductibility of state income taxes
Cost basis of positions in taxable accounts (100% turnover, 50% taxed long-term)
Non-taxable distributions from tax-deferred accounts for after-tax contributions
Effective tax rates for pensions, SSI and other sources of retirement income
Realized losses carried forward to off-set future gains
Bias toward continuing deferral
Unless RMD applies
3. While these are “global” assumptions…
Each trial will model completely different results

®
© WEALTHCARE CAPITAL MANAGEMENT, A Division of Financeware, Inc. 1999-2004 – All Rights Reserved PAGE 19
Let’s compare how these assumptions apply to the first five years of two different trials
59 Year old considering retirement, $400,000 in taxable investments, $1,000,000 in tax deferred, $100,000 withdrawal for first 10 years of retirement (includes travel budget), SSI starting at age 67, retirement need declining to $60,000 at age 70:
Trial # 288
Trial # 842
Taxes First 3 Years: $17,819 First 5 Years: $39,102
Taxes First 3 Years: $39,269 First 5 Years: $42,314
Big Difference in Ending
Value
And in the “timing” of
returns

®
© WEALTHCARE CAPITAL MANAGEMENT, A Division of Financeware, Inc. 1999-2004 – All Rights Reserved PAGE 20
Just two years later the results of these two trials look about the same…They have depleted their taxable assets and have $1.8 million in their IRAs
59 Year old considering retirement, $400,000 in taxable investments, $1,000,000 in tax deferred, $100,000 withdrawal for first 10 years of retirement (includes travel budget), SSI starting at age 67, retirement need declining to $60,000 at age 70:
Trial # 288
Trial # 842
Total taxes paid over 7 year differing by $4,449- albeit “timed” differently

®
© WEALTHCARE CAPITAL MANAGEMENT, A Division of Financeware, Inc. 1999-2004 – All Rights Reserved PAGE 21
The next seven years things change a lot…
59 Year old considering retirement, $400,000 in taxable investments, $1,000,000 in tax deferred, $100,000 withdrawal for first 10 years of retirement (includes travel budget), SSI starting at age 67, retirement need declining to $60,000 at age 70:
Trial # 288
Trial # 842
This portfolio
forced major
RMD…
and had DOUBLE the value

®
© WEALTHCARE CAPITAL MANAGEMENT, A Division of Financeware, Inc. 1999-2004 – All Rights Reserved PAGE 22
And by the end of the plan, things are really different…
59 Year old considering retirement, $400,000 in taxable investments, $1,000,000 in tax deferred, $100,000 withdrawal for first 10 years of retirement (includes travel budget), SSI starting at age 67, retirement need declining to $60,000 at age 70:
Trial # 288
Trial # 842
Ending Results:
16th %-tile
Ending Results:
72nd %-tile
And… look at the difference in Taxes… Maybe these aren’t “perfect” but, compared to $20,092 a year???

®
© WEALTHCARE CAPITAL MANAGEMENT, A Division of Financeware, Inc. 1999-2004 – All Rights Reserved PAGE 23
Did you notice how the “Net Cash Flow” changed over time?
59 Year old considering retirement, $400,000 in taxable investments, $1,000,000 in tax deferred, $100,000 withdrawal for first 10 years of retirement (includes travel budget), SSI starting at age 67, retirement need declining to $60,000 at age 70:
Trial # 288
It started with their $100,000 “Need”
Then declined when the client received SSI
Then declined again when spouse received SSI
Then declined again when travel stopped
Then INCREASED when client died and spouse only received survivor SSI

®
© WEALTHCARE CAPITAL MANAGEMENT, A Division of Financeware, Inc. 1999-2004 – All Rights Reserved PAGE 24
So, while looking at any one scenario we may make different decisions…
Imagine how difficult it would be to input those tax decisions ONE THOUSAND TIMES
Much more difficult than profiling the client!
Therefore, unless we want to set different tax rules for EACH TRIAL»We need to apply some simplifying assumptions
Remembering:»Rates and rules in the future are uncertain»What used to look material using certain (fixed) returns, is immaterial in the context of the vast uncertainty of investment returns»No matter how precise we get, we will be wrong»We are modeling a thousand different tax scenarios

®
© WEALTHCARE CAPITAL MANAGEMENT, A Division of Financeware, Inc. 1999-2004 – All Rights Reserved PAGE 25
Things like the order in which goals are paid from specific assets, that APPEARED to make a big difference assuming CERTAIN returns
Are going to be different in every trial based on the rules within the engine:» Goals are assumed to be paid for with a bias toward continuing tax deferral
1. Investment Income (bond yield & dividends)
2. Planned Taxable Savings/ or other sources of retirement income
3. Taxable Realized Gains (based on turnover)
4. Taxable Gains Forced To Be Realized (needed to meet goal)
5. Tax Deferred Accounts (plus ordinary income tax needed to meet net amount and net of after tax contributions)
6. Tax Exempt Accounts (Roth)
7. Loan (in debt)
8. Unless there was a required minimum distribution …the after tax amount will be used before any withdrawals happen to accounts.

®
© WEALTHCARE CAPITAL MANAGEMENT, A Division of Financeware, Inc. 1999-2004 – All Rights Reserved PAGE 26
Since these rules are applied to each trial
The things we model are different than traditional fixed return analysisFor example, say that a single cash flow (buy a retirement home for $200,000 10 years into retirement) with traditional analysis was assumed to come from some taxable portfolios
In our analysis, there will be:»Trials where the taxable assets were depleted so the money had to come from tax-deferred assets requiring a “gross up” to pay deferred taxes»Trials where there was forced RMD that provided a portion of the capital»Trials where prior results were so strong, that there was enough investment yield to fund the purchase»Trials that depleted the taxable assets the year this occurred»Trials where there wasn’t any money left to fund the purchase
When returns are assumed to be certain, we can “tell” the tool where to get the moneyWhen we understand that there is uncertainty, we need to make a simplifying assumptionOr enter one thousand choices

®
© WEALTHCARE CAPITAL MANAGEMENT, A Division of Financeware, Inc. 1999-2004 – All Rights Reserved PAGE 27
What about the rules for “pre” & “post” retirement?
In general, it makes sense to apply marginal rates to investment returns while the client still has significant earnings…agreed?
But, why base the effective and marginal rates on Retirement Income Need if they are retired?
First…we have to base it on something
Next…it does represent what will be needed on a regular, recurring basis
Next…most people have some tax deferred assets»Therefore, some trials will have forced RMD
Next…if there is an offsetting “retirement income source” it will probably be taxable (pension, SSI, deferred comp) so investment returns in excess of need will still be taxed at marginal rates
Next…it is rare that sources of retirement income will be in excess of need
Let’s see how this works….

®
© WEALTHCARE CAPITAL MANAGEMENT, A Division of Financeware, Inc. 1999-2004 – All Rights Reserved PAGE 28
One year, post retirement tax assumptions:
$57,000 “need” with offsetting source
Therefore no turnover needed to fund cash need
With 0% turnover assumptionTaxes equal 25% marginal rate on
investment yield

®
© WEALTHCARE CAPITAL MANAGEMENT, A Division of Financeware, Inc. 1999-2004 – All Rights Reserved PAGE 29
One year, post retirement tax assumptions:
$57,000 “need” with offsetting source- Only yield taxed
Without offsetting “source” some gains
were forced to be realized, increasing
taxes (in this case assuming $1 million
cost basis)With a cost basis of zero, gains were paid on the entire amount needed to fund withdrawal
These scenarios all assumed no turnover
®
© WEALTHCARE CAPITAL MANAGEMENT, A Division of Financeware, Inc. 1999-2004 – All Rights Reserved PAGE 30
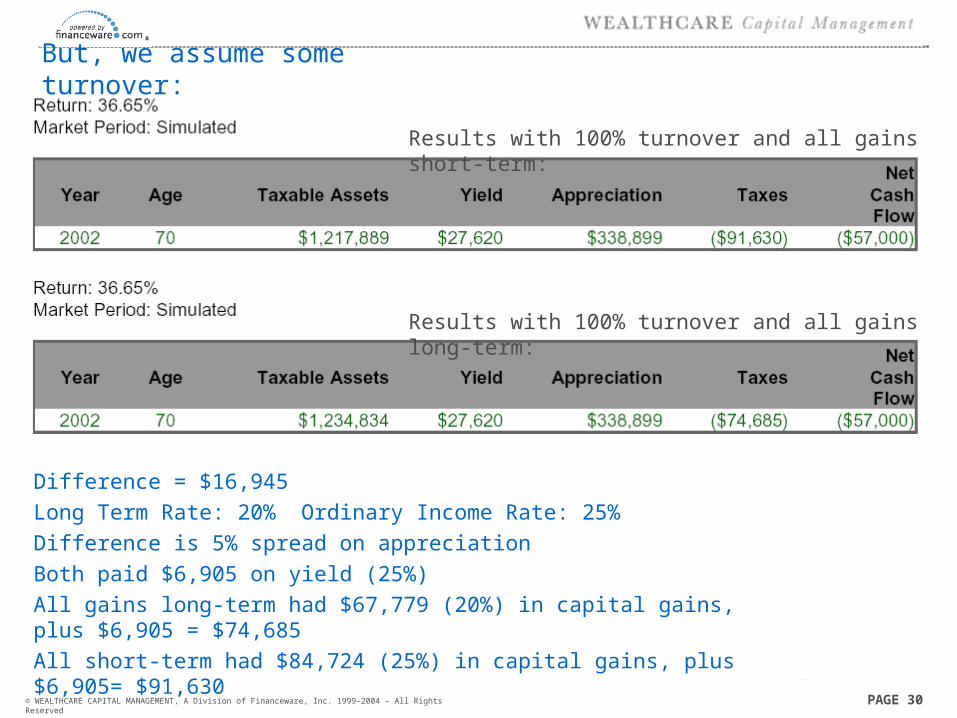
But, we assume some turnover:
Results with 100% turnover and all gains short-term:
Results with 100% turnover and all gains long-term:
Difference = $16,945
Long Term Rate: 20% Ordinary Income Rate: 25%
Difference is 5% spread on appreciation
Both paid $6,905 on yield (25%)
All gains long-term had $67,779 (20%) in capital gains, plus $6,905 = $74,685
All short-term had $84,724 (25%) in capital gains, plus $6,905= $91,630
®
© WEALTHCARE CAPITAL MANAGEMENT, A Division of Financeware, Inc. 1999-2004 – All Rights Reserved PAGE 31
In any year, we will be under & overestimating taxes
Probably not as far off though as when we assumed identical returns each yearFor years with really high returns, marginal rate will not be marginal enoughLikewise, in years where “needs” are met from taxable assets, we will be overestimating the taxes (marginal tax rates on investments though first dollars would really be taxed at effective rates)But, these tend to off-set one anotherThe thing to be careful of is:Over-estimating taxes due to:
»All/most assets in taxable accounts when:»Non-lifelong needs (i.e. travel budget) is included in retirement income need»With relatively little, or no, sources of retirement income
ANDUnder-estimating taxes due to:
»Most/all assets in tax deferred accounts with»Lifelong needs modeled separately from retirement income need»And relatively high sources of retirement income
Like household income in pre-retirement, the retirement income need merely sets the post-retirement tax assumptions

®
© WEALTHCARE CAPITAL MANAGEMENT, A Division of Financeware, Inc. 1999-2004 – All Rights Reserved PAGE 32
To correct for these:
Over-estimating taxes due to:»All/most assets in taxable accounts when:»Non-lifelong needs (i.e. travel budget) is included in retirement income need»With relatively little, or no, sources of retirement income»Don’t include non-life long needs in retirement income need
Under-estimating taxes due to:»Most/all assets in tax deferred accounts with»Lifelong needs modeled separately from retirement income need»And relatively high sources of retirement income»Include lifelong needs in retirement income need

®
© WEALTHCARE CAPITAL MANAGEMENT, A Division of Financeware, Inc. 1999-2004 – All Rights Reserved PAGE 33
The resulting tax assumptions from differing “needs” can be HUGE…
Same pre-retirement household income of $100,000
Different retirement income need had HUGE impact in post-retirement rates
But the results of both of these fall
WAY out of realistic ranges & hopefully
we won’t be designing plans with
these odds

®
© WEALTHCARE CAPITAL MANAGEMENT, A Division of Financeware, Inc. 1999-2004 – All Rights Reserved PAGE 34
In fact, with realistic “comfort zone” retirement income needs, the difference in rates is fairly small (less than the 9.3% state tax spread)

®
© WEALTHCARE CAPITAL MANAGEMENT, A Division of Financeware, Inc. 1999-2004 – All Rights Reserved PAGE 35
In summary…
Taxes are pretty complicated
With one thousand different trials, we are covering a wide gamut of scenarios
And, while there are not tools to randomly model the uncertainty of taxes »The treatment of taxes in the system probably mimics this uncertainty well»And within the context of the range of potential results is accurate
Also:
We are being far more realistic than the assumptions made with fixed returns»But we have to be careful to “check our premises” when comparing the two»Because what used to be important, material, and something to manage»Is exposed as a similar misrepresentation to the fixed returns we projected