taxation, information, and withholding: evidence …taxation, information, and withholding: evidence...
TRANSCRIPT

Taxation, Information, and Withholding:Evidence from Costa Rica∗
Anne Brockmeyer, Marco HernandezThe World Bank
January 1, 2017
AbstractThis paper studies the compliance effect of tax withholding on firms, which is commonly
used in developing countries. While a growing literature argues that third-party reporting oftax liabilities is a key mechanism for ensuring tax compliance, and a reason why tax capacitygrows along the development path, the literature has ignored the fact that third-party reportingis often associated with tax withholding. Withholding is irrelevant if the tax withheld is fullycredited against a taxpayer’s liability, but can increase compliance in the presence of costlyreclaim, low salience of enforcement or extensive margin compliance gaps. To demonstratethis empirically, we exploit a ten-year panel of income and sales tax records for 400,000 firmsand over 20 million third-party information and withholding reports from Costa Rica. We firstdocument the anatomy of compliance, finding that firms are relatively compliant with third-party reports on the extensive, intensive and payment margin. When subject to third-partyreporting for the first time, firms’ reported taxable income increases by up to 50%. We thenisolate the effect of withholding by exploiting a withholding rate increase that left reportingrequirements unchanged. A doubling of the withholding rate lead to a 33% increase in salestax payment among treated firms and an 8% increase in aggregate sales tax revenue. Themechanisms are a default payment effect and reduced misreporting. The large complianceimpact of withholding rationalizes its widespread use in developing countries.
Keywords: tax evasion, firms, business taxes, third-party information, withholding.JEL codes: H25, H26, H32, O10.
∗Corresponding author: Anne Brockmeyer, [email protected]. Marco Hernandez: [email protected]. We are exceedingly grateful to the Ministry of Finance and the General Directory for Taxa-tion of Costa Rica for outstanding collaboration. We thank Lorenzo Casaburi, François Gérard, Henrik Kleven, AartKraay, David McKenzie, Joana Naritomi, Steven Pennings, Eleanor Wilking and conference/seminar participants atLSE STICERD, NTA, PEUK, PacDev, ABCDE, IIPF, Oxford CBT, the World Bank, the IMF and George WashingtonUniversity for helpful comments. Juliana Londoño Vélez, Spencer Smith, Corinne Stephenson and Gabriel Tourekprovided excellent research assistance. The findings, interpretations, and conclusions expressed in this paper do notnecessarily reflect the views of the Goverment of Costa Rica nor of the World Bank, its Executive Directors, or thegovernments they represent. All errors are our own.
1 Introduction
Low income countries are characterized by lower tax-to-GDP ratios than high income countries,
largely due to low tax compliance (Besley and Persson 2013). The availability of third-party reports
about taxable economic activities, that can be used to verify taxpayers’ self-reports, is considered
a key determinant of tax compliance (Kleven et al., 2011; Kleven, Kreiner and Saez, 2016). While
there is evidence that an increase in third-party reporting can lead to an increase in reported taxable
sales (Naritomi (2016)), there is also evidence that taxpayers can shift evasion to the less verifiable
cost margin (Carrillo, Pomeranz and Singhal, 2016; Slemrod et al., 2015). This paper sheds new
light on the impact of third-party reporting, exploiting quasi-experimental increases in firms’ cov-
erage by reporting mechanisms. The paper then proceeds to examine the compliance impact of tax
withholding on business sales, which is commonly used in conjunction with third-party reporting,
but has so far been ignored by the literature.1 The third party cum withholding agent can be a
firm, a financial institution or a state agency, and is responsible for both reporting transactions to
the tax authority and remitting tax withheld on those same transactions. As withholding applies
to transactions that are also third-party reported, and taxpayers can claim full credit for tax with-
held, withholding merely changes the way tax is remitted and not the taxpayer’s nominal liability.
However, in the presence of extensive margin compliance gaps, misreporting compared to third-
party reports, or payment delays, withholding can increase compliance.2 The fact that withholding
schemes on business sales are common around the world, and particularly in low income countries
and low compliance sectors in high income countries (Figure I)3, suggests they may constitute an
optimal policy in a low compliance context (Best et al. 2015).
To study the compliance impact of third-party reporting and withholding, we extend a simple
evasion model with third-party reporting based on Allingham and Sandmo (1972), allowing the
third party to both report a taxpayer’s sale, as in Carrillo, Pomeranz and Singhal 2016, and withhold
a share of the transaction amount as advance tax payment for the taxpayer. Third-party reporting
puts a lower bound on reported sales. Adding withholding does not affect the taxpayer’s evasion
decision if she can fully reclaim the tax withheld. If reclaim is costly, however, only a fraction of
1This is distinct from withholding on wages, a tax compliance mechanism that is applied almost universally andwell understood (Kleven et al. 2011).
2Withholding also reduces administrative costs for the tax authority, by shifting the task of receiving tax remittancesfrom the tax authority to the withholding agent, and allowing for more concentrated monitoring of remitting agents,focusing on withholding agents.
3Also see Samanamud 2013, Soos 1990, OECD 2009 for accounts on the use of withholding schemes around theworld.
2
taxpayers reclaim the tax withheld and an increase in the withholding rate may increase reported
taxable income.
To test the predictions of our model empirically, we exploit various sources of quasi-experimental
variation in the income and sales tax system in Costa Rica, and a ten-year panel of administrative
tax records. We construct the Costa Rican tax register from the universe of registration and dereg-
istration records since 2006. We match the register with income and sales tax records from the
universe of firms, including over 400,000 self-employed and corporations. We further match these
data with over 20 million third-party reports about firm’s economic activities, from other firms,
state institutions and credit and debit card companies. All firms are required to report transactions
with their suppliers and clients if the annual transaction amount passes a threshold; state institutions
report all purchases from the private sector; and credit and debit card processing companies report
all sales going through card machines. Credit and debit card companies also serve as withholding
agents, applying firm-specific and time-varying withholding rates.
Our analysis is divided into three parts. In the first part, we leverage the data to conduct a
detailled anatomy of compliance.4 To our knowledge, this is the first study to use population-
wide third-party and withholding data from a developing country, and to analyze all compliance
margins, including the extensive, intensive and payment margin. On the extensive margin, we find
that about 50% of tax-liable firms fail to file their income tax declaration. The vast majority of
these non-filers are identified through third-party reports, and thus definitely economically active.
However, non-filers are disproportionately small. We estimate that total income tax revenue could
be increased by at most 10% if all non-filers were to file. On the intensive margin, we find that
14-17% of firms under-report their sales, while 30-50% of them under-utilize their costs compared
to third-party reports. The potential revenue gains from perfectly enforcing tax liabilities on third-
party reported sales are again approximately 10% of income tax revenue. However, evidence from
enforcement interventions on the extensive and intensive margin shows that realized revenue gains
are orders of magnitude smaller. On the payment margin, we find that 5-25% of small firms pay
their taxes with significant delay. After accounting for theses delays, however, payment is above
95% of liabilities for both the income tax and the sales tax.
We interprete this as evidence that a country like Costa Rica, with relatively high institutional
capacity, achieves a satisfactory level of tax compliance on third-party reported margins. Some
4We borrow the term from Kleven et al. (2011) who conduct an anatomy of compliance for wage earners and theself-employed in Denmark.
3

administrative follow-up interventions on detectable compliance gaps are necessary as deterrence,
to maintain the level of compliance, but increasing investments in these administrative interven-
tions is unlikely to yield substantial revenue gains. Although compliance with third-party reported
liabilities is relatively high, compliance with true liabilities might still be low. The Ministry of Fi-
nance estimates, based on macro data, that 30% of sales tax liabilities and 70% of corporate income
tax liabilities are evaded or avoided (Hacienda 2015). A large part of these liabilities are simply
not observable to the government. We thus investigate whether expanding the coverage of third-
party information reporting, and of associated withholding mechanisms, holds more promises to
increase tax revenues substantially.
We turn to analyze the impact of information reporting in the second part. We begin by showing
that bunching at the first bracket threshold in the income tax schedule - a proxy for misreporting5 -
is large and sharp in the full sample, but significantly smaller among firms covered by information-
reporting from other firms. Bunching is even smaller among firms covered by reporting by state
institutions or credit/debit card companies, the two reporting mechanisms which are also associated
with withholding. While the heterogeneity of bunching by proxies of evasion propensity has been
analyzed elsewhere (e.g. Almunia and Rodriguez 2015), this is to our knowledge the first exercise
of estimating the heterogeneity in bunching by actual third-party information coverage. We then
exploit within-firm changes over time in the coverage by information reporting in an event study.
We find that reported tax liability increases by up to 50% after firms are reported for the first
time by another firm, by 22% after the first report from a state institution and by 25% after the
first report from a credit/debit card company. These effects emerge sharply at event time, after
otherwise parallel trends between the event and control groups, and can thus not be reconciled
with a pure growth effect.
In the third part of our analysis, we isolate the impact of withholding by exploiting a quasi-
experimental increase in the withholding rate applied by credit/debit card companies to firms’ card
sales. As all card sales were already reported to the tax authority and card usage hardly responds
to the reform, this rate change did not affect the information environment. Applying a difference-
in-difference estimation, we find that a doubling of the withholding rate leads to a 33% increase
in sales tax payment among taxpayers subject to withholding. In aggregate, the withholding rate
5Previous studies have shown that bunching is largely driven by misreporting rather than real responses (e.g. Bestet al. 2015 for the minimum tax kink in Pakistan, Almunia and Rodriguez 2015 for an enforcement notch in theSpanish corporation tax).
4

reform increased sales tax payments by over 8%.6 This effect is driven by a default payment
effect, due to firms that do not reclaim the tax withheld and firms that would not have paid their
tax liability in the absence of withholding, and an increase in reported tax liabilities among firms
subject to withholding. We argue that this reporting response is due to a salience of enforcement
effect. Indeed, the response is larger among firms for whom the withholding rate changes from
zero to a positive rate (as opposed to firms experiencing a similarly-sized change from a positive
to a larger rate), and which are thus informed of the amount of tax withheld for the first time on
their credit/debit card machine statement.
Our paper contributes to several strands of literature. First, our work contributes to the literature
on taxation and development, as reviewed in Besley and Persson 2013. Theoretical contributions
in the tax and development literature have discussed why tax systems in developing countries dif-
fer from those in high income countries (Keen 2008, Gordon and Li 2009, Best et al. 2015). Our
results rationalize the prevalence of withholding schemes for firms as an enforcement tool in low
compliance environments. Our results are also consistent with Kopczuk et al. (2016) and Slemrod
(2008) who argue that the tax remittance arrangement affects compliance, an argument for which
we propose a new mechanism. More generally, our evidence highlights the important role of firms
in enforcing taxes (here as information reporting and withholding agents), as suggested theoret-
ically by Kopczuk and Slemrod (2006) and Kleven, Kreiner and Saez (2016), and demonstrated
empirically by Best (2014) in the context of employer reporting on employees’ earnings. In ad-
dition, our results contribute to the empirical literature on third-party reporting and compliance.
Consistent with Naritomi 2016, we show that expanding the coverage of information reporting in-
creases reported taxable income substantially. We can also reconcile these findings with Carrillo,
Pomeranz and Singhal 2016 and Slemrod et al. 2015, who provide evidence of evasion shifting to
the cost margin. Indeed, our analysis suggests that most firms are responsive to the presence of
third-party reporting when they are aware of such reporting ex ante, but the remaining misreporters
are not responsive to requests to correct their reports ex post. Put differently, most firms volun-
tarily comply on third-party reported margins, but enforcing compliance among the remaining
non-compliers is difficult.
Second, our study extends the literatures on tax withholding and the impact of defaults. A large
literature has analyzed withholding for the personal income tax, focusing mostly on the United
States (Barr and Dokko 2008, Gandhi and Kuehlwein 2014, White, Harrison and Harrell 1993,6Overall, withholding agents collected 10% of corporate income tax revenue and 20% of sales tax revenue in 2014.
5

Highfill, Thorson and Weber 1998). Aside from descriptive policy reports (Samanamud 2013,
OECD 2009) and legal writing (Soos 1990), the only study analyzing withholding on firms is
Carillo, Emran and Rivadeneira (2012). They show that firms bunch at a withholding rate kink,
and interpret this as evidence for a (perceived) discontinuity in the audit function. Our paper
is the first to quantify the tax revenue impact of withholding for firms, and examine the impact
mechanisms. By showing that witholding establishes a compliance default, we contribute to the
behavioral literature on defaults, which shows that defaults increase organ donation (Johnson and
Goldstein 2003) and retirement savings (Chetty et al. 2014, Thaler and Benartzi 2004, Madrian
and Shea 2001). We show that a default can also be used to induce people into a behavior such as
tax compliance that even rational agents may not display.
Finally, we draw on methodological contributions from two literatures. We follow the lead of
Fisman and Wei (2004) in identifying misreporting by comparing two data reports on the same
tax base. This approach is also used in Zucman (2013), Kumler, Verhoogen and Frías (2015),
Best (2014) and Rijkers, Baghdadi and Raballand (2015). Using the approach, we show that firms
under-report sales as well as costs, consistent with Carrillo, Pomeranz and Singhal (2016). We
also construct novel estimates of compliance gaps on the extensive and payment margin. Shedding
light on payment delays, we highlight the importance of analyzing payment data in addition to tax
liability data, which previous studies have focused on. We also draw on the bunching literature
in public finance, initiated by Saez (2010), Chetty et al. (2011) and Kleven and Waseem (2013),
and reviewed in Kleven (2016). This literature provides the techniques to estimate taxpayers’
behavioral responses to discontinuities in the tax schedule, and translate them into policy-relevant
elasticities.
The remainder of the paper is organized as follows. We start by describing a simple conceptual
framework in Section 2. Section 3 presents the Costa Rican tax system and administrative data.
Sections 4, 5 and 5 present the anatomy of compliance, the impact of information reporting and
the impact of withholding. Section 7 concludes.
2 Conceptual Framework
This section presents a simple conceptual framework to analyze behavioral responses to with-
holding. The framework is based on the canonical tax evasion model by Allingham and Sandmo
(1972), extended by Kleven et al. (2011) and Carrillo, Pomeranz and Singhal (2016) to include
6
third-party reporting for individuals and firms respectively. We first present the basic setup of the
model, then introduce withholding with full reclaim and with costly reclaim, and finally consider
salience effects.
2.1 A Tax Evasion Model with Third-Party Reporting
The basic setup of our model follows Carrillo, Pomeranz and Singhal (2016). Firms have revenue
R = RT + RS, where revenue can be either third-party reported or self-reported, indexed by T
and S, and firms declare R. Firms have costs C = Cs, which we assume for simplicity to be fully
self-reported, and firms chose to report C. The government levies tax at rate τ on declared profits
π = R− C. The tax liability is T = τπ . With probability p, firms are audited, in which case any
evasion is certain to be detected, and evaders pay a fine θ which is proportional to the evaded
liability. Firms maximize expected utility7 over after-tax income in the audited and non-audited
state of the world, YA and YN :
EU = (1− p)U(YN)+ pU(YA)
= (1− p)U(π− τπ)+ pU(π− τπ−θτ(π− π)).
To take into account the tax authority’s use of risk scores to target audits (or enforcement
interventions in general), we further follow Carrillo, Pomeranz and Singhal (2016) by assuming
that the audit probability is decreasing in the reported profit rate, p = p((π + ε)/R) with p′ < 0.
Mis-reporting against third-party information leads to certain detection: p = 1 if R < RT .8 With
these assumptions, firms choose to report R∗ ≥ RT , and choose C∗ ≷ C to satisfy the first-order
condition.
To ensure that the government always prefers less evasion, i.e. ∂R/∂ π > 0 , we assume that θ
and p′ are small, which are reasonable assumptions in most countries. As is also standard in the
literature, we assume that the second-order condition is met and avoid non-concavities by imposing
p′′ ≥ 0.7As Carrillo, Pomeranz and Singhal (2016), we consider that modeling firms in a developing country context as
risk-averse is reasonable, since more than half of the firms in our sample are unincorporated, and most firms arevulnerable to income volatility.
8The inclusion of ε , a small positive number, ensures that firms declaring zero profits on a large revenue base incura higher audit probability than firms declaring zero profits on a small revenue base, thus differentiating the two cornercases where π = 0. Assuming p = 1 instead of the more realistic specification p = p = max(p) if R < RT simplifiesthe exposure, but results are similar in the latter case.
7

2.2 Withholding with Full Reclaim
We introduce withholding into the model by assuming that tax is witheld at a rate µ on third-party
reported revenue RT . The information reporting agent thus also becomes the withholding agent.
As firms are already chosing to report revenue larger than or equal to third-party reported revenue,
the introduction of withholding leaves the information environment unchanged. In a first step, we
assume that the tax withheld can be fully reclaimed, as is technically the case in most withholding
systems. This means that firms’ net tax liability and hence payment is P = T −µRT , where the tax
withheld is deducted from the gross tax liability. There are no restrictions on the sign of P, P ≷ 0,
so that firms can request a refund if the reported tax liability is smaller than the tax withheld.
In this model, firms’ after-tax income in the audited and non-audited state of the world are
YN = π−µRT − [τπ−µRT ] = π− τπ = YN ,
YA = π−µRT − [τπ−µRT ]−θ [(τπ−µRT )− (τπ−µRT )] = π− τπ−θτ(π− π) = YA.
After-tax income in both states is exactly equal to after-tax income in the model without with-
holding. Withholding is thus irrelevant to firms’ evasion decisions. This trivial result relies on the
assumption of full and costless reclaim, which we relax in the next section.9
2.3 Withholding with Costly Reclaim
To bring the model closer to reality, we assume that firms pay a firm-specific fixed cost fi, dis-
tributed according to the cumulative distribution function H( f ), to reclaim the tax withheld µRT .
This fixed cost can represent the cost of collecting withholding receipts for each transaction and
adding up the amounts when preparing the tax return.10 The presence of the fixed cost generates a
cut-off f < µRT such that firms with fi < f reclaim the tax withheld and firms with fi ≥ f do not
reclaim. A first testable prediction of the model is thus that reclaim of the tax withheld is incom-
plete, H( f )< 1, and that the share of reclaimers increases in the withholding rate, ∂H( f )/∂ µ > 0.
Comparative Statics for Firms Absent any behavioral response, reclaimers experience a de-
crease in their after-tax income of fi < µRT in both the audited and non-audited state, and non-
9It is also obvious that withholding would mechanically increase tax payment in the case of compliance gaps onthe extensive margin or payment margin.
10It can also capture, albeit in a crude way, the monetary cost of an increase in the monitoring or audit probabilitythat firms may face when reclaiming tax withheld. The latter mechanism could also be modeled more explicitely asa discontinuous increase in the audit probability p for reclaimers, e.g. p = 1 for firms reclaiming µRT > τπ , whichwould generate bunching at the threshold where the reported tax liability equals the tax withheld, for sufficiently riskaverse firms, as show in Carillo, Emran and Rivadeneira (2012).
8

reclaimers experience a decrease of their after-tax income of µRT in the non-audited state only.
In the case of an audit, the tax withheld is recredited by the tax authority against any outstanding
liability and fines. Taxpayers adjust their reporting behavior in response to the decrease in after-
tax income. Under decreasing absolute risk aversion, as in Allingham and Sandmo (1972), one
can show that reclaimers declare πR and non-reclaimers declare πNR with πR >π∗ > πNR, where
π∗ is the taxpayers’ optimum in the baseline model without withholding. Intuitively, the decrease
in after-tax income hurts reclaimers more in the audited state, and thus induces them to become
more compliant. This simultaneously reduces the likelihood of detection and increases after-tax
income in the case of detection. The opposite is true for non-reclaimers.11 It is trivial to see that
∂ πR/∂ f > 0 for reclaimers, with µ being irrelevant, and ∂ πNR/∂ µ < 0 for non-reclaimers. How-
ever, an increase in the withholding rate also pushes some non-reclaimers to become reclaimers.
The impact of a withholding rate increase on total reported profits is thus ambiguous.
Comparative Statics for the Government Government revenue G is equal to total tax payment
by all firms. Assume a continuum of firms of measure 1 with fixed costs distributed according to
H( f ). Then government revenue is the weighted average of revenue across the audited and non-
audited state of the world, where in each state, a fraction H( f ) of firms are reclaimers who pay
exactly the declared (or true) tax liability and the remaining fraction (1−H( f )) of firms are non-
reclaimers from whom the government collects the reported tax liability plus the tax withheld in
the non-audited state, and the true tax liability in the audited state:
G = (1− p)[H( f )[τπR]+ (1−H( f ))[τπNR +µRT ]
]+p
[τπ +H( f )θτ(π− πR)+(1−H( f ))[θτ(π− πNR)]
].
On the one hand, a higher withholding rate pushes a larger share of firms to become reclaimers,
who report higher profits and accordingly pay a higher liability. On the other hand, non-reclaimers
reduce their reported profits, but by less than the amount of tax withheld, and thus pay more
tax than they otherwise would. Therefore, assuming that p and/or θ is small, a withholding rate
increase raises total tax revenue.11As has been shown in the referenced papers, π also increases in p, θ and RT .
9

2.4 Withholding and Salience of Enforcement
If taxpayers are not fully aware of third-party reporting about them (i.e. misperceive RT ), the with-
holding system may affect their behavior through a salience channel (Chetty, Looney and Kroft
2009). Third-party reporting mechanisms usually require information reports to be submitted by
the reporting agent to the tax authority, but not necessarily to the taxpayer. Withholding mech-
anism, however, normally require the withholding agent to inform both the tax authority and the
taxpayer about the amount of tax withheld, so as to enable the taxpayer to make a reclaim.12
For taxpayers unaware of third-party reporting, the introduction of withholding thus raises (their
perception of) third-party reported sales from 0 to RT and moves reported profits from π∗(0) to
π∗(RT ) with π∗(RT ) > π∗(0) if p′ 6= 0. Furthermore, the introduction of withholding and the as-
sociated communication of the amount of tax withheld to the taxpayer by the withholding agent
may increase the salience of tax enforcement in general, captured by the audit probability p in
our simple framework. For instance, taxpayers may react to a perceived audit probability p which
is a function of the number of times they have witnessed tax enforcement in practice (e.g. have
observed an audit or received a communication from the tax authority). Being confronted with the
tax withholding mechanism (another form of enforcement) may then lead taxpayers to revise p
upwards and increase π.13
3 Context and Data
We proceed to estimate the impact of third-party reporting and withholding empirically using pol-
icy variation and administrative tax records from Costa Rica, where tax revenue is predominantly
derived from the income tax on firms and the sales tax. Firms in Costa Rica register either as
persona física (unincorporated firm, i.e. self-employed individuals) or as persona jurídica (cor-
poration), using the D140 registration form. There are no size thresholds or other requirements
obliging firms to chose one firm type or the other, but the governance structure and income tax
schedule for the two firm types differ.14 This section presents first the income and sales tax sys-
tem in Costa Rica, and then the compliance mechanisms used to enforce taxes, and finally the
12See Figure XII for an illustration of the type of information provided by card processing companies in Costa Ricato affiliated businesses.
13Note however that in a model as in Finkelstein (2009), in which salience merely increases the link between theperceived and actual tax rate, but without moving the misperception in a particular direction, a change in salience hasan ambigious effect on taxpayer behavior.
14Wage earners are taxed according to yet another tax schedule, which features three tax brackets with marginalrates of 0, 10 and 15% respectively. The highest kink for wage earners is below the lowest kink for the self-employed.
10

administrative data used in this study.
3.1 Income Tax
For all firms, income tax is levied on taxable profits, and filed annually by December 15, with
three quarterly advance payments due in March, June and September.15 The self-employed face
a kinked tax schedule on profits, with five tax brackets. As Table I shows, the location of all the
kinks is adjusted annually for expected inflation. The new kink locations are announced by decree
each year in the early fall, before the begining of the new fiscal year. The marginal tax rates which
apply to incomes in the five brackets are 0, 10, 15, 20 and 25% respectively. These rates do not
change over the period 2006-2014.
Corporations face a notched tax schedule on revenue, with three tax brackets and no exempt
amount.16 A firm’s revenue determines its average tax rate, which is then applied to profits. The
notch locations are again inflation-adjusted annually, and the average tax rates of 10, 20 and 30%
have not changed during the period we study. Note that the annual adjustment of kink and notch
locations generates 54 different thresholds over 2006-2014. Out of these, only two are at a round
number (kink 1 in 2011, and kink 2 in 2009), facilitataing the identification of bunching driven by
the tax rate change.
3.2 Sales Tax
Costa Rica does not have a fully-fledged VAT, but levies a sales tax which firms need to declare
monthly by the tenth working day of the following month. The base for the sales tax is the sale
of goods and certain specified services, which includes for example hotels, tailors, and florists,
but excludes most professional services, for instance those provided by lawyers and doctors. The
standard rate has been constant at 13% for the entire period of our study, and reduced rates of
10% and 5% respectively are levied on wood and residential electricity. Sales tax paid on inputs
can be claimed as credit, which makes the sales tax effectively a VAT with a narrow base. Any
sales taxpayer is liable for the income tax, but the reverse is not necessarily true. In our sample,
approximately 20% of income tax compliant firms also file sales tax.
15Fiscal year t in Costa Rica starts on October 1 in year t− 1 and ends on September 30 in year t. Taxpayers canrequest to pay taxes according to a different fiscal period, which we take into account in our analysis. The quarterlyadvance payment is a quarter of either the previous year’s tax liability, or the average liability over the last three years,whichever is higher.
16Corporations also claim a different set of deductions than unincorproated firms.
11

Retailers in certain sectors and below certain size thresholds (annual purchases less than 150
base salaries, fixed assets less than 350 base salaries, less than six employees) can opt into a
simplified regime, unifying income and sales tax. In this regime, tax is levied on input at sector-
specific rates that vary from 3% to 9.8%. Firms file and pay tax quarterly, and can claim credit
for withholding by state institutions for the income tax, but not for withholding by credit card
institutions for the sales tax. Firms can opt out of the regime by submitting a D140 modification
form.
3.3 Compliance Mechanisms
To enhance tax compliance among firms, the tax authority in Costa Rica makes use of information
reporting and tax withholding by different third parties. The relevant informative declarations,
submitted by public or private sector agents about the economic activities of tax-liable firms and
individuals, are listed in Table III. An informant submits one informative declaration for each
client/supplier, specifying the tax identification number of the informant and the taxpayer, the
transaction amount, the tax withheld if applicable, and the income/transaction type. All infor-
mation reporting and withholding mechanisms apply in the same way to the self-employed and
corporations. For reporting mechanisms not associated with withholding, taxpayers are not pro-
vided with the informative declarations at the time they file their declaration, and are not notified
about the existence of an informative record. However, given the structure of reporting require-
ments explained below, the tax authority expect firms to be aware of any third-party records about
them.17
The tax authority uses all informative declarations, combined with customs declarations D166
and D167 on imports and exports, to automatically cross-check all income tax declarations. Tax-
payers with strong discrepancies between the third-party information and the self-assessment dec-
laration are then selected for intensive margin controls or audits.
3.3.1 Information Reporting
Declarations D151 and D158 are pure reporting declarations, not involving any withholding. Dec-
laration D151 must be filed by all firms conducting purchases or sales above a certain threshold.
Purchases and sales must be reported if the accumulated annual amount of transactions with a sin-
17In the rare case that a taxpayer inquires with the tax authority about the third-party information held about hereconomic activities, the authority is legally obliged to provide the information to the taxpayer.
12

gle transaction partner reaches CRC 2.5 mio (Costa Rican colones).18 The payment of rent, com-
missions, professional service fees or interests must be reported if the annual transaction amount
with a single transaction partner reaches CRC 50,000. These transactions must be reported by
both the seller and the purchaser. Declaration D158 must be filed by the organizers of agricultural
auctions, and covers all sales and purchases at the auction. Each transaction must be reported only
once, either by the seller or the buyer.
3.3.2 Withholding System
Declarations D150 and D153 are filed by withholding agents, and are accompanied by remittance
of the tax withheld to the tax authority. 19 Declaration D150 is filed by state institutions making
purchases from firms, and by firms purchasing certain specified services (e.g. transport, commu-
nications) from non-resident firms. State institutions withhold tax at a rate of 2% on all purchases,
and firms withhold at a rate of 3% on the specified purchases. This tax withheld is creditable
against the withholdee’s income tax liability.
Declaration D153 is filed for the purpose of sales tax withholding by companies processing
credit/debit card payments. The companies report all sales that their sales-tax-liable customers
conduct through card transactions. On this base, they withhold sales tax at a firm-specific rate
varying between 0 and 6%.
The sales tax withholding rate schedule is displayed in Table II. Prior to August 2011, the
withholding rate was determined by a notched schedule on value-added. Value-added is defined
as the ratio of taxed sales over taxed purchases and imports reported on the sales tax declaration.
The notches are located at 5, 20, 30, 40, 55, and 75% of value-added. All notches are associated
with a one percentage point increase in the withholding rate. Prior to August 2011, 40.3% of firms
subject to D153 reporting benefited from the zero-withholding rate, and only 21.8% were subject
to the 6% rate.
To increase the extent of withholding, a reform announced by decree in July 2011 and effective
since August 2011 consolidated the withholding rate schedule to three rates of 0, 3 and 6% and
changed the rate determination. The rates are now based on the share of local sales in total sales,
with notches at 0 and 50%. Since the reform, 68.7% of D153-covered firms are subject to a
withholding rate of 6%.
18As of December 5, 2016, 1 US dollar is 545 CRC.19Withholding agents remit the tax withheld the day after the transaction takes place, and thus have no liquidity
benefit.
13

For the entire period of our study, withholding rates for semester t are based on the value-
added/share of local sales reported in firms’ sales tax returns in semester t− 2. The tax authority
calculates the withholding rate and communicate it to the withholding agent, using sector averages
for firms with no tax history. In special circumstances, firms can request the tax authority to change
the withholding rate before the end of the semester. In this case, the realized withholding rate may
differ from the rate predicted by value-added or share of local sales in semester t−2.
A taxpayer whose tax payment has been (partially) withheld can deduct the corresponding
amount on the relevant tax declaration (income or sales tax) for the same fiscal period (henceforth
called “reclaim”), or in future fiscal periods (through the tax return box “compensation request”).
If the taxpayer has a tax liability of zero in three consecutive months, and can thus not make
use of these deduction options, the taxpayer can make a “refund request”. This requires detailled
information on the withholding agent, amount of tax withheld and timing of withholding, and a
confirmation by the taxpayer that she has no outstanding liabilities in any other tax. The processing
of refund requests is done on a case-by-case basis and can take several months.
3.4 Data
Our analysis combines anonymized tax return data and third-party and withholding declarations
from the General Directory for Taxation in Costa Rica. The tax return data contains the universe of
income tax declarations (D101) for 2006-2015 and sales tax declarations (D104) for 2008-2015,
as well as the corresponding payment returns (D110) for the income and sales tax. Since 2006, all
tax returns have been digitzed, and electronic filing has gradually been introduced for the different
declarations, ensuring that the data have nearly complete coverage and a high degree of acurracy.
The filing software EDDI-7 conducts automatic validation checks to ensure the internal consistency
of filed returns. The data contain all line items of the tax return, including firm type and sector,
income sources, cost items, deductions, gross and net liability and payment. The final data set
contains 112,000 to 250,000 self-employed per year, 90,000 to 150,000 corporations and 58,000
to 70,000 sales tax filers per month.20
We merge the tax records with the informative declarations D150, D151, D153 and D158,
also for the period 2006-2015. These data have been filed eletronically through the DECLAR@7
20Only the tax records for 2012-2014, and a small share of records for 2010 and 2011 have firm type indicators (self-employed or corporation). During this period, we observe only a handful of firms switching firm type. We thereforeuse the 2010-2014 tax return data and the tax register to assign a firm type to the tax returns for 2006-2011. We dropreturns for which we cannot determine the firm type with this strategy.
14

system, which conducts similar validation checks as EDDI-7. Table III provides an overview of
the number of records and their coverage for each of the informative declarations.
Declaration D151 registers both the largest number of observations, and the widest coverage,
being available for approximately half of all firms. The coverage is similar for the self-employed
and corporations. The filing of informative declarations is more concentrated than the coverage,
meaning that a smaller share of firms act as informants (results available upon request). Note that
information reporters are slightly more likely to report their own costs than their own sales, as
evidence by the fact that 54.3% of the D151 records represent sales records. Declaration D158
is similar to D151 in that sense, but has much lower coverage, given the specific nature of the
transactions it covers (agricultural auctions). In our analysis, we thus use the sum of third-party in-
formation on sales/costs from D151 and D158. We henceforth refer to these reports as information
reports by other firms or D151 reports.
Withholding by state institutions and financial institutions, as reported in D150 and D153,
has a much lower coverage among firms than pure information reporting, especially for the self-
employed. D150 and D153 records are available for only 5.0% and 5.8% of the self-employed
and 8.4% and 11.% of corporations respectively.21 98.5% of D150 records are submitted by state
institutions, meaning that withholding by private non-financial firms is minimal. A significant
share of informative declarations cannot be matched with income tax records, suggesting that a
large number of firms covered by third-party information or withholding are incompliant on the
extensive margin.
In addition to the tax returns and informative declarations, we use the D140 and D141 regis-
tration and deregistration records for 2006-2014 to construct snapshots of the tax register for each
fiscal period. Firms use the D140 form both for registration purposes, as well as for modification
and deregistration. If the government deregisters a firm de oficio, which happens if a firm has not
filed taxes for at least three years, a D141 form is used.
4 Anatomy of Compliance
This section presents the anatomy of tax compliance in Costa Rica, identifying mis-reporting
through discrepancies between two data reports on the same tax base, as applied by Fisman and
Wei (2004). We start with the extensive margin, estimating the share of non-filers by matching tax
21As indicated by the percentages in squared brackets in Table III, the coverage of D153 declarations among sales-tax-liable firms is higher, since they constitute only a small subsample of income taxpayers.
15

declarations filed to the set of tax liable firms as constructed from the tax register and available
third-party reports. We then consider the intensive margin, estimating misreporting by compar-
ing third-party reported and self-reported sales and costs. Finally, we estimate compliance with
the payment obligation, comparing tax returns with payment receipts. We compare compliance
by the self-employed and by corporations, as the two groups face different tax schedules and the
self-employed have been identified in the literature as a particularly evasion-prone segment of
taxpayers.
4.1 Extensive Margin Compliance
To examine compliance on the extensive margin, we construct the set of tax liable firms and com-
pare it to the self-assessment declarations filed for the income tax and the sales tax. A firm is
considered income tax liable for fiscal year t if it fulfills at least one of the following conditions:
(i) the firm is in the tax register in year t, (ii) has filed income tax in t, (iii) is covered by at least one
third-party informative declaration in t,22 (iv) has filed income tax in t−1 and has not deregistered
since, or (v) has registered in the last year and has not deregistered since. For the sales tax, we
consider as sales tax liable for month m only firms that have either (i) filed sales tax between month
m and m−4, (ii) registered as liable for the sales tax in the last four months and have not changed
their registration status since, or (iii) are subject to withholding by credit/debit card providers for
the purpose of sales tax compliance.23
Table IV reports the share of non-filers for different taxes and subsamples. The overall share
of non-filers for the income tax is substantial in all years, having increased from 38% to 55% of
tax liable firms from 2010 to 2013 (panel A, column 1). It seems that non-filing for the sales tax
is less prevalent, with a non-filing share of about 20%, which is consistent with the self-enforcing
nature of the VAT. However, the fact that only a subsample of income taxpayers are liable for the
sales tax lowers our estimates. Non-filers that are identified only through third-party reports, and
are not subjet to withholding, need to be dropped from the pool as it is not possible to determine
whether they are sales tax liable. The majority of sales tax non-filers are thus registered firms
22We exclude information from D151 cost reports, which could pertain to wage-earning individuals who purchasedgoods from a firm.
23This algorithm is described in more detail in appendix section 8.1. Note that our algorithm is more conservativethan the tax authority’s own algorithm, which considers firms that filed in the past three years and have not deregisteredsince as tax liable. We report estimates using a more lenient algorithm (going back three years for the income tax and12 months for the sales tax) in appendix table VIII. The estimates are marginallly higher for the income tax, and aboutone third higher for the sales tax. The three-year window reflects the tax authority’s practice of deregistering a firm deoficio if it has not filed for three years.
16

which file only intermittently. In contrast, the majority of income tax non-filers are identified
through third-party information (column 2). This suggests that, though third-party information
helps to identify taxable activities, it does not necessarily induce the reportees to comply with their
tax filing obligations.
An analysis of filing behavior across firm types shows that non-filing rates are generally lower
for registered firms (panel B, column 1), and lower for registered corporations than for registered
self-employed (columns 2 and 4).24 Besides, there is a positive correlation between coverage by
information reporting and filing, as theory would predict (columns 3 and 5), and the correlation
is stronger for corporations. Distinguishing different sources of third-party information, panel C
shows that firms reported by state institutions or credit/debit card companies display significantly
lower non-filing rates than firms reported only by their suppliers or clients. This suggests that
reporting mechanisms which are accompanied by withholding may have a stronger compliance
impact.
To proxy the loss of tax revenue due to non-filing, we estimate that the share of undeclared sales
represents 16-23% of declared sales, and the estimated share of unreported liabilities represents 7-
10% of reported liabilities for the income tax (panel A, columns 4 and 5). The estimates rely on
non-filers’ third-party reported sales or their most recent available tax return, the assumption that
the distribution of profits rates by firms size is similar for non-filers and filers and that the tax
schedule is applied as per the law (see the notes to Table IV for details). The numbers suggest that
even if the tax authority was able to perfectly enforce the tax filing obligation at no cost, income
tax revenue would increase by 10% at most.
Given the incomplete nature of the third-party information trail, these estimates are a weak
lower bound of extensive margin compliance gaps. Our algorithm does not capture firms that are
fully informal and do not transact with any withholding or information reporting agents. However,
we consider that our estimates capture the policy-relevant subsample of extensive margin non-
compliers. Indeed, while several studies find that formalizing fully informal firms is difficult and
costly (de Mel, McKenzie and Woodruff 2013, Bruhn and McKenzie 2014), a companion paper
by Brockmeyer et al. (2015) shows that filing rates among firms known to the tax authority can be
increased significantly through low-cost deterrence messages. Nonetheless, filing rates still remain
below 40% in the sample of initial late-filers, and revenue gains from increased filing are small
24Note that column 1 in panel B is not the average of columns 2 and 4, as column 1 also includes firms for whichthe firm type indicator, identifying self-employed and corporations, is missing.
17

(less than 1% of aggregate income tax revenue).
4.2 Intensive Margin Compliance
To examine compliance on the intensive margin, we compare self-reports and third-party reports,
for sales and costs respectively. We construct a taxpayer’s third-party reported sales as the sum
of sales reported by other firms (the taxpayer’s clients, D151 sales), state institutions (D150),
debit/credit card companies (D153) and exports.25 A taxpayer’s third-party reported costs are the
sum of sales reported by the taxpayer’s suppliers (D151 costs). Underreporters (overreporters) are
firms reporting an amount at least 0.25% smaller (larger) than the relevant comparison amount.
Table V shows the estimates of under-reporting for tax year 2010, distinguishing sales reports
and cost reports, and reports by the self-employed and corporations respectively. Panel A focuses
on under-reporting for the income tax, panel B on estimating the under-reported income tax liabil-
ity, and panel C on internal consistency between the different declarations submitted by a taxpayer.
Estimating under-reporting for the sales tax is more challenging, given its narrow base and the fact
that third-party reports do not distinguish between sales liable and not liable for the sales tax.
While 17% of the self-employed and 14% of corporations under-report sales compared to third-
party reports, the share of firms under-reporting their costs is even higher, 50% and 30% respec-
tively for the self-employed and corporations (row 1). Firms thus under-report not just sales but
scale, as shown also in Carrillo, Pomeranz and Singhal (2016). The higher share of cost under-
reporters among the self-employed can be explained by the presence of an exempt tax bracket
in the self-employed tax schedule. While under-reporters leave about 40% of their third-party
reported sales and 30% of their third-party reported costs unreported (row 5), these amounts rep-
resent only about 15% of total third-party reports (row 6). The share of unreported sales in total
third-party reported sales is just slightly smaller than the share of sales under-reporters, suggesting
that under-reporters are not disproportionately small firms (rows 1 vs 6, columns 1 and 2). The
share of under-reported costs in total third-party reported costs is significantly smaller than the
share of cost under-reporters (rows 1 vs 6, columns 3 and 4). This suggests that marginal cost
under-utilization is widespread, but substantial under-utilization is not.
With a few assumptions, it is possible to translate the unreported sales amounts into unreported
tax liability. We assume that under-reporters declare all third-party reported sales, apply the in-
25While inter-firm sales could technically be conducted through a card transaction and would thus appear both onthe D151 and on the D153 delaration, in which case our measure would over-estimate third-party reported sales, thetax authority considers this unlikely.
18

tially reported profit rate to their intially unreported sales, and then apply the tax schedule. This
means we allow under-reporters to offset additional reported sales with additional reported costs,
proportionately to the initial declared profit rate. This is a realistic assumption, given the evidence
in Carrillo, Pomeranz and Singhal (2016) and Slemrod et al. (2015), and consistent with firms’
response to desk audits discussed further below. We estimate that reported tax liabilities would
increase by 9% for corporations and by 48% for the self-employed if all third-party reported sales
were declared (row 11). This large increase for the self-employed is driven by their high initial
reported profit rates, given the exempt tax bracket. However, as the self-employed’s tax liabilities
represents only 3% of corporate tax liabilities, the general conclusion still is that the tax authority
could increase income tax revenue from firms by 10% at most if it was able to perfectly enforce all
third-party reported sales.
Evidence from the impact of desk audits further supports the conclusion that simply improv-
ing enforcement on third-party reported margins cannot increase tax revenue substantially. The
tax authority systematically cross-checks third-party reports and self-assessment declarations, and
conduct periodic desk audits for firms that exhibit discrepancies. A desk audit entails a one-day
examination of the case by a tax officer and a phone call to the taxpayer, with the request to rectify
the tax declaration. Figure II displays the results of desk audits for the income tax (panel A) and
the sales tax (panel B). Comparing a firm’s initial tax return to the post-audit revised return, the
figure plots the change in reported costs against the change in reported revenue for panel A, and the
change in reported input tax credit against the change in sales tax collected in panel B. The figures
focus on the small share of desk-audited firms that actually revise their declaration in response to
the phone call: 19% of firms for the income tax and 16% for the sales tax. Revisers clearly offset
revenue increases by cost increases, by almost 100% for the income tax and by about two-thirds
for the sales tax. The revisers’ reported tax liability more than doubles nonetheless, as the initial
base is extremely low. The interventions are also highly cost-effective, considering the daily salary
of a tax officer, and the load of one case per day. However, the number of revisers and their scale
is so small that the revisions increase total revenue by less than .5%.26 The low response rate,
offsetting cost adjustments and marginal tax revenue gains of these desk audits are all consistent
with the fact that the under-reporting rates in Table V change little when considering firms’ final
returns rather than their initial returns, or earlier or later fiscal years.
26More generally, whether it is optimal for the tax authority to invest in desk audits rather than full audits orfollow-up communications with non-filers or late-payers depends on the relative revenue elasticities of these differentenforcement activities, in the spirit of Keen and Slemrod (2016).
19
This analysis has thus shown that, although misreporting compared to third-party information
is present, its levels are moderate, probably due the deterrence effect of routine cross-checks, desk
audits and other compliance interventions by the tax authority. The majority of firms comply vol-
untarily, and the remaining non-compliers are unlikely to be swayed into compliance with standard
enforcement tools (e.g. desk audits). Perfectly enforcing reporting of third-party reported margins
could increase income tax revenue by 10% in theory, but the realized effect of desk audits is orders
of magnitude smaller.
4.3 Payment Compliance
To examine taxpayers’ compliance with the obligation to pay their net tax liability, we match the
income and sales tax returns with payment records from the D110 payment receipts. Importantly,
the payment receipts display both the payment date and the tax period and taxpayer to which the
payment corresponds, allowing us to exactly match payments with liabilities. To our knowledge,
this is the first attempt at estimating payment compliance for the income and sales tax, testing the
previously implicit assumption that declared tax liabilities automatically translate into payments.27
The relevant liability is the taxpayer’s final tax liability to be paid as per the final (revised) tax
returns, after deductions, advance payments and tax withheld have been subtracted.28 We compare
this liability to the tax payment that the taxpayer makes herself, excluding payments made by
withholding agents and advance payments made by the taxpayer.29 We then take the share of
payment over liability for each taxpayer, and average this share across all taxpayers in each fiscal
period.
The results are displayed in Figure III, where panel A corresponds to the income tax and panel
B correspond to the sales tax, and thick blue and thin red lines correspond to corporations and
self-employed respectively. In both panels, the average payment share is below 100% in all fiscal
periods, and decreases as we consider more recent tax periods, dropping to 70% for the income
tax and 85% for the sales tax in the most recent period considered (solid lines). This is despite the
fact that we consider payments made until April 2015, the payment deadline for fiscal year 2014.
There are two potential explanations for this downward sloping profile of the average payment
27Del Carpio (2014) provides estimates of property tax compliance in Peru, which are conceptually different fromour estimates as property taxes are assessed by the government and thus have no misreporting margin.
28Note that we use the net liability as derived on the firm’s tax return, and taking into account only the amount ofadvance tax payments and tax withheld that the taxpayer chose to reclaim on her tax declaration.
29Including payments that are enforced retroactively by the tax authority through administrative or judicial proce-dures makes little difference to the results.
20

rate: a fall in payment compliance over time, or the presence of late-payers. If taxpayers service
their tax obligations with substantial delays, then more recent periods will display lower payment
compliance than earlier periods, for which a longer series of payment data is available.
To distinguish these two explanations, we add the average payment profiles based on payments
made until April 2013 and April 2011 respectively (dashed and dotted lines). These payment
profiles are similarly downward sloping and shifted to the left, suggesting that payment delays
are indeed at play. For instance, while the income tax payment share for 2010 is about 88% when
measured by April 2011, it is above 95% when measured in April 2015. A small share of taxpayers
thus pay with large delays. This is consistant with anedotal evidence that cash-constrained firms
make tax payments when they are liquid rather than when the payment is due, as fines and interest
fees are small. At the same time, the payment share, as measured by the fiscal period-specific
payment deadline, is also decreasing over time, from 88% for the income tax in 2010 to 81% in
2014. This suggests that the second explanation - falling payment compliance over time - is also
at play. Overall, however, payment compliance is relatively high, not only when averaged across
firms, but especially in the aggregate. As non-payers and late-payers are disproportionately small,
the aggregate payment rate, that is the sum of payments divided by the sum of final liabilities, is
close to 100% soon after the payment deadline and stable over time.30 Although the enforcement
of outstanding payments through administrative and judicial procedures is part of the regular ac-
tivities of the tax authority in Costa Rica, and important from a deterrence perspective, increasing
enforcement on this margin is unlikely to increase tax revenue substantially.
To summarize, the anatomy of compliance allows the following conclusions. First, a substan-
tial share of firms fail to file their taxes, and there are limits to the extent to which third-party
information induces compliance on the extensive margin. Second, a non-neglegible share of firms
under-report sales compared to third-party reports, despite the fact that the authority conducts sys-
tematic cross-checks and regularly requests corrections of discrepancies. Finally, a group of pre-
dominantly small firms pay their outstanding liabilities with several months, sometimes years, of
delay. Overall, while compliance gaps are present on all margins, they are relatively modest com-
pared to total tax revenue. As evidence from a filing intervention and desk audits show, increased
enforcement on third-party reported margins is unlikely to yield large revenue gains, precisely
because voluntary compliance is relatively high and the remaining non-compliers respond little
to enforcement. Instead of increasing enforcement, expanding the coverage of third-party infor-
30Results available upon request.
21

mation, and the application of associated withholding mechanisms, may be a much higher-return
investment than increased enforcement, a question that we turn to in the next two sections.
5 Impact of Information Reporting
This section examines the compliance impact of information reporting while section 6 isolates the
impact of withholding. We first analyze the heterogeneity of bunching, as a proxy for misreporting,
across subsamples of firms with different degrees of information reporting coverage, and then
conduct an event study of the response to information reporting.
5.1 Heterogeneity in Bunching
Bunching at kinks or notches in the tax schedule has been used in numerous studies to estimate the
response of reported taxable income to the tax rate, and bunching is usually shown to be driven by
an evasion/avoidance response rather than a real response (e.g. Bachas and Soto 2016, Almunia
and Rodriguez 2015, Seim 2015). In Costa Rica, we observe large and sharp bunching at the first
kink in the self-employed tax schedule and at the first notch in the corporate tax schedule, and
bunching moves every single year with the location of the kink, as shown in Figure IV for the
self-employed.31 There is rarely any excess mass at the previous year’s kink, suggesting that firms
adjust almost immediately and fully to the new kink location. The consistent and speedy adjust-
ment supports the interpretation of bunching as a reporting response rather than a real production
change.32 We thus use bunching as a proxy for misreporting.
To examine the heterogeneity of bunching with coverage by information reporting, we pool the
data for 2006 to 2015 and display the distribution as percentage difference from the year-specific31The first threshold in each schedule is the most salient one, and also the largest in terms of the tax rate change for
the self-employed. We focus on this threshold, considering Chetty et al. (2011) who argue that larger kinks generatestronger bunching, as the size of the tax incentive allows some taxpayers to overcome optimization frictions that wouldotherwise prevent them from bunching.
32Strikingly, the excess mass is always concentrated to the left of the kink. For the years 2010 to 2014, the dis-tribution also displays a clear missing mass to the right of the kink, which is at odds with the prediction of standardutility theory. This theory predicts that kinks generate symmetric bunching around the threshold, and notches generateasymmetric bunching below the threshold and a missing mass in a dominated range above the threshold Kleven andWaseem (2013). However, as discussed in Kleven (2016), several studies have found asymmetric bunching also at kinkpoints, suggesting that taxpayers may perceive a kink as a notch. One possible explation is that crossing the kink maybe associated with a fixed cost, such as having to make a payment, as is the case for the first kink in the self-employedtax schedule in Costa Rica. However, tax payments can be done online and should generate little transaction costin Costa Rica. Another explanation is that the threshold creates a reference point, which constitutes a notch in thefirm’s utility function, so that bunching is driven by reference point dependence rather than the traditionally assumedresponse to the financial incentive change at the kink. This warrents caution when using bunching to estimate theelasticity of taxable income, but does not prevent us from interpreting bunching as a measure of misreporting whichgenerates a revenue loss for the government.
22
threshold location in 1% bins. To estimate the size of bunching, we fit a flexible polynomial to
the observed distribution, excluding a range around the thresholds, as is standard in the bunching
literature (Chetty et al. 2011, Kleven and Waseem 2013). Given the asymmetric nature of bunching,
we estimate bunching to the left of the kink and the missing mass to the right of the kink. As the
missing mass does not seem to be the same size as the excess mass, at least for the self-employed,
we apply the estimation strategy suggested by Best and Kleven (2015) rather than the covergence
method. We choose the lower bound of the excluded range as the point where bunching starts and
the upper bound as the point where the derivative of the observed distribution shifts from positive
to negative.33
Figure V displays the observed distribution (dotted blue line), the estimated counterfactual
(solid red line) and excess mass and missing mass estimates for different subsamples. The top
row (A) shows the distribution of taxable income for the self-employed around the first kink;
the bottom row (B) shows the distribution of revenue for corporations around the first notch. In
each row, panel 1 reflects the firm-year observations not covered by any information reporting or
withholding mechanisms, panel 2 reflects observations that are subject to information reporting by
other firms only (declaration D151 by suppliers or clients), and panels 3 and 4 reflect observations
subject to reporting by state institutions and credit/debit card companies respectively (declarations
D150 and D153).
Among both firm types, the largest excess mass is found in the sample of firms not subject
to information reporting (panel A). The subsample of firms subject to information reporting by
other firms (panel B) still exhibits a large excess mass around both the kink and the notch, but in
both cases, the excess mass estimate is significantly smaller than the estimate for firms not subject
to information reporting. The excess mass drops from 4.5 to 2.08 for the self-employed and from
4.49 to 3.17 for corporations, and those drops are statistically significant at the 1% level.34 The fact
that bunching is smaller but still highly significant among information-covered firms is consistent
with the fact that bunching can be partly driven by legal avoidance, and that the information trail
is incomplete, covering only large transactions. Firms can still manipulate their taxable income
33The convergence method would require the missing mass and the excess mass to be of the same size and assumesthat there are no extensive margin responses, which is unlikely in a context with high shares of non-filers even amongregistered firms.
34Note that the change in the missing mass estimate is driven by a change in the counterfactual density whichscales the excess mass, rather than by a change in the absolute size of the excess mass. The missing mass drops forcorporations, but increases for the self-employed. In fact, the missing mass for the self-employed is clearly visibleonly in panels 2 and 3. This suggests that the threshold may be perceived as a kink by some self-employed in thesubsample not covered by information reporting.
23

by misreporting small and cash transactions and sales to the final consumer, or inflating costs,
deductions and exemptions.
Information reporting by state institutions and credit/debit card companies, which also act as
withholding agents, is associated with a further reduction in misreporting behavior (panels B and
C). For the self-employed, the excess mass among firms subject to state reporting is similar to
the excess mass among firms subject only to information reporting by other firms, but the excess
mass drops to .52 for firms subject to credit/debit card reporting. For corporations, the excess
mass drops to 1.44 and 1.35 respectively for firms subject to state reporting and credit/debit card
reporting. These drops are again highly statistically significant.
The heterogeneity of bunching across subsamples is thus consistent with a compliance impact
of information reporting, and an even stronger impact of withholding.35 However, our estimates
capture a cross-sectional correlation rather than a causal effect. Firms subject to information report-
ing, and especially firms subject to withholding, are on average larger, more urban and probably
equipped with more sophisticated management and accounting systems. It is possible that these
characteristics, rather than coverage by the tax compliance mechanisms, explain at least part of the
heterogeneity in bunching.
5.2 Event Study
To move a step further towards estimating a causal effect of information reporting, we exploit
within-firm variation across time in the coverage of information reporting. Each year, over a thou-
sand firms become third-party reported for the first time. If third-party reporting of transactions to
the tax authority forces firms to declare a larger share of their transactions on their self-assessment
declarations, coverage by information reporting should be associated with an increase in reported
taxable sales and income. This prediction is motivated by the fact that the tax authority regularly
follows up on firms with discrepancies between third-party and self-reports, leading most firms to
report sales weakly larger than the third-party reported amounts (section V).
We thus conduct an event study of reported taxable income around the time of the first infor-
mation report about a firm, distinguishing reports by the different informing agents (other firms,
state institutions, credit/debit card companies).36 Of course, whether or not a firm becomes subject
35Our results are also consistent with audit-based estimates from the United States, where the Internal RevenueService reports tax evasion rates of 56%, 8% and 1% respectively on income covered by little information reporting,income covered by substantial information reporting and income subject to withholding (IRS 2012).
36The Costa Rican tax authority, unlike the Internal Revenue Service in the United States, do not notify taxpayersabout the informative reports received about them. However, given the structure of reporting requirements, each firm
24

to information reporting is partly under the firm’s control. A firm is nearly certain to be reported
to the tax authority if it sells to a state institution or conducts sales via a credit/debit card termi-
nal, as state institutions and card companies are considered highly compliant with their reporting
obligations. Conducting transactions with another firm above the relevant annual threshold amount
should also trigger information reporting, although firms may be less compliant with their reporting
obligations, and transacting partners may collude not report their transactions.37
An additional concern is that the event of becoming subject to information reporting may in-
crease not only the share of true taxable income that is reported to the tax authority, but may
increase also the level of true taxable income, which would raise reported taxable income even
if the share of income that is reported remains unchanged. For instance, securing a government
contract has been shown to increase firm growth (Ferraz, Finan and Szerman 2016), and offering
consumers the opportunity to pay by credit/debit card may allow firms to attract additional cus-
tomers. While there are no credible estimates of the potential size of these demand effects, we
discuss below why our estimates are unlikely to be fully driven by them.
To adress the identification concerns, we consider the event group E of firms that become
third-party reported for the first time at event time k = 0, and the event control group C of firms
which have not switched into coverage by k = 0. As a careful precaution, but without substan-
tively modifying the core results, we follow Hilger (2014) and Naritomi (2016) in reweighting the
control group to resemble the treatment group pre-event trend. For each event period, we estimate
the firms’ propensity score of being third-party reported for the first time.38 Following DiNardo,
Fortin and Lemieux (1996), we re-weight the control group by quintile bins of the propensity score
to match the distribution of the event group. We consider the event’s impact on income tax dec-
larations and sales tax declarations. For the income tax, we consider a balanced panel of firms
that we can observe for at least four years before and three years after the event, allowing us to
evaluate events happening in event periods p = {2010,2011,2012}. For the sales tax, we consider
should be aware of the informative declarations held by the tax authority about its business activities. Each inter-firmtransaction above the relevant threshold amount needs to be reported by both the seller and buyer (declaration D151).State institutions and credit/debit card companies acting as withholding agents are obliged by law to provide taxpayerswith a receipt stating the amount of tax withheld. Compliance with this information requirement is considered to behigh.
37Incomplete compliance by firms with their reporting obligation is not a concern for our identification, as we seekto identify the impact of actual (observed) third-party reports rather than of reporting obligations, the former effectbeing the policy-relevent one.
38This propensity score is estimated separately for each declaration type and event year/month, using firm type andtax administration dummies, and the two lags of a third-order polynomial of total income and taxable income. Seealso Yagan (2015) for a detailled description of the reweighting procedure.
25

a balanced panel of firms that we can observe for at least five months before and after the event,
allowing us to evaluate events happening in event periods between February 2009 and August
2014.39
Each panel in Figure VI displays the trend in (real) reported taxable income for the event group
(orange dots) and the control group (blue crosses), scaled by the pre-event average, along with the
difference-in-difference coefficient obtained from estimating
yipk = γk +αip +β · I{k ≥ 0,g = E}+uipk. (1)
The unit of observation in this estimation is a firm i in event period p at event time k. For instance, a
firm may be in the control group for events happening in 2010 and 2011, but in the treatment group
for events happening in 2012. Each firm-year observation for this firm will thus appear in the event
dataset three times, for event years 2010, 2011 and 2012. We estimate the firm’s reported taxable
income as a function of event-time dummies γk, firm-event-period fixed effects αip , and the post-
event and treatment group dummy I{k ≥ 0, i ∈ E}.40 The top row (A) of Figure VI corresponds to
the self-employed, and the bottom row (B) corresponds to corporations.
For most firms, the first transacting partner reporting to the tax authority is a supplier, lead-
ing to a D151 cost report about the firm’s purchase. As panels A1 and B1 show, receipt of this
first information report is associated with a 26% increase in reported taxable income for the self-
employed and a 49% increase for corporations. This large effect emerges precisely and entirely
at event time, after otherwise identical trends in the event and control group, which means it is
unlikely to be driven purely by true income growth. A real growth spurt in the event group, if it
occured, would have to be weak and temporary, as the event and control group immediately return
to parallel trends in the post-event period. The smaller effect for the self-employed might be due
to the lower tax rates for these firms, and the presence of an income exemption which allows firms
with true income below the exemption threshold to declare without paying any tax.
Over time, firms gradually become covered by more information reports, such as reports from
their clients (D151 sales). This event, which happens on average a year after the first cost report, is
39Results are robust to considering fewer or more event periods, or omitting the propensity score reweighting.40Contrary to Naritomi (2016), we conduct the estimation at the firm level rather than on the collapsed data, to
estimate the standard errors. The results are qualitatively similar in a simple event study without control group, inwhich we estimate coefficients for each event time. However, reduced statistical power makes the point estimatessignificantly more noisy. Firm-event-period fixed effects and clustering of standard errors at the firm level accountfor potentially repeated appearance of firm-year/firm-month observations. Outcomes are in levels rather than logs,to include the large number of firms with zero values, and winsorized at the 95th percentile to limit the influence ofoutliers.
26

considered in panels A2 and B2. The first sales report is associated with a much smaller increase
in taxable income than the first cost report, likely because part of the relevant transactions have
already been reported to the tax authority in response to the first cost report. The effect size is
again larger for corporations than for the self-employed (25% vs 9%).
Reporting by state institutions or credit/debit card companies (panels A3-B4) has a relatively
homogenous effect on the self-employed and corporations41, leading to a 21-26% increase in re-
ported taxable income in both samples.42 Although most firms are already subject to reporting by
other firms when being first reported by a state institution or card company, these new reports en-
force different margins - sales to state institutions and to final consumers, as opposed to inter-firm
transactions - and should thus have an additional effect on reporting.
In all figures, the event and control group follow similar, almost identical trends until the event,
and then diverge precisely at event time k = 043, until the difference between the two groups
stabilizes at approximately k = 1. In the monthly sales tax data, the event group has a slightly
higher pre-event growth rate than the control group, but the sudden divergence in the event month
still supports a causal interpretation of the effect. Although offering consumers the possibility to
pay by credit/debit card may increase sales, this effect is unlikely to materialize immediately, as
consumers need to acquire the new information and adjust their purchasing behavior. We thus
conclude that the size and timing of the effect is hard to reconcile with a pure growth effect, and
must be at least partly driven by a compliance response to information reporting.
6 Impact of Withholding
Having shown that information reporting increases reported taxable income, this section studies
whether withholding has an impact on compliance beyond the impact generated by associated
information reporting. We use the August 2011 reform of the sales tax withholding rate schedule
to isolate the impact of withholding, holding the information environment constant. We start by
41The effect is likely similar for both firms types, as these events are relevant for firms with higher profit levels,where the self-employed and corporations face similar marginal tax rates.
42Consistent with the fact that firms under-report both sales and costs, the taxable income response to all events isdriven by a similarly-sized increase in reported sales and reported costs, as the numbers in squared brackets demon-strate. Note also that the increase in reported taxable income (reported tax liability for the sales tax) is associated withan increase in the reported profit rate (reported value-added rate for the sales tax). For the event of credit/debit cardreporting (last two figures) we use the reported tax liability (rather than reported taxable income) as outcome variable,and sales tax collected and input tax credits deducted (rather than sales and costs) for the decomposition, as thesevariables are available on the monthly sales tax declarations.
43The only exception to this pattern are corporations receiving a first sales report from other firms (fourth panel),whose trend diverges from the control group at k =−1 rather than k = 0.
27

analyzing the first-stage impact of the reform on realized witholding rates and credit/debit card use,
then conduct a difference-in-difference estimation of the tax payment response to the withholding
rate increase, and finally examine the mechanisms of the withholding impact.
6.1 First Stage and Impact on Card Use
As discussed in section 3.3.2, a reform in August 2011 revised the withholding rate schedule for
the sales tax. Panel A in Figure VII shows that the reform lead to a large increase (approximately a
doubling) of the average withholding rate applied to sales taxpayers. The graph also displays small
jumps every semester, when the withholding rates are revised by the tax authority and communi-
cated to the withholding agents. This suggests a relatively high compliance by withholding agents
(card companies) with the government-assigned withholding rates. To better understand the extent
of deviation between the assigned and realized withholding rate, we predict each firm’s withhold-
ing rate based on its past tax returns and the withholding rate schedule in Table II. As panel B
shows, the predicted rate tracks the realized rate closely, for firms for which we can observe both
rates, but the realized withholding rate is always slightly higher. This is consistent with the fact
that firms can request a lowering of the withholding rate from the tax authority, for instance if they
have losses for several consecutive months.44
Panels C and D investigate whether the reform reduced firms’ propensity to file their sales dec-
laration, or use their credit/debit card machine, which would have limited information reporting
and withholding by card companies. Both the number of sales tax declarations and of credit/debit
card reports (D153 informative declaration by card processing companies) filed with the tax author-
ity are steadily increasing and smooth at reform time. Similarly, the share of sales tax declarations
that can be matched with at least one credit/debit card report and vice-versa does not display a
discontinuity at reform time. In fact, the share of credit/debit card reportees that file sales tax was
decreasing prior to the reform (driven by an increase in the number of credit/debit card reportees),
but then stagnated after the reform. The possibility of reclaiming the tax withheld may have in-
creased withholdee’s propensity to file sales tax. Overall, we conclude that the reform did not
reduce tax filing and credit/debit card marchine usage on the extensive margin.
A remaining concern is that the reform may have decreased the intensity of card marchine
usage. However, as panels E and F show for firms using a card machine (i.e. reported by at least
44There is only a weak behavioral response to the withholding rate notches in reported value-added and the share oflocal sales, suggesting that few firms manipulate the withholding rates by misreporting the relevant line items on theirsales tax declaration.
28

one credit/debit card company), neither the sum of card sales over total sales nor the average over
the firm-specific share of card sales changes discontinuously at reform time. While both series
display a small drop at reform time, this drop is statistically signicant only when considering the
average share of card sales, suggesting it is driven by firms with a relatively small sales volume.
The size of the drop is economically insignificant even in this sample - one percentage point of an
average share of 50%.
This suggests that most firms have not attempted or do not have the market power to refuse
card transactions with the objective of avoiding the withholding rate increase or reducing its scope
of application. We can thus consider the information reporting environment constant around the
reform, and use the reform to isolate the effect of withholding.45
6.2 Difference-in-Difference Estimation
To estimate the impact of the withholding rate increase on total tax payment and other intermediate
outcomes, we conduct a difference-in-difference estimation on the balanced panel of firms which
consistently submitted sales tax declarations during a 30-months window around the reform. Firms
that experienced an increase in the predicted withholding rate between July and August 2011 are
considered treated. The control group consists of firms that experienced no rate increase or are not
subject to withholding.46 Note that the treatment assigment is based on the predicted rather than
the realized increase in the withholding rate, as the latter may be affected by a firm-specific request
or connection to the tax authority which allowed the firm to obtain a lower withholding rate.47 The
predicted rate change depends on value added and the share of local sales in the second semester
of 2010, long before the reform decree was designed in July 2011, so that firms could not possibly
have gamed the system to avoid an increase in the predicted withholding rate.48 We estimate the
effect of the rate increase using the specification
yit = αi + γt +µi · t +β ·Treati ·Postt + εit , (2)
45Any reduction in credit/debit card usage would simply downward bias our difference-in-difference estimatesbelow. Similarly, if the (small number of) firms that reduced card usage after the withholding rate reform were thefirms with the largest potential evasion rents, our estimates would constitute a lower bound on the true complianceimpact of withholding.
46Results are similar but more noisy when excluding firms that are not subject to withholding. We always excludefirms that experience a reduction in their withholding rate, as the small size of this sample does not allow for separatelyestimating the impact of a rate reduction.
47We consider collusion between the withholding agent and the firm unlikely, given the small number of withholdingagents and the intense monitoring they are subject to.
48We do not observe firms starting to revise tax returns for 2010 after the reform was announced.
29
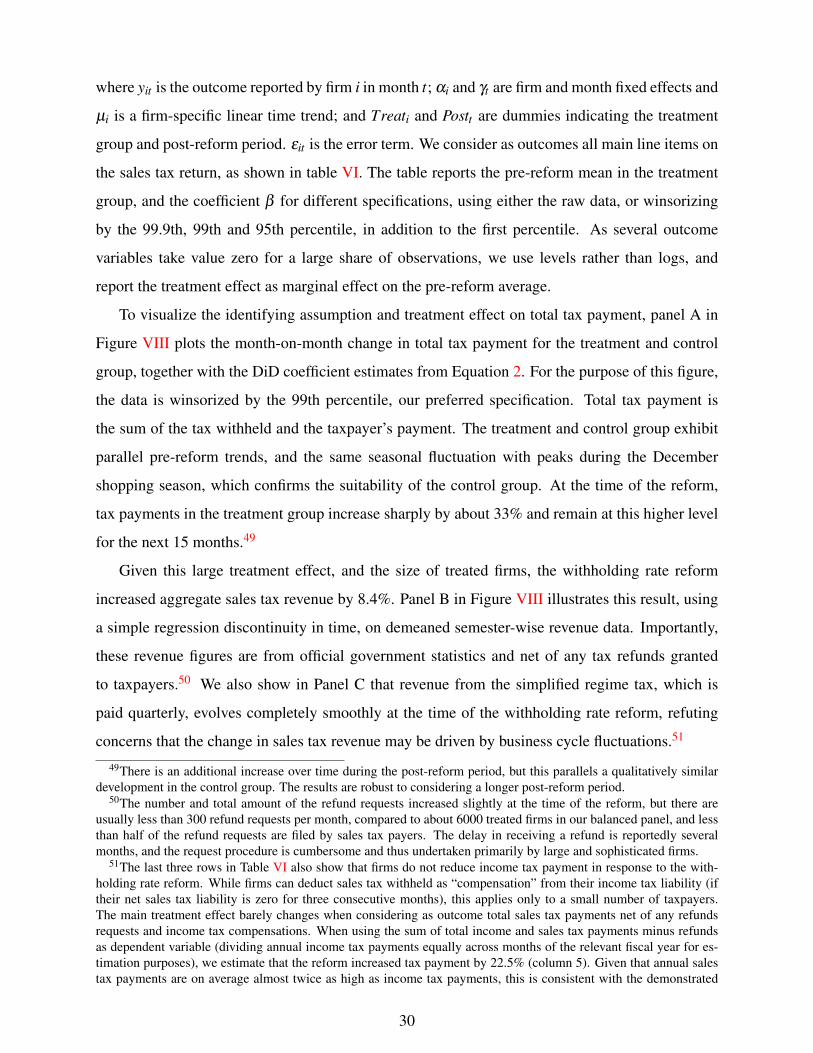
where yit is the outcome reported by firm i in month t; αi and γt are firm and month fixed effects and
µi is a firm-specific linear time trend; and Treati and Postt are dummies indicating the treatment
group and post-reform period. εit is the error term. We consider as outcomes all main line items on
the sales tax return, as shown in table VI. The table reports the pre-reform mean in the treatment
group, and the coefficient β for different specifications, using either the raw data, or winsorizing
by the 99.9th, 99th and 95th percentile, in addition to the first percentile. As several outcome
variables take value zero for a large share of observations, we use levels rather than logs, and
report the treatment effect as marginal effect on the pre-reform average.
To visualize the identifying assumption and treatment effect on total tax payment, panel A in
Figure VIII plots the month-on-month change in total tax payment for the treatment and control
group, together with the DiD coefficient estimates from Equation 2. For the purpose of this figure,
the data is winsorized by the 99th percentile, our preferred specification. Total tax payment is
the sum of the tax withheld and the taxpayer’s payment. The treatment and control group exhibit
parallel pre-reform trends, and the same seasonal fluctuation with peaks during the December
shopping season, which confirms the suitability of the control group. At the time of the reform,
tax payments in the treatment group increase sharply by about 33% and remain at this higher level
for the next 15 months.49
Given this large treatment effect, and the size of treated firms, the withholding rate reform
increased aggregate sales tax revenue by 8.4%. Panel B in Figure VIII illustrates this result, using
a simple regression discontinuity in time, on demeaned semester-wise revenue data. Importantly,
these revenue figures are from official government statistics and net of any tax refunds granted
to taxpayers.50 We also show in Panel C that revenue from the simplified regime tax, which is
paid quarterly, evolves completely smoothly at the time of the withholding rate reform, refuting
concerns that the change in sales tax revenue may be driven by business cycle fluctuations.51
49There is an additional increase over time during the post-reform period, but this parallels a qualitatively similardevelopment in the control group. The results are robust to considering a longer post-reform period.
50The number and total amount of the refund requests increased slightly at the time of the reform, but there areusually less than 300 refund requests per month, compared to about 6000 treated firms in our balanced panel, and lessthan half of the refund requests are filed by sales tax payers. The delay in receiving a refund is reportedly severalmonths, and the request procedure is cumbersome and thus undertaken primarily by large and sophisticated firms.
51The last three rows in Table VI also show that firms do not reduce income tax payment in response to the with-holding rate reform. While firms can deduct sales tax withheld as “compensation” from their income tax liability (iftheir net sales tax liability is zero for three consecutive months), this applies only to a small number of taxpayers.The main treatment effect barely changes when considering as outcome total sales tax payments net of any refundsrequests and income tax compensations. When using the sum of total income and sales tax payments minus refundsas dependent variable (dividing annual income tax payments equally across months of the relevant fiscal year for es-timation purposes), we estimate that the reform increased tax payment by 22.5% (column 5). Given that annual salestax payments are on average almost twice as high as income tax payments, this is consistent with the demonstrated
30

6.3 Mechanisms of Withholding Impact
We investigate two potential mechanisms for the withholding impact: a default mechanism, whereby
incomplete reclaim of the tax withheld and incomplete payment of declared tax liabilities mean that
a withholding rate increase mechanically translates into higher tax payment; and a salience mecha-
nism, whereby the withholding rate increase raises the salience of enforcement, and hence reported
liabilities.
As panel A in Figure IX shows, the share of withholdees making a reclaim on their sales tax
declaration, conditional on having a non-zero gross tax liability, is only around 50% before the
reform, and drops close to 40% at the time of the reform. This drop occurs because the reform
increases the number of taxpayers subject to withholding, and many of the new withholdees are
likely unfamiliar with the reclaim procedure. As these new withholdees start to reclaim the tax
gradually, the share of withholdees making a reclaim increases, and eventually surpases the pre-
reform share of reclaimers by approximately 10 percentage points. The average share of withheld
tax reclaimed, as displayed in the second panel, follows a similar pattern but is much higher. The
share fluctuates between 80% and 95% before the reform, then drops sharply at the time of the
reform, and recovers gradually. Given the low share of reclaimers and high share of tax reclaimed
in total tax withheld, it seems that incomplete reclaim applies mostly to small firms. Similarly,
non-payment or late payment of outstanding tax liabilities is more common among smaller firms.
Accordingly, columns 1 and 2 in table VII show that the withholding rate increase generated a
larger increase in tax payment for the self-employed (small firms) than for corporations.52
A back-of-the-envelope calculation yields that the default mechanism through incomplete re-
claim and incomplete payment of tax liabilities can explain at most 40% of the total increase in
tax payment after the withholding rate reform. This suggests that a second mechanism must be
at play, which is analyzed in the bottom panels of Figure IX. The panels display results from es-
timating Equation 2, as in Figure VIII, with different outcome variables, as indicated in the panel
titles. Panels C and D show that the reform did not affect the amount of sales tax collected (nor
the amount of total reported sales), but led to a 3% reduction in reported input tax credits in the
treatment group. Combining these two results means that the reported gross tax liability in the
increase of sales tax payments by 33% and even a slight increase of income tax payments. Indeed, to the extent thattaxpayers are internally consistent, i.e. report the same tax base on the income and sales tax declaration, an increasein sales tax compliance would spillover to the income tax.
52We chose the firm type division as it is based on a time-invariant characteristics that is unlikely to be misreported.Results are similar when splitting the sample by median pre-reform revenue.
31

treatment group increased by 17% (panel E). This is consistent with the hypothesis that firms were
evading sales tax by over-reporting input tax credits prior to the reform, but started to report more
accurately after the withholding rate was increased.53 This reporting effect accounts for another
50% of the total increase in tax payment after the withholding rate reform.
The findings raise the question of what drives the improvement in reporting, given that en-
forcement by the tax authority has not increased, as evidenced in panel F by the relatively constant
audits rates. One possibility is that firms increase reported taxable income when reclaiming the tax
withheld, in anticipation of a higher probability of cross-checks or monitoring. However, columns
3 and 4 of table VII show that firms which never make any reclaim experience a similar increase
in reported tax liability as firms making a reclaim.
Another possibility is that a withholding rate increase raises the salience and hence the per-
ceived intensity of enforcement for some taxpayers, without any change in true enforcement.
To see this, it is important to know that firms learn from their daily (or occassionally monthly)
credit/debit card machine statements (cf. Figure XII) the volume of card sales processed, any com-
missions applied by the card processors, and the amount of tax withheld and transmitted to the tax
authority. Firms experiencing an increase in the withholding rate from a positive rate to a larger rate
would notice the rate increase on their card machine statement only if they pay close attention to
the amount of transactions processed and the amount of tax withheld, to back out the withholding
rate applied. Firms experiencing an increase in the withholding rate from zero, however, are much
more likely to notice the rate increase, as the box for tax withheld on their card machine statement
switches from being blank to carrying a number. Noticing the application of withholding for the
first time may raise the salience of possible enforcement interventions like desk audits, and lead
firms to increase compliance.
Consistent with this, columns 5 and 6 in Table VII show that firms experiencing a withholding
rate increase from zero exhibit a larger increase both in their reported tax liability and in their total
tax paid than firms experiencing a similarly-sized rate increase from a positive to a larger rate.54
53We also find a similar increase in reported taxable income after the introduction of tax withholding by credit/debitcard companies for the purpose of income tax compliance in 2015 (a reform which again maintained the informationreporting environment constant). The results are shown in Appendix Figure XI.
54We exclude from the “From-Zero Rate Increase” group all firms that experience the maximum rate increase ofsix percentage points, to ensure that the average rate increase in this group is not larger than the average rate increaseamong other treated firms.This significant interaction does not disappear when additionally interacting with the self-employed and reclaimer indicator, and is always larger than the latter. An alternative explanation for our result mightposit that firms are unaware of their true tax liability and thus report with error, but start to report more correctlyafter the withholding rate reform, as the withholding system provides them with information of their true tax liability.However, this explanation would be consistent with our results only if firms systematically (but non-strategically)
32
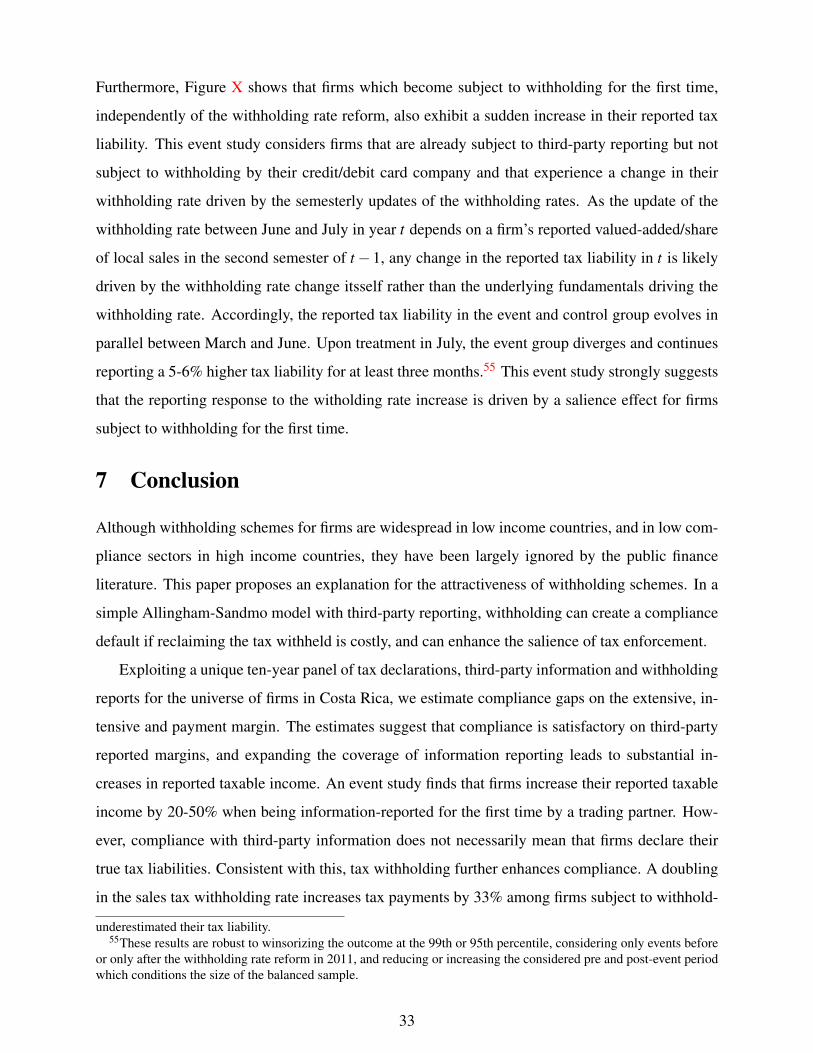
Furthermore, Figure X shows that firms which become subject to withholding for the first time,
independently of the withholding rate reform, also exhibit a sudden increase in their reported tax
liability. This event study considers firms that are already subject to third-party reporting but not
subject to withholding by their credit/debit card company and that experience a change in their
withholding rate driven by the semesterly updates of the withholding rates. As the update of the
withholding rate between June and July in year t depends on a firm’s reported valued-added/share
of local sales in the second semester of t−1, any change in the reported tax liability in t is likely
driven by the withholding rate change itsself rather than the underlying fundamentals driving the
withholding rate. Accordingly, the reported tax liability in the event and control group evolves in
parallel between March and June. Upon treatment in July, the event group diverges and continues
reporting a 5-6% higher tax liability for at least three months.55 This event study strongly suggests
that the reporting response to the witholding rate increase is driven by a salience effect for firms
subject to withholding for the first time.
7 Conclusion
Although withholding schemes for firms are widespread in low income countries, and in low com-
pliance sectors in high income countries, they have been largely ignored by the public finance
literature. This paper proposes an explanation for the attractiveness of withholding schemes. In a
simple Allingham-Sandmo model with third-party reporting, withholding can create a compliance
default if reclaiming the tax withheld is costly, and can enhance the salience of tax enforcement.
Exploiting a unique ten-year panel of tax declarations, third-party information and withholding
reports for the universe of firms in Costa Rica, we estimate compliance gaps on the extensive, in-
tensive and payment margin. The estimates suggest that compliance is satisfactory on third-party
reported margins, and expanding the coverage of information reporting leads to substantial in-
creases in reported taxable income. An event study finds that firms increase their reported taxable
income by 20-50% when being information-reported for the first time by a trading partner. How-
ever, compliance with third-party information does not necessarily mean that firms declare their
true tax liabilities. Consistent with this, tax withholding further enhances compliance. A doubling
in the sales tax withholding rate increases tax payments by 33% among firms subject to withhold-
underestimated their tax liability.55These results are robust to winsorizing the outcome at the 99th or 95th percentile, considering only events before
or only after the withholding rate reform in 2011, and reducing or increasing the considered pre and post-event periodwhich conditions the size of the balanced sample.
33

ing and by 8% in aggregate. This effect is driven by incomplete reclaim of the tax withheld, and
increased reporting. We find no evidence that withholding reduces output, which suggests that the
liquidity costs associated with the regime are neglegible.
Given the large compliance impact of withholding, investigating the optimal scope for with-
holding would be a fruitful area for future research. In addition to state institutions and credit/debit
card companies, which currently act as withholding agents in Costa Rica, the government could
also nominate other financial institutions and large firms as withholding agents, while ensuring
that a transaction is not covered by multiple withholding agents. However, increasing the scope
of withholding can raise monitoring costs for the government and administrative costs for with-
holding agents. The costs are likely smallest for firms that are already large taxpayers and thus
subject to increased government monitoring, and those that have sophisticated accounting depart-
ments able to deal with the additional paperwork required. In some countries, for instance China,
the government also provides withholding agents with financial incentives as a share of the tax
withheld.
Policy makers should also take into account the possibility that withholding generates spillover
effects on firms along the supply chain - as it changes treated firms’ reported tax liabilities, and
on competitor firms in the same sector or neighborhood as firms subject to withholding - as it
changes withholdees’ effective tax liability. Analyzing these spillovers would allow decomposing
the aggregate revenue impact of withholding into the direct effect on treated firms and the potential
indirect effects.
34
ReferencesAllingham, Michael G., and Agnar Sandmo. 1972. “Income Tax Evasion: A Theoretical Analysis.” Journal of
Public Economics, 1: 323–338.
Almunia, Miguel, and David Lopez Rodriguez. 2015. “Under the Radar: The Effects of Monitoring Firms on TaxCompliance.” Social Science Research Network.
Bachas, Pierre, and Mauricio Soto. 2016. “Not(ch) Your Average Tax System: Corporate Taxation Under WeakEnforcement.” Mimeo.
Barr, Michael S., and Jane K. Dokko. 2008. “Paying to save: tax withholding and asset allocation among low- andmoderate-income taxpayers.” Board of Governors of the Federal Reserve System (U.S.) Finance and EconomicsDiscussion Series 2008-11.
Besley, Timothy, and Torsten Persson. 2013. “Taxation and Development.” In Handbook of Public Economics.Vol. 5, , ed. Alan J Auerbach, Raj Chetty, Martin Feldstein and Emmanuel Saez. Newnes.
Best, Michael, Anne Brockmeyer, Henrik Kleven, Johannes Spinnewijn, and Mazhar Waseem. 2015. “Produc-tion vs Revenue Efficiency with Low Tax Compliance: Theory and Evidence from Pakistan.” Journal of PoliticalEconomy, 123(6): 1311–1355.
Best, Michael Carlos. 2014. “Salary Misreporting and the Role of Firms in Workers’ Responses to Taxes: Evidencefrom Pakistan.” Mimeo.
Best, Michael Carlos, and Henrik Jacobsen Kleven. 2015. “Housing Market Responses to Transaction Taxes: Evi-dence from Notches and Stimulus in the UK.” Mimeo.
Brockmeyer, Anne, Marco Hernandez, Spencer Smith, and Stewart Kettle. 2015. “Casting the Tax Net Wider:Experimental Evidence from Costa Rica.” Mimeo.
Bruhn, Miriam, and David McKenzie. 2014. “Entry Regulation and the Formalization of Microenterprises in De-veloping Countries.” World Bank Research Observer, 29(2): 186–201.
Carillo, Paul, Shahe Emran, and Anita Rivadeneira. 2012. “Do cheaters bunch together? Profit taxes, withholdingrates and tax evasion.” Mimeo.
Carrillo, Paul, Dina Pomeranz, and Monica Singhal. 2016. “Dodging the Taxman: Firm Misreporting and Limitsto Tax Enforcement.”
Chetty, Raj, Adam Looney, and Kory Kroft. 2009. “Salience and Taxation: Theory and Evidence.” AmericanEconomic Review, 99(4): 1145–1177.
Chetty, Raj, John Friedman, Tore Olsen, and Luigi Pistaferri. 2011. “Adjustment Costs, Firm Responses, andMicro vs. Macro Labor Supply Elasticities: Evidence from Danish Tax Records.” Quarterly Journal of Economics,126: 749–804.
Chetty, Raj, John N. Friedman, SÞren Leth-Petersen, Torben Heien Nielsen, and Tore Olsen. 2014. “Activevs. Passive Decisions and Crowd-Out in Retirement Savings Accounts: Evidence from Denmark.” The QuarterlyJournal of Economics, 129(3): 1141–1219.
Del Carpio, Lucia. 2014. “Are the Neighbors Cheating? Evidence from Social Norm Experiment on Property Taxesin Peru.” Mimeo.
de Mel, Suresh, David McKenzie, and Christopher Woodruff. 2013. “The Demand for, and Consequences of,Formalization among Informal Firms in Sri Lanka.” American Economic Journal: Applied Economics, 5(2): 122–50.
DiNardo, John, Nicole M. Fortin, and Thomas Lemieux. 1996. “Labor Market Institutions and the Distributoin ofWages, 1973-1992: A Semiparametric Approach.” Econometrica, 64(5): 1001–1044.
35

Ferraz, Claudio, Frederico Finan, and Dimitri Szerman. 2016. “Procuring Firm Growth: The Effects of Govern-ment Purchases on Firm Dynamics.” Mimeo.
Finkelstein, Amy. 2009. “E-ztax: Tax Salience and Tax Rates.” The Quarterly Journal of Economics, 124(3): 969–1010.
Fisman, Raymond, and Shang-Jin Wei. 2004. “Tax Rates and Tax Evasion: Evidence from "Missing Im-ports" in China.” Journal of Political Economy, 112(2): 471–500.
Gandhi, Ashvin, and Michael Kuehlwein. 2014. “Reexamining Income Tax Overwithholding as a Response toUncertainty.” Public Finance Review.
Gordon, Roger, and Wei Li. 2009. “Tax structures in developing countries: Many puzzles and a possible explanation.”Journal of Public Economics, 93(7-8): 855–866.
Hacienda. 2015. “Incumplimiento Tributario en Impuestos sobre la Renta y Ventas, 2010-2013.” Ministerio de Ha-cienda, Costa Rica.
Highfill, Jannett, Douglas Thorson, and William V. Weber. 1998. “Tax Overwithholding as a Response To Uncer-tainty.” Public Finance Review, 26(4): 376–391.
Hilger, Nathaniel G. 2014. “Parental Job Loss and Children’s Long-Term Outcomes: Evidence from 7 Million Fa-thers’ Layoffs.” Mimeo.
IRS. 2012. “Tax Year 2006 Tax Gap Estimates.” Internal Revenue Service. FS-2012-6.
Johnson, Eric J., and Daniel Goldstein. 2003. “Do Defaults Save Lives?” Science, 302(5649): 1338–1339.
Keen, Michael. 2008. “VAT, tariffs, and withholding: Border taxes and informality in developing countries.” Journalof Public Economics, 92(10-11): 1892–1906.
Keen, Michael, and Joel Slemrod. 2016. “Optimal Tax Administration.” National Bureau of Economic ResearchWorking Paper 22408.
Kleven, Henrik. 2016. “Bunching.” Annual Review of Economics, forthcoming, 8.
Kleven, Henrik Jacobsen, Claus Thustrup Kreiner, and Emmanuel Saez. 2016. “Why Can Modern GovernmentsTax So Much? An Agency Model of Firms as Fiscal Intermediaries.” Economica, 83(330): 219–246.
Kleven, Henrik Jacobsen, Martin B. Knudsen, Claus Thustrup Kreiner, Søren Pedersen, and Emmanuel Saez.2011. “Unwilling or Unable to Cheat? Evidence From a Tax Audit Experiment in Denmark.” Econometrica,79(3): 651–692.
Kleven, Henrik J., and Mazhar Waseem. 2013. “Using Notches to Uncover Optimization Frictions and StructuralElasticities: Theory and Evidence from Pakistan.” Quarterly Journal of Economics, 128: 669–723.
Kopczuk, Wojciech, and Joel Slemrod. 2006. “Putting Firms into Optimal Tax Theory.” American Economic ReviewPapers and Proceedings, 96(2): 130–134.
Kopczuk, Wojciech, Justin Marion, Erich Muehlegger, and Joel Slemrod. 2016. “Does Tax-Collection InvarianceHold? Evasion and the Pass-Through of State Diesel Taxes.” American Economic Journal: Economic Policy,8(2): 251–86.
Kumler, Todd, Eric Verhoogen, and Judith A. Frías. 2015. “Enlisting Workers in Improving Payroll-Tax Compli-ance: Evidence from Mexico.” NBER Working Paper 19385.
Madrian, Brigitte C., and Dennis F. Shea. 2001. “The Power of Suggestion: Inertia in 401(k) Participation andSavings Behavior.” The Quarterly Journal of Economics, 116(4): 1149–1187.
Naritomi, Joana. 2016. “Consumers as Tax Auditors.” Mimeo.
36

OECD. 2009. “Withholding and information reporting regimes for small or medium-sized businesses and self-employed taxpayers, Information Note.” OECD.
Rijkers, Bob, Leila Baghdadi, and Gael J. R. F. Raballand. 2015. “Political connections and tariff evasion : evi-dence from Tunisia.” The World Bank Policy Research Working Paper Series 7336.
Saez, Emmanuel. 2010. “Do Taxpayers Bunch at Kink Points?” American Economic Journal: Economic Policy,2(3): 180–212.
Samanamud, Enrique. 2013. “Estudio comparado de los regimenes de retenciones y percepciones del IVA e impuestoa la renta en America Latina y el Caribe.” Inter-American Centre of Tax Administrations.
Seim, David. 2015. “Behavioral Responses to an Annual Wealth Tax: Evidence from Sweden.” Mimeo.
Slemrod, Joel. 2008. “Does It Matter Who Writes the Check to the Government? The Economics of Tax Remittance.”National Tax Journal, 61(2): 251–75.
Slemrod, Joel B., Brett Collins, Jeffrey L. Hoopes, Daniel H. Reck, and Michael Sebastiani. 2015. “Does Credit-Card Information Reporting Improve Small-Business Tax Compliance?” Mimeo.
Soos, Pirosko. 1990. “Self-employed evasion and tax withholding: a comparative study and analysis of the issues.”UC Davis Law Review, 24(107): 107–193.
Thaler, Richard, and Shlomo Benartzi. 2004. “Save more tomorrow: Using behavioral economics to increase em-ployee saving.” The Journal of Political Economy, 112(1): 164–187.
White, Richard A., Paul D. Harrison, and Adrian Harrell. 1993. “The Impact of Income Tax Withholding onTaxpayer Compliance: Further Empirical Evidence.” Journal of the American Taxation Associationl, 63–78.
Yagan, Danny. 2015. “Capital Tax Reform and the Real Economy: The Effects of the 2003 Dividend Tax Cut.”American Economic Review, forthcoming.
Zucman, Gabriel. 2013. “The Missing Wealth of Nations: Are Europe and the U.S. net Debtors or net Creditors?*.”The Quarterly Journal of Economics, 128(3): 1321–1364.
37

TABLE I: INCOME TAX SCHEDULE
2006 2007 2008 2009 2010 2011 2012 2013 2014 2015
Panel A: Self-Employed
Kink 1 1,858 2,074 2,252 2,599 2,747 2,890 3,042 3,171 3,339 3,522
Kink 2 2,775 3,097 3,362 3,880 4,102 4,316 4,543 4,735 4,986 5,259
Kink 3 4,629 5,167 5,609 6,473 6,843 7,199 7,577 7,898 8,317 8,773
Kink 4 9,276 10,354 11,241 12,972 13,713 14,427 15,185 15,827 16,667 17,581
Panel B: Corporations
Notch 1 27,811 31,043 33,701 38,891 41,112 43,253 45,525 47,451 49,969 52,710
Notch 2 55,943 62,444 67,791 78,231 82,698 87,004 91,573 95,447 100,513 106,026
Notes: The table shows the income tax schedule for the years 2006 to 2015. Amounts are in tousands ofCosta Rican colones (CRC). Panel A shows the location of the kinks on taxable income that separate the fivetax brackets for the self-employed. The tax is applied to taxable income at marginales rates of 0, 10, 15, 20and 25% respectively for the first to fifth tax bracket. Panel B shows the location of the notches on revenuethat separate the three tax brackets for corporations. The tax is applied to taxable income at average ratesof 10, 20 and 30% respectively for the first to third tax bracket. For more information on the tax base, taxschedule and the filing procedure, see http://www.hacienda.go.cr/contenido/12994-regimen-tradicional.
TABLE II: WITHHOLDING RATE SCHEDULE FOR SALES TAX
Withholding Rate0 1 2 3 4 5 6
Base before 08/2011: Value-Added Rate ≤ 5 20 30 40 55 75 ∞
Base since 08/2011: Share of Local Sales ≤ 0 - - 50 - - 100
Notes: The table shows the withholding rate which credit/debit card companies apply to the sales of theirsales-tax-liable clients. Prior to August 2011, the average withholding rate was determined by a notchedschedule on value-added, with notches at value-added rates of 5, 20, 30, 40, 55 and 75%, and resultingwithholding rates between 0 and 6%. Since August 2011, the schedule has been consolidated to threewithholding rates of 0, 3 and 6%. The rates are determined by a notched schedule on the share of local sales,with a notch at 50%.
38

TABLE III: INFORMATIVE DECLARATIONS TO TAX AUTHORITY
(1) (2) (3) (4) (5) (6)Form Purpose Record Type Coverage of Coverage of % Matched With
Corporations Self-Employed Income Tax Records
D151 Reporting of firm-firm transactions Sales 46.5 38.9 37.0N=17,125,017 (54.3% sales) Purchases 49.3 54.1 65.5
D158 Reporting of transactions at auctions Sales 0.5 1.7 16.4N=369,002 (71.0% sales) Purchases 0.3 0.9 23.5
D150 Withholding on purchases State purchases 8.4 5.0 78.7N=759,391 (98.5% state purchase) Private purchases 0.22 0.08 39.9
D153 Withholding on card transactions for GST Sales 11.5 [26.7] 5.8 [18.4] 67.8 [48.7]N=4,198,384
Notes: This table provides information about the nature and coverage of third-party informative declarations used by the tax authority in Costa Rica, for2006 to 2014. Columns 1-3 provide the form number, its purpose, the number of observations and the record type. Columns 4 and 5 display the shareof income tax filers covered by the different third-party declarations, distinguishing corporations and the self-employed. Column 6 displays the share ofinformative declarations which are matched with an income tax declaration. In the last row, the shares in brackets refer to the match rate with the monthlysales tax declarations for 2008-2014. The shares are calculated on the pooled data for all years/months. All declarations identify the reporter and taxpayer bytheir administration-internal anonymous tax ID, and provide information on the transaction amount, and (where applicable) the amount of the tax withheld.Amounts are accrued. Since January 2012, all declarations must be prepared using the DECLAR@7 software. Sanctions for non-compliance with theobligation to submit informative declarations are specified in the Codigo de Normas y Procedimientos Tributarios. All declarations are annual, exceptD153, which is monthly. D151 requires reporting of transactions >2.5 mio CRC annually with a transaction partner, and transactions of >50,000 CRCannually for rent, commissions, professional services or interests. For D150, the withholding rate is 2% and 3% respectively for state and private purchases.For D153, the withholding rate is firm specific, following the schedule in Table II. For more information on the filing of informative declarations, seehttp://www.hacienda.go.cr/contenido/12997-declaraciones-informativas.
39
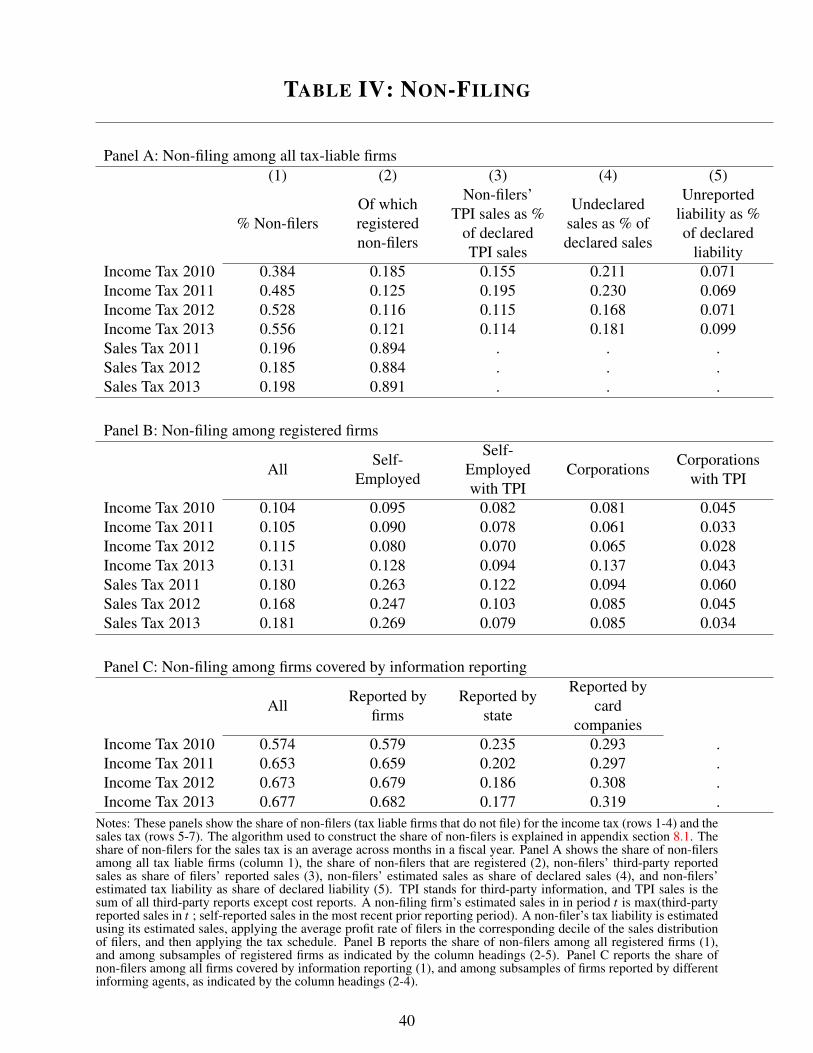
TABLE IV: NON-FILING
Panel A: Non-filing among all tax-liable firms(1) (2) (3) (4) (5)
% Non-filersOf whichregisterednon-filers
Non-filers’TPI sales as %
of declaredTPI sales
Undeclaredsales as % ofdeclared sales
Unreportedliability as %of declared
liabilityIncome Tax 2010 0.384 0.185 0.155 0.211 0.071Income Tax 2011 0.485 0.125 0.195 0.230 0.069Income Tax 2012 0.528 0.116 0.115 0.168 0.071Income Tax 2013 0.556 0.121 0.114 0.181 0.099Sales Tax 2011 0.196 0.894 . . .Sales Tax 2012 0.185 0.884 . . .Sales Tax 2013 0.198 0.891 . . .
Panel B: Non-filing among registered firms
AllSelf-
Employed
Self-Employedwith TPI
CorporationsCorporations
with TPI
Income Tax 2010 0.104 0.095 0.082 0.081 0.045Income Tax 2011 0.105 0.090 0.078 0.061 0.033Income Tax 2012 0.115 0.080 0.070 0.065 0.028Income Tax 2013 0.131 0.128 0.094 0.137 0.043Sales Tax 2011 0.180 0.263 0.122 0.094 0.060Sales Tax 2012 0.168 0.247 0.103 0.085 0.045Sales Tax 2013 0.181 0.269 0.079 0.085 0.034
Panel C: Non-filing among firms covered by information reporting
AllReported by
firmsReported by
state
Reported bycard
companiesIncome Tax 2010 0.574 0.579 0.235 0.293 .Income Tax 2011 0.653 0.659 0.202 0.297 .Income Tax 2012 0.673 0.679 0.186 0.308 .Income Tax 2013 0.677 0.682 0.177 0.319 .
Notes: These panels show the share of non-filers (tax liable firms that do not file) for the income tax (rows 1-4) and thesales tax (rows 5-7). The algorithm used to construct the share of non-filers is explained in appendix section 8.1. Theshare of non-filers for the sales tax is an average across months in a fiscal year. Panel A shows the share of non-filersamong all tax liable firms (column 1), the share of non-filers that are registered (2), non-filers’ third-party reportedsales as share of filers’ reported sales (3), non-filers’ estimated sales as share of declared sales (4), and non-filers’estimated tax liability as share of declared liability (5). TPI stands for third-party information, and TPI sales is thesum of all third-party reports except cost reports. A non-filing firm’s estimated sales in in period t is max(third-partyreported sales in t ; self-reported sales in the most recent prior reporting period). A non-filer’s tax liability is estimatedusing its estimated sales, applying the average profit rate of filers in the corresponding decile of the sales distributionof filers, and then applying the tax schedule. Panel B reports the share of non-filers among all registered firms (1),and among subsamples of registered firms as indicated by the column headings (2-5). Panel C reports the share ofnon-filers among all firms covered by information reporting (1), and among subsamples of firms reported by differentinforming agents, as indicated by the column headings (2-4).
40

TABLE V: MISREPORTING
(1) (2) (3) (4)
Sales Reports Cost Reports
Self-Employed Corporations Self-Employed Corporations
Panel A: Underreporting IT1) % Underreporters IT vs TPI 16.9 14.2 50.6 29.82) Unreported Amount 270.6 2799.7 271.1 1021.13) Underreporters’ TPI 652.9 7010.6 953.2 3603.34) Total TPI 1859.8 20664.1 1507.5 16421.45) Unreported Amount(% UR TPI) 41.4 39.9 28.4 28.36) Unreported Amount(% TPI) 14.5 13.5 18 6.2
Panel B: Underreported Liability7) Unreported Tax IT 12.7 71.18) Underreporters’ Reported Tax 3.3 51.89) Total Reported Tax 26.6 800.110) Unreported Tax (% UR Tax) 385.6 137.411) Unreported Tax (% Tax) 47.7 8.9
Panel C: Internal Consistency12) % Underreporters IT vs OTPI 3.6 5.3 17 8.313) % Overreporters IT vs OTPI 43.5 62.9 81.1 90.214) % Underreporters IT vs ST 9.4 9.6 14 5.915) % Overreporters IT vs ST 53.8 61.6 83.5 93.6
Notes: This table displays estimates of compliance gaps between third-party reports and self-reports for theincome tax. Third-party reported sales for the income tax is the sum of sales reported under D150, D151,D158, D153, and exports. Third-party reported costs for the income tax is the sum of costs reported underD151 and D158. Third-party reported sales for the sales tax is the sum of sales reported on D153 declara-tions. Columns 1-2 are for sales reports, and columns 3-4 for cost reports. In both analyses, we considerseparately the self-employed (columns 1 and 3) and corporations (columns 2 and 4). All figures in this tableare either in percent (as indicated), or in billions of constant 2015 CRC. Underreporters (overreporters) arefirms reporting an amount at least 0.25% smaller (larger) than the relevant comparison amount. Rows 1-6examine underreporting of third-party reported sales/costs. They show the share of under-reporters amongfirms subject to third-party reporting for the income tax (1), the amount unreported (as compared to third-party reports) (2), the total third-party reports for under-reporters (3), the total third-party reports for thefull sample (4), and the unreported amount as a share of the underreporters third-party reports (5), and asa share of total third-party reports (6). Rows 7-11 convert unreported sales into tax liabilities. They showan estimate of the unreported tax liability (7), the underreporters’ reported tax liability (8), and the totalreported tax liability (9), and the unreported tax as share of the underreporters’ reported tax (10), and as ashare of the total reported tax (11). The estimation of the unreported (gross) tax liability assumes that theprofit rate on unreported sales is the same as the profit rate on reported sales (capped at 100%), and appliesthe tax schedule as displayed in Table I. Rows 12-15 analyze internal constency in filing. Rows 12 and 13compare self-reports for the income tax to a firm’s own third-party reports (third-party reports submitted bythe firm itsself about transactions with other firms), and rows 14 and 15 compare income tax reports to salestax reports. All calculations are based on 2010 data. Results are similar for other years, and when focusingonly on firms that file according to the regular fiscal period.
41

TABLE VI: IMPACT OF WITHHOLDING RATE INCREASE
(1) (2) (3) (4) (5) (6)Pre-Reform Mean Pre-Reform Mean Basline Winsorized Winsorized Winsorized
Treated, 99.9th pctile Treated, 99th pctile Raw Data 99.9th pctile 99th pctile 95th pctile
Total Sales Reported 71560.380 51664.220 0.200 0.042∗ 0.002 0.003(996.541) (329.431) (0.293) (0.018) (0.008) (0.006)
Sales Tax Collected 5114.702 3782.567 0.030 -0.008 -0.012 0.011(59.499) (19.500) (0.023) (0.019) (0.008) (0.006)
Input Tax Credits 4309.865 3192.292 -0.087∗ -0.068∗∗ -0.038∗∗∗ -0.036∗∗∗
(43.137) (14.898) (0.041) (0.022) (0.010) (0.006)Import Credits 1509.174 882.316 -0.196∗ -0.120∗∗∗ -0.024 -0.076∗∗∗
(22.230) (7.134) (0.081) (0.036) (0.020) (0.017)Local Purchase Credits 2752.913 2064.536 -0.559 -0.055∗ -0.029∗∗ -0.031∗∗∗
(27.976) (8.237) (0.546) (0.023) (0.010) (0.006)Gross Tax Liability 844.611 548.881 0.096 0.160∗∗∗ 0.167∗∗∗ 0.216∗∗∗
(21.245) (5.437) (0.061) (0.030) (0.021) (0.015)
Withholding Base 10827.196 7293.079 -0.032 0.018 0.017 -0.031∗∗∗
(146.869) (37.665) (0.035) (0.021) (0.010) (0.008)Withheld Tax 146.758 78.916 1.419∗∗∗ 1.872∗∗∗ 2.423∗∗∗ 2.667∗∗∗
(5.691) (1.222) (0.375) (0.191) (0.093) (0.063)Withheld Tax Reclaims 137.523 67.647 1.464∗∗ 1.533∗∗∗ 2.141∗∗∗ 2.309∗∗∗
(4.965) (1.055) (0.543) (0.172) (0.109) (0.075)Net Tax Liability 703.196 458.880 -0.191 -0.068 -0.049∗ -0.048∗∗
(18.402) (4.549) (0.161) (0.043) (0.023) (0.015)Compensation Requests 15.696 5.116 0.763∗∗ 0.476∗ 0.123 0.000
(0.508) (0.108) (0.281) (0.208) (0.163) (.)Final Tax To Pay 664.067 419.057 -0.222 -0.094∗ -0.115∗∗∗ -0.111∗∗∗
(17.415) (4.084) (0.182) (0.047) (0.024) (0.015)Taxpayer Sales Tax Payment 646.775 423.248 -0.251 -0.108∗ -0.098∗∗∗ -0.100∗∗∗
(17.431) (4.144) (0.195) (0.047) (0.024) (0.016)Total Sales Tax Payment 802.957 528.147 0.158 0.254∗∗∗ 0.326∗∗∗ 0.519∗∗∗
(20.679) (5.215) (0.083) (0.034) (0.022) (0.018)
Tot. Payment - Refund 802.576 527.766 0.160 0.253∗∗∗ 0.327∗∗∗ 0.518∗∗∗
(20.672) (5.212) (0.084) (0.034) (0.022) (0.018)Tot. Payment - Refund - IT Comp. 784.958 512.144 0.174∗ 0.257∗∗∗ 0.327∗∗∗ 0.546∗∗∗
(20.600) (5.179) (0.079) (0.034) (0.023) (0.019)ST + IT - Refund 1237.233 813.674 0.090 0.145∗∗∗ 0.225∗∗∗ 0.347∗∗∗
(31.134) (8.589) (0.060) (0.026) (0.016) (0.013)
Observations 1069680 1069680 1069680 1069680 1069680 1069680R2 0.001 0.008 0.962 0.916 0.899 0.880
Notes: This table displays pre-reform means in the treatment group (columns 1 and 2) and OLS estimatesof the impact of the withholding rate increase on firms in the treatment group (firms with a predicted rateincrease at reform time), as per equation 2 (columns 3-6). The rows reflect different outcome variables, thecolumns reflect different specifications, as per the row and column titles. For columns 1 and 2, the datais winsorized at the 99.9th and 99th percentile respectively. Columns 3-6 allow for year and firm FE anda firm-specific linear time trend. Point estimates are marginal effects compared to the pre-reform average.Standard errors, clustered at the taxpayer level, are in parantheses. All amounts are in ’000 CRC, deflatedwith base in 01/2015 (1USD=530CRC). All outcome variables correspond to boxes on the sales tax returnform, except the variables in the last three rows. Compensation requests are used to deduct any net credits orunreclaimed tax withheld from previous tax periods or from other taxes. Taxpayer payment is the paymentmade by the taxpayer at the end of each month. Total payment is the sum of taxpayer payment and anytax withheld. Total payment - refund subtracts any refund that taxpayers may have claimed on a separateform (refund request form 402). Total tpayment - refund - IT compensation additionally subtracts anycompensation requests that the taxpayer requested on her income tax declaration. ST + IT - refund is thesum of total sales tax and total income tax payment (including tax withheld) minus any refund requested.
42

TABLE VII: HETEROGENEITY OF WITHHOLDING IMPACT
(1) (2) (3) (4) (5) (6)Payment Liability Payment Liability Payment Liability
Treat 0.290∗∗∗ 0.137∗∗∗ 0.328∗∗∗ 0.188∗∗∗ 0.231∗∗∗ 0.116∗∗∗
(0.021) (0.018) (0.021) (0.017) (0.018) (0.015)
Treat x Self-Employed 0.554∗∗∗ 0.256∗∗∗
(0.042) (0.042)
Treat x Never-Reclaimer 0.261∗∗∗ -0.059(0.078) (0.072)
Treat x From-Zero WHR Increase 1.681∗∗∗ 0.400∗∗∗
(0.167) (0.135)
Observations 1069680 1069680 1069680 1069680 1010120 1010120R2 0.757 0.743 0.730 0.737 0.750 0.743
Notes: This table displays OLS estimates of the impact of the withholding rate increase on firms in thetreatment group (firms with a predicted rate increase at reform time), as per equation 2. The columnsdenote the outcome variables, which are winsorized at the 99th percentile. Payment is total tax payment(constructed) and liability is gross tax liability, as in table VI. All amounts are in ’000 CRC, deflated withbase in 01/2015 (1USD=530CRC). The treatment and control group are specified as in table VI. Never-Reclaimers are treated firms that do not make any reclaim, compensation request or refund request duringthe post-reform period. The label “From-Zero Withholding Rate Increase” indicates that firms experiencean increase of the predicted withholding rate from zero to a positive rate at reform time, as opposed to othertreated firms that were already subject to a non-zero withholding rate prior to reform time. We exclude fromthe former group all firms that experience that maximum rate increase of six percentage points, to ensurethat the average rate increase in this group is not larger than the average rate increase among other treatedfirms.
43
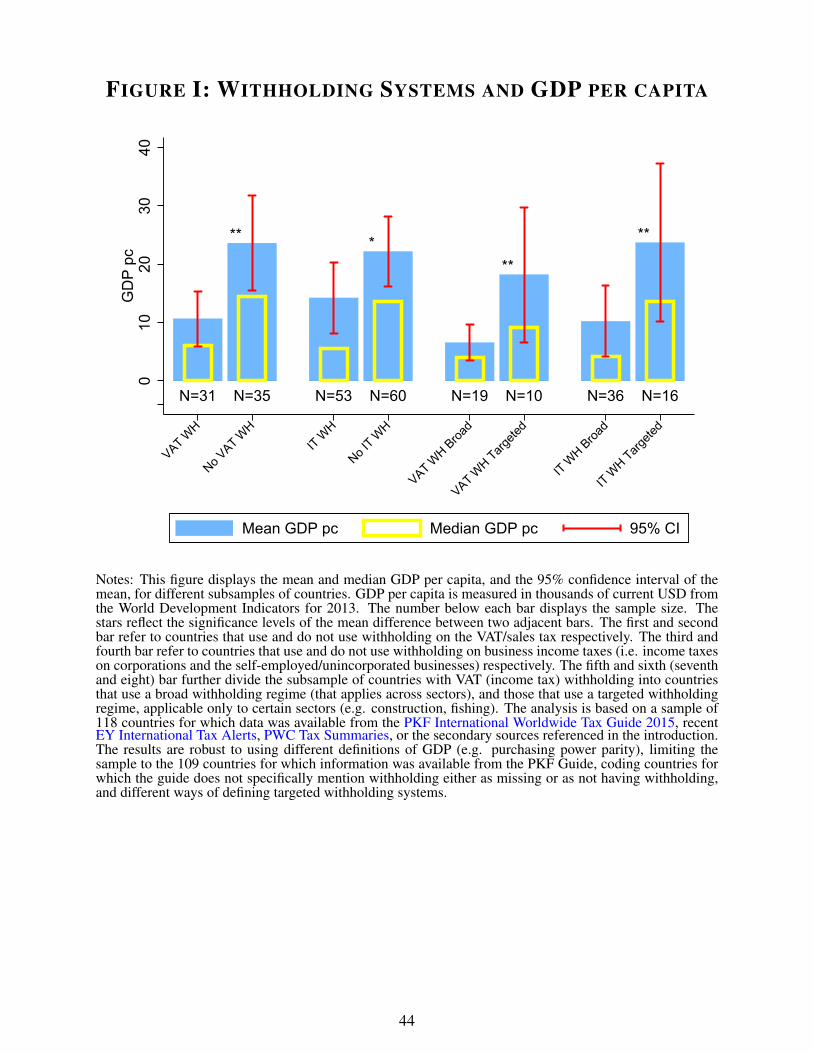
FIGURE I: WITHHOLDING SYSTEMS AND GDP PER CAPITA
** ***
**
N=31 N=35 N=53 N=60 N=19 N=10 N=36 N=16 0
1020
3040
GD
P p
c
VAT WH
No VAT W
HIT W
H
No IT W
H
VAT WH B
road
VAT WH Targ
eted
IT WH B
road
IT WH Targ
eted
Mean GDP pc Median GDP pc 95% CI
Notes: This figure displays the mean and median GDP per capita, and the 95% confidence interval of themean, for different subsamples of countries. GDP per capita is measured in thousands of current USD fromthe World Development Indicators for 2013. The number below each bar displays the sample size. Thestars reflect the significance levels of the mean difference between two adjacent bars. The first and secondbar refer to countries that use and do not use withholding on the VAT/sales tax respectively. The third andfourth bar refer to countries that use and do not use withholding on business income taxes (i.e. income taxeson corporations and the self-employed/unincorporated businesses) respectively. The fifth and sixth (seventhand eight) bar further divide the subsample of countries with VAT (income tax) withholding into countriesthat use a broad withholding regime (that applies across sectors), and those that use a targeted withholdingregime, applicable only to certain sectors (e.g. construction, fishing). The analysis is based on a sample of118 countries for which data was available from the PKF International Worldwide Tax Guide 2015, recentEY International Tax Alerts, PWC Tax Summaries, or the secondary sources referenced in the introduction.The results are robust to using different definitions of GDP (e.g. purchasing power parity), limiting thesample to the 109 countries for which information was available from the PKF Guide, coding countries forwhich the guide does not specifically mention withholding either as missing or as not having withholding,and different ways of defining targeted withholding systems.
44
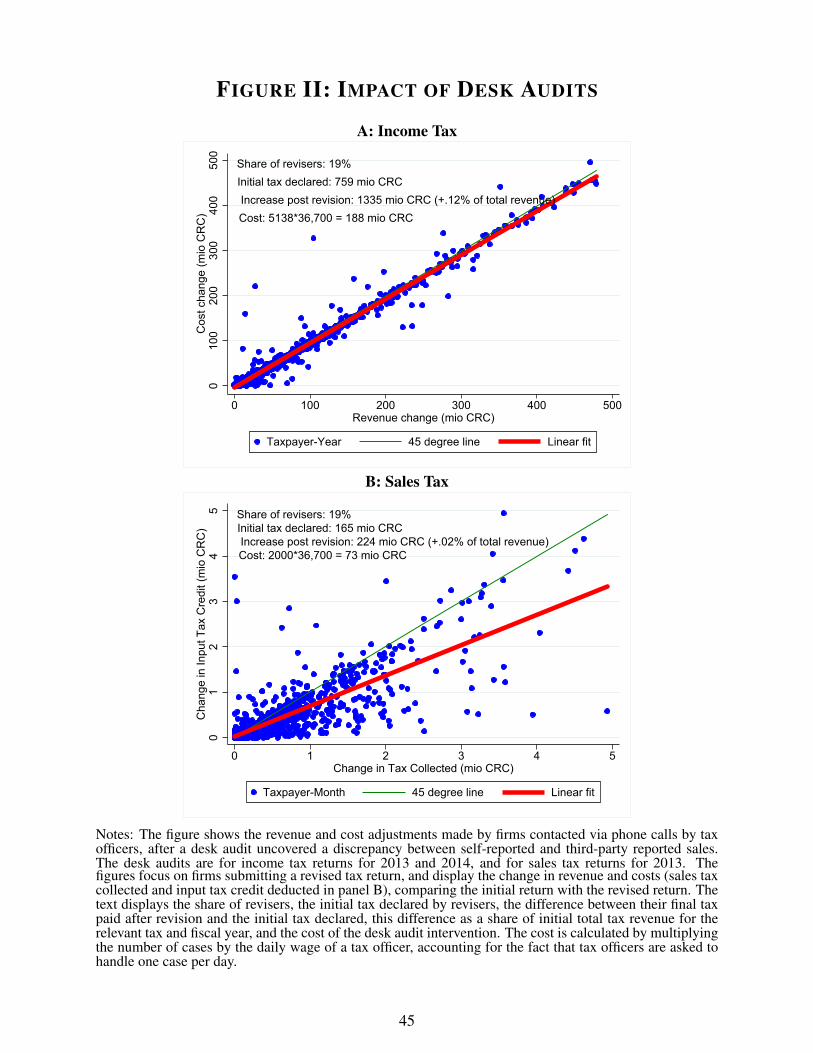
FIGURE II: IMPACT OF DESK AUDITS
A: Income Tax
Share of revisers: 19%Initial tax declared: 759 mio CRCIncrease post revision: 1335 mio CRC (+.12% of total revenue)Cost: 5138*36,700 = 188 mio CRC
010
020
030
040
050
0C
ost c
hang
e (m
io C
RC
)
0 100 200 300 400 500Revenue change (mio CRC)
Taxpayer-Year 45 degree line Linear fit
B: Sales Tax
Share of revisers: 19%Initial tax declared: 165 mio CRCIncrease post revision: 224 mio CRC (+.02% of total revenue)Cost: 2000*36,700 = 73 mio CRC
01
23
45
Cha
nge
in In
put T
ax C
redi
t (m
io C
RC
)
0 1 2 3 4 5Change in Tax Collected (mio CRC)
Taxpayer-Month 45 degree line Linear fit
Notes: The figure shows the revenue and cost adjustments made by firms contacted via phone calls by taxofficers, after a desk audit uncovered a discrepancy between self-reported and third-party reported sales.The desk audits are for income tax returns for 2013 and 2014, and for sales tax returns for 2013. Thefigures focus on firms submitting a revised tax return, and display the change in revenue and costs (sales taxcollected and input tax credit deducted in panel B), comparing the initial return with the revised return. Thetext displays the share of revisers, the initial tax declared by revisers, the difference between their final taxpaid after revision and the initial tax declared, this difference as a share of initial total tax revenue for therelevant tax and fiscal year, and the cost of the desk audit intervention. The cost is calculated by multiplyingthe number of cases by the daily wage of a tax officer, accounting for the fact that tax officers are asked tohandle one case per day.
45

FIGURE III: PAYMENT OF TAX LIABILITIES
A: Income Tax
.8.8
5.9
.95
1A
vera
ge P
aym
ent S
hare
2006 2008 2010 2012 2014Year
Self-Employed, cut 04-2015 Corporations, cut 04-2015Self-Employed, cut 04-2013 Corporations, cut 04-2013Self-Employed, cut 04-2011 Corporations, cut 04-2011
Average Payment Share of Net Liability, Income Tax
B: Sales Tax
.75
.8.8
5.9
.95
11.
05A
vera
ge P
aym
ent S
hare
2009m1 2010m7 2012m1 2013m7 2015m1Month
Self-Employed, cut 04-2015 Corporations, cut 04-2015Self-Employed, cut 04-2013 Corporations, cut 04-2013Self-Employed, cut 04-2011 Corporations, cut 04-2011
Average Payment Share of Net Liability, Sales Tax
Notes: This figure shows the average of the payment share, defined as the total payment made by thetaxpayer for a specific tax period, divided by the final tax liability to be paid for that period. The average isan unweighted average across all taxpayers with an positive final liability for each fiscal period. The final taxliability is net of any deduction made for tax withheld, and the payment data does not include tax withheld.The income tax data includes all declarations filed and payments made by June 2015. The sales tax dataincludes all declarations filed and payments made by October 2015. The thin red lines correspond to theself-employed and the thick blue lines corresponds to corporations. We show the series for three differentcuts in the payment data, taking into account all payments made before the cut date.
46
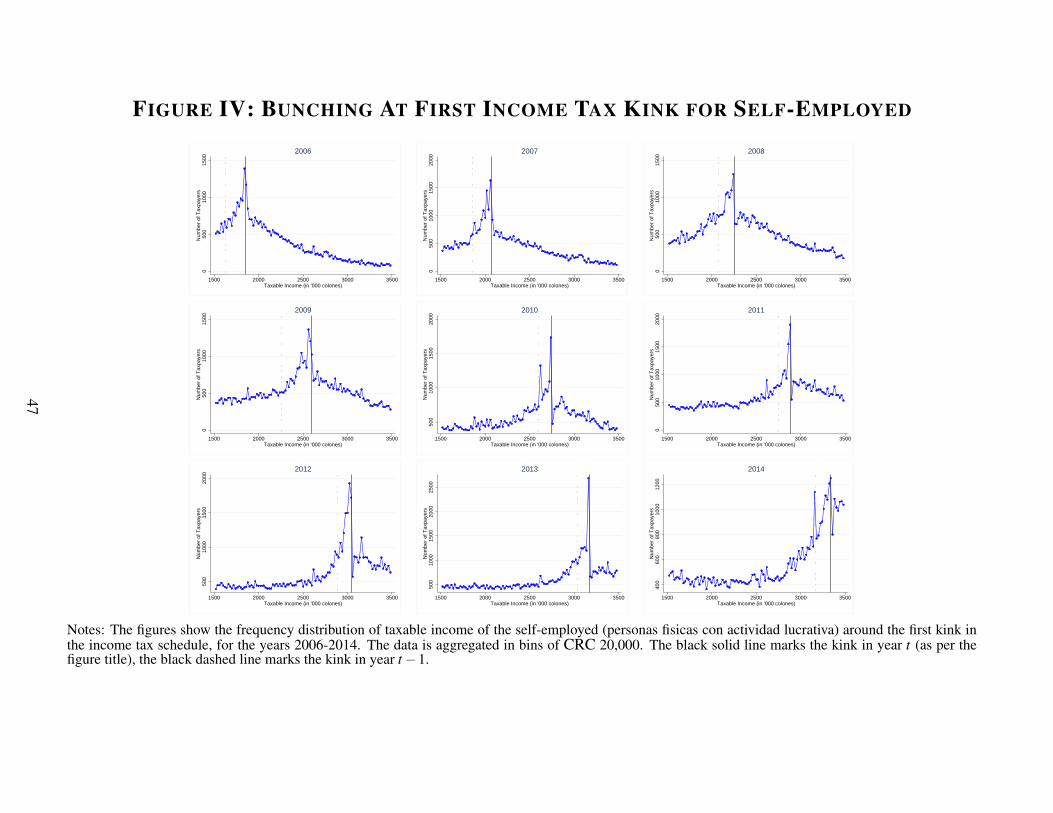
FIGURE IV: BUNCHING AT FIRST INCOME TAX KINK FOR SELF-EMPLOYED
050
010
0015
00N
umbe
r of
Tax
paye
rs
1500 2000 2500 3000 3500Taxable Income (in '000 colones)
2006
050
010
0015
0020
00N
umbe
r of
Tax
paye
rs
1500 2000 2500 3000 3500Taxable Income (in '000 colones)
2007
050
010
0015
00N
umbe
r of
Tax
paye
rs
1500 2000 2500 3000 3500Taxable Income (in '000 colones)
2008
050
010
0015
00N
umbe
r of
Tax
paye
rs
1500 2000 2500 3000 3500Taxable Income (in '000 colones)
2009
500
1000
1500
2000
Num
ber
of T
axpa
yers
1500 2000 2500 3000 3500Taxable Income (in '000 colones)
2010
050
010
0015
0020
00N
umbe
r of
Tax
paye
rs
1500 2000 2500 3000 3500Taxable Income (in '000 colones)
2011
500
1000
1500
2000
Num
ber
of T
axpa
yers
1500 2000 2500 3000 3500Taxable Income (in '000 colones)
2012
500
1000
1500
2000
2500
Num
ber
of T
axpa
yers
1500 2000 2500 3000 3500Taxable Income (in '000 colones)
2013
400
600
800
1000
1200
Num
ber
of T
axpa
yers
1500 2000 2500 3000 3500Taxable Income (in '000 colones)
2014
Notes: The figures show the frequency distribution of taxable income of the self-employed (personas fisicas con actividad lucrativa) around the first kink inthe income tax schedule, for the years 2006-2014. The data is aggregated in bins of CRC 20,000. The black solid line marks the kink in year t (as per thefigure title), the black dashed line marks the kink in year t−1.
47
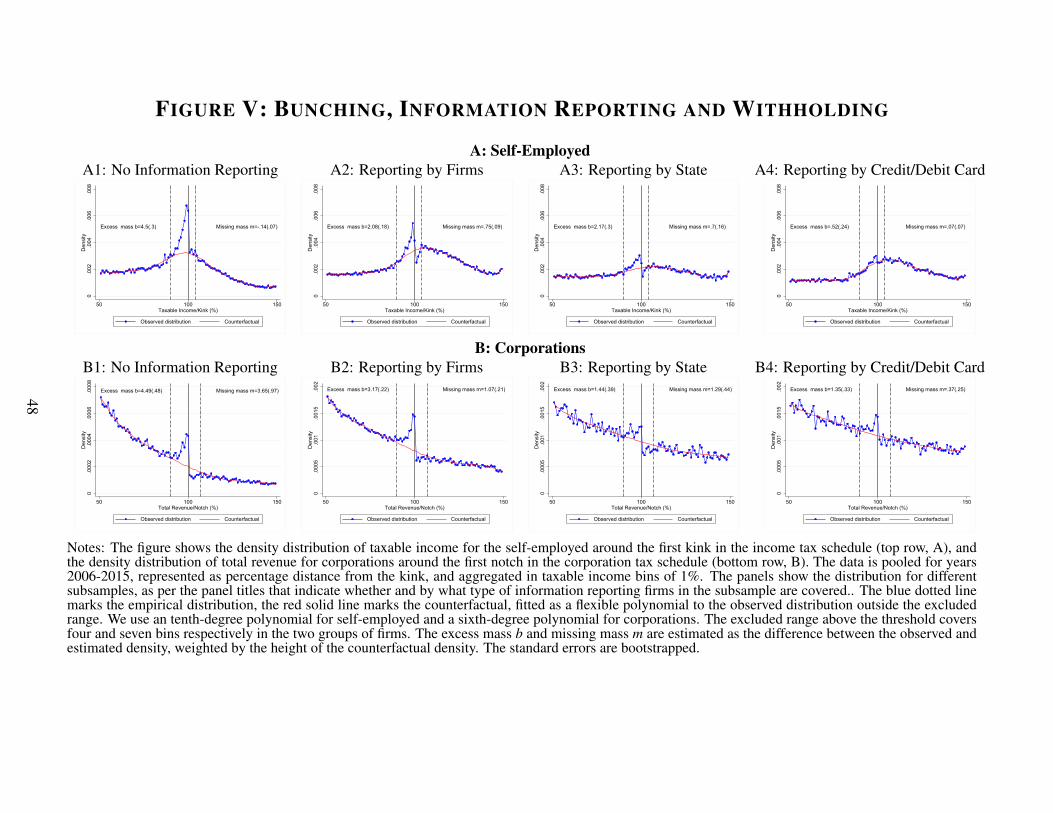
FIGURE V: BUNCHING, INFORMATION REPORTING AND WITHHOLDING
A: Self-EmployedA1: No Information Reporting A2: Reporting by Firms A3: Reporting by State A4: Reporting by Credit/Debit Card
Excess mass b=4.5(.3) Missing mass m=-.14(.07)
0.0
02.0
04.0
06.0
08D
ensi
ty
50 100 150Taxable Income/Kink (%)
Observed distribution Counterfactual
Excess mass b=2.08(.18) Missing mass m=.75(.09)
0.0
02.0
04.0
06.0
08D
ensi
ty50 100 150
Taxable Income/Kink (%)
Observed distribution Counterfactual
Excess mass b=2.17(.3) Missing mass m=.7(.16)
0.0
02.0
04.0
06.0
08D
ensi
ty
50 100 150Taxable Income/Kink (%)
Observed distribution Counterfactual
Excess mass b=.52(.24) Missing mass m=.07(.07)
0.0
02.0
04.0
06.0
08D
ensi
ty
50 100 150Taxable Income/Kink (%)
Observed distribution Counterfactual
B: CorporationsB1: No Information Reporting B2: Reporting by Firms B3: Reporting by State B4: Reporting by Credit/Debit Card
Excess mass b=4.49(.48) Missing mass m=3.65(.97)
0.0
002
.000
4.0
006
.000
8D
ensi
ty
50 100 150Total Revenue/Notch (%)
Observed distribution Counterfactual
Excess mass b=3.17(.22) Missing mass m=1.07(.21)
0.0
005
.001
.001
5.0
02D
ensi
ty
50 100 150Total Revenue/Notch (%)
Observed distribution Counterfactual
Excess mass b=1.44(.39) Missing mass m=1.29(.44)
0.0
005
.001
.001
5.0
02D
ensi
ty
50 100 150Total Revenue/Notch (%)
Observed distribution Counterfactual
Excess mass b=1.35(.33) Missing mass m=.37(.25)
0.0
005
.001
.001
5.0
02D
ensi
ty
50 100 150Total Revenue/Notch (%)
Observed distribution Counterfactual
Notes: The figure shows the density distribution of taxable income for the self-employed around the first kink in the income tax schedule (top row, A), andthe density distribution of total revenue for corporations around the first notch in the corporation tax schedule (bottom row, B). The data is pooled for years2006-2015, represented as percentage distance from the kink, and aggregated in taxable income bins of 1%. The panels show the distribution for differentsubsamples, as per the panel titles that indicate whether and by what type of information reporting firms in the subsample are covered.. The blue dotted linemarks the empirical distribution, the red solid line marks the counterfactual, fitted as a flexible polynomial to the observed distribution outside the excludedrange. We use an tenth-degree polynomial for self-employed and a sixth-degree polynomial for corporations. The excluded range above the threshold coversfour and seven bins respectively in the two groups of firms. The excess mass b and missing mass m are estimated as the difference between the observed andestimated density, weighted by the height of the counterfactual density. The standard errors are bootstrapped.
48

FIGURE VI: EVENT STUDY OF COMPLIANCE AFTER FIRST INFORMATION REPORT
A: Self-EmployedA1: Report by Supplier A2: Report by Client A3: Report by State A4: Report by Credit/Debit Card
[Sales DD=.17 (.01)]
[Costs DD=.14 (.01)]
Income DD=.26 (.01)
Profit Rate DD=.15 (.01)
.91
1.1
1.2
1.3
1.4
1.5
1.6
1.7
Cha
nge
in R
eal T
axab
le In
com
e
-4 -3 -2 -1 0 1 2 3Event Time
Control Group Event Group6927 event group firms, 40266 control firms.
[Sales DD=.18 (.01)]
[Costs DD=.21 (.01)]
Income DD=.09 (.01)
Profit Rate DD=-.03 (.01)
.91
1.1
1.2
1.3
1.4
1.5
1.6
1.7
Cha
nge
in R
eal T
axab
le In
com
e
-4 -3 -2 -1 0 1 2 3Event Time
Control Group Event Group21922 event group firms, 73177 control firms.
[Sales DD=.17 (.01)]
[Costs DD=.15 (.01)]
Income DD=.21 (.01)
Profit Rate DD=.07 (.01)
.91
1.1
1.2
1.3
1.4
1.5
1.6
1.7
Cha
nge
in R
eal T
axab
le In
com
e
-4 -3 -2 -1 0 1 2 3Event Time
Control Group Event Group3360 event group firms, 206071 control firms.
[Tax Collected DD=.12 (.01)][Input Credit DD=.09 (.01)]
Liability DD=.25 (.02)VA Rate DD=.14 (.01)
.91
1.1
1.2
1.3
1.4
Cha
nge
in
-5 -4 -3 -2 -1 0 1 2 3 4 5Event Time
Control Group Event Group4257 event group firms, 1089915 control firms.
B: CorporationsB1: Report by Supplier B2: Report by Client B3: Report by State B4: Report by Credit/Debit Card
[Sales DD=.3 (.03)]
[Costs DD=.28 (.03)]
Income DD=.49 (.04)
Profit Rate DD=.39 (.03)
.91
1.1
1.2
1.3
1.4
1.5
1.6
1.7
Cha
nge
in R
eal T
axab
le In
com
e
-4 -3 -2 -1 0 1 2 3Event Time
Control Group Event Group4574 event group firms, 38321 control firms.
[Sales DD=.55 (.03)]
[Costs DD=.570 (.04)]
Income DD=.25 (.02)
Profit Rate DD=.08 (.01)
.91
1.1
1.2
1.3
1.4
1.5
1.6
1.7
Cha
nge
in R
eal T
axab
le In
com
e
-4 -3 -2 -1 0 1 2 3Event Time
Control Group Event Group7620 event group firms, 43705 control firms.
[Sales DD=.14 (.01)]
[Costs DD=.14 (.01)]
Income DD=.23 (.03)
Profit Rate DD=.06 (.03)
.91
1.1
1.2
1.3
1.4
1.5
1.6
1.7
Cha
nge
in R
eal T
axab
le In
com
e
-4 -3 -2 -1 0 1 2 3Event Time
Control Group Event Group2303 event group firms, 139817 control firms.
[Tax Collected DD=.19 (.01)][Input Credit DD=.13 (.01)]
Liability DD=.26 (.02)VA Rate DD=.2 (.01)
.91
1.1
1.2
1.3
1.4
Cha
nge
in
-5 -4 -3 -2 -1 0 1 2 3 4 5Event Time
Control Group Event Group4259 event group firms, 1128297 control firms.
Notes: This figure displays event studies for receipt of the information report by different reporting agents, as indicated by the panel titles. The top row (A)is for the self-employed and the bottom row (B) for corporations. Each panel displays the year-on-year change (month-on-month change for credit/debit cardreporting) in real reported taxable income (tax liability) for an event group (orange doted line) and an event control group (blue crossed line). The black solidline marks event time 0, when firms in the event group are reported to the tax authority for the first time by the reporting agent indicated in the panel title. Thecontrol group is reweighted by its propensity score of experiencing the event (cf. section 5.2 and footnote 38, for details). Each group consists of a balancedpanel of firms that can be observed for the entire period displayed. Panels A1-A3 and B1-B3 consider events happening in 2010-2012. Panels A4 and B4consider events happening in 02/2009-08/2014. The text displays the difference-in-difference coefficient from estimating equation 1, for different outcomevariables as noted. Income refers to taxable income/profits. VA stands for value-added rate.
49

FIGURE VII: WITHHOLDING RATE REFORM
A: Withholding Rate (Full Sample) B: Withholding Rate (Prediction Sample)
23
45
Ave
rage
Rat
e
2008m8 2009m8 2010m8 2011m8 2012m8 2013m8 2014m8Month
23
45
Ave
rage
Rat
e (%
)
2010m8 2011m8 2012m8 2013m8 2014m8Month
Realized Rate Predicted Rate
C: Number of Declarations D: Number of Declarations Matched
2500
030
000
3500
040
000
N W
ithho
ldin
g
7000
075
000
8000
085
000
9000
0N
Sal
es T
ax
2008m8 2009m8 2010m8 2011m8 2012m8Month
N Sales Tax Declarations N Withholding Declarations
.48
.49
.5.5
1.5
2S
hare
With
hold
ing
.22
.23
.24
.25
.26
.27
Sha
re S
ales
Tax
2008m8 2009m8 2010m8 2011m8 2012m8Month
Share Sales Tax Declarations Matched With WithholdingShare Withholding Declarations Matched With Tax Declaration
E: Total Share of Card Sales F: Average Share of Card Sales
Slope= .004 (.005) ∆ Slope= 0.000 (0.000)∆ Constant= -.01 (.013)
.4.4
5.5
.55
.6.6
5.7
.75
.8.8
5S
hare
of C
ard
Sal
es
2008m8 2009m8 2010m8 2011m8 2012m8 2013m8 2014m8Month
Share Linear Fit
Slope= .004 (.002) ∆ Slope= 0.000 (0.000)
∆ Constant= -.01 (.005)
.4.4
5.5
.55
.6S
hare
of C
ard
Sal
es
2008m8 2009m8 2010m8 2011m8 2012m8 2013m8 2014m8Month
Share Linear Fit
Notes: The figure displays the first stage of the withholding rate reform and analyzes the reform’s effecton credit/credit card use. Panel A shows the average realized withholding rate among all firms subject towithholding. Panel B shows the average realized and predicted withholding rate among firms for whom wecan predict the withholding rate based on previous semester’s tax returns and the withholding rate schedulein Table II. Panel C shows the number of sales tax declarations and credit/debit card withholding declarationspresented to the tax authority, correcting for revisions and duplicates. Panel D shows the share of sales taxdeclarations matched with at least one withholding declaration and vice-versa. Panel E shows the share ofcard sales in total sales among firms with a credit/debit card machine, and panel E shows the average overthe firm-specific shares of card sales among firms with a credit/debit card machine. The black solid linein all panels marks 08/2011, when the increase in the withholding rate for the sales tax entered into effect.Panel E and F show a linear fit that allows for a different trend and constant after the reform. The textdisplays the pre-reform slope of the linear fit, and the change in slope and constant after the reform, alongwith standard errors in parantheses.
50
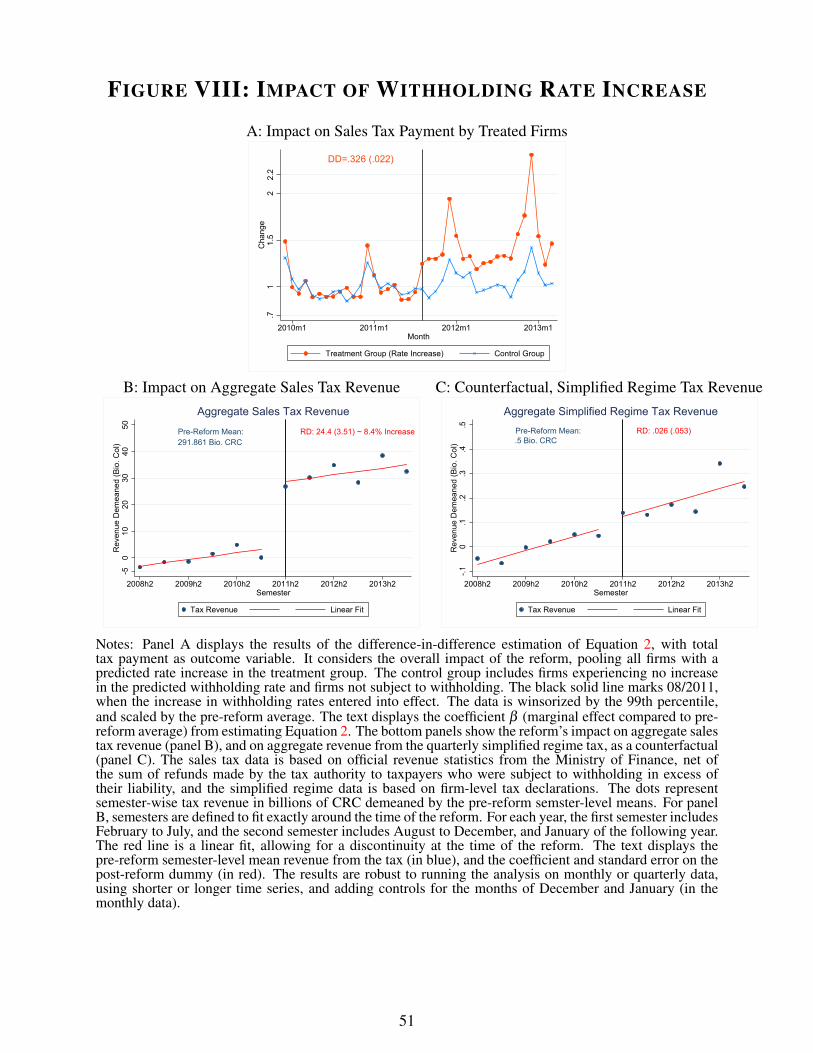
FIGURE VIII: IMPACT OF WITHHOLDING RATE INCREASE
A: Impact on Sales Tax Payment by Treated Firms
DD=.326 (.022)
.71
1.5
22.
2C
hang
e
2010m1 2011m1 2012m1 2013m1Month
Treatment Group (Rate Increase) Control Group
B: Impact on Aggregate Sales Tax Revenue C: Counterfactual, Simplified Regime Tax Revenue
Pre-Reform Mean:291.861 Bio. CRC
RD: 24.4 (3.51) ~ 8.4% Increase
-50
1020
3040
50R
even
ue D
emea
ned
(Bio
. Col
)
2008h2 2009h2 2010h2 2011h2 2012h2 2013h2Semester
Tax Revenue Linear Fit
Aggregate Sales Tax RevenuePre-Reform Mean:.5 Bio. CRC
RD: .026 (.053)
-.10
.1.2
.3.4
.5R
even
ue D
emea
ned
(Bio
. Col
)
2008h2 2009h2 2010h2 2011h2 2012h2 2013h2Semester
Tax Revenue Linear Fit
Aggregate Simplified Regime Tax Revenue
Notes: Panel A displays the results of the difference-in-difference estimation of Equation 2, with totaltax payment as outcome variable. It considers the overall impact of the reform, pooling all firms with apredicted rate increase in the treatment group. The control group includes firms experiencing no increasein the predicted withholding rate and firms not subject to withholding. The black solid line marks 08/2011,when the increase in withholding rates entered into effect. The data is winsorized by the 99th percentile,and scaled by the pre-reform average. The text displays the coefficient β (marginal effect compared to pre-reform average) from estimating Equation 2. The bottom panels show the reform’s impact on aggregate salestax revenue (panel B), and on aggregate revenue from the quarterly simplified regime tax, as a counterfactual(panel C). The sales tax data is based on official revenue statistics from the Ministry of Finance, net ofthe sum of refunds made by the tax authority to taxpayers who were subject to withholding in excess oftheir liability, and the simplified regime data is based on firm-level tax declarations. The dots representsemester-wise tax revenue in billions of CRC demeaned by the pre-reform semster-level means. For panelB, semesters are defined to fit exactly around the time of the reform. For each year, the first semester includesFebruary to July, and the second semester includes August to December, and January of the following year.The red line is a linear fit, allowing for a discontinuity at the time of the reform. The text displays thepre-reform semester-level mean revenue from the tax (in blue), and the coefficient and standard error on thepost-reform dummy (in red). The results are robust to running the analysis on monthly or quarterly data,using shorter or longer time series, and adding controls for the months of December and January (in themonthly data).
51

FIGURE IX: MECHANISMS OF WITHHOLDING RATE IMPACT
Default Mechanism: Incomplete Reclaim
A: Share of Reclaimers B: Share of Withheld Tax Reclaimed.4
.45
.5.5
5.6
.65
.7S
hare
2010m1 2011m1 2012m1 2013m1Date
Reclaimers over Withholdees
.8.9
11.
11.
2S
hare
2010m1 2011m1 2012m1 2013m1Date
Share of Withheld Tax Reclaimed
Salience of Enforcement Mechanism: Increased Reporting
C: Sales Tax Collected D: Input Tax Credit Deducted
DD=-.01 (.008)
.7.8
.91
1.1
1.2
1.3
Cha
nge
2010m1 2011m1 2012m1 2013m1Month
Treatment Group (Rate Increase) Control Group
DD=-.03 (.01)
.7.8
.91
1.1
1.2
1.3
Cha
nge
2010m1 2011m1 2012m1 2013m1Date
Treatment Group (Rate Increase) Control Group
E: Gross Tax Liability F: Number of AuditsDD=.167 (.021)
.81
1.2
1.4
1.6
1.8
Cha
nge
2010m1 2011m1 2012m1 2013m1Month
Treatment Group (Rate Increase) Control Group
400
600
800
1000
1200
Num
ber o
f Aud
its
20092009 2010 2011 2012 2013 2014Year
N planned audits N planned (non-LTU firms)
Notes: The figure displays evidence on the mechanisms for the withholding rate impact. In all panels, theblack solid line marks 08/2011, when the increase in withholding rates entered into effect. Panels A andB display, for all firms subject to withholding in a given month, the share of firms making a reclaim, andthe average share of withheld tax reclaimed. The shares are winsorized by the 99.9th percentile. PanelsC, D and E show results of the difference-in-difference estimation of Equation 2, with different outcomevariables, as indicated by the figure titles. The treatment group includes firms experiencing an increasein the predicted withholding rate in 08/2011, the control group includes firms experiencing no increase inthe predicted withholding rate and firms not subject to withholding. The data is winsorized by the 99thpercentile, and scaled by the pre-09/2011 average. The text displays the coefficient β (marginal effectcompared to pre-reform average) from estimating Equation 2. Panel F shows the evolution over time of thenumber of planned audits for all taxpayers and for taxpayers who are part of the large taxpayer unit, as perthe annual work programs of the audit department.
52

FIGURE X: EVENT STUDY OF WITHHOLDING
DiD=.06 (.02)
.91
1.1
1.2
1.3
1.4
Cha
nge
in R
epor
ted
Liab
ility
3 4 5 6 7 8 9Month
Control Group Event Group1826 event group firms, 135914 control firms.
Self-Employed
DiD=.07 (.02)
.91
1.1
1.2
1.3
1.4
Cha
nge
in R
epor
ted
Liab
ility
3 4 5 6 7 8 9Month
Control Group Event Group2340 event group firms, 159089 control firms.
Corporations
Notes: This figure displays the results of an event study of a switch in the firm’s withholding rate fromzero to a positive rate. Firms in the event group were subject to third-party reporting by their card companybut not subject to withholding prior to the event, and became subject to withholding at a non-zero rate inJuly. This happens due to the semesterly updating of withholding rates, based on firms’ reported value-added/share of local sales two semesters prior, as per Table II. Firms in the control group experienced nochange in the withholding regime nor in the third-party reporting regime between June and July. The graphsare constructed and labeled as in Figure VI. The estimation follows equation 1, except that the control groupis not propensity-score-reweighted, and events in the year 2011 are excluded.
53

8 Appendix
8.1 Algorithm to Estimate Non-Filing: Income TaxThis section describes the procedure by which the pool of income tax-liable taxpayers is con-structed for each year between 2010 and 2013. This pool forms the sample for Tables IV and VIII.The following algorithm is used to identify tax-liable firms:
• Income tax filing: Firms that declare income tax in current fiscal year t and are not found tohave deregistered or switched to a simplified (non-tax-liable) regime by year t are includedin the pool of income tax-liable taxpayers. Additionally, firms that filed in the previous yeart−1 and did not deregister or switch regimes in the interim are included to capture taxpayerswho were previously identified as income tax-liable and then do not file in subsequent years.This condition is applied to generate the sample used in Table IV; for the sample used inTable VIII, the rule is extended to include firms that declared income tax in any year betweent−1 and t−3 for years 2011 and later and between t−1 and t−4 for years prior to 2011,which are the historical rules officially applied by the tax authority for determining incometax liability, though in practice this condition may not have been systematically applied.
• Registration: Firms that are found to have registered with the tax authority in any of theprevious three years prior to the current fiscal year t but did not file income tax returns inthe current fiscal year are included. This step identifies firms that are officially registeredas tax-liable but which did not file for the years during which these firms were registered,which step 1 does not capture as it relies only on the records of filings.
• Subsequent deregistration: In addition to identifying firms that are registered but do notfile for income tax in prior years in step 2, firms that deregister in years following the currentfiscal year t but are not found to have registered in year t or the previous three years areclassified as having been income tax-liable despite not appearing on the official registrationroster.
• Declaring sales tax in current fiscal year: Firms that declare sales tax in any of the monthsof the current fiscal year t - which spans from October of year t− 1 to September of year t- are included in the pool of income tax-liable taxpayers. This rule corresponds to the taxauthority’s official regulation that firms liable for sales tax are also deemed liable for payingincome tax (though the reverse is not true).
• Informative declarations: Records of transactions between firms or between firm and thegovernment provide information on the sales and costs of individual firms that can be usedto identify income tax-liable taxpayers. Firms that report or are reported as having tax-liablesales in the current fiscal through the third-party reporting mechanisms described above areincluded in the pool of income tax-liable firms.
8.2 Algorithm to Estimate Non-Filing: Sales TaxThis section describes the procedure by which the pool of sales tax-liable taxpayers are constructedfor each month of fiscal years 2011 to 2013. This pool forms the sample for Tables IV and VIII,which reports the average of the monthly values for each measure in corresponding fiscal year.The following algorithm, which is similar to the method used to identify income tax-liable firms,is used to identify sales tax-liable firms:
54

• Income tax filing: Firms that declare sales tax in month m of the current fiscal year t and arenot found to have deregistered or switched to a simplified (non-tax-liable) regime by monthm in year t are included in the pool of sales tax-liable taxpayers. Additionally, firms that filedin the previous four months - m−4 to m−1 - and did not deregister or switch regimes in theinterim are included to capture taxpayers who were previously identified as sales tax-liableand then do not file in subsequent months. This could include firms that either declare salestax in previous months within the same fiscal year or in months falling within the previousfiscal year t− 1, depending on the month. This condition is applied to generate the sampleused in Table IV; for the sample used in Table VIII, the rule is extended to include firms thatdeclared sales tax in months between m−12 and m−1.
• Registration: Firms that are found to have registered with the tax authority in any of theprevious thirty six months (three years) prior to the current month m of fiscal year t but didnot declare sales tax in month m are included. This step identifies firms that are officiallyregistered as tax-liable but which did not file for the years during which these firms wereregistered, which step 1 does not capture as it relies only on the records of filings.
• Subsequent deregistration: In addition to identifying firms that are registered but do notfile for income tax in prior years in step 2, firms that deregister in months following thecurrent month m but are not found to have registered within the previous thirty six months areclassified as having been income tax-liable despite not appearing on the official registrationroster.
• Informative declarations: Firms that are reported as having been subject to withholding bycredit/debit card companies are considered tax-liable for the sales tax.
55

TABLE VIII: NON-FILING, ROBUSTNESS
Panel A: Non-filing among all tax-liable firms(1) (2) (3) (4) (5)
% Non-filersOf whichregisterednon-filers
Non-filers’TPI sales as %
of declaredTPI sales
Undeclaredsales as % ofdeclared sales
Unreportedliability as %of declared
liabilityIncome Tax 2010 0.420 0.335 0.154 0.225 0.081Income Tax 2011 0.509 0.239 0.195 0.246 0.077Income Tax 2012 0.547 0.218 0.114 0.189 0.076Income Tax 2013 0.586 0.266 0.112 0.203 0.104Sales Tax 2011 0.335 0.960 . . .Sales Tax 2012 0.325 0.955 . . .Sales Tax 2013 0.372 0.962 . . .
Panel B: Non-filing among registered firms
AllSelf-
Employed
Self-Employedwith TPI
CorporationsCorporations
with TPI
Income Tax 2010 0.195 0.158 0.131 0.155 0.073Income Tax 2011 0.198 0.161 0.134 0.143 0.071Income Tax 2012 0.209 0.153 0.126 0.128 0.051Income Tax 2013 0.273 0.215 0.158 0.216 0.067Sales Tax 2011 0.326 0.439 0.155 0.192 0.073Sales Tax 2012 0.315 0.423 0.126 0.185 0.054Sales Tax 2013 0.363 0.478 0.101 0.185 0.040
Panel C: Non-filing among firms covered by information reporting
AllReported by
firmsReported by
state
Reported bycard
companiesIncome Tax 2010 0.573 0.578 0.235 0.293 .Income Tax 2011 0.652 0.658 0.202 0.297 .Income Tax 2012 0.672 0.678 0.186 0.308 .Income Tax 2013 0.676 0.681 0.177 0.320 .
Notes: The construction of this Table is identical to Table IV, except that it uses a less conservative algorithmto calculate the share of non-filers as explained in appendix section 8.1.
56
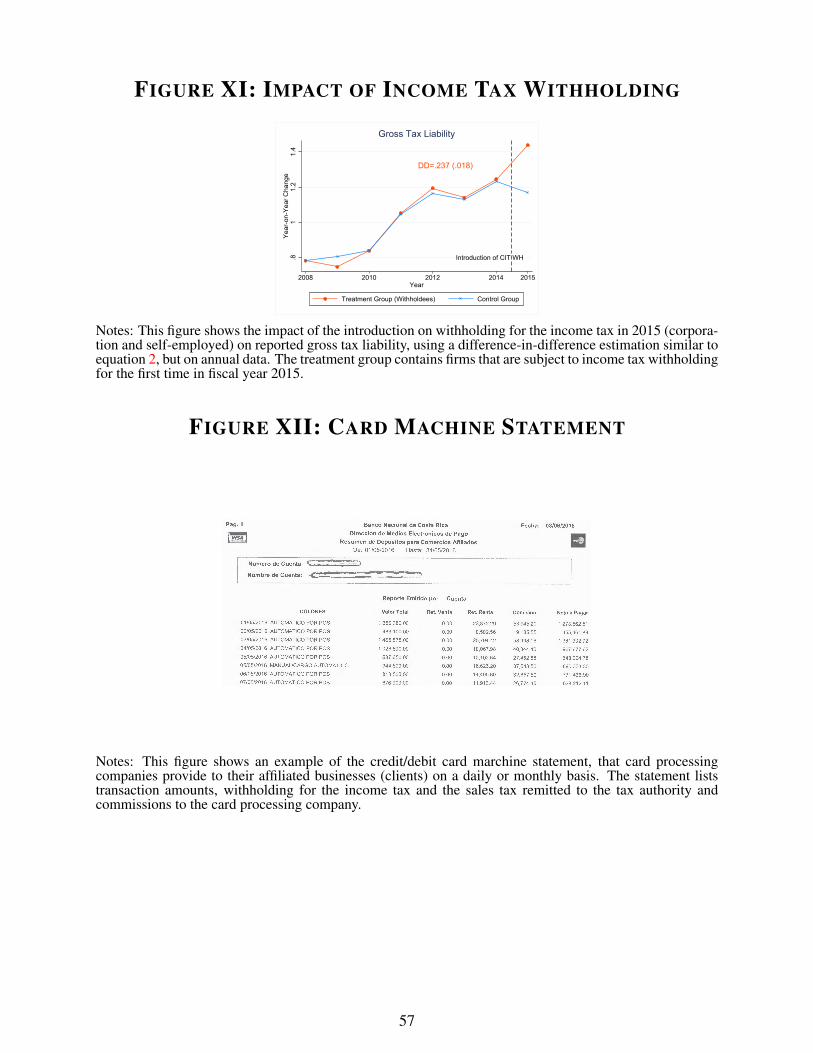
FIGURE XI: IMPACT OF INCOME TAX WITHHOLDING
Introduction of CIT WH
DD=.237 (.018)
.81
1.2
1.4
Yea
r-on
-Yea
r Cha
nge
2008 2010 2012 2014 2015Year
Treatment Group (Withholdees) Control Group
Gross Tax Liability
Notes: This figure shows the impact of the introduction on withholding for the income tax in 2015 (corpora-tion and self-employed) on reported gross tax liability, using a difference-in-difference estimation similar toequation 2, but on annual data. The treatment group contains firms that are subject to income tax withholdingfor the first time in fiscal year 2015.
FIGURE XII: CARD MACHINE STATEMENT
Notes: This figure shows an example of the credit/debit card marchine statement, that card processingcompanies provide to their affiliated businesses (clients) on a daily or monthly basis. The statement liststransaction amounts, withholding for the income tax and the sales tax remitted to the tax authority andcommissions to the card processing company.
57