tax reform and tax yield in malawi - aerc | africa
TRANSCRIPT
Tax reform and tax yield inMalawi
By
C. ChipetaSouthern African Institute for Economic Research
Zomba, Malawi
AERC Research Paper 81African Economic Research Consortium, Nairobi
March 1998

© 1998, African Economic Research Consortium.
Published by: The African Economic Research ConsortiumP.O. Box 62882Nairobi, Kenya
Printed by: The Regal Press Kenya, Ltd.P.O. Box 46116Nairobi, Kenya
ISBN 9966-900-71-3

List of tablesAcknowledgementsAbstract
I. Introduction 1II. Background and justification 3III. Malawi's tax system in the 1970s 11IV. Tax changes, reforms and structure in the 1980s and 1990s 17V. Methodology 21VI. Analysis of tax buoyancy 26VII. Analysis of tax elasticity 30VIII. Summary and conclusions 35
References 37Appendix A: Taxation in Malawi in 1969 38Appendix B: Selected tax revenue data for Malawi, 1970–1994 43Appendix C: Tax buoyancies and elasticities in Malawi 47
Contents

List of tables
1. The growth of total tax revenue 42. The growth of central government expenditure 53. Central government recurrent expenditure (K million) in real terms 64. Central government total tax revenue, total revenue and total
expenditure as percentage of GDP 75. Central government tax revenue as percentage of GDP in selected
sub-Saharan African countries 86. Trends in total public expenditure, revenue and budget deficit
(K million) 97. Central government overall budget deficit and its financing (K'000) 108. Assessed tax rates 139. Actual tax revenue, estimated discretionary tax revenue and adjusted
total tax revenue in nominal terms (K million) 2510. Estimates of tax buoyancy in Malawi 2711. Comparison of tax buoyancy between 1970–1979 and 1980–1993 2812. Elasticity of major taxes and of the total tax system 1980–1993 3013. Decomposition of tax elasticities 1980–1993 3314. Difference between tax buoyancy and tax elasticityfor all taxes and
selected major taxes 1980–1993 34

Acknowledgements
The author would like to express his gratitude to the African Economic ResearchConsortium (AERC) for funding this research. He would also like to thank the ExecutiveDirector and the Research Coordinator of AERC, the resource persons and colleagues inthe macroeconomic research network, and the anonymous referees for the many helpfulcomments and suggestions that he received during the course of the research. However,he alone bears responsibility for the contents of the paper.

Abstract
The problem of this study is to evaluate tax reforms as instruments for raising tax yieldin Malawi. The study tests two hypotheses: that the yield of the tax system as a whole, ofits major components and of individual taxes, is not buoyant; and that the yield of the taxsystem as a whole, of its major components and of individual taxes is not income elastic.
In order to test these hypotheses, two sets of regression equations were estimated. Inthe first set, tax revenue was regressed on GDP. Tax revenue was again regressed onGDP in the second set, but in individual tax revenue equations, dummy variables wereused to capture discretionary tax changes. Moreover, in the total tax revenue equation,tax revenue adjusted for discretionary tax changes was the independent variable.
On the basis of the econometric analysis, a few taxes are buoyant. The tax system asa whole is not. In the context of Malawi, relying on increasing tax rates, extending existingtaxes to new activities and introducing new taxes are not sufficient for raising buoyancyof the tax system.
Only PAYE tax (pay as you earn) is tax elastic. The whole tax system is not. Toimprove tax elasticity, the tax base must grow relative to GDP.

TAX REFORM AND TAX YIELD IN MALAWI 1
I. Introduction
The purpose of this study is to evaluate the tax reforms that Malawi has carried out overtime, paying particular attention to intensive reforms that were undertaken in the contextof structural adjustment in the 1980s and early 1990s. The study focuses on tax reformas an instrument for raising tax yield or productivity. The specific and principal objectiveof the study is to investigate the factors that influence yield or productivity of the taxsystem of Malawi, and how tax yield or productivity can be improved. To pursue thisobjective, the study estimates the buoyancy and elasticity of the tax system as a whole,of the major groups of taxes and of individual taxes.
Tax bouyancy is defined as the ratio of the percentage change in actual tax collectionsto the percentage change in the tax base gross of changes in the tax system — e.g.,changes in tax rates or introduction of a new tax. Such changes in the tax system, towhich buoyancy is due, are referred to as discretionary elements of revenue growth.
Tax elasticity, on the other hand, refers to the ratio of the percentage growth in revenueto the percentage increase in the tax base on the assumption that the tax system of aparticular year had prevailed throughout the period. Tax elasticity is due to growth in thetax base (e.g., an increase in tax revenue from profits because of higher profits). Suchgrowth in the tax base is an autonomous element of revenue growth.
Elasticity greater than unity is a desirable feature of a tax system if there is increasingdemand for public services and if a country would like to pursue relative financial stability.If elasticity is low, discretionary changes may make up for it and buoyancy may becorrespondingly high. But, unlike high elasticity, high buoyancy does not necessarilyimply that buoyancy will continue to be high in future, since rates may have been pushedup to their limit.
The main hypotheses that are tested in this study are that:
• The yield of the tax system as a whole, of its major components or groups, and ofindividual taxes is neither buoyant nor income elastic.
• The yield of the tax system as a whole, of its major components or groups, and ofindividual taxes is neither base to income elastic nor tax to base elastic.
These hypotheses are tested by determining the significance of the regressioncoefficients of relevant regression equations that have been estimated and by determiningwhether the relevant regression coefficients exceed unity.
The rest of the report unfolds in seven sections. Section II presents the background to

2 RESEARCH PAPER 81
the study and its justification. Section III examines tax changes, reforms and structure inthe 1970s and Section IV does the same for the 1980s and 1990s. Section V sketches themethodology used to estimate tax buoyancy, which is analysed in Section VI, and taxelasticity, which is analysed in Section Vii. Finally, the summary and conclusions arepresented in Section VIII.

TAX REFORM AND TAX YIELD IN MALAWI 3
II. Background and justification
Since independence 30 years ago, the tax system of Malawi has undergone a number ofreforms and individual tax adjustments in response to the need for more revenue and forimproving fiscal incentives for economic development. Although several tax reformshave been undertaken, especially since the 1983/84 fiscal year, taxation has failed togenerate sufficient revenue to meet the needs of the government. In real terms tax revenueincreased up to 1985/86, but has since then fallen (Table 1). Total expenditure andrecurrent expenditure both rose in real terms up to 1986/87, but have since declined(Table 2). A look at the composition of real recurrent expenditure (Table 3), shows thatonly real expenditure on general services and economic services has increased, whilethat on social services and unallocable services has fallen since 1986/87.
The tax burden measured by the ratio of tax revenue to GDP averaged 17.6% over theperiod 1980-1989. The tax ratio exhibited no upward trend over this period, suggestingthat tax reforms did not increase the tax burden. Instead, the tax burden appears to havedecreased since 1989/90 (Table 4). Compared with a sample of other low-income Africancountries, Malawi’s tax ratio was lower than the average for the whole sample in 1980,and nearly equal to the average in 1985 and in 1990 (Table 5). But compared withsamples of middle-income African countries, Malawi’s tax ratios were lower than theaverages of the sampled countries (Table 5).
The apparent failure of the tax system to generate sufficient revenue to finance recurrentexpenditure has led to large budget deficits, especially since the 1980/81 fiscal year(Table 6). Internal borrowing, mainly from the banking system, and external loans canbe used to finance the overall budget deficit. But because these two sources of financeare not sustainable in the medium and long terms, every effort must be made to design atax system that is viable and that can support government expenditure without recourseto deficit financing and foreign credit and aid.
During the 1970s, the overall budget deficit after grants rose absolutely and remainedrather high as a proportion of GDP. The relatively large budget deficit was at first financedmainly by foreign borrowing. In the 1970/71 fiscal year, for example, foreign borrowingfinanced 89.3% of the deficit. Although foreign borrowing raised the level of externaldebt and future debt service obligations, it did not fuel domestic inflationary pressures inthe manner that reliance on domestic borrowing would have done, unless credits to theprivate sector were cut. During the early 1980s, domestic borrowing, especially fromthe banking system, financed the larger part of the overall budget deficit (Table 7). In the1980/81 fiscal year, for example, domestic borrowing financed 65.6% of the overallbudget deficit, and external borrowing financed the remaining 34.4%. Greater relianceon domestic bank borrowing during this period had a marked impact on the growth ofdomestic demand, causing inflationary and balance of payments pressures in the economy.

4 RESEARCH PAPER 81
Since then, the source of financing the deficit has largely been foreign. For example,in 8 out of 11 fiscal years between 1982/83 and 1992/93, more of the overall budgetdeficit was financed by foreign borrowing (Table 7). In only 3 of 11 years was thegreater part of the overall budget deficit financed through domestic borrowing (Table 7).
But neither foreign loans nor foreign aid can be relied on with a reasonable degree ofcertainty for financing public expenditure. Both foreign loans and aid can be cut, ashappened in 1992 because Malawi did not satisfy the requisite political conditions. Apartfrom such conditions, foreign aid is also often tied to imports from the donor countries,which limits the choices available to the country. In view of the problems associatedwith foreign loans and foreign aid, and the obvious inflationary nature of deficit financing,the main obligation for raising additional revenue must rest with taxation.
Table 1: The growth of total tax revenue
Fiscal Total tax Annual Total tax Annualyear revenue in percentage revenue in percentage
nominal change real terms changeterms (Kmn)(Kmn)
1970/71 29.1 - 71.3 -1971/72 36.0 23.7 81.6 14.51972/73 39.3 9.2 86.0 5.41973/74 43.5 10.7 90.4 5.11974/75 53.8 23.7 96.9 7.21975/76 66.6 23.8 103.9 7.21976/77 73.2 9.9 109.4 5.31977/78 90.0 23.0 129.1 18.01978/79 122.0 35.6 161.2 24.91979/80 143.8 17.9 171.2 6.21980/81 166.9 16.1 166.9 -2.51981/82 179.1 7.3 162.2 -2.81982/83 207.7 16.0 173.1 6.71983/84 238.9 15.0 175.4 1.31984/85 296.2 24.0 195.9 11.71985/86 373.5 26.1 214.9 9.71986/87 391.1 4.7 195.8 -8.91987/88 450.2 15.1 178.0 -9.11988/89 653.7 45.2 196.8 10.61989/90 844.6 29.2 219.7 11.61990/91 888.0 5.1 207.0 -5.81991/92 921.7 3.8 192.0 -7.31992/93 1,123.6 21.9 190.0 -1.01993/94 1,346.8 19.9 185.5 -2.4
Source: Malawi Government Economic Reports (various issues).Note: High rates of inflation explain the drop-off in real revenues over 1990–1994.

TAX REFORM AND TAX YIELD IN MALAWI 5
Table 2: The growth of central government expenditure in Malawi
Fiscal Total Annual Recurrent Annualyear expenditure percentage expenditure percentage
in real change in real terms changeterms (Kmn)(Kmn)
1970/71 196.3 - 115.2 -1971/72 185.0 -5.8 114.5 -0.61972/73 181.2 -2.1 124.7 8.91973/74 191.3 5.6 128.3 2.91974/75 206.5 7.9 133.0 3.71975/76 240.9 16.7 131.7 -1.01976/77 213.0 -11.6 129.5 -1.71977/78 256.1 20.2 146.2 12.91978/79 327.6 27.9 177.7 21.61979/80 364.1 11.1 186.4 4.91980/81 358.6 -1.5 183.7 -1.51981/82 355.8 -0.8 201.0 9.41982/83 333.6 -6.2 217.3 8.11983/84 317.2 -4.9 218.3 0.51984/85 332.8 4.9 241.3 10.51985/86 352.0 5.8 244.9 1.51986/87 399.1 13.4 280.7 14.61987/88 325.8 -18.4 243.8 -13.21988/89 322.5 -1.0 209.3 -14.21989/90 336.3 4.3 250.5 19.71990/91 319.8 -4.9 247.2 -1.31991/92 333.8 4.4 254.0 2.81992/93 355.7 6.6 276.6 8.91993/94 323.8 -9.0 261.0 -5.6
Source: Malawi Government, Economic Reports (various issues).

6 RESEARCH PAPER 81
Table 3: Central government recurrent expenditure (K million) in real terms
Fiscal General Social Economic Unallocableyear services1 services2 services3 services
1970/71 28.1 30.5 13.4 43.11971/72 30.3 30.5 13.3 40.61972/73 28.7 32.6 17.0 46.41973/74 32.7 33.8 15.8 46.11974/75 34.5 33.9 17.5 45.41975/76 41.4 32.5 16.9 40.91976/77 44.9 33.7 28.1 22.81977/78 54.8 34.8 31.0 34.81978/79 66.8 43.1 34.2 41.41979/80 67.3 43.9 35.7 59.21980/81 59.6 44.2 33.1 70.71981/82 66.6 46.8 35.9 98.01982/83 70.1 44.2 41.6 76.21983/84 69.8 45.8 39.9 76.11984/85 67.0 49.2 40.3 119.11985/86 82.6 50.6 44.1 121.51986/87 78.7 62.4 46.5 141.81987/88 69.1 50.0 39.1 130.11988/89 69.9 47.0 38.1 100.11989/90 81.8 54.3 41.6 109.41990/91 93.2 55.7 37.5 93.81991/92 72.2 44.8 63.8 95.51992/93 98.4 57.0 66.9 82.3
Source: Malawi Government, Economic Reports (various issues).
1. General administration, defense, justice and public order.2. Education, health, community and social development.3. Natural resources, transport, posts and telecommunications, and other economic services.4. Public debt servicing and gratuities and other unallocable services

TAX REFORM AND TAX YIELD IN MALAWI 7
Table 4: Malawi: Central government total tax revenue, total revenue and totalexpenditure as percentage of GDP
Year Total tax Total Totalrevenue revenue expenditure
1970/71 11.3 15.4 33.31980/81 17.8 19.049.73
1981/82 16.2 20.0 32.21982/83 16.7 19.6 32.21983/84 16.6 19.9 30.11984/85 17.3 20.7 29.51985/86 19.2 22.7 30.01986/87 17.8 22.5 34.31987/88 16.3 21.2 29.91988/89 18.4 21.2 29.21989/90 19.2 22.628.61990/91 17.5 20.6 27.11991/92 16.6 19.2 25.01992/93 16.3 19.131.43
1993/941 14.5 21.9 25.41994/952 15.4 22.023.4
Source: Malawi Government, Economic Reports (various issues).
1. Revised estimates.2. Estimates.3. The high expenditure ratios are due to drought-related expenditure.

8 RESEARCH PAPER 81
Table 5: Central government tax revenue as percentage of GDP in selected sub-SaharanAfrican countries
1980 1985 1990
Low-income
Burundi 12.6 - -Burkina Faso 12.6 10.6 -Kenya 21.1 18.8 19.3Lesotho 29.21 38.7 37.1Liberia 20.8 18.8 17.44
Malawi2 16.2 18.3 19.2The Gambia 19.9 15.6 18.5Sierra Leone 14.8 5.4 7.5Tanzania 17.4 17.5Togo 25.4 22.6 20.03
Uganda 3.2 10.9 -Zambia 19.4 20.2 -Zimbabwe 19.2 28.4 -Simple average 17.8 18.8 19.9
Lower-middle-income
Cameroon 13.6 14.1 -Congo 24.5 - -Côte d’Ivoire 19.6 20.8 -Swaziland 29.0 26.7 - Simple average 21.7 20.5 -
Upper-middle-income
Botswana 24.9 23.0 28.6Gabon 23.5 27.3 -South Africa 18.6 21.8 25.74
Simple average 22.3 24.0 27.2
Source: IMF, Government Finance Statistics (various issues).
1. 1982.2. By 1993 the tax ratio had declined to 14.5%.3. 1987.4. 1989.

TAX REFORM AND TAX YIELD IN MALAWI 9
Table 6: Trends in total public expenditure, revenue and the budget deficit (K million)
Fiscal Total Total Grants Overall Overallyear expenditure revenue deficit deficit as
and percentagegrants of GDP
1970/71 80.1 43.9 - 36.21971/72 81.6 50.2 - 31.4 9.41972/73 82.8 56.9 1.5 25.9 7.21973/74 92.0 63.1 3.7 28.9 7.21974/75 114.6 58.7 1.3 55.9 11.51975/76 154.4 70.8 11.0 83.6 14.71976/77 142.5 105.2 9.4 37.3 5.71977/78 178.5 132.3 16.0 46.2 9.11978/79 248.0 174.6 26.0 73.4 9.21979/80 305.8 221.6 34.6 84.2 9.61980/81 358.6 242.5 43.3 116.1 11.11981/82 392.8 263.2 42.2 129.6 11.71982/83 400.3 286.0 41.7 114.3 9.21983/84 432.0 319.7 33.7 112.3 7.81984/85 503.2 393.7 40.5 109.5 6.41985/86 611.8 471.3 47.6 140.5 6.31986/87 797.0 544.6 51.7 252.4 11.51987/88 823.9 652.4 69.0 171.5 6.21988/89 1,071.3 962.1 209.2 109.2 3.11989/90 1,292.9 1,162.6 171.6 130.3 2.11990/91 1,371.8 1,155.9 112.7 215.9 4.21991/92 1,602.4 1,389.9 208.0 212.5 3.51992/93 2,103.1 1,610.9 231.8 492.2 6.81993/94 2,350.9 2,030.1 451.9 320.8 3.5
Source: Malawi Government, Economic Reports (various issues).

10 RESEARCH PAPER 81
Table 7: Central government overall budget deficit and its financing (K’000)
Year Overall budget Foreign Domesticdeficit loans borrowing
(net) (net)
1970/71 46,179 41,219 4,9601980/81 116,100 40,000 76,1001981/82 129,600 31,300 98,3001982/83 114,300 75,200 39,1001983/84 112,300 95,000 17,3001984/85 109,400 53,000 56,4001985/86 122,200 73,500 48,7001986/87 252,400 99,500 152,9001987/88 171,500 80,000 91,5001988/89 109,200 163,000 -53,8001989/90 92,700 190,600 -97,9001990/91 215,980 265,400 -49,4201991/92 212,510 202,400 -10,1101992/93 492,250 398,410 93,8401993/941 320,830 693,540 -372,7101994/952 161,480 679,770 -518,290
Source: Malawi Government, Economic Repots (various isues).
1. Revised estimates.2. Estimates.

TAX REFORM AND TAX YIELD IN MALAWI 11
III. Malawi’s tax system in the 1970s
In seven of the ten years between 1970 and 1979, the government neither altered existingtax rates nor introduced new ones. The reason for this was that the revenue budget wasoften either balanced or in surplus. In the event that there was a deficit, the deficit wascovered by drawing on accumulated reserves. Tax changes occurred only in the 1970/71, 1971/72 and 1977/78 fiscal years.
Tax changes and reforms
When the 1970/71 budget was being prepared, the government faced the prospect of aK2.5 million deficit on the revenue budget. In order to cover this deficit, it took a numberof measures to raise tax rates and introduced a new tax. The company tax rate was raisedfrom 35 tambala to 40 tambala on the kwacha. The specific customs duty on diesel fuelwas increased by 2 tambala per gallon and the specific excise duty on traditional beerwas increased from 5 tambala to 8 tambala per gallon.
A general sales tax (known as surtax) was introduced for the first time in the 1970/71budget. More about this tax later. Other measures, which also had the effect of changingthe structure of taxation, were introduced. These were the reduction in the maximumpay as you earn (PAYE) tax rate on chargeable income from 60 tambala to 40 tambala onthe kwacha, and rationalization of the tax structure, including the reduction in the numberof steps in income taxation. These changes were expected to have four desired effects.First, they would reduce the amount of labour involved in calculating the tax due. Second,they would remove the incentive to avoid taxation since the maximum rate of personaltaxation would be the same as the company tax rate. Third, they would encourage hardwork, saving and capital accumulation as they would raise the disposable income of thetaxpaying public. Fourth, they would provide for the separate assessment of workingwives, hence simplify income taxation.
Faced with the prospect of another revenue account deficit of K2.5 million in the1971/72 fiscal year, the government raised the surtax rate from 5% to 10% while abolishingan additional customs duty of 81/3% that had been introduced in 1969. Meanwhile, theminimum tax was reduced by 25 tambala from K3.75 to K3.50.
1977/78 was another eventful fiscal year. The prospect of a K4.07 million deficit onthe revenue account prompted the increase of specific import duty rates on importedbeer, wines, spirits and cigarettes, and of ad valorem import duty rates on a wide range ofconsumer goods and luxury items. The excise tax on Malawi gin was raised, and themaximum income (personal and company) tax rate was increased from 40% to 45%.

12 RESEARCH PAPER 81
Tax structure
Appendix A contains details of taxation in Malawi just before 1970. Appendix B TablesB1 and B2 show central government revenue as percentage of GDP and composition oftax revenue by major categories for the period 1970/71 to 1979/80.
From the information and data in these tables, a number of features can be discerned.First, in terms of the number of taxes, the tax base of the Malawi economy was seeminglyfairly broad. However, taking the relative yield of the various taxes into account, thebase was rather narrow. It consisted of company profits (on which company tax waspaid), earnings of employees in the high income group (on which PAYE was paid),imports (on which import duties were paid) and domestic goods (on which surtax andexcise duties were paid).
Second, changes occurred in the relative importance of different taxes. Import duties,which were the single largest source of revenue in 1970/7,1 lost that position during thedecade and were only third in 1979/80, despite the increase in import duty rates on anumber of goods in 1977/78. The relative decline of import duties was due to a shift inthe composition of imports from consumer goods, which were taxed more, to intermediateand capital goods, which were taxed less, and to the large increase in revenue from othertaxes. These included company tax, which retained its position as the second mostimportant source of revenue. The company tax rate was adjusted upward, as mentionedabove. In addition, company profits, the tax base, increased over the decade.
Surtax shifted its position from third in 1970/71 to first in 1979/80. Here too, the taxbase rose as a result of an increase in domestically manufactured goods. Furthermore,the surtax rate was doubled, as noted above.
Next in importance as sources of revenue were PAYE and excise duties, which didnot change their positions; they remained fourth and fifth, respectively, during the 1970s.An account of import duties, company tax, surtax, PAYE, excise duties and other taxesfollows.
Import duties
Before 1970, import duties (customs and others) were the main indirect taxes. Theabsolute and relative yield from customs duties was high.
At the time of independence the average customs duty rate was about 10%, but by1968 it had reached 16%. In 1969 it rose above 16% following the imposition of ageneral surcharge of 8 1
3 % — but even then the average duty rate was probably lowerthan in some of the other African countries.
Company income taxThis tax was governed by the Income Tax Ordinance, 1963, as amended. Generousconcessions and capital allowances were provided, the purpose of which was to encourageprivate investment by making investment funds readily available out of profits, by reducing

TAX REFORM AND TAX YIELD IN MALAWI 13
risks and by making it possible for investors to recover capital costs in a relatively shorttime. The implication for public revenue was that the government did not share in thebenefits as much as it would have done otherwise. Other sectors had to bear a larger taxburden. Further details can be found in Appendix A.
SurtaxThis tax was originally fixed at 5% of the normal ex-factory selling price, includingexcise duties on local manufactures or 5% of the landed cost of equivalent importedmanufactures after customs duty, augmented by a 20% margin representing thehypothetical cost of transport to the main consuming centres, where locally made goodsmight compete. The 20% margin was probably an attempt to tax some service inputslike value added by transport. Another interpretation is that it was an attempt to protectdomestic producers. As a local sales tax, it exempted exports, capital goods andmanufactures imported duty-free, mainly low-income basic consumer goods. The surtaxyielded 10% of total tax revenue in 1970/71, compared with 8% brought in by exciseduties.
PAYE taxPersonal income tax, like company tax, was governed by the Income Tax Ordinance,1963, as amended. Charges were calculated under two schemes, the larger amount beingthe one payable. Thus it was difficult to escape without paying something. The methodof taxation under Scheme 1 was as shown in Appendix A, except that taxable incomeclasses went up to K1,201 and above. Between taxpayers at different points in the incomebracket taxation was unfair, as illustrated in Table 8.
Table 8: Assessed tax rates
Taxable Class Rate Percentage Tax RateIncome mid-point of
annual At class At Attax mid-point lower upper
limit limit
K2-K122 K62.00 K3.75 6.1 187.5 3.1
K124-K240 K182.00 K5.75 3.2 4.6 2.4
K242-K400 K321.00 K10.00 3.1 4.1 2.5
K402-K600 K501.00 K15.00 3.0 3.7 2.5
K602-K900 K751.00 K22.00 2.9 3.6 2.4
Under Scheme 2, personal allowances were deducted from taxable income in order toarrive at chargeable income. Only contributions to approved pension funds weredeductible under Scheme 1. On the whole, allowances were built in largely to satisfy theneeds of expatriates (0.5% of the total population) in the country.

14 RESEARCH PAPER 81
The allowances themselves were very generous. The single allowance at K600 peryear could possibly be reduced to K400. The marriage allowance at K1,440 per annumwas hard to justify. It was applied even to women who did not work. The same womenwere not subjected to the minimum tax.
Child allowance helped parents to take care of their children. But what mattered tomost taxpayers was not what it cost them to bring up their own children, but what it costthem to help all their relatives during the course of each year. What was required wasnot that all relatives should be allowed deductions from the taxpayer’s taxable income,for the Treasury would suffer, but that a lump sum of K200 should be granted to everybody,married and unmarried.
Relief for pension fund and life insurance contributions was beneficial, but the habitof taking out a life policy was not very common among most taxpayers. Insofar as thisrelief applied to resident expatriates, it fostered accumulation of wealth that benefittedtheir home countries rather than Malawi. A move to make it applicable to citizens onlywould have been useful.
Excise duties
Malawi’s excise duty structure followed the Commonwealth tradition. Excise dutieswere imposed mainly at specific rates on a limited list of sumptuary items and on domesticgoods only. The main revenue generators were beer, cigarettes and liquor, all of whichare relatively price inelastic. Other important items on which excise duties were leviedare soap, sugar and cotton.
Graduated tax
This tax was imposed on employees whose earnings did not exceed K900 per annum.The responsibility for its collection was placed on employers, who were required to affixgraduated tax stamps to tax cards. The tax was calculated and imposed at rates providedby the Department of Taxes.
There were two undesirable features of this tax that needed removing. One was thepractice of grouping taxable income so that the same amount was paid over a big interval(say 48t for income from K11.08 to K20.00 per month). The person who earned K11.08or close to this limit paid a higher proportion of income in tax than somebody whoearned K20.00 or close to this limit. Second, as income increased, the proportion paid intax actually declined. Thus the richer bore a smaller burden than the poorer.
The great merit of this tax was that it was related to ability to pay. It wasadministratively efficient because the cost of collection was partly incurred by theemployer. No allowances were given. This was legitimate enough since the tax rateswere low.

TAX REFORM AND TAX YIELD IN MALAWI 15
Minimum tax
A minimum tax of K3.75, later reduced to K3.50, was payable by all male persons inMalawi who had attained the age of 18 years on the first day of each tax year, unless theywere liable for other types of taxes, and also by people who worked under contract inSouth Africa. The numbers assessed in the tax year ending on 31 March 1968 were402,647 at home and 42,919 in South Africa. People who were sick, aged or undergoingstudies without means were exempted from the tax.
The merit of this tax was that it was simple and it applied to an easily recognizablegroup of persons who knew when and where to pay it. However, it was not easy tocollect in practice. Substantial resources of the District Administration were spent oncollecting it. Collectors and others who handled the revenue lost huge sums each year.In fact, the amount spent on collecting this tax often exceeded the revenue it brought in.
Equally serious was the fact that the minimum tax was regressive and unfair since itwas not related to income and wealth. A peasant with a substantial cash income, be itfrom farming, fishing, trading or crafts, paid the same sum in tax as someone whose cashincome earned and enjoyed under the protection of the state was much less. For example,fishermen on Lake Chilwa could easily gross K320 each in good years and yet the directtax they were subjected to was only K3.75. A boy under the age of 18 who earned cashincome from the sources cited above was exempt from all direct taxation while a boy ofthe same age who worked paid graduated tax. The fact that there were 33,903 tax defaultersin 1967 shows that there were individuals in the country who could not afford to pay it.
Moreover, the minimum tax was based on gender, which introduced another elementof discrimination; men were in fact discriminated against. What justification could begiven for this discrimination? Women look after babies and do a lot of home activitiesconnected with the production and preparation of food, while men may be having freetime at certain seasons. But then only men go out to seek employment in neighbouringcountries. The point is that it is hard to justify that the family obligations of one genderare greater than those of another. Commercial activities in Malawi as in other countriesare shared by both genders. Women are particularly active in selling produce in localmarkets, and in brewing and selling beer, to give just two examples of areas in whichthey dominate.
If both genders were subjected to the minimum tax, revenue from this source wouldhave more than doubled, i.e., a sum in excess of K1.6 million would have been collectedin 1969. However, this would not have removed all unfairness since taxation would stillbe based on existence and not on income and wealth. And the relative yield would stillnot be particularly high (Appendix B Tables B1 and B2).
Assessed tax
This tax was devised to deal with cases of small tax liability arising from income otherthan earnings in the rural areas of Malawi, thus it taxed business income. Rural Assessment

16 RESEARCH PAPER 81
Boards, appointed by the Minister, had powers to deal with assessed tax in cases whereincome did not exceed K900 per annum.
Like the graduated tax, this tax was related to ability to pay, that is business receiptsand possibly less legitimate expenses. It was administered by boards composed of localpeople who took local business conditions into account. The tax rate structure used wassimilar to the one for the graduated tax.
The number of people assessed in the tax year ending on 31 March 1968 was 8,000,which shows that the definition of business adopted was rather narrow. It would be fairto say that everybody was a “business person”. In that tax year each assessed businessperson paid on the average K7.00. Suppose that all rural families paid the same amounton the average! The revenue accruing would exceed K5,463,500.
The data in Table 8 sum up what has been said concerning the unfairness of taxeswhere taxable income was grouped into classes and a single tax applied to each class.The people whose taxable income fell in mid-range suffered a smaller burden than thoseat the bottom but a higher one than those at the top.
These shortcomings could be removed only by charging taxable income by the kwacha.The arithmetic involved was within the ability of the people who collected the tax. Andso the simplification of the tax could not be justified on grounds of administrativeexpediency.

TAX REFORM AND TAX YIELD IN MALAWI 17
IV. Tax changes, reforms and structure in the1980s and 1990s
Tax changes and reforms
Except for the year 1980 when the revenue budget was in surplus, discretionary changesin taxation occurred every fiscal year during the 1980s. Unlike the 1970s, during the1980s a number of factors necessitated higher levels of public expenditure. First therewas the 1979/80 drought, which reduced food production and led to increased publicexpenditure on food imports and distribution. Then there was the increase in the servicingof external and internal debts, the increase in defense spending due to the deterioratingsecurity situation in the region; the increase in transport costs following the severing ofthe shorter land routes to the sea through Mozambique; and the influx of Mozambicanrefugees (one million of them) who had to be provided for.
In the early 1980s, the rate of growth of nominal tax revenue was unsatisfactory. Inreal terms, in fact, the growth rate was actually negative (Table 1). Two recessions,during 1980-1982 and 1986–1988, adversely affected the growth of tax revenue. As aresult, the revenue budget was in deficit and measures had to be taken to increase thebuoyancy of the tax system and hence to increase tax revenue.
The measures introduced in the 1981/82 and 1982/83 fiscal years were isolateddiscretionary changes. From 1983/84, the changes were part of a conscious tax reformprogramme. In brief, government acted to raise tax rates, to increase the tax base byincreasing the number of items and activities to which taxes applied, and to increase thetax base by introducing new taxes.
Surtax rates, import duties and excise duties were raised almost every year except in1989/90, when certain excise and import duties were reduced. By 1988/89, the highestsurtax rate was 85%, but there were some items that were still exempt from this tax.Surprisingly, specific duties continued to be levied on a number of products except softdrinks, beer, potable spirits, cigarettes and other tobacco products where the change toad valorem duties was effected in the 1988/89 fiscal year. The excise duties on theseproducts then were 10%, 50%, 60%, 30% and 60%, respectively.
Income tax rates were raised as follows: for companies from 45% to 50% from 1April 1981; and for individuals from 45% to 50% from 1 April 1982. In 1983/84, anattempt was made to simplify the income tax system and improve equity at the sametime that an attempt was made to improve income tax yield. First, the two personalincome tax schedules were merged into one. Second, several personal allowances, suchas single and marriage allowances and children’s and educational allowances wereabolished. The land tax was increased from K7.41 per hectare to K10.00 per hectare in
18 RESEARCH PAPER 81
1985/86, after having been increased from K1.00 to K3.00 per acre in 1984/85.The number of items and activities that became subject to taxation are too numerous
to mention here. Taxes included surtax and excise duties mainly, but also import duties.What may be interesting to note was the extension of surtax to services, such as repair,laundry, etc., and the extension of income tax to insurance companies and to commercialand statutory corporations. In contrast, dividends received by taxpayers other thanindividuals were excluded from taxable income beginning in 1981/82.
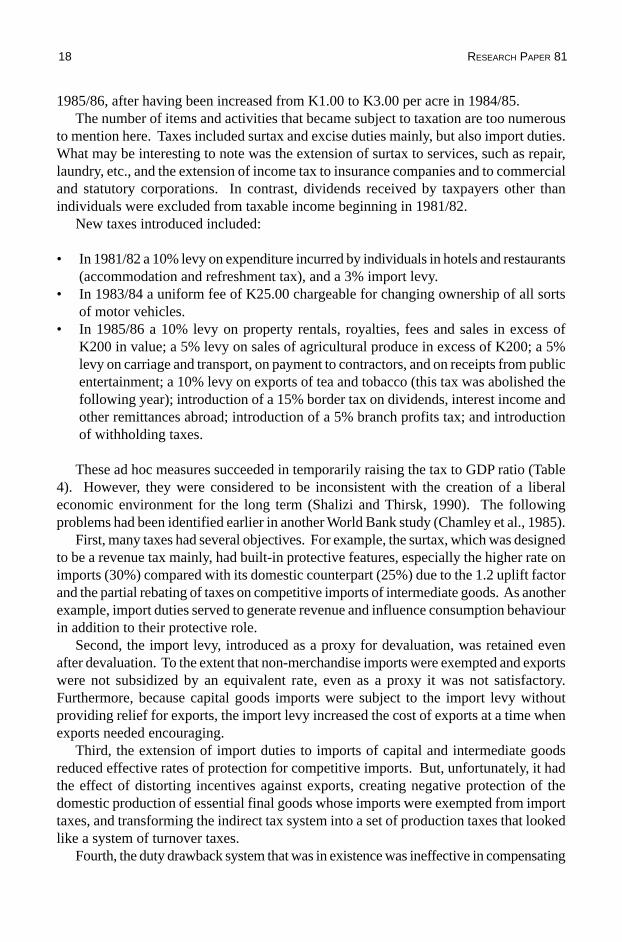
New taxes introduced included:
• In 1981/82 a 10% levy on expenditure incurred by individuals in hotels and restaurants(accommodation and refreshment tax), and a 3% import levy.
• In 1983/84 a uniform fee of K25.00 chargeable for changing ownership of all sortsof motor vehicles.
• In 1985/86 a 10% levy on property rentals, royalties, fees and sales in excess ofK200 in value; a 5% levy on sales of agricultural produce in excess of K200; a 5%levy on carriage and transport, on payment to contractors, and on receipts from publicentertainment; a 10% levy on exports of tea and tobacco (this tax was abolished thefollowing year); introduction of a 15% border tax on dividends, interest income andother remittances abroad; introduction of a 5% branch profits tax; and introductionof withholding taxes.
These ad hoc measures succeeded in temporarily raising the tax to GDP ratio (Table4). However, they were considered to be inconsistent with the creation of a liberaleconomic environment for the long term (Shalizi and Thirsk, 1990). The followingproblems had been identified earlier in another World Bank study (Chamley et al., 1985).
First, many taxes had several objectives. For example, the surtax, which was designedto be a revenue tax mainly, had built-in protective features, especially the higher rate onimports (30%) compared with its domestic counterpart (25%) due to the 1.2 uplift factorand the partial rebating of taxes on competitive imports of intermediate goods. As anotherexample, import duties served to generate revenue and influence consumption behaviourin addition to their protective role.
Second, the import levy, introduced as a proxy for devaluation, was retained evenafter devaluation. To the extent that non-merchandise imports were exempted and exportswere not subsidized by an equivalent rate, even as a proxy it was not satisfactory.Furthermore, because capital goods imports were subject to the import levy withoutproviding relief for exports, the import levy increased the cost of exports at a time whenexports needed encouraging.
Third, the extension of import duties to imports of capital and intermediate goodsreduced effective rates of protection for competitive imports. But, unfortunately, it hadthe effect of distorting incentives against exports, creating negative protection of thedomestic production of essential final goods whose imports were exempted from importtaxes, and transforming the indirect tax system into a set of production taxes that lookedlike a system of turnover taxes.
Fourth, the duty drawback system that was in existence was ineffective in compensating

TAX REFORM AND TAX YIELD IN MALAWI 19
exports for reasons that included narrowness in scope (it covered only 30 exportedproducts), the requirement that the entire product should be exported and the requirementthat the product should not be exported through a distributor.
Fifth, taxes on agricultural exports made it difficult for Malawi to compete oninternational markets. Sixth, the ad hoc changes in trade and commodity taxes as well asin personal income taxes undermined the equity features of the tax system.
Seventh, the increase in taxation of imported capital goods and in company tax rateswere thought to have an adverse impact on investment.
Eighth, overall tax rates on incomes, goods, services and activities had becomerelatively high. Moreover, the various taxes were applied to a relatively narrow tax basemade up of public sector employees, employees of large firms, the income of formalsector private firms, and traditional excisable products and imports. These probablyaccounted for no more than a third of GDP. Hence the tax to GDP ratio of about 17% in1983 and 1984 was about 50% of the value added of the modern sectors of the economy.
In reaction to these concerns, the government reduced excise duties on sugar, textilefabrics, soap, beer and liquor in the 1989/90 fiscal year. But the main reform started inthe 1990/91 fiscal year (Malawi Government, 1990). The basic philosophy was thathigh tax rates did not necessarily ensure high tax yield because they encouraged taxevasion. In addition, they did not ensure a high rate of economic development as theyreduced incentives to produce and to supply factors of production. They also adverselyaffected the level of aggregate demand by reducing disposable income. Accordingly,Malawi embarked on its medium-term programme of reducing direct taxes as well asindirect taxes on consumer and producer goods. Over a period of three years, themaximum marginal rate of personal income tax was cut from 50% to 35%. The companyincome tax rate was similarly reduced, to 35% from 50%. The graduated tax rate wascut and simplified by reducing the number of income brackets to which it applied. Theminimum tax of K3.50 was abolished in the 1993/94 budget; the graduated tax faced asimilar fate in the 1994/95 budget.
Although the government has tried to offset the loss in revenue from these measuresby increasing certain indirect taxes, the result of the recent tax reform effort seems tohave been a reduction in the ratio of tax revenue to GDP (Table 4). Thus, both buoyancyand tax elasticity may have been sacrificed.
Administrative reforms
A number of administrative reforms accompanied the tax reforms of the 1980s. In 1983,employers were given responsibility for verifying PAYE tax assessments, thus relievingthe Department of Taxes of this task. As recommended earlier by the IMF, taxpayeridentification numbers were issued in December 1988; computerization, staff training,the redesign of forms and documents, and the introduction of a document control systemwere all completed at the Department of Taxes in 1990.
However, these reforms did not address the problem of the level of general educationof staff recruited into the Department of Taxes. The department recruits clerical and

20 RESEARCH PAPER 81
executive officer cadres mainly whose level of judgement is low and who take a longtime to develop competence in their work. Then there is the general civil service problemof low rates of pay, which results in low morale and a high rate of staff turnover.
Other tax collecting departments — the Department of Customs and Excise and DistrictCommissioners’ offices — were not covered by the reforms discussed above.
The administrative reforms also did not consciously address the problem of corruptionamong tax collectors and of fraud among taxpayers, both of which facilitate tax evasion.
Tax structure
Following increases in surtax rates and in the number of goods and services to whichsurtax was applied, revenue from surtax increased from 30.06% in 1979/80 to 34.95% asa proportion of total tax revenue. Surtax easily retained its position as the single largestsource of tax revenue (Appendix B, Table B4).
Second to surtax were import duties. Despite a further decline in the proportion ofdutiable imports in total imports, import duties moved from third to second position as asource of tax revenue. This improvement was assisted by an increase in import dutyrates and by an increase in the number of items that were subject to import duties.
Company tax moved from second place in 1979/80 to third place in 1993/94. Thisshift was mainly due to a reduction in the company tax rate. PAYE and excise dutiesretained their respective fourth and fifth positions.

TAX REFORM AND TAX YIELD IN MALAWI 21
V. Methodology
Estimation of tax elasticity and buoyancy
Elasticity of tax revenue is usually presented with respect to income in aggregate modelsas a single number. More appropriately, it is conceived as a weighted average of elasticitiesof separate taxes that differ in response to changes in income. The elasticity of the taxsystem should thus be investigated by analysing separately elasticities of individual taxes.First, the income elasticity of each separate tax is broken into two components: theelasticity of the tax to the base and the elasticity of the base to income. FollowingMansfield (1972), these elasticities can be defined as:
• Elasticity of total tax revenue to income
• Elasticity of k-th individual tax to income
ET KY = (∆T / ∆Y )(Y / TK )
• Elasticity of k-th individual tax to base
ET KY = (∆Tt / ∆BK )(Y / BK )
• Elasticity of k-th individual base to income
EBKY = (∆BK / ∆Y )(Y / BK )
where Tt is total tax revenue, T
K is tax revenue from the k-th tax, Y is income measured
by gross domestic product (GDP), B is the base of the k-th tax, and ∆ is a discrete changein the variable associated with it.
In a tax system made up of several taxes
ET tY = (∆Tt / ∆Y )(Y / Tt )

22 RESEARCH PAPER 81
ET tY = T1
Tt
∆T1
∆Yx
Y
T1
+....+ TK
Tt
∆TK
∆Yx
Y
TK
+....
+ Tn
Tt
∆Tn
∆Yx
Y
Tn
(1)
In other words, the elasticity of total tax revenue to income is equal to the weightedsum of individual tax elasticities, with the fractional distribution to total tax by eachindividual tax serving as its weight. The elasticity of any individual tax can be decomposedinto the product of elasticity of the tax to its base and the elasticity of base to income asfollows:
ET KY = ∆TK
∆BK
xBK
TK
∆BK
∆Yx
Y
BK
(2)
Combining the two equations above, we get:
+...+ TK
Tt
∆TK
∆BK
xBK
TK
∆BK
Yx
Y
BK
+...+ Tn
Tt
∆Tn
∆Bn
xBn
Tn
∆Bn
Yx
Y
Bn
(3)
which is the elasticity of total tax revenue to income in a system of n taxes where elasticitydepends on the product of the elasticity of tax to base and elasticity of base to income foreach separate tax, weighted by the importance of each tax in the total tax system. Equation3 can permit identification of sources of revenue growth and identification of that part ofrevenue growth policy makers can control (Mansfield, 1972).
The traditional way of estimating elasticity of a particular tax, k, is by using thefollowing model:
TK = tKYβ KeK(4)
which may be expressed in double log form as
ET KY = T1
Tt
∆T1
∆B1
xB1
T1
∆B1
∆Yx
Y
B1

TAX REFORM AND TAX YIELD IN MALAWI 23
logTk = log tk +βK logY + logeK (4')
where T is revenue from tax k, t is a constant term, βk is an estimate of elasticity of the k-
th tax, Y is GDP and eK is a stochastic disturbance term.
To estimate elasticity of tax to income where there have been discretionary changesin tax policy, the model must be modified to correct for such policy changes: e.g., changesin the tax base, tax rates, efficiency of tax administration, introduction of new taxes orabolition of some taxes, etc. The procedure entails adjusting historical tax revenue seriesto eliminate the effects on tax revenue of all factors apart from GDP. One technique fordoing so, developed by Prest (1962), involves cleaning data on discretionary revenuechanges using official data on discretionary revenue. Cleaning is done by applying thefollowing formula to the data to compute adjusted tax revenue (AT):
ATn-j
= Tn-j
(ATn-j
+ 1/(Tn-j
+ 1 - Dn-j
+ 1 )) (5)
for j = 1, 2, ....... n-1
, where T is actual tax revenue, D is estimated discretionary taxrevenue and the subscript denotes the year of the data. Essentially, this technique estimateswhat the tax receipts would be in the absence of discretionary changes. The validity ofthe technique is contingent on the assumption that discretionary changes are more or lessprogressive than the tax structure that they modified (Leuthold and N’Guessan, 1986).
Having modified the tax revenue data, the model can be estimated on the adjusteddata as:
log ATk = log t
K + β
K log Y + log u
k(6)
where AT is the adjusted revenue from tax k, tK is a constant and β
K is an estimate of
elasticity of the k-th tax.To estimate buoyancy, one needs to run the regression:
log Tk = log a
K + b
K log Y + u
k(7)
where Tk is revenue from tax k, Y is GDP and v
K is a stochastic disturbance term. Ordinary
least squares can be used to estimate the constant aK and coefficient b
K. As the estimation
model is in double log form, bk is an estimate of tax buoyancy since it measures the
percentage change in Tk for a one percentage change in Y.
But since the data are generated by Equation 4, we can solve for what the disturbanceterm v
k is:
vk = log t
k - log a
k + log u
k(8)
What we have in Equation 7, then, is a regression with a missing term (log tk - log a
k).
From Theil’s theorem, we know that bk will end up being a biased estimate of β
K, with

24 RESEARCH PAPER 81
E (bk) = β
k +δ
k(9)
where δ k is the coefficient in a regression of log Y on log t and b
K is the ordinary least
squares estimate of βK.
Y will normally be trending upward. Therefore the sign of βK
will depend on whethert has also been trending upward, or downward. As long as log t moves in only onegeneral direction over the sample, we can say that buoyancy and elasticity have thestandard interpretation: buoyancy greater than elasticity implies that discretionary changesimproved revenue yield of the tax and buoyancy less than elasticity implies that theyworsened the revenue yield.
Sometimes, however, buoyancy will come out very close to elasticity even thoughdiscretionary changes have been highly effective in altering tax yield upward or downward.In this case, δ
K ≈ 0. What this suggests is that the difference between buoyancy and
elasticity is driven by the correlation between discretionary changes and income.Buoyancy equal or nearly equal to elasticity does not mean that discretionary changesare not important.
An alternative method of estimating elasticity is the dummy variable techniquedeveloped by Singer (Singer, 1968). This method entails introducing a dummy variableinto Equation 4' for each exogenous tax policy change. The modified equation takes theform:
log Tk = log b
0K + b
1K log Y
i + ∑b
2i D
iK + e
k(10)
where the dummy variable, D, assumes the value 0 before the discretionary change and1 after the change. The summation takes care of the possibility of multiple changesduring the period covered. While this technique is simple, its usefulness in estimatingtax elasticity where the number of discretionary changes is large relative to the length ofthe data period may be limited.
The Data
The general data required for this study — tax and total revenue, recurrent and totalgovernment expenditure, GDP at current market prices, and foreign and local borrowing— have all been extracted from the (annual) economic reports of the Malawi government.These general data were sufficient for estimating the bouyancy of the tax system and ofindividual taxes.
For the purpose of estimating tax elasticity, the technique developed by Prest (Equation5) was used to obtain an adjusted total tax revenue series for the period 1970/71 to 1985/86 (Table 9). For the period after 1985/86, an adjusted total tax revenue series could notbe estimated because the data on additional tax revenue from discretionary changes arenot available.

TAX REFORM AND TAX YIELD IN MALAWI 25
Table 9: Actual total tax revenue, estimated discretionary tax revenue and adjustedtotal tax revenue in nominal terms (Kmillion)
Fiscal Actual total Estimated Adjustedyear tax revenue discretionary total tax
tax revenue1 revenue
1970/71 29.1 2.5 29.1
1971/72 36.0 2.5 33.5
1972/73 39.3 36.5
1973/74 43.5 40.5
1974/75 53.8 50.1
1975/76 66.6 61.9
1976/77 73.2 68.1
1977/78 90.0 4.1 76.3
1978/79 122.0 108.3
1979/80 143.8 127.7
1980/81 166.9 148.2
1981/82 179.1 8.8 143.8
1982/83 207.7 5.0 167.0
1983/84 238.9 11.0 179.1
1984/85 296.2 15.0 209.8
1985/86 373.5 44.9 215.7
Source: Malawi Government, Economic Reports and Budget Statements.1. As per budget statements.
The dummy variable technique developed by Singer (Equation 10) was used forestimating elasticity of individual taxes. We could not use the Prest technique becausedata on additional revenue from discretionary changes in individual taxes are not availablefor all the years.

26 RESEARCH PAPER 81
VI. Analysis of tax buoyancy
The estimates of buoyancy of the tax system, its major components and individual taxesfor the period 1970/71–1979/80 and the period 1980/81–1993/94 can be found in Table10. The regressions shown in this table are good fits of the data on revenue and income(see Appendix C, Table C1).
As measured by the estimated regression coefficient, buoyancy of total tax revenue at0.993 for the period 1970/71–1979/80 was almost unity. Whereas taxes on income andprofit as a group and stamp duties were generally buoyant, taxes on goods and services,and on international trade, were not. The buoyancy of taxes on property was actuallynegative.
Company income tax, PAYE tax and surtax all experienced buoyancy during the1970/71–1979/80 period. In all cases, there were upward adjustments in tax rates. Stampduties were the other category of taxes that exhibited buoyancy between 1970/71 and1979/80. These taxes are difficult to evade and avoid.
The low buoyancy of taxes on individuals during this period was due to the lowbuoyancy of the minimum tax, minimum tax remittances, the graduated tax and theassessed tax. For the minimum tax and the minimum tax remittances (non-resident tax)low buoyancy was due to the reduction of the rate of taxation. In addition, many taxpayersdid not comply with the tax. Low buoyancy of the graduated tax was accounted for bysimilar reasons. Not only were the tax rates not increased, but many employers engagingonly a few people or employing temporary labour did not deduct the appropriate taxfrom payrolls. As for the assessed tax, low buoyancy was due to difficulties encounteredby district commissioners in assessing tax liability.
With respect to taxes on goods and services and on international trade, the lowbuoyancy of excise, import and customs, and other duties was due to the fact that a largenumber of them were specific rather than ad valorem and that upward adjustments duringthis period were few. For licenses for goods and services, the low buoyancy might bedue to problems of compliance. The other problems with all these taxes might be taxevasion, tax exemptions, corrupt tax administration and the presence of a second economy,which facilitated tax evasion.
To facilitate comparison of buoyancy between the 1970-1979 period and the 1980-1993period, values of estimated intercepts (constants) and regression coefficients have beenreproduced in Table 11. For total tax revenue and for taxes on income and profit as agroup, the values of the intercepts increased, but those of the regression coefficientsdeclined, during 1980-1993 compared with 1970-1979. The same applies to companyincome tax, assessed tax, PAYE tax and surtax. For all these taxes, it is difficult toconclude that buoyancy changed.

TAX REFORM AND TAX YIELD IN MALAWI 27
Table 10: Estimates of tax buoyancy in Malawi
1970/71 1980/81 Percentage to to change
1979/80 1993/94
Taxes on income andprofit 1.170** 0.983** -15.983 Companies 1.449** 0.496** -65.769 Individuals 0.747 1.043** +39.963 Minimum 0.035 0.064 +82.286 Non-resident tax -2.143 0.670* +131.265 Graduated 0.606* 0.707* +16.667 Assessed tax 0.645* 0.357** -44.651 Withholding tax n.a. 1.714** n.a. Fringe benefits tax n.a. 0.025 n.a. PAYE 1.141* 0.987** -13.497
Taxes on property -0.707 0.784** +134.451
Stamp duties 1.063 1.233** +15.993
Taxes on goods andservices 0.683** 0.980** +43.485 Accommodation and refreshment tax n.a. 1.177* n.a. Surtax 1.495** 1.082** -27.625 Excise duties 0.620** 0.727** +17.258 Licenses for goods and services 0.275** 0.659** +139.636 Business and professional 0.019 0.459** +2315.789 Motor vehicle tax 0.392** 0.784 +100.000
International tradetaxes 0.521 0.826** +58.541 Customs duties 0.521 0.826** +58.541 Import duties 0.525 0.863** +64.381 Other duties 0.168 0.586** +248.809
Total tax revenue 0.993* 0.951**-4.223
*Significant at the 5% level of significance.**Significant at both 5% and 1% levels of significance.

28 RESEARCH PAPER 81
Table 11: Comparison of tax buoyancy between 1970–1979 and 1980–1993
Type of 1970-1979 1980-1993tax
Intercept Coefficient Intercept Coefficient
Taxes on income and profit -3.897 1.170** -2.561** 0.983** Companies -6.087 1.449** 0.670 0.496** Individuals -2.253 0.747* -3.907** 1.043** Minimum 0.376 0.035 0.422 0.064 Minimum tax-remittances 11.523 -2.143 -4.647 0.670* Graduated tax -3.175* 0.606* -4.006** 0.707** Assessed tax -5.972** 0.645* -3.837** 0.357** Withholding taxes - - -11.294** 1.714** Fringe benefits - - 2.408 0.025 PAYE -5.188 1.141* -3.703** 0.987**
Taxes on property 3.100 -0.707 -8.537** 0.784**
Stamp duties -7.601** 1.063 -8.895** 1.233**
Taxes on goods and services -0.787 0.683* -2.614** 0.980** Accommodation and refreshment tax - - -8.759** 1.177** Surtax -6.574 1.495* -3.562** 1.082** Excise duties -2.433 0.620* -2.877** 0.727** Licences for goods and services -1.143* 0.275** -3.340 0.659** Business and professional -0.903 0.019 -3.507** 0.459** Motor vehicle -2.172** 0.392** -4.499** 0.784**
International trade taxes -0.516 0.521 -1.924** 0.826** Customs duties -0.516 0.521 -1.924** 0.826** Import duties -0.538 0.525 -2.227** 0.863** Other duties -2.357 0.168 -4.849** 0.586**
Total tax revenue -1.964 0.993* -1.394**0.951**
*Significant at the 5% level of significance.**Significant at both 5% and 1% levels of significance.
For the majority of the other taxes the values of the intercepts decreased while thevalues of the regression coefficients increased during 1980–1993. These are taxes onindividuals as a subgroup, minimum tax remittances, graduated tax, taxes on property,stamp duties, taxes on goods and services as a group, excise duties, licenses for goodsand services as a subgroup, business and professional licenses, motor vehicle licenses,

TAX REFORM AND TAX YIELD IN MALAWI 29
customs duties, import duties, and other duties. Here too, it is difficult to conclude thatbuoyancy changed. Only for the minimum tax did the value of the intercept and co-efficient increase.
What may be safe to say is that during 1980–1993, the buoyancy of the tax system asa whole remained close to unity. Newly introduced withholding taxes and accommodationand refreshment tax were also buoyant. Compared with 1970–1979, the company incometax was probably not buoyant during 1980–1993, as the value of the regression coefficientfor the latter period was far below unity. Two known contributing factors were taxevasion and exemptions (Daily Times, 1994; Supplementary Budget Statement, 1994).
During 1980–1993, as during 1970–1979, other taxes on individuals–minimum tax,minimum tax remittances, graduated tax and assessed tax–were not buoyant, more orless for the reasons that have already been indicated. Fringe benefits tax, a newlyintroduced tax, was not buoyant either.
Taxes on goods and services, other than surtax and accommodation and refreshmentstax, and taxes on international trade as a group were also not buoyant. These were exciseduties, licenses, customs duties, import duties and other duties. There is increasingevidence that tax yield has been adversely affected by tax evasion and corruption (TheNation, 1994; Weekly Chronicle, 1994; The Independent, 1994).

30 RESEARCH PAPER 81
VII. Analysis of tax elasticity
Elasticity coefficients
Elasticities of major taxes and of the whole tax system for 1971–1979 are shown inAppendix C, Table C2, and those for the period 1980–1993 are shown in Table 12. During1971–1979, the whole tax system was income elastic, while individual taxes shown inAppendix C, Table C2, were all income inelastic. During 1980–1993, the income elasticityof the whole tax system declined. The elasticity coefficient for the whole tax system waslower than the one for the 1970–1979 period, but the intercept was higher.
Table 12: Elasticity of major taxes and of total tax system 1980–1993
Tax Intercept Elasticity Weight of tax Adjusted Tcoefficient in 1993 R2 ratio
(percentage oftotal)
1. Surtax 1.084** 0.212* 34.95 0.995 3.5412. Import duties -0.477 0.700* 20.12 0.990 3.2083. Company tax -0.879 0.808 18.57 0.974 2.4414. PAYE -2.165** 1.154** 16.99 0.989 11.8405. Excise duties 0.223 0.220 4.17 0.981 2.3416. Total of 1-6 99.027. Total tax system 0.823 0.602** 100.00 0.911 7.212
Weights were not used in the estimates.*Significant at 5% level of significance.**Significant at both 5% and 1% level of significance.
Among individual taxes, the elasticity coefficient of import duties, PAYE tax andexcise duties increased during the 1980–1993 period, but their intercepts declined. Theelasticity coefficients of surtax and company tax both declined, while their interceptsincreased. Surtax and excise duties had the lowest elasticities during 1980–1993. Furtherdetails of these and other elasticities are given in the next section.
Otherwise, for all the major taxes, changes in tax revenue in the 1980s and 1990swere systematically correlated with changes in GDP and in discretionary tax changes(represented by dummies in the estimation equations), as indicated by high values of

TAX REFORM AND TAX YIELD IN MALAWI 31
adjusted R2 of over 0.900. The adjusted R2 for the total tax system is also high at 0.911.There can be no doubt that tax revenues are functionally related to GDP. During 1971–1979, changes in tax revenue were also highly correlated with changes in GDP, as indicatedby high values of adjusted R2.
Decomposition of elasticities
As demonstrated above, the elasticity of a given tax consists of two elements: the base(tax to base elasticity) and the elasticity of the base to income (base to income elasticity).Thus income elasticity of a given tax is a product of tax to base and base to incomeelasticities.
Since the legal base of each tax is not known exactly, the yields of the major taxescovered here have been related to approximate or proxy bases. The proxy bases, in turn,have been related to GDP. The data in Table 13 summarize the relationships betweenthese two sets of variables for the period 1980 to 1993.
Surtax
Surtax is the single largest source of tax revenue in Malawi, accounting for 34.95% ofthe total in 1993. It is levied on some but not all locally manufactured goods and imports,and on a few services like telephone and hotel services. Imports cif plus domesticmanufacturing output has been chosen as the surtax base. Despite the low tax to incomeelasticity of 0.212, the proxy base to income elasticity (0.922) and the tax to proxy elasticity(1.165) are high. The adjusted R2 statistic is high for all three coefficients, indicatingthat the function used is a good fit of data. Surtax collections have risen in proportion tothe growth of imports and manufacturing output, but the base has expanded less thanproportionately to the growth of income.
Import duties
Like surtax, import duties are levied on imports other than those that are legally exempted.Total imports cif has been chosen as the tax base. The estimated elasticity coefficient of0.700 indicates that import duties are income inelastic. The base is also income inelastic(with a coefficient of 0.889). However, the import duties are elastic with respect to thetax base, probably reflecting improvement in tax administration: a low base to incomeelasticity reflects slow growth of dutiable imports. All the three adjusted R2 statistics arehigh, indicating a strong relationship between tax collections and imports, tax collectionsand income, and imports and income.

32 RESEARCH PAPER 81
Company tax
Company tax is an important tax under income tax, contributing 48.81% of total incometax revenue in 1993. According to the relevant tax legislation, company tax now appliesto private firms and statutory corporations. Corporate profits as reported in the AnnualEconomic Survey have been used as the proxy base. The estimated income elasticity ofthis tax (0.808) is less than unity. However, both base to income elasticity and tax toproxy base elasticity exceed unity, an indication of rapid growth of corporate profits andefficient tax administration. The adjusted R2 statistics are all high, indicating that thefunction assumed is a good fit of the data.
PAYE
Whereas the base (wage bill) rose less in proportion to GDP (base to income elasticity of0.734), tax to income elasticity (1.54) and tax to proxy base elasticity (1.499) were bothhigh. The relatively lower base to income elasticity reflects slow growth of the wage billin Malawi arising from both low average wage rates and slow adjustment of nominalwages to changes in the cost of living. A high tax to base elasticity reflects (until theearly 1990s) high marginal rates of taxation.
Excise duties
The chosen proxy base for excise duties is domestic manufactured output. The low taxto income elasticity of 0.220 is the product of a low proxy base to income elasticity of0.202, which is a reflection of the slow growth of manufacturing output relative to GDP,and a high tax to proxy base elasticity of 3.521, which reflects efficient tax administration.
Summary
This analysis of the components of the overall tax elasticities shows the importance ofthe generally low values of proxy base to income elasticities as the factor in explainingthe fairly low tax to income elasticity of the system. The proxy bases for surtax, importduties, PAYE and excise duties, all grew less proportionately than GDP. If proxy baseshad grown fast relative to GDP, tax to income elasticities would have been higher. Proxybase to income elasticities can be increased by improving the growth of domesticmanufactured output, by increasing formal imports of dutiable goods and by improvingthe growth of wages. During the 1971–1979 period, proxy base to income elasticitieswere again lower than tax to proxy base elasticities (Appendix C, Table C3).

TAX REFORM AND TAX YIELD IN MALAWI 33
Table 13: Decomposition of tax elasticities 1980–1993
Tax-to-income Proxy base-to-income Tax-to-proxy baseelasticity elasticity elasticity
Tax and related proxy Coefficient Adjusted Coefficient Adjusted Coefficient Adjustedbase R2 R2 R2
1. Surtax and imports (cif) plus manu- facturing value added 0.212* 0.995 0.922** 0.951 1.165** 0.938
2. Import duties and imports (cif) 0.700* 0.990 0.889** 0.924 1.074** 0.931
3. Company tax and corporate profits 0.808 0.974 1.023** 0.746 1.369** 0.931
4. PAYE and the wage bill 1.154** 0.989 0.734** 0.987 1.499** 0.984
5. Excise duties and manufac- turing value added 0.220 0.981 0.203** 0.884 3.521** 0.846
*Significant at the 5% level of significance.**Significant at both 5% and 1% levels of significance.
Tax buoyancy versus tax elasticity
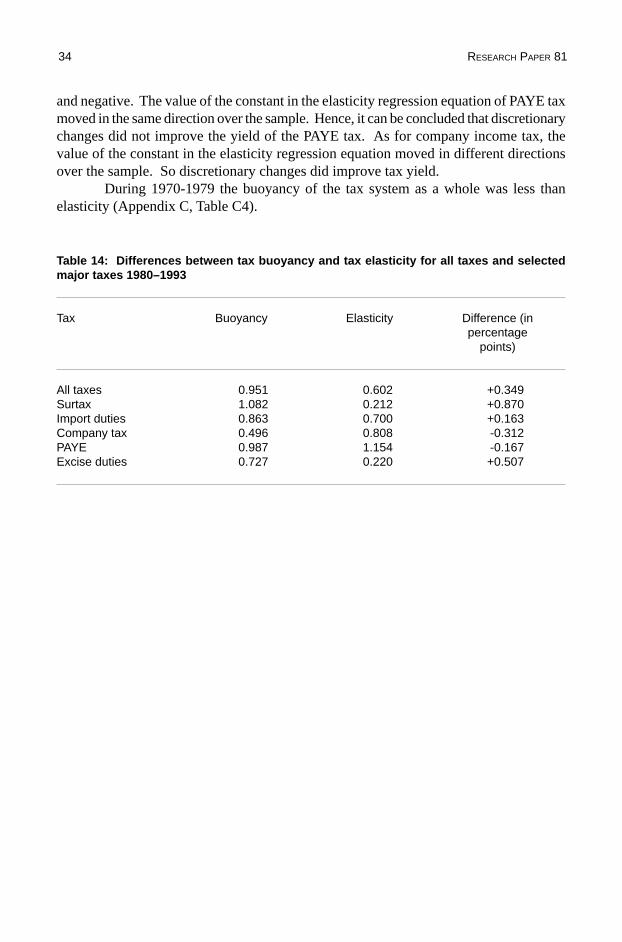
As summarized in Table 14, during 1980–1993 the tax system as a whole had a buoyancyof 0.951, compared with an elasticity of 0.602. The difference between the two, 0.349,is large and significant.
The differences between buoyancy and elasticity of surtax, import duties and exciseduties are large and positive. However, it cannot be concluded that discretionary taxchanges improved revenue yield because the value of the constants in the elasticityregression equations moved in different directions over the sample. In contrast, thedifferences in buoyancy and elasticity of company income tax and PAYE tax were large
34 RESEARCH PAPER 81
Table 14: Differences between tax buoyancy and tax elasticity for all taxes and selectedmajor taxes 1980–1993
Tax Buoyancy Elasticity Difference (inpercentage
points)
All taxes 0.951 0.602 +0.349Surtax 1.082 0.212 +0.870Import duties 0.863 0.700 +0.163Company tax 0.496 0.808 -0.312PAYE 0.987 1.154 -0.167Excise duties 0.727 0.220 +0.507
and negative. The value of the constant in the elasticity regression equation of PAYE taxmoved in the same direction over the sample. Hence, it can be concluded that discretionarychanges did not improve the yield of the PAYE tax. As for company income tax, thevalue of the constant in the elasticity regression equation moved in different directionsover the sample. So discretionary changes did improve tax yield.
During 1970-1979 the buoyancy of the tax system as a whole was less thanelasticity (Appendix C, Table C4).

TAX REFORM AND TAX YIELD IN MALAWI 35
VIII. Summary and conclusions
This study set out to evaluate tax reforms in Malawi, paying particular attention to thetax reforms undertaken in the 1980s and early 1990s, which were far-reaching and morenumerous than those of the 1970s. The main reasons for tax reforms included creatingtax incentives for investment, improving equity, simplifying the tax system and liberalizingtrade. This study focused on tax reform as a means of increasing the yield of the taxsystem, which the government attempted to achieve by introducing new taxes, raisingtax rates and broadening the base of existing taxes.
On the basis of the analysis of the data for the 1970s, the null hypothesis that tax yieldis not buoyant is accepted for the tax system as a whole and for a number of individualtaxes: minimum tax, minimum tax remittances, graduated tax, assessed tax, taxes onproperty, licenses, excise duties and import duties. The same hypothesis is rejected forcompany income tax, PAYE, surtax and stamp duties.
Using the 1980–1993 data, the null hypothesis that tax yield is not buoyant is acceptedfor the tax system as a whole as well as for minimum tax, minimum tax remittances,graduated tax, assessed tax, fringe benefits tax, excise and import duties, licenses, andtaxes on property. It is rejected for withholding taxes and accommodation and refreshmenttax.
The buoyancy of the tax system is probably adversely affected by tax evasion, byexemptions and by the existence of a second economy, which facilitates tax evasion.Tax buoyancy is probably adversely affected by tax allowances also.
The low buoyancy of licenses, excise duties, customs duties, import duties and otherduties is due to the fact that several such taxes are levied as specific rather than as advalorem taxes. Buoyancy of these taxes may be improved by changing the basis of taxationfrom specific to ad valorem.
Malawi has found it difficult to improve the buoyancy of its tax system by raising taxrates, by extending existing taxes to new activities or by introducing new taxes. Improvingtax buoyancy in future will not be easy either. Direct and indirect tax rates were pushedto the limit during the 1980s, though company and PAYE tax rates have since beenreduced. Minimum tax, minimum tax remittances and graduated tax have all beenabolished. The policy now is to reduce indirect tax rates further, especially for taxes oncapital and intermediate goods to stimulate business activity and investment, and fortaxes on goods that are consumed by the poor.
The hypothesis that tax yield is not income elastic is, using the 1970–1979 data,rejected for the tax system as a whole, but accepted for surtax, import duties, companyincome tax, PAYE tax and excise duties. Using 1980–1993 data, the same hypothesis isaccepted for the tax system as a whole and for surtax, import duties, company tax and

36 RESEARCH PAPER 81
excise duties. But it is rejected for PAYE. That tax yield is not base to income elastic isaccepted for surtax, import duties, PAYE and excise duties, but rejected for companytax. And that tax yield is not tax to base elastic is rejected for all the major taxes whoseelasticity has been investigated.
The lower than unity tax to income elasticity of the tax system appears to be due tothe generally low base to income elasticities of surtax, import duties, PAYE and exciseduties, implying that tax bases have grown less rapidly than GDP. Base to incomeelasticities can be increased by improving the growth of domestic manufactured output,by expanding formal imports of dutiable goods and by improving the growth of wages.

TAX REFORM AND TAX YIELD IN MALAWI 37
References
Chamley, C., et al. 1985. “Tax policy for Malawi”. Washington D.C.: The World Bank.Daily Times. 1994. “Tax evasion”. Thursday, 22 December: 1.IMF. 1981. The Tax System in Malawi.The Independent. 1994. “Corruption: Unitrans in a scum as government lose forex”.
Vol. 2, no. 79: 14-20 October: 1.Leuthold, J., and T. N’Guessan. 1986. “Tax buoyancy and elasticity in a developing
economy”. Bureau of Economic and Business Research Faculty Working Paperno. 1272. University of Illinois, Urbana Champaign.
Malawi Government. 1969. Gazette, 28 March.Malawi Government. 1990. Budget Statement.Malawi Government. 1993. Budget Statement.Malawi Government. 1994. Supplementary Budget Statement.Mansfield, C.Y. 1972. “Elasticity and buoyancy of tax system: A method applied to
Paraguay”. International Monetary Fund Staff Papers, 29. July: 425-440.The Nation. 1994. “Frauds caught”, Friday, 29 April: 1.Osoro, N.E. 1992. “Tax reforms in Tanzania: Motivations, directions and implications”.
Draft final report presented at the December African Economic ResearchConsortium workshop.
Prest, A.R. 1962. “The sensitivity of yield of personal income tax in the United Kingdom”.Economic Journal, 52, September: 5764,33-596.
Shalizi, Z., and W. Thirsk. 1990. “Tax reform in Malawi”. Washington, D.C.: TheWorld Bank.
Singer, N.M. 1968. “The use of dummy variables in estimating the income elasticity ofstate income tax revenues”. National Tax Journal, 21, June: 200-204.
Weekly Chronicle. 1994. “Customs department in shambles”. Vol. 2, no. 4, Monday, 15August: 1.
38 RESEARCH PAPER 81
Appendix A: Taxation in Malawi in 1969
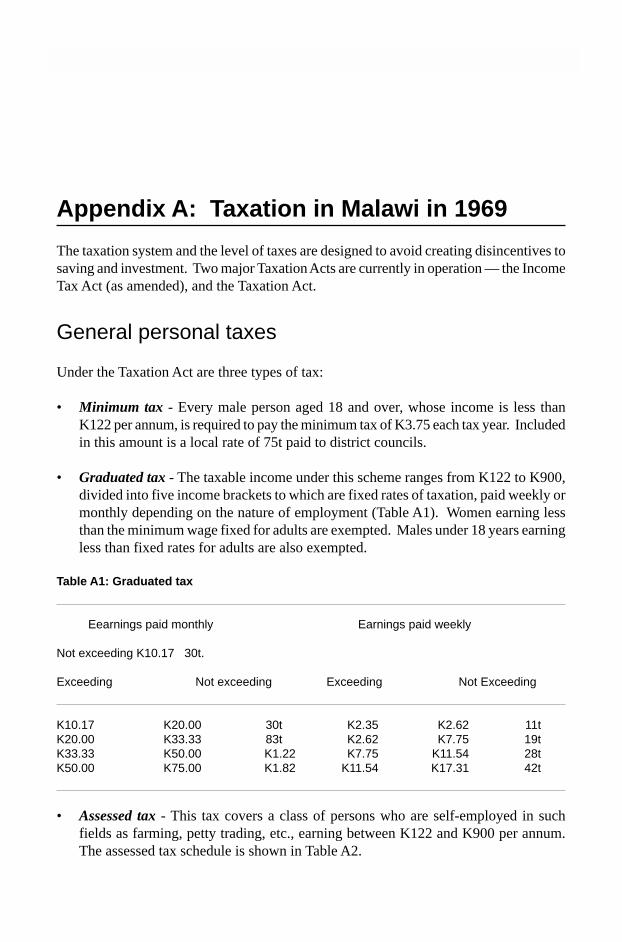
The taxation system and the level of taxes are designed to avoid creating disincentives tosaving and investment. Two major Taxation Acts are currently in operation — the IncomeTax Act (as amended), and the Taxation Act.
General personal taxes
Under the Taxation Act are three types of tax:
• Minimum tax - Every male person aged 18 and over, whose income is less thanK122 per annum, is required to pay the minimum tax of K3.75 each tax year. Includedin this amount is a local rate of 75t paid to district councils.
• Graduated tax - The taxable income under this scheme ranges from K122 to K900,divided into five income brackets to which are fixed rates of taxation, paid weekly ormonthly depending on the nature of employment (Table A1). Women earning lessthan the minimum wage fixed for adults are exempted. Males under 18 years earningless than fixed rates for adults are also exempted.
Table A1: Graduated tax
Eearnings paid monthly Earnings paid weekly
Not exceeding K10.17 30t.
Exceeding Not exceeding Exceeding Not Exceeding
K10.17 K20.00 30t K2.35 K2.62 11tK20.00 K33.33 83t K2.62 K7.75 19tK33.33 K50.00 K1.22 K7.75 K11.54 28tK50.00 K75.00 K1.82 K11.54 K17.31 42t
• Assessed tax - This tax covers a class of persons who are self-employed in suchfields as farming, petty trading, etc., earning between K122 and K900 per annum.The assessed tax schedule is shown in Table A2.

TAX REFORM AND TAX YIELD IN MALAWI 39
Table A2: Assessed tax
Taxable income Tax per year
Not exceeding K122 K3.75
Exceeding Not exceeding
K K K122 240 5.75240 400 10.00400 600 15.00600 900 22.00
Income tax
Income tax falls under the Income Tax Act, as amended. It covers all incomes derivedfrom sources in Malawi accruing to either individuals or companies.
Taxation of individuals
Taxation of individuals is governed by two schemes, related to amount of taxable income.These schemes are:
• Scheme 1 - Tax is calculated on the basis of “taxable income”, which, in the case ofemployed persons, is the amount of salary accrued, less allowable deductions. Noaccount is taken of a taxpayer’s circumstances, e.g., whether married or not. (SeeTable A3.)
Table A3: Tax on taxable income under Scheme 1
Taxable income Tax for the year
Not exceeding K122 K3.75
K122 K240 K5.75K240 K400 K10.00K400 K600 K15.00K600 K900 K22.00K900 K1,200 K30.00
K1,200 K1,500 K37.00K1,500 K1,800 K43.00K1,800 K2,100 K49.00K2,100 K2,400 K55.00K2,400 - K61.00

40 RESEARCH PAPER 81
• Scheme 2 - Under this scheme a taxpayer’s personal circumstances are taken intoconsideration. The following allowances may be deducted from the gross taxableincome to arrive at “chargeable income”.
- Personal Allowances
Single person K600Married person K1,440In addition, a person can claim an allowance of K1,020 if he is responsible forthe maintenance of a lawful child.
- Child allowances - An allowance of K288 is given for each child, up to a maximum offour children, under the age of 18 years at the end of the tax year, or beyond this age ifthe child is in full attendance at an educational establishment. No allowance is given ifa child has own income of K300 or more per annum.
- Life insurance - An allowance is provided for life insurance premium policies on thetaxpayer’s life or that of his wife. There are two restrictions:
1) In the case of premiums, the allowable amount to be deducted from taxable incomeis restricted to 7% of the capital sum payable at death. This excludes benefits suchas a bonus or profits.
2) The total amount allowable must not in any case exceed K288.
- Other deductions - Certain deductions are allowed for building houses, the cost ofeducational passages for children and contributions to approved pension funds. TableA4 shows the taxation rates applicable to chargeable income exceeding K408 after allpersonal allowances and deductions are made, with the addition of the sum of K1 perannum in each case. This scheme does not apply if chargeable income does not exceedK408. Where this is the case after deducting all allowances, the taxpayer is chargedunder the Taxable Income Scheme 1. In certain cases, the tax calculated will be reducedwhere the income subject to tax includes wife’s earnings.
Table A4: Tax rates under Scheme 2
First K1,000 20tNext K1,000 40tNext K1,000 60tNext K3,000 65tNext K3,000 70tNext K5,000 75t
Excess over K11,000 80t

TAX REFORM AND TAX YIELD IN MALAWI 41
PAYE
Employed persons who earn K900 and over fall under the Pay As You Earn system.
Company taxes
The standard rate of taxation applicable to all companies is 40t to the K. Distinction ismade, however, between companies incorporated in Malawi and those incorporatedelsewhere. A further 5t to the K is levied on companies not incorporated in Malawi and,in certain cases, where dividends are distributed to shareholders not resident in Malawi.This would be the case if a foreign company pays more than 40t to the K in the foreigncountry concerned.
Capital allowances
An initial allowance is made on capital expenditure incurred by the taxpayer during theyear of assessment on the construction of new farm improvements, industrial buildings,additions or alterations to such capital items, and for articles, implements, machinery orutensils purchased and used by the taxpayer for industrial or farming purposes. Currentallowances are:
• Initial allowance for farm improvements, industrial buildings and railway lines -10% of capital expenditure incurred.
• Articles, implements, machinery and utensils - 20% of capital expenditure incurred.• Fencing - 33% of capital expenditure incurred.• In addition, initial allowance may be given for capital expenditure used for purposes
other than those specified above.
Annual allowances
Depreciation allowance for capital items specified under “capital allowances” is as follows:
• Farm improvements, railway lines and industrial buildings - 5%• Fencing - 10%• Rates for other assets are determined by the Commissioner of Taxes.
Mining
Where persons carrying on mining operations incur certain mining expenditure after 1November 1969 in any year of assessment, they may claim an allowance for that yearand each of the four following years of 20% of such expenditure.

42 RESEARCH PAPER 81
Investment allowances
If a taxpayer is a manufacturer, an allowance of 10% of the cost of new and unusedindustrial buildings and plant or machinery used in the process of manufacturing for thepurpose of the business is granted as an allowance. This excludes motor vehicles, andthe equipment must be used in the year of assessment.

TAX REFORM AND TAX YIELD IN MALAWI 43
Appendix B: Selected tax revenue data forMalawi, 1970-1994
Table B1: Malawi: Tax revenue as a percentage of GDP, 1970/71–1979/80
1970/71 1971/72 1972/73 1973/74 1974/75 1975/76 1976/77 1977/78 1978/79 1979/80
Taxes on net income and profits4.184.154.384.374.144.855.145.696.766.32 Companies 2.14 2.25 2.46 2.48 2.43 3.21 3.53 3.89 4.60 4.06 Individuals 2.04 1.90 1.92 1.89 1.70 1.64 1.61 1.80 2.17 2.26 Minimum tax (0.56) (0.52) (0.50) (0.43) (0.30) (0.26) (0.21) (0.28) (0.24) (0.23) Minimum tax remittances (0.10) (0.11) (0.10) (0.11) (0.10) (0.03) (- -) (- -) (- -) (- -) Graduate tax (0.40) (0.35) (0.36) (0.34) (0.31) (0.29) (0.28) (0.29) (0.29) (0.30) PAYE deductions (0.96) (0.90) (0.94) (0.98) (0.98) (1.04) (1.10) (1.22) (1.61) (1.71) Assessed tax (0.02) (0.02) (0.02) (0.02) (0.02) (0.02) (0.02) (0.02) (0.02) (0.02)
Taxes on property0.030.010.010.020.010.010.010.010.010.01
Taxes on goods and services2.393.283.383.323.473.273.503.944.525.46 Surtax 1.07 2.08 2.19 2.09 2.36 2.23 2.61 3.10 3.61 4.61 Exercise duties 0.82 0.79 0.77 0.83 0.80 0.76 0.61 0.59 0.68 0.64 Licenses for goods and services 0.50 0.41 0.42 0.39 0.31 0.29 0.28 0.25 0.24 0.22 Business and
professional (0.16) (0.11) (0.11) (0.12) (0.07) (0.07) (0.09) (0.06) (0.06) (0.06)Motor vehicle tax (0.34) (0.30) (0.31) (0.28) (0.24) (0.22) (0.19) (0.19) (0.18) (0.16)
Taxes on international transactions3.523.092.792.502.592.341.942.143.053.4 Import taxes 3.52 3.09 2.79 2.50 2.59 2.34 1.94 2.14 3.05 3.48 Customs duties (3.51) (3.08) (2.78) (2.49) (2.58) (2.32) (1.91) (2.12) (3.02) (3.45) Other (0.01) (0.01) (0.01) (0.01) (0.01) (0.02) (0.03) (0.02) (0.03) (0.03)
Stamp duties0.060.050.060.050.050.060.090.080.060.05
Total tax revenue 10.18 10.58 10.62 10.26 10.26 10.53 10.67 11.86 14.4115.33
Sources: Financial Statements, various issues, 1970/71 –1980/81; and data provided by the Malawi authorities.

44 RESEARCH PAPER 81Ta
ble
B2:
Mal
awi:
Co
mp
osi
tio
n o
f ta
x re
ven
ue
by
maj
or
cate
go
ries
, 197
0/71
– 1
979/
80
197
0/71
1971
/72
1972
/73
1973
/74
1974
/75
1975
/76
1976
/77
1977
/78
1978
/79
1979
/80
Taxe
s on
net
inco
me
pro
fits
41.0
739
.19
41.2
542
.59
40.3
446
.02
48.1
848
.00
46.9
341
.24
Com
pani
es21
.00
21.2
923
.14
24.1
323
.73
30.4
433
.05
32.8
231
.90
26.5
0 I
ndiv
idua
ls20
.07
17.9
018
.11
18.4
616
.61
15.5
815
.13
15.1
815
.03
14.7
4
Min
imum
tax
(5.5
4)(4
.90)
(4.7
4)(4
.22)
(2.8
8)(2
.45)
(1.9
8)(2
.32)
(1.6
5)(1
.48)
M
inim
um ta
x—
rem
ittan
ces
(1.0
0)(1
.00)
(0.9
7)(1
.06)
(0.9
3)(0
.24)
(0.0
4)
(
- -)
(- -
)(-
-)
G
radu
ate
tax
(3.9
1)(3
.30)
(3.3
9)(3
.35)
(3.0
3)(2
.79)
(2.6
4)(2
.41)
(2.0
3)(1
.96)
P
AY
E d
educ
tions
(9.4
5)(8
.48)
(8.8
1)(9
.60)
(9.5
7)(9
.90)
(10.
27)
(10.
26)
(11.
18)
(11.
15)
A
sses
sed
tax
(0.1
7)(0
.19)
(0.2
0)(0
.23)
(0.2
0)(0
.20)
(0.2
0)(0
.19)
(0.1
7)(0
.15)
Taxe
s on
pro
pert
y0.
280.
060.
050.
160.
110.
100.
080.
090.
050.
06
Taxe
s on
goo
ds a
nd s
ervi
ces
23.4
631
.00
31.8
132
.32
33.8
231
.06
32.7
833
.19
33.4
135
.67
S
urta
x10
.48
19.6
320
.58
20.4
123
.00
21.1
324
.45
26.1
525
.03
30.0
6
Exe
rcis
e du
ties
8.0
3 7
.46
7.2
6 8
.08
7.7
9 7
.18
5.7
4 4
.97
4.7
2 4
.18
L
icen
ses
for
good
s an
d
se
rvic
es 4
.95
3.9
1 3
.97
3.8
3 3
.03
2.7
5 2
.59
2.0
8 1
.66
1.4
3
B
usin
ess
and
prof
essi
onal
(1.5
9)(1
.03)
(1.0
7)(1
.12)
(0.6
9)(0
.66)
(0.8
0)(0
.48)
(0.3
8)(0
.37)
Mot
or v
ehic
le ta
x(3
.36)
(2.8
8)(2
.90)
(2.7
1)(2
.34)
(2.0
9)(1
.79)
(1.6
0)(1
.28)
(1.0
6)
Taxe
s on
inte
rnat
iona
l
tran
sact
ions
34.6
429
.25
26.3
024
.40
25.2
322
.26
18.1
518
.08
21.1
822
.69
Impo
rt d
utie
s34
.64
29.2
526
.30
24.4
025
.23
22.2
618
.15
18.0
821
.18
22.6
9
C
usto
ms
dutie
s(3
4.54
)(2
9.17
)(2
6.20
)(2
4.31
)(2
5.10
)(2
2.03
)(1
7.90
)(1
7.84
)(2
0.96
)(2
2.50
)
O
ther
(0.1
0) (
0.08
) (
0.10
) (
0.09
) (
0.13
) (
0.23
) (
0.25
) (
0.23
) (
0.22
) (
0.19
)
Sta
mp
dutie
s 0
.55
0.50
0.59
0.53
0.50
0.56
0.81
0.64
0.43
0.34
Tota
l tax
reve
nue
100.
0010
0.00
100.
0010
0.00
100.
0010
0.00
100.
0010
0.00
100.
0010
0.00
Sou
rces
: Fin
anci
al S
tate
men
ts, v
ario
us is
sues
, 197
0/71
– 1
980/
81; a
nd d
ata
prov
ided
by
the
Mal
awi a
utho
ritie
s.

TAX REFORM AND TAX YIELD IN MALAWI 45Ta
ble
B3:
Tax
rev
enu
e as
a p
erce
nta
ge
of
GD
P, 1
980/
81 –
199
3/94
8081
8283
8485
8687
8889
9091
9293
Taxe
s on
net
inco
me
and
p
rofit
s6.
605.
566.
456.
517.
018.
367.
706.
637.
548.
157.
326.
105.
945.
12
Com
pani
es3.
913.
073.
713.
714.
395.
064.
743.
564.
915.
444.
593.
943.
348.
81
Ind
ivid
uals
2.69
2.49
2.74
2.80
2.62
2.70
2.96
3.11
2.73
2.71
2.73
2.16
2.60
2.31
Min
imum
tax
(0.2
2)(0
.19)
(0.2
0)(0
.15)
(0.1
5)(0
.16)
(0.1
2)(0
.10)
(0.0
8)(0
.06)
(0.0
5)(0
.05)
(0.0
2)(-
)
M
in-t
ax-r
emitt
.(-
)(-
)(-
)(-
)(-
)(-
)(-
)(-
)(0
.06)
(0.0
5)(0
.07)
(0.0
6)(0
.04)
(0.0
5)
G
radu
ated
tax
(0.3
0)(0
.28)
(0.2
5)(0
.21)
(0.1
7)(0
.23)
(0.1
7)(0
.14)
(0.1
1)(0
.13)
(0.1
5)(0
.16)
(0.2
0)(0
.14)
PA
YE
(2.1
4)(1
.99)
(2.2
7)(2
.42)
(2.2
7)(2
.29)
(2.3
7)(2
.50)
(2.4
7)(2
.46)
(2.4
5)(1
.88)
(2.3
3)(2
.12)
Ass
esse
d ta
x(0
.03)
(0.0
3)(0
.02)
(0.0
2)(0
.02)
(0.0
2)(0
.02)
(0.0
1)(0
.01)
(0.0
1)(0
.01)
(0.0
1)(0
.01)
(0.0
04)
Taxe
s on
pro
pert
y0.
010.
010.
010.
010.
010.
020.
020.
010.
020.
030.
010.
010.
140.
01
Taxe
s on
goo
ds a
nd s
ervi
ces
5.88
5.94
5.98
6.01
6.17
6.77
6.38
6.41
7.48
7.57
6.87
6.75
6.33
7.69
S
urta
x4.
824.
844.
714.
735.
325.
765.
455.
686.
606.
705.
955.
925.
567.
07
Exc
ise
dutie
s0.
780.
820.
940.
970.
550.
700.
660.
470.
590.
640.
690.
640.
570.
46
Lic
ense
s0.
280.
280.
270.
310.
300.
310.
270.
260.
290.
230.
230.
190.
190.
16
B
usin
ess
and
Pro
fess
iona
l(0
.06)
(0.0
6)(0
.07)
(0.0
6)(0
.06)
(0.0
5)(0
.04)
(0.0
4)(0
.05)
(0.0
4)(0
.04)
(0.0
3)(0
.02)
(0.0
4)
M
otor
veh
icle
(0.2
2)(0
.22)
(0.2
0)(0
.25)
(0.2
5)(0
.26)
(0.2
3)(0
.22)
(0.2
4)(0
.19)
(0.1
9)(0
.16)
(0.1
7)(0
.12)
Taxe
s on
inte
rnat
iona
l tra
de4.
284.
614.
184.
074.
043.
963.
593.
183.
293.
343.
213.
543.
753.
13
Impo
rt ta
xes
4.28
4.61
4.18
4.07
4.04
3.96
3.59
3.18
3.29
3.34
3.21
3.54
3.75
3.13
Cus
tom
dut
ies
(4.2
1)(4
.44)
(4.1
1)(4
.03)
(4.0
2)(3
.94)
(3.5
3)(3
.17)
(3.2
4)(3
.32)
(3.2
1)(3
.52)
(3.7
3)(3
.01)
Oth
er(0
.07)
(0.1
7)(0
.07)
(0.0
4)(0
.02)
(0.0
2)(0
.06)
(0.0
1)(0
.05)
(0.0
2) (
-)(0
.02)
(0.0
2)(0
.12)
Sta
mp
dutie
s(0
.06)
0.08
0.14
0.02
0.08
0.09
0.09
0.07
0.07
0.11
0.13
0.10
0.09
0.15
Tota
l tax
reve
nue
16.8
316
.20
16.7
116
.62
17.3
119
.20
17.7
816
.30
18.4
019
.20
17.5
416
.50
16.2
516
.10
Sou
rce:
Mal
awi G
over
nmen
t, E
cono
mic
Rep
ort (
vario
us is
sues
).

46 RESEARCH PAPER 81Ta
ble
B4:
Co
mp
osi
tio
n o
f ta
x re
ven
ue
by
maj
or
cate
go
ries
(19
80/8
1–19
93/9
4)(a
s p
erce
nta
ge
of
tax
reve
nu
e)
8081
8283
8485
8687
8889
9091
9293
Taxe
s on
net
inco
me
and
prof
its38
.94
34.5
028
.27
39.2
739
.58
41.2
943
.16
39.9
645
.56
41.3
941
.81
44.7
338
.04
38.0
5C
ompa
nies
23.6
619
.04
21.7
622
.31
24.3
927
.39
26.5
421
.50
25.7
924
.40
25.0
926
.16
19.8
118
.57
Indi
vidu
als
15.2
815
.46
16.5
116
.96
15.1
913
.90
16.6
218
.46
19.7
716
.99
16.7
218
.57
18.2
219
.48
Min
imum
tax
(1.2
6)(1
.23)
(1.2
0)(0
.92)
(0.8
4)(0
.69)
(o.7
9)(0
.84)
(0.4
9)(0
.49)
(0.4
9)(0
.65)
(0.1
7)(–
)M
in-t
ax-r
emit.
(–)
(–)
(–)
(–)
(–)
(–)
(–)
(–)
(0.4
3)(0
.39)
(0.5
5)(0
.72)
(0.2
8)(0
.50)
Gra
duat
ed ta
x(1
.68)
(1.7
3)(1
.54)
(1.3
4)(1
.05)
(1.1
5)(0
.95)
(0.9
4)(0
.68)
(0.7
8)(0
.84)
(1.0
5)(2
.43)
(1.9
5)P
AY
E(1
2.22
)(1
2.39
)(1
3.63
)(1
4.57
)(1
3.20
)(1
1.84
)(1
4.44
)(1
6.36
)(1
7.91
)(1
5.24
)(1
4.76
)(1
5.98
)(1
4.99
)(1
6.99
)A
sses
sed
tax
(0.1
2)(0
.11)
(0.1
4)(0
.13)
(0.1
0)(0
.22)
(0.4
4)(0
.32)
(0.2
6)(0
.09)
(0.0
8)(0
.17)
(0.3
5)(0
.04)
Taxe
s on
pro
pert
y0.
060.
060.
050.
130.
070.
130.
120.
090.
110.
140.
060.
050.
090.
04
Taxe
s on
goo
ds a
nd s
ervi
ces
35.4
786
.91
35.5
336
.04
37.3
733
.23
35.6
942
.03
39.5
039
.80
39.1
031
.58
37.6
340
.08
Sur
tax
29.1
230
.15
28.0
728
.62
31.3
627
.96
30.3
336
.51
34.4
334
.88
34.2
127
.74
33.1
434
.95
Exc
ise
dutie
s4.
675.
035.
685.
454.
323.
743.
543.
913.
203.
543.
542.
563.
434.
17Li
cens
es1.
681.
731.
781.
961.
691.
531.
821.
611.
871.
381.
351.
281.
060.
96B
usin
ess
and
Pro
fess
iona
l(0
.36)
(0.3
9)(0
.48)
(0.3
9)(0
.31)
(0.2
5)(0
.53)
(0.2
0)(0
.49)
(0.3
3)(0
.24)
(0.2
2)(0
.12)
(0.1
2)M
otor
veh
icle
(1.3
2)(1
.34)
(1.3
0)(1
.57)
(1.3
8)(1
.28)
(1.2
8)(1
.41)
(1.3
8)(1
.05)
(1.1
1)(1
.06)
(0.9
4)(0
.84)
Taxe
s on
inte
rnat
iona
l tra
de25
.22
28.0
325
.27
24.4
822
.52
24.7
920
.50
19.2
617
.62
18.0
218
.34
22.9
522
.46
20.1
2Im
port
taxe
s25
.22
28.0
325
.27
24.4
822
.52
24.7
920
.50
19.2
617
.62
18.0
218
.34
22.9
522
.46
20.1
2C
usto
m d
utie
s(2
4.86
)(2
7.65
)(2
4.84
)(2
4.24
)(2
2.38
)(2
4.57
)(1
9.96
)(1
9.07
)(1
7.33
)(1
7.90
)(1
8.34
)(2
2.69
)(2
2.33
)(2
0.08
)O
ther
(0.3
6)(0
.38)
(0.4
3)(0
.24)
(0.1
4)(0
.22)
(0.5
4)(0
.19)
(0.2
9)(0
.12)
(–)
(0.2
6)(0
.13)
(0.0
4)
Sta
mp
dutie
s0.
360.
450.
870.
130.
510.
460.
540.
440.
430.
640.
710.
680.
090.
80
Tota
l tax
rev
enue
100.
0010
0.00
100.
0010
0.00
100.
0010
0.00
100.
0010
0.00
100.
0010
0.00
100.
0010
0.00
100.
0010
0.00
Sou
rce:
Mal
awi G
over
nmen
t, E
cono
mic
Rep
ort (
vario
us is
sues
).

TAX REFORM AND TAX YIELD IN MALAWI 47
Table C1: Estimates of tax buoyancy in Malawi
1970/71–- 1979/80 1980/81 –- 1993/94
Dependent Variable Constant Log GDP Adjusted R2 D.W. Constant Log GDP Adjusted R2 D.W.
Taxes on income and profit -3.897 1.170** 0.499 0.759 -2.561** 0.983** 0.969 0.746 (log TIP) (-1.682) (3.376) (6.619) (20.185) Companies -6.087 1.449** 0.552 0.829 0.670 0.496** 0.593 0.717 (log CT) (-2.382) (3.476) (0.741) (4.468) Individuals -2.253 0.747* 0.329 0.634 -3.907** 1.043** 0.992 0.666 (log IT) (-1.144) (2.326) (18.814) (39.903) Minimum tax 0.376 0.035 -1.116 1.195 0.422 0.064 -0.037 1.511 (log MT) (0.434) (0.247) (0.641) (0.755) Minimum tax remittances 11.523 -2.143 0.253 1.143 -4.647 0.670* 0.537 2.374 (log MTR) (1.560) (-1.742) (-2.096) (2.608)
Graduated tax (log GT) -3.175* 0.606* 0.479 0.851 -4.006** 0.707** 0.842 0.640PAYE tax (log PT) (-2.601) (3.045) (-5.994) (8.390)Assessed tax (log SBT) -5.188 1.141* 0.387 0.701 -3.703** 0.987** 0.979 1.539
(-1.916) (2.583) (-11.663) (24.6648)Withholding tax (log WT) -5.972** 0.645* 0.362* 1.066 -3.837** 0.357** 0.622 0.960
(-3.734 (2.472) (-6.417) (4.736)Fringe benefits tax (log FBT) - - - - -11.294** 1.714** 0.971 2.196
(-12.859) (16.267) Taxes on goods and services (log TGS) - - - - Accomodation and -0.787 0.683* 0.417 1.289 2.408 0.025 1.000 2.000 refreshments tax (0.512) (2.725) (0.000) (0.000) (log ART)
- - - - -2.614** 0.980** 0.971 1.157(-7.000) (20.855)
Surtax (log ST) -6.574 1.495* 0.422 0.909 -8.759** 1.177* 0.944 1.475(-1.973) (2.750) (-12.150) (13.039)
Exercise duties (log ED) -2.433 0.620* 0.433 0.864 -3.562** 1.082** 0.987 0.665(-1.796) (2.807) (-12.869) (31.011)
Licences for goods and services (log LGS) -1.143* 0.275** 0.503 1.288 -2.877** 0.727** 0.951 1.224
(-2.156) (3.179) (-7.889) (15.839) Business and profes- sional (log BP) -0.903 0.019 -0.123 2.735 -3.340 0.659** 0.853 1.043
(-1.034) (0.133) (-5.588) (87.748) Motor vehicle tax -2.172** 0.392** 0.569 0.857 -3.507** 0.459** 0.634 1.007 (log MVT) (-3.246) (3.587) (-4.667) (4.847) Taxes on property 3.100 -0.770** -0.093 0.728 -4.499** 0.784** 0.945 0.651 (log TP) (0.401) (-0.563) (-10.782) (14.910)
Stamp duties (log SD) -7.601** 1.063 0.599 1.340 -8.537** 0.784** 0.945 0.651(-4.432) (3.799) (-5.949) (5.257)
Taxes on international -0.516 0.521 0.122 0.575 -8.895** 1.233** 0.832 2.471 transactions (log TIT) (-0.242) (1.499) (-9.434) (10.320) Customs duties (log CD) -0.516 0.521 0.122 0.575 -1.924** 0.826** 0.980 1.751
(-0.242) (1.499) (-7.372) (24.156) Import duties (log ID) -0.538 0.525 0.126 0.574 -1.924** 0.826** 0.980 1.751
(0.253) (1.515) (-7.372) (25.156) Other duties (log OD) -2.357 0.168 -0.087 1.352 -2.227** 0.863** 0.985 1.121
(-1.203) (0.527) (-9.522) (29.255) Total tax revenue (log TTR) -1.964 0.993* 0.396 0.703 -4.849** 0.586** 0.408 2.922
(-5.513) (29.889) (-3.189) (3.044)
-1.394** 0.951** 0.986 0.866(-5.513) (29.889)
* Significant at the 5% level of significance.** Significant at both 5% and 1% levels of significance.
Appendix C: Tax buoyancies and elasticitiesin Malawi

48 RESEARCH PAPER 81
Table C2: Elasticity of major taxes and of total tax system, 1970–19791
Tax Intercept Elasticity Weight of tax Adjusted Tcoefficient in 1979 R2 Ratio
(percentage oftotal)
1. Surtax -1.676 0.791 30.06 0.480 1.145 2 .Import duties 1.366 -0.153 22.69 0.603 -0.4423. Company tax -1.203 0.875 26.50 0.729 2.2964. PAYE -0.659 0.505 11.15 0.939 13.1015. Excise duties 0.505 0.017 4.18 0.2700.0486. Total of 1-5 94.587. Total tax system -3.154 1.149* 100.00 0.966 20.790
1Weights were not used in the estimates.*Significant at 5% and 1% levels of significance.
Table C3: Decomposition of tax elasticities, 1970–1979
Tax-to-income Proxy base-to-income Tax-to-proxy baseelasticity elasticity elasticity
Tax and related Coefficient Adjusted Coefficient Adjusted Coefficient Adjustedproxy base R2 R2 R2
1. Surtax and imports cif plus manufac- turing value added 0.791 0.480 0.454 0.038 1.511** 0.827
2. Import duties and Imports cif -0.153 0.603 0.908* 0.399 0.734** 0.746
3. Company tax and corporate profits 0.875 0.728 1.033** 0.638 1.353** 0.849
4. PAYE and the wage bill 0.505 0.677 0.522 0.227 1.766* 0.973
5. Excise duties and manufacturing value added 0.017 0.097 -0.120 1.064** 0.679
*Significant at 5% level of significance.**Significant at both 5% and 1% levels of significance.

TAX REFORM AND TAX YIELD IN MALAWI 49
Table C4: Differences between tax buoyancy and tax elasticity for all taxes and selectedmajor taxes, 1970–1979
Tax Buoyancy Elasticity Difference (inpercentage points)
All taxes 0.993 1.149 -0.156Surtax 1.495 0.791 +0.704Import duties 0.525 -0.153 -0.678Company tax 1.449 0.875 +0.574PAYE 1.141 0.505 +0.636Excise duties 0.620 0.017 +0.603

Other publications in the AERC Research Papers Series:
Structural Adjustment Programmes and the Coffee Sector in Uganda by Germina Ssemogerere,Research Paper 1.
Real Interest Rates and the Mobilization of Private Savings in Africa by F.M. Mwega, S.M.Ngola and N. Mwangi, Research Paper 2.
Mobilizing Domestic Resources for Capital Formation in Ghana: The Role of Informal FinancialMarkets by Ernest Aryeetey and Fritz Gockel, Research Paper 3.
The Informal Financial Sector and Macroeconomic Adjustment in Malawi by C. Chipeta andM.L.C. Mkandawire, Research Paper 4.
The Effects of Non-Bank Financial Intermediaries on Demand for Money in Kenya by S.M. Ndele,Research Paper 5.
Exchange Rate Policy and Macroeconomic Performance in Ghana by C.D. Jebuni, N.K. Sowaand K.S. Tutu, Research Paper 6.
A Macroeconomic-Demographic Model for Ethiopia by Asmerom Kidane, Research Paper 7.Macroeconomic Approach to External Debt: The Case of Nigeria by S. Ibi Ajayi, Research Paper
8.The Real Exchange Rate and Ghana’s Agricultural Exports by K. Yerfi Fosu, Research Paper 9.The Relationship Between the Formal and Informal Sectors of the Financial Market in Ghana by
E. Aryeetey, Research Paper 10.Financial System Regulation, Deregulation and Savings Mobilization in Nigeria by
A. Soyibo and F. Adekanye, Research Paper 11.The Savings-Investment Process in Nigeria: An Empirical Study of the Supply Side by
A. Soyibo, Research Paper 12.Growth and Foreign Debt: The Ethiopian Experience, 1964-86 by B. Degefe, Research Paper 13.Links Between the Informal and Formal/Semi-Formal Financial Sectors in Malawi by C. Chipeta
and M.L.C. Mkandawire, Research Paper 14.The Determinants of Fiscal Deficit and Fiscal Adjustment in Cote d’Ivoire by O. Kouassy and B.
Bohoun, Research Paper 15.Small and Medium-Scale Enterprise Development in Nigeria by D.E. Ekpenyong and M.O. Nyong,
Research Paper 16.The Nigerian Banking System in the Context of Policies of Financial Regulation and Deregulation
by A. Soyibo and F. Adekanye, Research Paper 17.Scope, Structure and Policy Implications of Informal Financial Markets in Tanzania by M. Hyuha,
O. Ndanshau and J.P. Kipokola, Research Paper 18.European Economic Integration and the Franc Zone: The Future of the CFA Franc after 1996.
Part I: Historical Background and a New Evaluation of Monetary Cooperation in the CFACountries by Allechi M’bet and Madeleine Niamkey, Research Paper 19.
Revenue Productivity Implications of Tax Reform in Tanzania by Nehemiah E. Osoro, ResearchPaper 20.
The Informal and Semi-formal Sectors in Ethiopia: A Study of the Iqqub, Iddir and Savings andCredit Cooperatives by Dejene Aredo, Research Paper 21.
Inflationary Trends and Control in Ghana by Nii K. Sowa and John K. Kwakye, Research Paper22.
Macroeconomic Constraints and Medium-Term Growth in Kenya: A Three-Gap Analysis by F.M.Mwega, N. Njuguna and K. Olewe-Ochilo, Research Paper 23.
The Foreign Exchange Market and the Dutch Auction System in Ghana by Cletus K. Dordunoo,Research Paper 24.
Exchange Rate Depreciation and the Structure of Sectoral Prices in Nigeria Under an AlternativePricing Regime, 1986-89 by Olu Ajakaiye and Ode Ojowu, Research Paper 25.

Exchange Rate Depreciation, Budget Deficit and Inflation - The Nigerian Experience by F.Egwaikhide, L. Chete and G. Falokun, Research Paper 26.
Trade, Payments Liberalization and Economic Performance in Ghana by C.D. Jebuni, A.D. Oduroand K.A. Tutu, Research Paper 27.
Constraints to the Development and Diversification of Non-Traditional Exports in Uganda, 1981-90 by G. Ssemogerere and L.A. Kasekende, Research Paper 28.
Indices of Effective Exchange Rates: A Comparative Study of Ethiopia, Kenya and the Sudan byAsmerom Kidane, Research Paper 29.
Monetary Harmonization in Southern Africa by C. Chipeta and M.L.C. Mkandawire, ResearchPaper 30.
Tanzania’s Trade with PTA Countries: A Special Emphasis on Non-Traditional Products by FloraMndeme Musonda, Research Paper 31.
Macroeconomic Adjustment, Trade and Growth: Policy Analysis using a Macroeconomic Modelof Nigeria by C. Soludo, Research Paper 32.
Ghana: The Burden of Debt Service Payment Under Structural Adjustment byBarfour Osei, Research Paper 33.
Short-Run Macroeconomic Effects of Bank Lending Rates in Nigeria, 1987-91: A ComputableGeneral Equilibrium Analysis by D. Olu Ajakaiye, Research Paper 34.
Capital Flight and External Debt in Nigeria by S. Ibi Ajayi, Research Paper 35.Institutional Reforms and the Management of Exchange Rate Policy in Nigeria by
Kassey Odubogun, Research Paper 36.The Role of Exchange Rate and Monetary Policy in the Monetary Approach to the Balance of
Payments: Evidence from Malawi by Exley B.D. Silumbu, Research Paper 37.Tax Reforms in Tanzania: Motivations, Directions and Implications by
Nehemiah E. Osoro, Research Paper 38.Money Supply Mechanisms in Nigeria, 1970-88 by Oluremi Ogun and Adeola Adenikinju, Research
Paper 39.Profiles and Determinants of Nigeria’s Balance of Payments: The Current Account Component,
1950-88, by Joe U. Umo and Tayo Fakiyesi, Research Paper 40.Empirical Studies of Nigeria’s Foreign Exchange Parallel Market 1: Price Behaviour and Rate
Determination by Melvin D. Ayogu, Research Paper 41.The Effects of Exchange Rate Policy on Cameroon’s Agricultural Competitiveness by Aloysius
Ajab Amin , Research Paper 42.Policy Consistency and Inflation in Ghana by Nii Kwaku Sowa, Research Paper 43.Fiscal Operations in a Depressed Economy: Nigeria, 1960-90 by Akpan H. Ekpo and John E. U.
Ndebbio, Research Paper 44.Foreign Exchange Bureaus in the Economy of Ghana by Kofi A. Osei, Research Paper 45.The Balance of Payments as a Monetary Phenomenon: An Econometric Study of Zimbabwe’s
Experience by Rogers Dhliwayo, Research Paper 46.Taxation of Financial Assets and Capital Market Development in Nigeria by
Eno L. Inanga and Chidozie Emenuga, Research Paper 47.The Transmission of Savings to Investment in Nigeria by Adedoyin Soyibo, Research Paper 48.A Statistical Analysis of Foreign Exchange Rate Behaviour in Nigeria’s Auction by Genevesi O.
Ogiogio, Research Paper 49.The Behaviour of Income Velocity In Tanzania 1967-1994 by Michael O.A. Ndanshau, Research
Paper 50.Consequences and Limitations of Recent Fiscal Policy in Côte d’Ivoire, by Kouassy Oussou and
Bohoun Bouabre, Research Paper 51.Effects of Inflation on Ivorian Fiscal Variables: An Econometric Investigation, by Eugene Kouassi,
Research Paper 52.

European Economic Integration and the Franc Zone: The Future of the CFA Franc after 1999,Part II, by Allechi M’Bet and Niamkey A. Madeleine, Research Paper 53.
Exchange Rate Policy and Economic Reform in Ethiopia, by Asmerom Kidane, Research Paper54.
The Nigerian Foreign Exchange Market: Possibilities For Convergence in Exchange Rates, byP. Kassey Garba, Research Paper 55.
Mobilizing Domestic Resources for Economic Development in Nigeria: The Role of the CapitalMarket, by Fidelis O. Ogwumike and Davidson A. Omole, Research Paper 56.
Policy Modeling in Agriculture: Testing the Response of Agriculture to Adjustment Policies inNigeria, by Mike Kwanashie, Abdul-Ganiyu Garba and Isaac Ajilima, Research Paper 57.
Price and Exchange Rate Dynamics in Kenya: An Empirical Investigation (1970-1993) by NjugunaS. Ndung’u, Research Paper 58.
Exchange Rate Policy and Inflation: The case of Uganda, by Barbra Mbire, Research Paper 59.Institutional, Traditional and Asset Pricing Characteristics of African Emerging Capital Markets,
by Eno L. Inanga and Chidozie Emenuga, Research Paper 60.Foreign Aid and Economic Performance in Tanzania, by Timothy S. Nyoni, Research Paper 61.Public Spending, Taxation and Deficits: What is the Tanzanian Evidence? by Nehemiah Osoro,
Research Paper 62.Adjustment Programmes and Agricultural Incentives in Sudan: A Comparative Study, by Nasredin
A. Hag Elamin and Elsheikh M. El Mak, Research Paper 63.Intra-industry Trade between Members of the PTA/COMESA Regional Trading Arrangement,
By Flora Mndeme Musonda, Research Paper 64.Fiscal Operations, Money Supply and Inflation in Tanzania, by A.A.L. Kilindo, Research
Paper 65.Growth and Foreign Debt: The Ugandan Experience, by Barbara Mbire, Research Paper 66.Productivity of the Nigerian Tax System: 1970–1990, by Ademola Ariyo, Research Paper 67.Potentials for diversifying Nigeria's Non-oil Exports to Non-Traditional Markets, by A. Osuntogun,
C.C. Edordu and B.O. Oramah, Research Paper 68.Empirical Studies of Nigeria's Foreign Exchange Parallel Market II: Speculative Efficiency and
Noisy Trading, by Melvin Ayogu, Research Paper 69.Effects of Budget Deficits on the Current Account Balance in Nigeria: A Simulation Exercise, by
Festus O. Egwaikhide, Research Paper 70.Bank Performance and Supervision in Nigeria: Analysing the Transition to a Deregulated Economy,
by O.O. Sobodu and P.O. Akiode, Research Paper 71.Financial Sector Reforms and Interest Rate Liberalization: The Kenya Experience by R.W. Ngugi
and J.W. Kabubo, Research Paper 72.Local Government Fiscal Operations in Nigeria, by Akpan H. Ekpo and John E.U. Ndebbio,
Research Paper 73.Tax Reform and Revenue Productivity in Ghana, by Newman Kwadwo Kusi, Research Paper 74.Fiscal and Monetary Burden of Tanzania’s Corporate Bodies: The Case of Public Enterprises, by
H.P.B. Moshi, Research Paper 75.Analysis of Factors Affecting the Development of an Emerging Capital Market: The Case of the
Ghana Stock Market, by Kofi A. Osei, Research Paper 76.Ghana: Monetary Targeting and Economic Development, by Cletus K. Dordunoo and Alex Donkor,
Research Paper 77.The Nigerian Economy: Response of Agriculture to Adjustment Policies, by Mike Kwnashie,
Isaac Ajilima and Abdul-Ganiyu Garba, Research Paper 78.Agricultural Credit Under Economic Liberalization and Islamization in Sudan, by Adam B.
Elhiraika and Sayed A. Ahmed, Research Paper 79.Study of Data Collection Procedures, by Ademola Ariyo and Adebisi Adeniran, Research Paper
80.