tax free savings a ount flexile ... - homepage | securitas · allan gray tafree balanced fund 1...
TRANSCRIPT
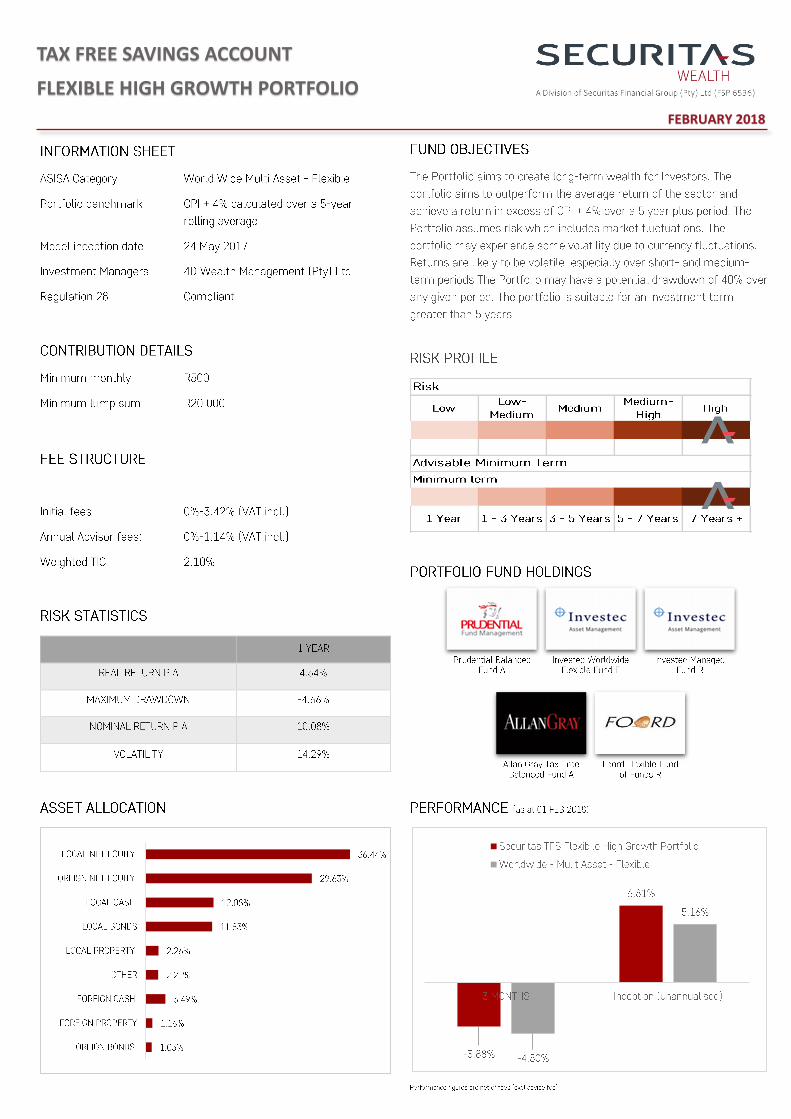
TAX FREE SAVINGS ACCOUNT
FLEXIBLE HIGH GROWTH PORTFOLIO
FEBRUARY 2018
.

Allan Gray Tax-Free Balanced Fund31 January 2018
Fund managers: Andrew Lapping, Duncan Artus, Jacques Plaut, Simon Raubenheimer, Ruan Stander. (Most foreign assets are invested in Orbis funds.) Inception date: 1 February 2016 Only available through tax-free investment accounts.
Fund description and summary of investment policyThe Fund is managed in broadly the same way as the Allan Gray Balanced Fund. It was created specifically for use in tax-free accounts and can only be accessed through these products. The Fund invests in a mix of shares, bonds, property, commodities and cash. The Fund may buy foreign assets up to a maximum of 25% of the Fund (with an additional 5% for African ex-SA investments). The Fund typically invests the bulk of its foreign allowance in a mix of funds managed by Orbis Investment Management Limited, our offshore investment partner. The maximum net equity exposure of the Fund is 75% and we may use exchange-traded derivative contracts on stock market indices to reduce net equity exposure from time to time. The Fund is managed to comply with the investment limits governing retirement funds. Returns are likely to be less volatile than those of an equity-only fund.
ASISA unit trust category: South African – Multi Asset – High Equity
Fund objective and benchmarkThe Fund aims to create long-term wealth for investors within the constraints governing retirement funds. It aims to outperform the average return of similar funds without assuming any more risk. The Fund’s benchmark is the market value-weighted average return of funds in the South African – Multi Asset – High Equity category (excluding Allan Gray funds).
How we aim to achieve the Fund’s objectiveWe seek to buy shares at a discount to their intrinsic value. We thoroughly research companies to assess their intrinsic value from a long-term perspective. This long-term perspective enables us to buy shares which are shunned by the stock market because of their unexciting or poor short-term prospects, but which are relatively attractively priced if one looks to the long term. If the stock market offers few attractive shares we may increase the Fund’s weighting to alternative assets such as bonds, property, commodities and cash, or we may partially hedge the Fund’s stock market exposure. By varying the Fund’s exposure to these different asset classes over time, we seek to enhance the Fund’s long-term returns and to manage its risk. The Fund’s bond and money market investments are actively managed.
Suitable for those investors who � Seek steady long-term capital growth � Are comfortable with taking on some risk of market fluctuation and potential capital
loss, but typically less than that of an equity fund � Wish to invest in a tax-free investment account � Typically have an investment horizon of at least three years
1. The market value-weighted average return of funds in the South African – Multi Asset – High Equity category (excluding Allan Gray funds). Source: Morningstar, performance as calculated by Allan Gray as at 31 January 2018.
2. This is based on the latest numbers published by IRESS as at 31 December 2017.
3. Maximum percentage decline over any period. The maximum drawdown occurred from 9 September 2016 to 4 November 2016 and maximum benchmark drawdown occurred from 30 May 2016 to 6 December 2016. Drawdown is calculated on the total return of the Fund/benchmark (i.e. including income).
4. The percentage of calendar months in which the Fund produced a positive monthly return since inception.
5. The standard deviation of the Fund’s monthly return. This is a measure of how much an investment’s return varies from its average over time.
6. These are the highest or lowest consecutive 12-month returns since inception. This is a measure of how much the Fund and the benchmark returns have varied per rolling 12-month period. The Fund’s highest annual return occurred during the 12 months ended 30 November 2017 and the benchmark’s occurred during the 12 months ended 31 October 2017. The Fund’s lowest annual return occurred during the 12 months ended 31 May 2017 and the benchmark’s occurred during the 12 months ended 31 May 2017. All rolling 12-month figures for the Fund and the benchmark are available from our Client Service Centre on request.
Fund information on 31 January 2018
Fund size R499m
Number of units 35 987 269
Price (net asset value per unit) R11.50
Minimum investment amountsMinimum lump sum per investor account R20 000
Additional lump sum R500
Minimum debit order* R500
* Only available to investors with a South African bank account.
Maximum investment amountsMaximum lump sum per investor account R33 000
Lifetime maximum R500 000
Maximum debit order* R2 750
Performance net of all fees and expenses
% Returns Fund Benchmark1 CPI inflation2
Cumulative:
Since inception (1 February 2016) 20.3 14.9 10.9
Annualised:
Since inception (1 February 2016) 9.7 7.2 5.6
Latest 2 years 9.7 7.2 5.7
Latest 1 year 10.0 8.7 4.7
Year-to-date (not annualised) 0.6 0.2 0.5
Risk measures (since inception)
Maximum drawdown3 -4.8 -6.3 n/a
Percentage positive months4 75.0 66.7 n/a
Annualised monthly volatility5 6.2 6.5 n/a
Highest annual return6 13.3 13.7 n/a
Lowest annual return6 2.6 1.0 n/a
1/4Minimum disclosure document and quarterly general investors’ report Issued: 8 February 2018 Tel 0860 000 654 or +27 (0)21 415 2301 Fax 0860 000 655 or +27 (0)21 415 2492 Email [email protected] www.allangray.co.za

Allan Gray Tax-Free Balanced Fund31 January 2018
Fund managers: Andrew Lapping, Duncan Artus, Jacques Plaut, Simon Raubenheimer, Ruan Stander. (Most foreign assets are invested in Orbis funds.) Inception date: 1 February 2016 Only available through tax-free investment accounts.
Fund historyThis Fund is managed in broadly the same way as the Allan Gray Balanced Fund. It was created specifically for use in tax-free accounts. Refer to the Allan Gray Balanced Fund factsheet for a history of the Allan Gray Balanced Fund since its inception on 1 October 1999.
Meeting the Fund objective The Fund aims to create long-term wealth for investors within the constraints governing retirement funds. It aims to outperform the average return of similar funds without assuming any more risk. The Fund experiences periods of underperformance in pursuit of this objective. As the Fund is less than five years old it is too early to tell if it has met its objective. However, since inception the Fund has outperformed its benchmark and we are confident that the Fund will meet its objective over the long term.
Income distributions for the last 12 months
To the extent that income earned in the form of dividends and interest exceeds expenses in the Fund, the Fund will distribute any surplus biannually.
30 Jun 2017 31 Dec 2017
Cents per unit 11.7509 12.4376
Annual management feeThe fee we charge is fixed at 1.25% excluding VAT.
This fee only applies to the portion of the unit trusts that we manage. The offshore portion of the unit trust is managed by Orbis. Orbis charges fixed fees within these funds. Orbis pays a marketing and distribution fee to Allan Gray.
Total expense ratio (TER) and Transaction costsTER and Transaction Costs calculations are based on actual data, and best estimates where actual data is not available or provides a poor estimate of potential future costs. Due to the short lifespan of the fund, actual data provides a poor estimate of future costs, and so an estimated TER and Transaction cost calculation is shown. The annual management fees charged by both Allan Gray and Orbis are included in the below estimated TER. A TER is a measure of the actual expenses incurred by a Fund over a one and three-year period (annualised). Since Fund returns are quoted after deduction of these expenses, the TER should not be deducted from the published returns (refer to page 4 for further information). Transaction costs are disclosed separately.
Asset allocation on 31 January 20188
Asset Class Total South Africa
Africa ex-SA
Foreign ex-Africa
Net equity 59.8 47.0 0.9 11.9
Hedged equity 7.1 0.0 0.0 7.1
Property 1.3 0.9 0.0 0.4
Commodity-linked 3.1 2.9 0.0 0.3
Bonds 10.1 8.6 0.8 0.7
Money market and bank deposits 18.5 14.0 0.7 3.8
Total (%) 100.0 73.4 2.4 24.29
8. Underlying holdings of Orbis funds are included on a look-through basis.
9. Up to 25% of the Fund’s value can be invested outside of Africa and 5% in Africa outside of South Africa. Market movements periodically cause the Fund to move beyond these limits. This must be corrected within 12 months.
Note: There may be slight discrepancies in the totals due to rounding.
Since inception, the Fund’s month-end net equity exposure has varied as follows:
Minimum (February 2016) 57.5%
Average 60.9%
Maximum (June 2017) 64.5%
Top 10 share holdings on 31 December 2017 (SA and Foreign) (updated quarterly)8
Company % of portfolio
Naspers7 6.5
Sasol 5.9
Old Mutual 3.7
British American Tobacco 3.6
Standard Bank 3.0
Remgro 2.7
Investec 1.9
Life Healthcare 1.4
Netcare 1.2
Woolworths 1.2
Total (%) 31.1
7. Includingstubcertificates.
Total expense ratio (TER) and Transaction costs
TER and Transaction costs breakdown for the 1 and 3-year period ending 31 December 2017
1yr % 3yr %
Total expense ratio 1.51 1.51
Fixed fee 1.36 1.36
Other costs excluding transaction costs
0.02 0.02
VAT 0.13 0.13
Transaction costs (including VAT)
0.09 0.07
Total investment charge 1.60 1.58
2/4Minimum disclosure document and quarterly general investors’ report Issued: 8 February 2018 Tel 0860 000 654 or +27 (0)21 415 2301 Fax 0860 000 655 or +27 (0)21 415 2492 Email [email protected] www.allangray.co.za

Allan Gray Tax-Free Balanced Fund31 January 2018
Fund managers: Andrew Lapping, Duncan Artus, Jacques Plaut, Simon Raubenheimer, Ruan Stander. (Most foreign assets are invested in Orbis funds.) Inception date: 1 February 2016 Only available through tax-free investment accounts.
Fund manager quarterly commentary as at 31 December 2017
It has been an action-packed year on the market. Here are some things that stood out for us:
� Naspers, which is now 20% of the FTSE/JSE All Share Index (ALSI), started the year at R2 000 per share, traded all the way up to R4 100, and is currently R3 400. Only two of the top hundred companies have beaten Naspers: Kumba and Exxaro.
� Steinhoff started the year as a R300 billion company, and now has a smaller market cap than Italtile.
� Our government’s financial position continued to deteriorate, but sentiment towards local firms turned positive when Cyril Ramaphosa was elected as head of the ANC. Barclays went from R150 to nearly R200 in the four days following the national conference.
� The rand has strengthened by 10% against the US dollar since January 2017.� The price of Bitcoin increased fourteen-fold.
We did not know who would win the ANC election. We do not have an edge in predicting this sort of thing, which is why we structure the portfolio for different outcomes. We also focus on buying undervalued shares, preferably shares under a cloud of negative sentiment and with lots of bad news priced in. This approach has worked well for us through numerous bubbles, crises, and upheavals. It is why we owned shares like Mr Price, Standard Bank, Foschini and Remgro - all of which benefitted from the change in sentiment after the ANC conference.
We were substantial net sellers of equity in the fourth quarter given the price appreciation of some of our largest holdings. We reduced our British American Tobacco holding in November while we were substantial sellers of Standard Bank in the latter half of December. That said we did add to our Woolworths position and initiate a small position in Steinhoff. As of writing the Steinhoff purchase was a mistake and has detracted 0.4% of Fund. There are a few things to be said:
1. We make many mistakes. Steinhoff was not the largest mistake in recent years. Not buying Kumba Iron Ore at R26 or Richemont at R80 were both way worse mistakes, to name just two.
2. There are different senses of the word “mistake”. We are not aware of any errors in our analysis, or process, only in how we weighed the upside versus the downside risks. These types of errors are always clear with the benefit of hindsight, never at the time!
3. The accounts of any business may be fraudulent. For some the probability of fraud is higher than for others. We do not take audited accounts at face value. We look for internal inconsistencies, pose questions to management, and evaluate the quality of the audit committee. We found plenty of cause for concern at Steinhoff. This did not lead us to blackball the share, but instead we put in place position limits and conservative valuation multiples. We only started investing when we thought the potential upside outweighed the risks.
4. For context, if you had owned a passive fund tracking the ALSI, your total loss would have been 2.4% for the year. This made Steinhoff the top contributor in 2017 to our performance relative to the market.
5. We don’t yet know the final outcome or magnitude of the fraud. It is possible that the share recovers some of its losses.
If we were only concerned about avoiding embarrassment, or if we tried to avoid all shares with downside risk, this would almost surely dent our long-term returns. The Fund’s performance over the year was helped by positions in Standard Bank and Astral Foods, while it was hindered by positions in Sasol and Life Healthcare. Unfortunately, we did not find value in Richemont even when the share was below R90 in January 2017 and missed out on the share’s strong performance in 2017. Fortunately we could also not find value in Anglogold or Aspen, two large companies that underperformed.
Strong returns from international markets, and outperformance by Orbis, contributed to the performance of the Fund in 2017. Commentary contributed by Jacques Plaut
3/4Minimum disclosure document and quarterly general investors’ report Issued: 8 February 2018 Tel 0860 000 654 or +27 (0)21 415 2301 Fax 0860 000 655 or +27 (0)21 415 2492 Email [email protected] www.allangray.co.za

Allan Gray Tax-Free Balanced Fund31 January 2018
Fund managers: Andrew Lapping, Duncan Artus, Jacques Plaut, Simon Raubenheimer, Ruan Stander. (Most foreign assets are invested in Orbis funds.) Inception date: 1 February 2016 Only available through tax-free investment accounts.
Management CompanyAllan Gray Unit Trust Management (RF) Proprietary Limited (the ‘Management Company’) is registered as a management company under the Collective Investment Schemes Control Act 45 of 2002, in terms of which it operates 11 unit trust portfolios under the Allan Gray Unit Trust Scheme, and is supervised by the Financial Services Board (‘FSB’). The Management Company is incorporated under the laws of South Africa and has been approved by the regulatory authority of Botswana to market its unit trusts in Botswana, however it is not supervised or licensed in Botswana. Allan Gray Proprietary Limited (the ‘Investment Manager’), an authorised financial services provider, is the appointed Investment Manager of the Management Company and is a member of the Association for Savings & Investment South Africa (ASISA). The trustee/custodian of the Allan Gray Unit Trust Scheme is Rand Merchant Bank, a division of FirstRand Bank Limited. The trustee/custodian can be contacted at RMB Custody and Trustee Services: Tel: +27 (0)87 736 1732 or www.rmb.co.za
Performance Collective Investment Schemes in Securities (unit trusts or funds) are generally medium- to long-term investments. The value of units may go down as well as up and past performance is not necessarily a guide to future performance. Movements in exchange rates may also cause the value of underlying international investments to go up or down. The Management Company does not provide any guarantee regarding the capital or the performance of the Fund. Performance figures are provided by the Investment Manager and are for lump sum investments with income distributions reinvested. Where annualised performance is mentioned, this refers to the average return per year over the period. Actual investor performance may differ as a result of the investment date, the date of reinvestment and dividend withholding tax.
Fund mandateThe Fund may be closed to new investments at any time in order to be managed according to its mandate. Unit trusts are traded at ruling prices and can engage in borrowing and scrip lending. The Fund may borrow up to 10% of its market value to bridge insufficient liquidity.
Unit price Unit trust prices are calculated on a net asset value basis, which is the total market value of all assets in the Fund including any income accruals and less any permissible deductions from the Fund divided by the number of units in issue. Forward pricing is used and fund valuations take place at approximately 16:00 each business day. Purchase and redemption requests must be received by the Management Company by 14:00 each business day to receive that day’s price. Unit trust prices are available daily on www.allangray.co.za
Fees Permissible deductions may include management fees, brokerage, Securities Transfer Tax (STT), auditor’s fees, bank charges and trustee fees. A schedule of fees, charges and maximum commissions is available on request from Allan Gray.
Total expense ratio (TER) and Transaction costsThe total expense ratio (TER) is the annualised percentage of the Fund’s average assets under management that has been used to pay the Fund’s actual expenses over the past one and three-year periods. The TER includes the annual management fees that have been charged (both the fee at benchmark and any performance component charged), VAT and other expenses like audit and trustee fees. Transaction costs (including brokerage, Securities Transfer Tax [STT], STRATE and FSB Investor Protection Levy and VAT thereon) are shown separately. Transaction costs are a necessary cost in administering the Fund and impact Fund returns. They should not be considered in isolation as returns may be impacted by many other factors over time including market returns, the type of financial product, the investment decisions of the investment manager and the TER. Since Fund returns are quoted after the deduction of these expenses, the TER and Transaction costs should not be deducted again from published returns. As unit trust expenses vary, the current TER cannot be used as an indication of future TERs. A higher TER ratio does not necessarily imply a poor return, nor does a low TER imply a good return. Instead, when investing, the investment objective of the Fund should be aligned with the investor’s objective and compared against the performance of the Fund. The TER and other funds’ TERs should then be used to evaluate whether the Fund performance offers value for money. The sum of the TER and Transaction costs is shown as the Total investment charge.
Compliance with Regulation 28The Fund is managed to comply with Regulation 28 of the Pension Funds Act. Exposures in excess of the limits will be corrected immediately, except where due to a change in the fair value or characteristic of an asset, e.g. market value fluctuations, in which case they will be corrected within a reasonable time period. The Management Company does not monitor compliance by retirement funds with section 19(4) of the Pension Funds Act (item 6 of Table 1 to Regulation 28).
Foreign exposure This fund may invest in foreign funds managed by Orbis Investment Management Limited, our offshore investment partner.
The Allan Gray Tax-Free Investment AccountThe Allan Gray Tax-Free Investment Account is provided by Allan Gray Life Limited, an authorised financial services provider and licensed under the Long-Term Insurance Act 52 of 1998. Allan Gray Life Limited is a subsidiary of Allan Gray Proprietary Limited (Allan Gray). The Allan Gray Tax-Free Investment account is administered by Allan Gray Investment Services Proprietary Limited, an authorised administrative financial services provider. The underlying investment options of the Allan Gray individual life products are portfolios of Collective Investment Schemes in Securities (unit trusts or funds).
Important information for investors
Need more information?You can obtain additional information about your proposed investment from Allan Gray free of charge either via our website www.allangray.co.za or via our Client Service Centre on 0860 000 654.
4/4Minimum disclosure document and quarterly general investors’ report Issued: 8 February 2018 Tel 0860 000 654 or +27 (0)21 415 2301 Fax 0860 000 655 or +27 (0)21 415 2492 Email [email protected] www.allangray.co.za
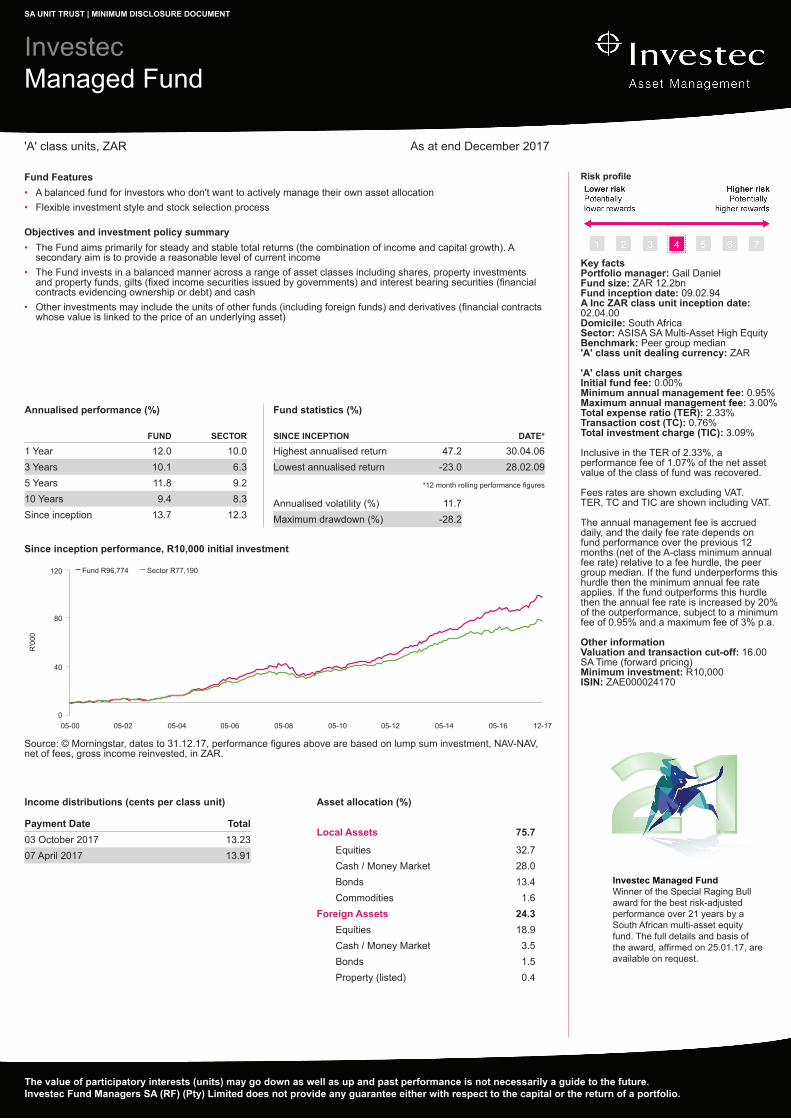
Fund Features• A balanced fund for investors who don't want to actively manage their own asset allocation• Flexible investment style and stock selection process
Objectives and investment policy summary• The Fund aims primarily for steady and stable total returns (the combination of income and capital growth). A
secondary aim is to provide a reasonable level of current income• The Fund invests in a balanced manner across a range of asset classes including shares, property investments
and property funds, gilts (fixed income securities issued by governments) and interest bearing securities (financial contracts evidencing ownership or debt) and cash
• Other investments may include the units of other funds (including foreign funds) and derivatives (financial contracts whose value is linked to the price of an underlying asset)
Fund statistics (%)
SINCE INCEPTION DATE*
Highest annualised return 47.2 30.04.06Lowest annualised return -23.0 28.02.09
*12 month rolling performance figures
Annualised volatility (%) 11.7Maximum drawdown (%) -28.2
Income distributions (cents per class unit)
Payment Date Total03 October 2017 13.2307 April 2017 13.91
Annualised performance (%)
FUND SECTOR
1 Year 12.0 10.03 Years 10.1 6.35 Years 11.8 9.210 Years 9.4 8.3Since inception 13.7 12.3
'A' class units, ZAR As at end December 2017
Risk profile
Key factsPortfolio manager: Gail DanielFund size: ZAR 12.2bnFund inception date: 09.02.94A Inc ZAR class unit inception date: 02.04.00 Domicile: South AfricaSector: ASISA SA Multi-Asset High EquityBenchmark: Peer group median'A' class unit dealing currency: ZAR 'A' class unit charges Initial fund fee: 0.00%Minimum annual management fee: 0.95%Maximum annual management fee: 3.00%Total expense ratio (TER): 2.33%Transaction cost (TC): 0.76%Total investment charge (TIC): 3.09% Inclusive in the TER of 2.33%, a performance fee of 1.07% of the net asset value of the class of fund was recovered. Fees rates are shown excluding VAT. TER, TC and TIC are shown including VAT. The annual management fee is accrued daily, and the daily fee rate depends on fund performance over the previous 12 months (net of the A-class minimum annual fee rate) relative to a fee hurdle, the peer group median. If the fund underperforms this hurdle then the minimum annual fee rate applies. If the fund outperforms this hurdle then the annual fee rate is increased by 20% of the outperformance, subject to a minimum fee of 0.95% and a maximum fee of 3% p.a. Other informationValuation and transaction cut-off: 16.00 SA Time (forward pricing) Minimum investment: R10,000ISIN: ZAE000024170
Since inception performance, R10,000 initial investment
05-00 05-02 05-04 05-06 05-08 05-10 05-12 05-14 05-160
40
80
120 Fund R96,774 Sector R77,190
R'0
00
12-17
Source: © Morningstar, dates to 31.12.17, performance figures above are based on lump sum investment, NAV-NAV, net of fees, gross income reinvested, in ZAR.
SA UNIT TRUST | MINIMUM DISCLOSURE DOCUMENT
Asset allocation (%)
Local Assets 75.7
Equities 32.7Cash / Money Market 28.0Bonds 13.4Commodities 1.6
Foreign Assets 24.3Equities 18.9Cash / Money Market 3.5Bonds 1.5Property (listed) 0.4
InvestecManaged Fund
The value of participatory interests (units) may go down as well as up and past performance is not necessarily a guide to the future.Investec Fund Managers SA (RF) (Pty) Limited does not provide any guarantee either with respect to the capital or the return of a portfolio.
Investec Managed FundWinner of the Special Raging Bull award for the best risk-adjusted performance over 21 years by a South African multi-asset equity fund. The full details and basis of the award, affirmed on 25.01.17, are available on request.

Investec Managed Fund
SA UNIT TRUST | MINIMUM DISCLOSURE DOCUMENT
Specific Fund RisksCurrency exchange: Changes in the relative values of different currencies may adversely affect the value of investments and any related income.Default: There is a risk that the issuers of fixed income investments (e.g. bonds) may not be able to meet interest payments nor repay the money they have borrowed. The worse the credit quality of the issuer, the greater the risk of default and therefore investment loss.Derivative counterparty: A counterparty to a derivative transaction may fail to meet its obligations thereby leading to financial loss.Derivatives: The use of derivatives is not intended to increase the overall level of risk. However, the use of derivatives may still lead to large changes in value and includes the potential for large financial loss.Developing market: These markets carry a higher risk of financial loss than more developed markets as they may have less developed legal, political, economic or other systems.Interest rate: The value of fixed income investments (e.g. bonds) tends to decrease when interest rates and/or inflation rises.
Glossary SummaryAnnualised performance: Annualised performance is the average return per year over the period.Duration: This is a measure of risk for funds which invest in bonds as it predicts the sensitivity of the value of a fund’s portfolio given changes in interest rates. The higher the value the greater the volatility of the fund’s performance resulting from changes to interest rates. The Modified duration is shown.Maximum drawdown: The largest peak to trough decline during a specific period of an investment.NAV: The Net Asset Value (NAV) represents the value of the assets of a fund less its liabilities.Risk profile: A number on a scale of 1 to 7 based on how much the value of a fund has fluctuated over the past 5 years (or an estimate if the fund has a shorter track record). A rating of 1 represents the lower end of the risk scale with potentially lower rewards available whilst a rating of 7 reflects higher risk but potentially higher rewards.Total Expense Ratio: TER includes the annual management fee, performance fee and administrative costs and includes VAT but excludes portfolio transaction costs (except in the case of an entry or exit charge paid by a fund when buying or selling units in another fund) expressed as a percentage of the average daily value of the Fund calculated over a rolling three year period (or since inception where applicable) and annualised to the most recently completed quarter. Where funds invest in the participatory interests of foreign collective investment schemes, these may levy additional charges which are included in the relevant TER. A higher TER does not necessarily imply a poor return, nor does a low TER imply a good return. The current TER may not necessarily be an accurate indication of future TERs.Transaction cost: Transaction costs are a necessary cost in administering the Fund and impacts returns. It should not be considered in isolation as returns may be impacted by many other factors over time including market returns, the type of financial product, the investment decisions of the investment manager and the TER.Calculations are based on actual data where possible and best estimates where actual data is not available. Transaction costs are inclusive of VAT.Total investment charge: This is the sum of the TER and TC.Volatility: The amount by which the performance of a fund fluctuates over a given period.
Important informationAll information provided is product related and is not intended to address the circumstances of any particular individual or entity. We are not acting and do not purport to act in any way as an advisor or in a fiduciary capacity. No one should act upon such information without appropriate professional advice after a thorough examination of a particular situation. Collective investment scheme funds (CISs) are generally medium to long term investments. Funds are traded at ruling prices and can engage in borrowing, up to 10% of fund net asset value to bridge insufficient liquidity, and scrip lending. Unit trust prices are calculated on a net asset value basis, which is the total value of all assets in the fund including any income accruals less permissible deductions from the fund. A schedule of charges, fees and advisor fees is available on request from the Manager, Investec Fund Managers SA (RF) (Pty) Ltd (IFMSA) which is registered under the Collective Investment Schemes Control Act. Additional advisor fees may be paid and if so, are subject to the relevant FAIS disclosure requirements. Performance shown is that of the fund and individual investor performance may differ as a result of initial fees, actual investment date, date of any subsequent reinvestment and any dividend withholding tax. There are different fee classes of units on the fund and the information presented is for the most expensive class. This fund may be closed in order to be managed in accordance with the mandate. Fluctuations or movements in exchange rates may cause the value of underlying international investments to go up or down. Where the fund invests in the participatory interests of foreign collective investment schemes, these may levy additional charges which are included in the relevant TER. Fund prices are published each business day at www.investecassetmanagement.com and in select media publications . The Manager outsources its portfolio management to Investec Asset Management (Pty) Ltd ('Investec'), a member of the Association for Savings and Investment SA (ASISA). This minimum disclosure document is the copyright of Investec and its contents may not be re-used without Investec's prior permission. Issued: 11.01.2018
To find out about this Fund and other Investec Funds, visit www.investecassetmanagement.com/saliterature
Scheme Trustee: FirstRand Bank Limited PO Box 7713 Johannesburg 2000 Telephone: (011) 282 1808
Contact us Investec Fund Managers SA (RF) (PTY) LimitedTelephone: 0860 500 900*: [email protected]
Sector allocation excl. cash (%)
Financials Basic Materials Consumer Goods Telecommunications Consumer Services Technology Health Care Additional Other
27.722.716.111.27.75.03.73.12.8
FTSE sector data source: FTSE International Limited (“FTSE”) © FTSE 2017. Please note a disclaimer applies to FTSE sector data and can be found at: http://www.ftse.com/products/downloads/FTSE_Wholly_Owned_Non-Partner.pdf
Top Equity holdings (%)
Standard Bank Group Ltd 3.9FirstRand Ltd 2.9Anglo American Plc 2.4Naspers Ltd 2.4MTN Group Ltd 2.2Cie Financiere Richemont SA 2.1Anheuser-busch Inbev SA/NV 2.1BHP Billiton Plc 2.0Sasol Ltd 1.9Old Mutual Plc 1.7Total 23.6
1999
2000
2001
2002
2003
2004
2005
2006
2007
2008
2009
2010
2011
2012
2013
2014
2015
2016
2017
R0
R200
R400
R600
R800
R1000
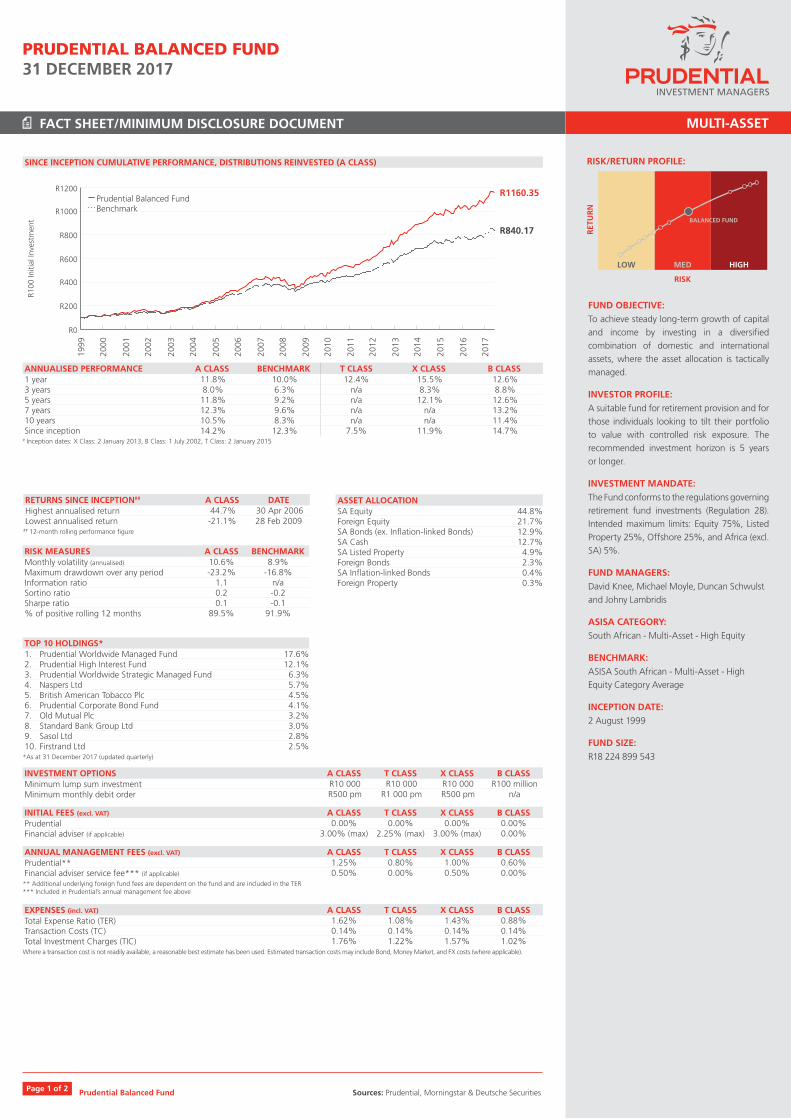
R1200Prudential Balanced FundBenchmark
R100
Initi
al In
vest
men
t
R1160.35
R840.17
ANNUALISED PERFORMANCE A CLASS BENCHMARK T CLASS X CLASS B CLASS1 year 11.8% 10.0% 12.4% 15.5% 12.6%3 years 8.0% 6.3% n/a 8.3% 8.8%5 years 11.8% 9.2% n/a 12.1% 12.6%7 years 12.3% 9.6% n/a n/a 13.2%10 years 10.5% 8.3% n/a n/a 11.4%Since inception 14.2% 12.3% 7.5% 11.9% 14.7%
# Inception dates: X Class: 2 January 2013, B Class: 1 July 2002, T Class: 2 January 2015
SINCE INCEPTION CUMULATIVE PERFORMANCE, DISTRIBUTIONS REINVESTED (A CLASS)
RETURNS SINCE INCEPTION## A CLASS DATEHighest annualised return 44.7% 30 Apr 2006Lowest annualised return -21.1% 28 Feb 2009
## 12-month rolling performance figure
RISK MEASURES A CLASS BENCHMARKMonthly volatility (annualised) 10.6% 8.9%Maximum drawdown over any period -23.2% -16.8%Information ratio 1.1 n/aSortino ratio 0.2 -0.2Sharpe ratio 0.1 -0.1% of positive rolling 12 months 89.5% 91.9%
TOP 10 HOLDINGS*1. Prudential Worldwide Managed Fund 17.6%2. Prudential High Interest Fund 12.1%3. Prudential Worldwide Strategic Managed Fund 6.3%4. Naspers Ltd 5.7%5. British American Tobacco Plc 4.5%6. Prudential Corporate Bond Fund 4.1%7. Old Mutual Plc 3.2%8. Standard Bank Group Ltd 3.0%9. Sasol Ltd 2.8%10. Firstrand Ltd 2.5%
*As at 31 December 2017 (updated quarterly)
ASSET ALLOCATIONSA Equity 44.8%Foreign Equity 21.7%SA Bonds (ex. Inflation-linked Bonds) 12.9%SA Cash 12.7%SA Listed Property 4.9%Foreign Bonds 2.3%SA Inflation-linked Bonds 0.4%Foreign Property 0.3%
INVESTMENT OPTIONS A CLASS T CLASS X CLASS B CLASSMinimum lump sum investment R10 000 R10 000 R10 000 R100 millionMinimum monthly debit order R500 pm R1 000 pm R500 pm n/a
INITIAL FEES (excl. VAT) A CLASS T CLASS X CLASS B CLASSPrudential 0.00% 0.00% 0.00% 0.00%Financial adviser (if applicable) 3.00% (max) 2.25% (max) 3.00% (max) 0.00%
ANNUAL MANAGEMENT FEES (excl. VAT) A CLASS T CLASS X CLASS B CLASSPrudential** 1.25% 0.80% 1.00% 0.60%Financial adviser service fee*** (if applicable) 0.50% 0.00% 0.50% 0.00%
** Additional underlying foreign fund fees are dependent on the fund and are included in the TER *** Included in Prudential’s annual management fee above
EXPENSES (incl. VAT) A CLASS T CLASS X CLASS B CLASSTotal Expense Ratio (TER) 1.62% 1.08% 1.43% 0.88%Transaction Costs (TC) 0.14% 0.14% 0.14% 0.14%Total Investment Charges (TIC) 1.76% 1.22% 1.57% 1.02%
Where a transaction cost is not readily available, a reasonable best estimate has been used. Estimated transaction costs may include Bond, Money Market, and FX costs (where applicable).
PRUDENTIAL BALANCED FUND31 DECEMBER 2017
MULTI-ASSET
RISK/RETURN PROFILE:
RET
UR
N
HIGHMED LOW
RISK
BALANCED FUND
Page 1 of 2
FUND OBJECTIVE:To achieve steady long-term growth of capital and income by investing in a diversified combination of domestic and international assets, where the asset allocation is tactically managed.
INVESTOR PROFILE:A suitable fund for retirement provision and for those individuals looking to tilt their portfolio to value with controlled risk exposure. The recommended investment horizon is 5 years or longer.
INVESTMENT MANDATE:The Fund conforms to the regulations governing retirement fund investments (Regulation 28). Intended maximum limits: Equity 75%, Listed Property 25%, Offshore 25%, and Africa (excl. SA) 5%.
FUND MANAGERS:David Knee, Michael Moyle, Duncan Schwulst and Johny Lambridis
ASISA CATEGORY:South African - Multi-Asset - High Equity
BENCHMARK:ASISA South African - Multi-Asset - High Equity Category Average
INCEPTION DATE:2 August 1999
FUND SIZE:R18 224 899 543
FACT SHEET/MINIMUM DISCLOSURE DOCUMENT
Prudential Balanced Fund Sources: Prudential, Morningstar & Deutsche Securities
FACT SHEET/MINIMUM DISCLOSURE DOCUMENT
PRUDENTIAL BALANCED FUND31 DECEMBER 2017
DISCLAIMERPrudential Portfolio Managers Unit Trusts Ltd (Registration number: 1999/0524/06) is an approved CISCA management company (#29). Assets are managed by Prudential Investment Managers (South Africa) (Pty) Ltd, which is an approved discretionary Financial Services Provider (#45199). The Trustee’s/Custodian details are: Standard Bank of South Africa limited – Trustees Services & investor Services. 20th Floor, Main Tower, Standard Bank Centre, Heerengracht, Cape Town.
Collective Investment Schemes (unit trusts) are generally medium-to long-term investments. Past performance is not necessarily a guide to future investment performance. Unit trust prices are calculated on a net asset value basis. This means the price is the total net market value of all assets of the unit trust fund divided by the total number of units of the fund. Any market movements – for example in share prices, bond prices, money market prices or currency fluctuations - relevant to the underlying assets of the fund may cause the value of the underlying assets to go up or down. As a result, the price of your units may go up or down. Unit trusts are traded at the ruling forward price of the day, meaning that transactions are processed during the day before you or the Manager know what the price at the end of the day will be. The price and therefore the number of units involved in the transaction are only known on the following day. The unit trust fund may borrow up to 10% of the fund value, and it may also lend any scrip (proof of ownership of an investment instrument) that it holds to earn additional income. A Prudential unit trust fund may consist of different fund classes that are subject to different fees and charges. Where applicable, the Manager will pay your financial adviser an agreed standard ongoing adviser fee, which is included in the overall costs of the fund. A Collective Investment Schemes (CIS) summary with all fees and maximum initial and ongoing adviser fees is available on our website. One can also obtain additional information on Prudential products on the Prudential website. The Fund may hold foreign securities including foreign CIS funds. As a result, the fund may face material risks. The volatility of the fund may be higher and the liquidity of the underlying securities may be restricted due to relative market sizes and market conditions. The fund’s ability to settle securities and to repatriate investment income, capital or the proceeds of sales of securities may be adversely affected for multiple reasons including market conditions, macro-economic and political circumstances. Further, the return on the security may be affected (positively or negatively) by the difference in tax regimes between the domestic and foreign tax jurisdictions. The availability of market information and information on any underlying sub-funds may be delayed. The Manager may, at its discretion, close your chosen unit trust fund to new investors and to additional investments by existing investors to make sure that it is managed in accordance with its mandate. It may also stop your existing debit order investment. The Manager makes no guarantees as to the capital invested in the fund or the returns of the fund. Excessive withdrawals from the fund may place the fund under liquidity pressure and, in certain circumstances; a process of ring fencing withdrawal instructions may be followed. Fund prices are published daily on the Prudential website. These are also available upon request. The performance is calculated for the portfolio. Individual investor performance may differ as a result of initial fees, the actual investment date, the date of reinvestment and dividend withholding tax. Purchase and repurchase requests must be received by the Manager by 13h30 (11h30 for the Money Market Fund) SA time each business day. All online purchase and repurchase transactions must be received by the Manager by 10h30 (for all Funds) SA time each business day.
Sources: Prudential, Morningstar & Deutsche Securities
MULTI-ASSET
INCOME DISTRIBUTIONS TOTAL DISTRIBUTIONS 12-MONTH YIELD(A Class) 31 December 2017 8.17 cpu 2.46%(A Class) 30 June 2017 8.24 cpu 2.80%
(B Class) 31 December 2017 10.61 cpu 3.13%(B Class) 30 June 2017 10.55 cpu 3.52%
(T Class) 31 December 2017 9.84 cpu 2.93%(T Class) 30 June 2017 9.82 cpu 3.30%
If the income earned in the form of dividends and interest exceeds the total expenses, the Fund will make a distribution. (cpu = cents per unit)
An electronic copy of this document is available at www.prudential.co.za
Prudential Balanced Fund
Application forms and all requireddocumentation must be faxed to+27 11 263 6143 or e-mailed [email protected].
Page 2 of 2
FUND COMMENTARYThe year that was 2017 ended on a high in December, with equity markets around the world posting fresh record highs amid a remarkable lack of volatility. Global growth remained strong, inflation relatively subdued and monetary policies supportive for the month. The passage of the Republican tax cut package in the US bolstered market optimism further. During the month the US Federal Reserve raised its base interest rate by 25 basis points, its third hike for the year, as widely expected. Together with full employment and the large corporate tax cuts to come, analysts expect US inflation to become more problematic in 2018 – market consensus is for four 25bp Fed rate hikes in the new year.
In South Africa it was a surprisingly positive month for investors, with markets dominated by the election of market-friendly Cyril Ramaphosa as President of the ANC. Investors interpreted Ramaphosa's election as an opportunity for the country to introduce much-needed reforms, reduce corruption, and lift business and consumer sentiment. Greater prospects for improved fiscal responsibility also helped the credit rating outlook. Combined with Moody's credit rating reprieve in November, this more optimistic sentiment helped lower risk perceptions among both local and offshore investors, driving strong rallies in South African bonds, listed property and the rand. In December, the BEASSA All Bond Index delivered a total return of 5.7%, Inflation-linked bonds (Composite ILB Index) 4.9%, and cash as measured by the STeFI Composite Index returned 0.6%. Listed property returned 4.2% for the month. The rand, meanwhile, gained strongly in December against all three major global currencies, appreciating 9.3% against a weaker US dollar, 9.1% against the pound sterling and 8.6% against the euro.
Looking at global equity market returns (all in US$), the MSCI World Index (for developed markets) returned 1.4% in December, underperforming the MSCI Emerging Markets Index at 3.6%. Global bonds were largely flat in December as the Bloomberg Barclays Global Aggregate Bond Index (US$) returned 0.3%, while the EPRA/NAREIT Developed Global Property Index (US$) returned 1.4% for the month.
In December, the fund’s overweight holdings in SA equity and SA bonds, as well as its underweight in international fixed income assets added the most to relative performance. Detracting most from value was its underweight in SA cash. Performance remains upper quartile over all annual periods from 1-10 years.
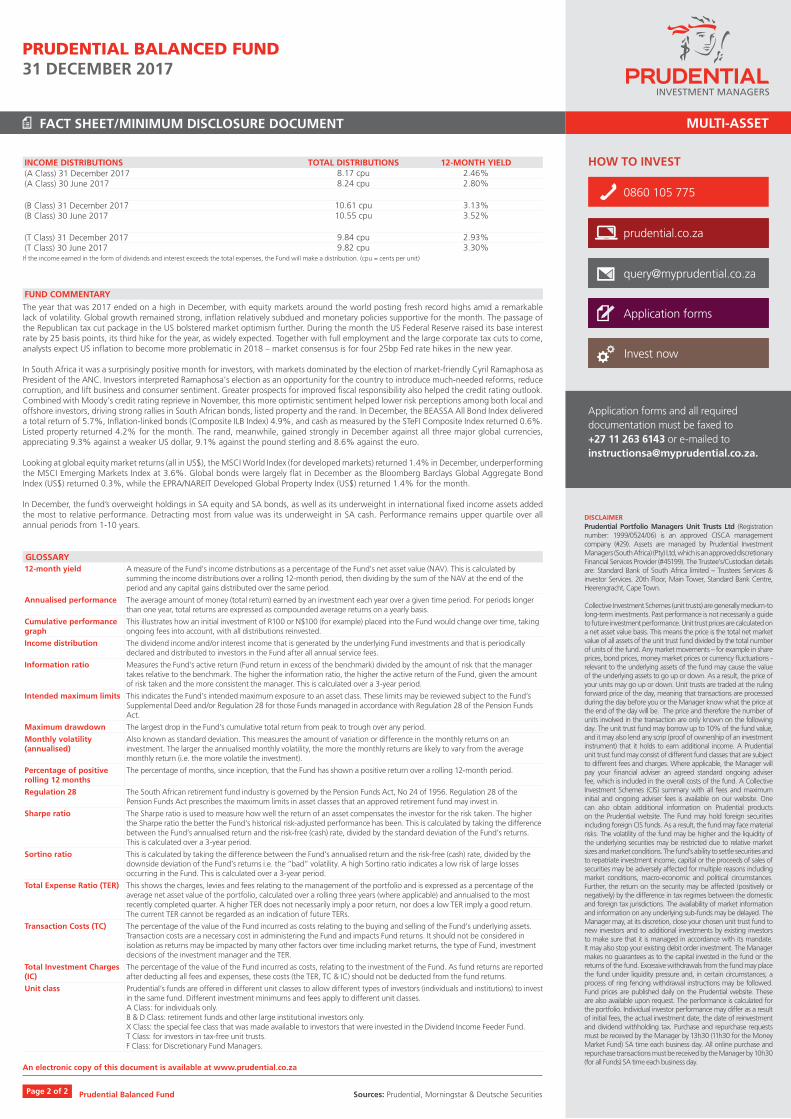
GLOSSARY12-month yield A measure of the Fund's income distributions as a percentage of the Fund's net asset value (NAV). This is calculated by
summing the income distributions over a rolling 12-month period, then dividing by the sum of the NAV at the end of the period and any capital gains distributed over the same period.
Annualised performance The average amount of money (total return) earned by an investment each year over a given time period. For periods longer than one year, total returns are expressed as compounded average returns on a yearly basis.
Cumulative performance graph
This illustrates how an initial investment of R100 or N$100 (for example) placed into the Fund would change over time, taking ongoing fees into account, with all distributions reinvested.
Income distribution The dividend income and/or interest income that is generated by the underlying Fund investments and that is periodically declared and distributed to investors in the Fund after all annual service fees.
Information ratio Measures the Fund’s active return (Fund return in excess of the benchmark) divided by the amount of risk that the manager takes relative to the benchmark. The higher the information ratio, the higher the active return of the Fund, given the amount of risk taken and the more consistent the manager. This is calculated over a 3-year period.
Intended maximum limits This indicates the Fund’s intended maximum exposure to an asset class. These limits may be reviewed subject to the Fund’s Supplemental Deed and/or Regulation 28 for those Funds managed in accordance with Regulation 28 of the Pension Funds Act.
Maximum drawdown The largest drop in the Fund’s cumulative total return from peak to trough over any period.
Monthly volatility (annualised)
Also known as standard deviation. This measures the amount of variation or difference in the monthly returns on an investment. The larger the annualised monthly volatility, the more the monthly returns are likely to vary from the average monthly return (i.e. the more volatile the investment).
Percentage of positive rolling 12 months
The percentage of months, since inception, that the Fund has shown a positive return over a rolling 12-month period.
Regulation 28 The South African retirement fund industry is governed by the Pension Funds Act, No 24 of 1956. Regulation 28 of the Pension Funds Act prescribes the maximum limits in asset classes that an approved retirement fund may invest in.
Sharpe ratio The Sharpe ratio is used to measure how well the return of an asset compensates the investor for the risk taken. The higher the Sharpe ratio the better the Fund’s historical risk-adjusted performance has been. This is calculated by taking the difference between the Fund’s annualised return and the risk-free (cash) rate, divided by the standard deviation of the Fund’s returns. This is calculated over a 3-year period.
Sortino ratio This is calculated by taking the difference between the Fund’s annualised return and the risk-free (cash) rate, divided by the downside deviation of the Fund’s returns i.e. the ”bad” volatility. A high Sortino ratio indicates a low risk of large losses occurring in the Fund. This is calculated over a 3-year period.
Total Expense Ratio (TER) This shows the charges, levies and fees relating to the management of the portfolio and is expressed as a percentage of the average net asset value of the portfolio, calculated over a rolling three years (where applicable) and annualised to the most recently completed quarter. A higher TER does not necessarily imply a poor return, nor does a low TER imply a good return. The current TER cannot be regarded as an indication of future TERs.
Transaction Costs (TC) The percentage of the value of the Fund incurred as costs relating to the buying and selling of the Fund's underlying assets. Transaction costs are a necessary cost in administering the Fund and impacts Fund returns. It should not be considered in isolation as returns may be impacted by many other factors over time including market returns, the type of Fund, investment decisions of the investment manager and the TER.
Total Investment Charges (IC)
The percentage of the value of the Fund incurred as costs, relating to the investment of the Fund. As fund returns are reported after deducting all fees and expenses, these costs (the TER, TC & IC) should not be deducted from the fund returns.
Unit class Prudential’s funds are offered in different unit classes to allow different types of investors (individuals and institutions) to invest in the same fund. Different investment minimums and fees apply to different unit classes.A Class: for individuals only.B & D Class: retirement funds and other large institutional investors only.X Class: the special fee class that was made available to investors that were invested in the Dividend Income Feeder Fund.T Class: for investors in tax-free unit trusts.F Class: for Discretionary Fund Managers.
0860 105 775
HOW TO INVEST
Application forms
Invest now
prudential.co.za
Application forms
Invest now
prudential.co.za
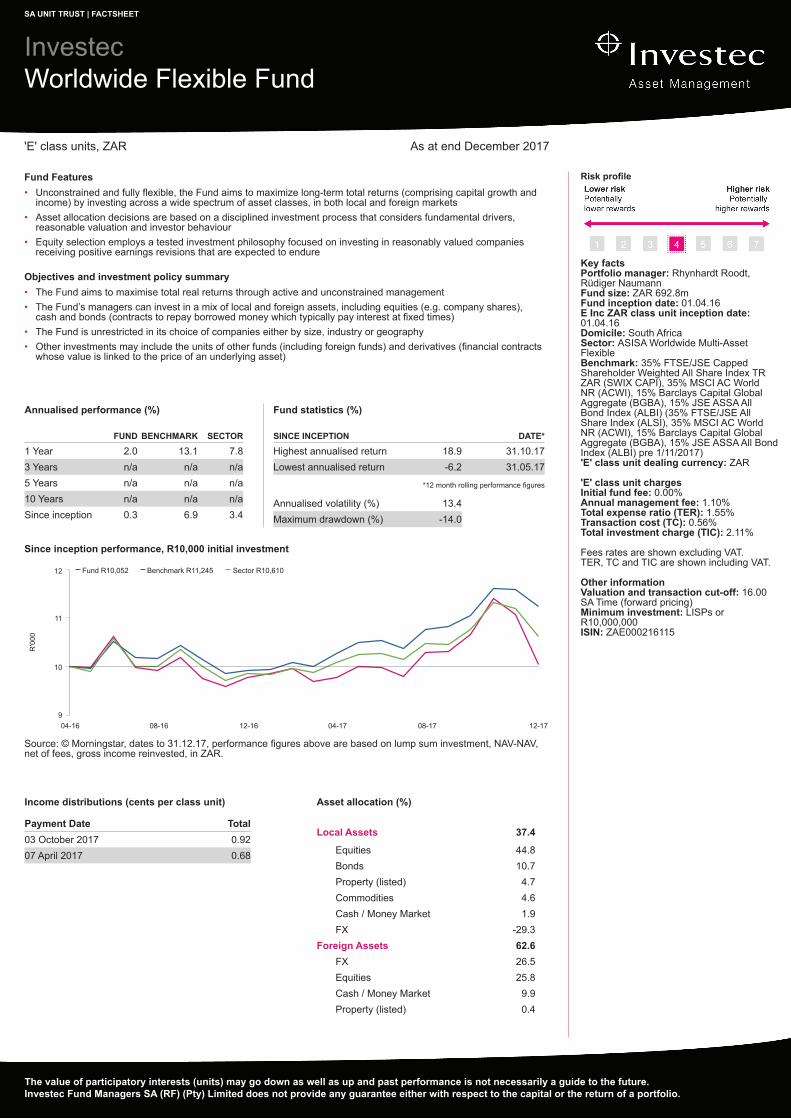
Fund Features• Unconstrained and fully flexible, the Fund aims to maximize long-term total returns (comprising capital growth and
income) by investing across a wide spectrum of asset classes, in both local and foreign markets• Asset allocation decisions are based on a disciplined investment process that considers fundamental drivers,
reasonable valuation and investor behaviour• Equity selection employs a tested investment philosophy focused on investing in reasonably valued companies
receiving positive earnings revisions that are expected to endure
Objectives and investment policy summary• The Fund aims to maximise total real returns through active and unconstrained management• The Fund’s managers can invest in a mix of local and foreign assets, including equities (e.g. company shares),
cash and bonds (contracts to repay borrowed money which typically pay interest at fixed times)• The Fund is unrestricted in its choice of companies either by size, industry or geography• Other investments may include the units of other funds (including foreign funds) and derivatives (financial contracts
whose value is linked to the price of an underlying asset)
Fund statistics (%)
SINCE INCEPTION DATE*
Highest annualised return 18.9 31.10.17Lowest annualised return -6.2 31.05.17
*12 month rolling performance figures
Annualised volatility (%) 13.4Maximum drawdown (%) -14.0
Income distributions (cents per class unit)
Payment Date Total03 October 2017 0.9207 April 2017 0.68
Annualised performance (%)
FUND BENCHMARK SECTOR
1 Year 2.0 13.1 7.83 Years n/a n/a n/a5 Years n/a n/a n/a10 Years n/a n/a n/aSince inception 0.3 6.9 3.4
'E' class units, ZAR As at end December 2017
Risk profile
Key factsPortfolio manager: Rhynhardt Roodt, Rüdiger Naumann Fund size: ZAR 692.8mFund inception date: 01.04.16E Inc ZAR class unit inception date: 01.04.16 Domicile: South AfricaSector: ASISA Worldwide Multi-Asset Flexible Benchmark: 35% FTSE/JSE Capped Shareholder Weighted All Share Index TR ZAR (SWIX CAPI), 35% MSCI AC World NR (ACWI), 15% Barclays Capital Global Aggregate (BGBA), 15% JSE ASSA All Bond Index (ALBI) (35% FTSE/JSE All Share Index (ALSI), 35% MSCI AC World NR (ACWI), 15% Barclays Capital Global Aggregate (BGBA), 15% JSE ASSA All Bond Index (ALBI) pre 1/11/2017) 'E' class unit dealing currency: ZAR 'E' class unit charges Initial fund fee: 0.00%Annual management fee: 1.10%Total expense ratio (TER): 1.55%Transaction cost (TC): 0.56%Total investment charge (TIC): 2.11% Fees rates are shown excluding VAT. TER, TC and TIC are shown including VAT. Other informationValuation and transaction cut-off: 16.00 SA Time (forward pricing) Minimum investment: LISPs or R10,000,000 ISIN: ZAE000216115
Since inception performance, R10,000 initial investment
04-16 08-16 12-16 04-17 08-179
10
11
12 Fund R10,052 Benchmark R11,245 Sector R10,610
R'0
00
12-17
Source: © Morningstar, dates to 31.12.17, performance figures above are based on lump sum investment, NAV-NAV, net of fees, gross income reinvested, in ZAR.
SA UNIT TRUST | FACTSHEET
Asset allocation (%)
Local Assets 37.4
Equities 44.8Bonds 10.7Property (listed) 4.7Commodities 4.6Cash / Money Market 1.9FX -29.3
Foreign Assets 62.6FX 26.5Equities 25.8Cash / Money Market 9.9Property (listed) 0.4
InvestecWorldwide Flexible Fund
The value of participatory interests (units) may go down as well as up and past performance is not necessarily a guide to the future.Investec Fund Managers SA (RF) (Pty) Limited does not provide any guarantee either with respect to the capital or the return of a portfolio.
Investec Worldwide Flexible Fund
SA UNIT TRUST | FACTSHEET
Specific Fund RisksCurrency exchange: Changes in the relative values of different currencies may adversely affect the value of investments and any related income.Derivatives: The use of derivatives is not intended to increase the overall level of risk. However, the use of derivatives may still lead to large changes in value and includes the potential for large financial loss.Developing market: These markets carry a higher risk of financial loss than more developed markets as they may have less developed legal, political, economic or other systems.Interest rate: The value of fixed income investments (e.g. bonds) tends to decrease when interest rates and/or inflation rises.
Glossary SummaryAnnualised performance: Annualised performance is the average return per year over the period.Duration: This is a measure of risk for funds which invest in bonds as it predicts the sensitivity of the value of a fund’s portfolio given changes in interest rates. The higher the value the greater the volatility of the fund’s performance resulting from changes to interest rates. The Modified duration is shown.Maximum drawdown: The largest peak to trough decline during a specific period of an investment.NAV: The Net Asset Value (NAV) represents the value of the assets of a fund less its liabilities.Risk profile: A number on a scale of 1 to 7 based on how much the value of a fund has fluctuated over the past 5 years (or an estimate if the fund has a shorter track record). A rating of 1 represents the lower end of the risk scale with potentially lower rewards available whilst a rating of 7 reflects higher risk but potentially higher rewards.Total Expense Ratio: TER includes the annual management fee, performance fee and administrative costs and includes VAT but excludes portfolio transaction costs (except in the case of an entry or exit charge paid by a fund when buying or selling units in another fund) expressed as a percentage of the average daily value of the Fund calculated over a rolling three year period (or since inception where applicable) and annualised to the most recently completed quarter. Where funds invest in the participatory interests of foreign collective investment schemes, these may levy additional charges which are included in the relevant TER. A higher TER does not necessarily imply a poor return, nor does a low TER imply a good return. The current TER may not necessarily be an accurate indication of future TERs.Transaction cost: Transaction costs are a necessary cost in administering the Fund and impacts returns. It should not be considered in isolation as returns may be impacted by many other factors over time including market returns, the type of financial product, the investment decisions of the investment manager and the TER.Calculations are based on actual data where possible and best estimates where actual data is not available. Transaction costs are inclusive of VAT.Total investment charge: This is the sum of the TER and TC.Volatility: The amount by which the performance of a fund fluctuates over a given period.
Important informationAll information provided is product related and is not intended to address the circumstances of any particular individual or entity. We are not acting and do not purport to act in any way as an advisor or in a fiduciary capacity. No one should act upon such information without appropriate professional advice after a thorough examination of a particular situation. Collective investment scheme funds (CISs) are generally medium to long term investments. Funds are traded at ruling prices and can engage in borrowing, up to 10% of fund net asset value to bridge insufficient liquidity, and scrip lending. Unit trust prices are calculated on a net asset value basis, which is the total value of all assets in the fund including any income accruals less permissible deductions from the fund. A schedule of charges, fees and advisor fees is available on request from the Manager, Investec Fund Managers SA (RF) (Pty) Ltd (IFMSA) which is registered under the Collective Investment Schemes Control Act. Additional advisor fees may be paid and if so, are subject to the relevant FAIS disclosure requirements. Performance shown is that of the fund and individual investor performance may differ as a result of initial fees, actual investment date, date of any subsequent reinvestment and any dividend withholding tax. This fund may be closed in order to be managed in accordance with the mandate. Fluctuations or movements in exchange rates may cause the value of underlying international investments to go up or down. Where the fund invests in the participatory interests of foreign collective investment schemes, these may levy additional charges which are included in the relevant TER. Fund prices are published each business day at www.investecassetmanagement.com and in select media publications . The Manager outsources its portfolio management to Investec Asset Management (Pty) Ltd ('Investec'), a member of the Association for Savings and Investment SA (ASISA). This minimum disclosure document is the copyright of Investec and its contents may not be re-used without Investec's prior permission. Issued 11.01.2018
To find out about this Fund and other Investec Funds, visit www.investecassetmanagement.com/saliterature
Scheme Trustee: FirstRand Bank Limited PO Box 7713 Johannesburg 2000 Telephone: (011) 282 1808
Contact us Investec Fund Managers SA (RF) (PTY) LimitedTelephone: 0860 500 900*: [email protected]
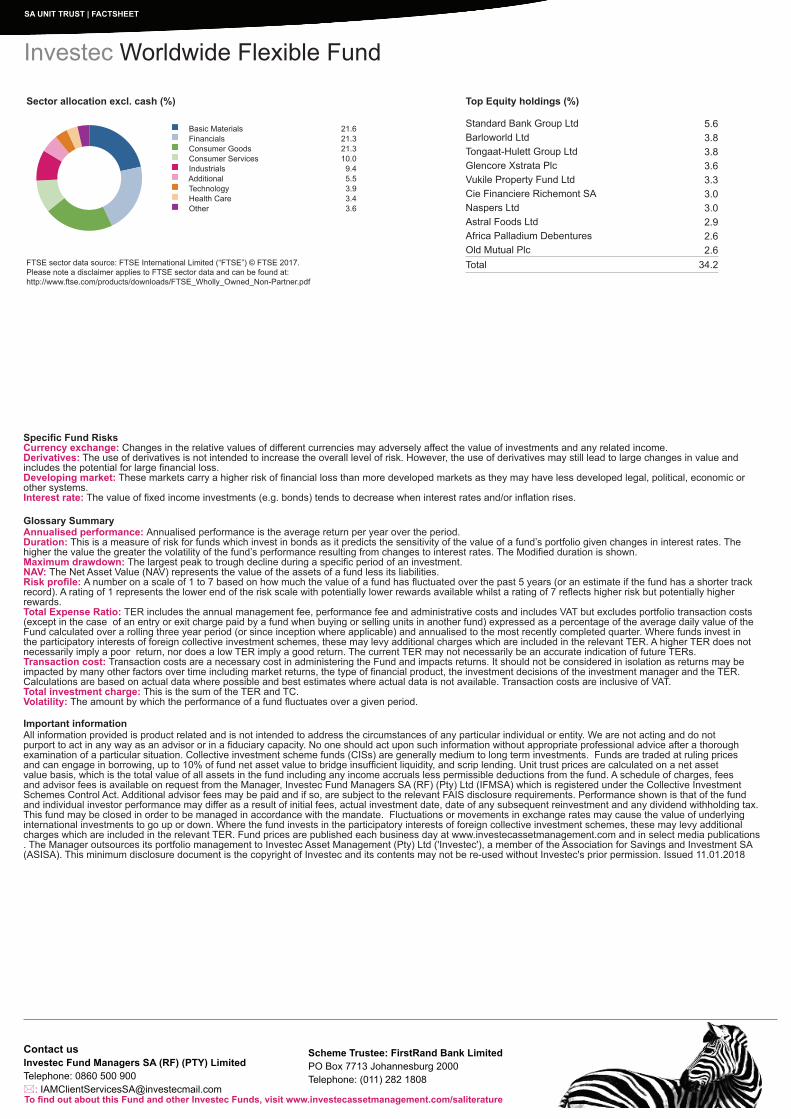
Sector allocation excl. cash (%)
Basic Materials Financials Consumer Goods Consumer Services Industrials Additional Technology Health Care Other
21.621.321.310.09.45.53.93.43.6
FTSE sector data source: FTSE International Limited (“FTSE”) © FTSE 2017. Please note a disclaimer applies to FTSE sector data and can be found at: http://www.ftse.com/products/downloads/FTSE_Wholly_Owned_Non-Partner.pdf
Top Equity holdings (%)
Standard Bank Group Ltd 5.6Barloworld Ltd 3.8Tongaat-Hulett Group Ltd 3.8Glencore Xstrata Plc 3.6Vukile Property Fund Ltd 3.3Cie Financiere Richemont SA 3.0Naspers Ltd 3.0Astral Foods Ltd 2.9Africa Palladium Debentures 2.6Old Mutual Plc 2.6Total 34.2

PORTFOLIO PERFORMANCE (PERIODS GREATER THAN ONE YEAR ARE ANNUALISED 1)
0%
10%
20%
30%
40%
50%
60%
70%
80%
90%
100%
Apr 08 Oct 09 Apr 11 Oct 12 Apr 14 Oct 15 Apr 17
Foreign equities Commodities SA equities
Listed property Corporate bonds Money market
Government bonds
R 322
R 255
Mar 08 Mar 10 Mar 12 Mar 14 Mar 16
Foord Foord Regulation 28
JANUARY 2018
Foord Flexible Fund of Funds
ZA
ASSET ALLOCATION
1 Converted to reflect the average yearly return for each period presented 2 Current value of R100 000 notional lump sum invested at inception, distributions reinvested (graphically represented in R’000s above) 3 Class R, net of fees and expenses 4 Source: Stats SA, performance as calculated by Foord 5 Source: IRESS MD RSA 6 Highest and lowest actual 12 month return achieved in the period
INVESTOR PROFILE Investors with a moderate risk profile who require long-term inflation beating total returns from a dynamically managed multi-asset class portfolio. It is appropriate for investors seeking a balanced exposure to domestic and foreign assets, according to Foord’s best investment view. Available as a tax free investment account.
DOMICILE South Africa
FUND MANAGER Dave Foord
MANAGEMENT COMPANY Foord Unit Trusts (RF) (Pty) Ltd VAT Registration Number: 4560201594
INCEPTION DATE 1 April 2008
BASE CURRENCY South African rands
CATEGORY Worldwide - Multi-Asset - Flexible
MINIMUM LUMP SUM / MONTHLY R50 000 / R1 000
PORTFOLIO SIZE R10.9 billion
UNIT PRICE (CLASS R) 2824.69 cents
LAST DISTRIBUTIONS 31/08/17 : 31.53 cents per unit 28/02/17 : 13.92 cents per unit
BENCHMARK CPI + 5% per annum, which is applied daily using the most recently available inflation data and accordingly will be lagged on average by 5 to 6 weeks.
SIGNIFICANT RESTRICTIONS None. The fund is unconstrained.
INCOME DISTRIBUTIONS End-February and end-August each year.
INCOME CHARACTERISTICS Low to medium income yield depending on the asset allocation strategy employed as the foreign asset component is invested in roll-up funds which do not distribute their income. Income distributions are reduced by the annual ser-vice charge, which varies with the relative performance of the fund against its benchmark.
PORTFOLIO ORIENTATION Exploiting the benefits of global diversification, the portfolio continually reflects Foord’s prevailing best investment view on all available asset classes in South Africa and around the world.
FOREIGN ASSETS Foreign asset exposure is obtained predominantly via Foord International Fund (a conservative, multi-asset class fund) and Foord Global Equity Fund Luxembourg (a portfolio of global shares and cash). Both funds are sub-funds of Foord SICAV domiciled in Luxembourg, and are priced in US dollars.
TIME HORIZON Longer than three years.
RISK OF LOSS Lower than that of a pure equity fund. High in periods shorter than six months, lower in periods greater than one year.
INVESTMENT OBJECTIVE The fund aims to provide investors with a net-of-fee return of 5% per annum above the annual change in the South African Consumer Price Index, measured over rolling three year periods. Exploiting the benefits of global diversification, the portfolio continually reflects Foord’s prevailing best investment view on all available asset classes in South Africa and around the world.
TOP 10 INVESTMENTS CHANGES IN PORTFOLIO COMPOSITION
PORTFOLIO PERFORMANCE VS BENCHMARK INVESTMENT STRATEGY VS REG 28 PORTFOLIOS
NUMBER OF UNITS (CLASS R) 130.6 million
CASH SINCE LAST 7 LAST 5 LAST 3 LAST 12 THIS
VALUE 2 INCEPTION YEARS YEARS YEARS MONTHS MONTH
FOORD 3 R 322 116 12.6% 14.7% 11.5% 7.5% 6.3% 1.6%
BENCHMARK 4 R 282 565 11.1% 10.8% 10.6% 10.7% 9.8% 0.6%
FTSE/JSE All Share 5 R 267 990 10.5% 12.9% 11.2% 8.2% 16.1% 0.1%
FOORD HIGHEST 3,6 38.8% 38.8% 27.6% 16.1% 6.3%
FOORD LOWEST 3,6 -12.0% -4.4% -4.4% -4.4% 6.3%
EQUITY INDICATOR Indicates the relative weight of equities in the portfolio. A higher weight could result in increased volatility of returns.
R 100
Cas
h V
alu
e2
(R’0
00s
)
R 100
Cas
h V
alu
e2
(R’0
00s
)
Unconstrained investment mandates provide Foord with more investment tools to achieve long-term inflation beating returns and to better manage the risk of loss compared to prudentially compliant (Regulation 28) portfolios. Accordingly, unconstrained mandates are ideal for discretionary savings that are not required to be invested in terms of Regulation 28 limits. The Investment Strategy vs Regulation 28 Portfolios chart compares the investment returns of the unconstrained Foord Flexible Fund of Funds to Regulation 28 mandates managed by Foord (the Foord Balanced Fund returns are net of fees and therefore have been used for direct comparative purposes). The chart shows that the Foord Flexible Fund has outperformed the Foord Balanced Fund by approximately 3% per annum since its inception, illustrating the long-term opportunity cost of investing discretionary savings in a Regulation 28 portfolio.
DOMESTIC % FOREIGN % TOTAL%
Equities 17.1 62.5 79.6
Listed property 2.3 1.2 3.5
Corporate bonds 0.0 0.0 0.0
Government bonds 7.5 0.0 7.5
Commodities 1.4 1.3 2.7
Money market 0.3 6.4 6.7
TOTAL 28.6 71.4 100.0
SECURITY ASSET MARKET % OF CLASS FUND
RSA 10.5% (R186) Gov bonds ZAF 7.5
CVS Health Corp Equity USA 3.8
FMC Corp Equity USA 3.4
PICC Property & Casualty Equity HKG 3.1
CF Richemont Equity ZAF 2.6
Baidu Inc Equity USA 2.6
Wynn Macau Equity HKG 2.6
Roche Holding Equity CHE 2.5
Alphabet Inc Equity USA 2.4
BHP Billiton Equity ZAF 2.4
R 322
R 283
Mar 08 Mar 10 Mar 12 Mar 14 Mar 16
Foord Benchmark

IMPORTANT INFORMATION FOR INVESTORS Foord Unit Trusts (RF) (Pty) Ltd (Foord Unit Trusts) is an approved CISCA Management Company (#10), regulated by the Financial Services Board. Portfolios are managed by Foord Asset Management (Pty) Ltd (Foord), an authorised Financial Services Provider (FSP: 578). The custodian/trustee of Foord Unit Trusts is RMB Custody and Trustee Services (a division of FirstRand Bank Limited), contactable on T: 087 736 1732, F: 0860 557 774, www.rmb.co.za.
Collective Investment Schemes in Securities (unit trusts) are generally medium- to long-term investments. The value of participatory interests (units) may go down as well as up and past performance is not necessarily a guide to the future. Performance is calculated for the portfolio. Individual investor performance may differ as a result of the actual investment date, the date of reinvestment and withholding taxes. Performance may be affected by changes in the market or economic conditions and legal, regulatory and tax requirements. Foord Unit Trusts does not provide any guarantee either with respect to the capital or the performance return of the investment. Unit trusts are traded at ruling prices and can engage in borrowing. Foord Unit Trusts does not engage in scrip lending. Commission and incentives may be paid and if so, this cost is not borne by the investor. A schedule of fees and charges and maximum commissions is available on request. Distributions may be subject to mandatory withholding taxes. A fund of funds invests only in other Collective Investment Scheme portfolios, which may levy their own charges, which could result in a higher fee structure. A feeder fund is a portfolio that, apart from assets in liquid form, consists solely of units in a single portfolio of a Collective Investment Scheme which could result in a higher fee structure. Foord Unit Trusts is authorised to close the portfolio to new investors in order to manage the portfolio more efficiently in accordance with its mandate.
This document is not an advertisement, but is provided exclusively for information purposes and should not be regarded as an offer or solicitation to purchase, sell or otherwise deal with any particular investment. Economic forecasts and predictions are based on Foord’s interpretation of current factual information and exploration of economic activity based on expectation for future growth under normal economic conditions, not dissimilar to previous cycles. Forecasts and commentaries are provided for information purposes only and are not guaranteed to occur. While we have taken and will continue to take care that the information contained herein is true and correct, we request that you report any errors to Foord at [email protected]. The document is protected by copyright and may not be altered without prior written consent.
UNIT PRICE Unit trust prices are calculated on a net asset value basis, which is the total value of all assets in the portfolio including any income accruals and less any permissible deductions from the portfolio. Forward pricing is used. Prices are determined at 15h00 each business day and are published daily on www.foord.co.za and in national newspapers. The cut-off time for instruction is 14h00 each business day.
TER A Total Expense Ratio (TER) is a measure of a portfolio’s annual expenses, fees and charges, expressed as a percentage of the average daily value of the portfolio. These expenses include the annual fee, VAT, audit fees, bank charges and costs, including trading costs, incurred in any underlying funds. Included in the TER, but separately disclosed, is a performance fee (or credit) resulting from overperformance (or underperformance) against the benchmark. A higher TER ratio does not necessarily imply a poor return, nor does a low TER imply a good return. The current TER cannot be regarded as an indication of future TERs. Performance return information and prices are always stated net of the expenses, fees and charges included in the TER. The TER for the fund’s financial year ended 28 February 2017 was 1.22%.
FOREIGN INVESTMENT RISK The portfolio may include underlying foreign investments. Fluctuations or movements in exchange rates may cause the value of underlying foreign investments to go up or down. The underlying foreign investments may be adversely affected by political instability as well as exchange controls, changes in taxation, foreign investment policies, restrictions on repatriation of investments and other restrictions and controls that may be imposed by the relevant authorities in the relevant countries.
Foord is a member of the Association for Savings and Investment SA.
This is a Minimum Disclosure Document. Published on 5 February 2018. Additional detailed analysis is published in the Quarterly Portfolio Report available on www.foord.co.za
PLEASE CONTACT US FOR MORE INFORMATION REGARDING INVESTMENT TRACK RECORD, FOORD TEAM, CURRENT AND ARCHIVED NEWS ITEMS, INVESTOR TESTIMONIALS, FORMS AND DOCUMENTS. THIS INFORMATION IS PROVIDED FREE OF CHARGE.
E: [email protected] T: +27 (0)21 532 6969 F: +27 (0)21 532 6970 www.foord.co.za
FEE RATES (CLASS R)
Initial, exit and switching fees
0.0%
Standard annual fee for equalling benchmark
1.0% plus VAT
Performance fee sharing rate
10% (over- and under-performance)
Minimum annual fee 0.5% plus VAT
Maximum annual fee Uncapped
Foreign assets The fee accrued in the Foord global funds is rebated in full
FEE STRUCTURE
The annual fee is based on portfolio performance fee with the daily charge rate being adjusted up or down based on the portfolio’s return relative to that of its benchmark and is subject to a minimum fee rate. The performance fee is calculated and accrued daily based on the relative return for the preceding day.
PERFORMANCE FEES
Performance fees align investor and manager return objectives by rewarding the manager for outperformance while penalising the manager for underperformance. Foord’s performance fee structure increases or decreases the fee levied based on the over- or underperformance of the Foord unit trust portfolios relative to their benchmarks. When the portfolio return exceeds the benchmark return, the daily performance fee rate is increased proportionately. Similarly, underperformance causes the daily performance fee rate to decrease proportionately. Performance fee rates are not capped for the reason that outperformance is generally not earned smoothly.
The annual fee is adjusted up or down daily by the performance fee calculated by multiplying the performance fee sharing rate by the relative return of the preceding day.
PERFORMANCE FEE EXAMPLES FOR FOORD FLEXIBLE FUND OF FUNDS (CLASS R)
JANUARY 2018
Foord Flexible Fund of Funds
COMMENTARY Global equities (+5.6% in US dollars) rose again with emerging markets (+8.3%) leading the way and developed markets (+5.3%) not far behind – global synchronised growth and
significant US tax reform will support corporate earnings in the year ahead The FTSE/JSE All Share Index (0.0%) was unchanged despite the resources sector (+3.6%) gaining on US dollar weakness and higher commodity prices – financials (-3.0%)
retraced, weighed down by a Capitec (-27.1%) share price plunge after Viceroy Research published a report supporting its short position in the counter The new ANC leadership made important incremental gains with a new Eskom board particularly noteworthy – but the timing of a change of government’s executive is uncertain Developed market bond yields rose sharply on rising interest rate and inflation expectations – the SA All Bond Index (+1.9%) gained as yields fell further, despite the threat of
additional local currency sovereign ratings downgrades and bond sales Domestically focused industrials outperformed on improved sentiment and offshore buying – portfolio holdings Bidvest (+14.6%) and Mr Price (+16.8%) contributed positively to
portfolio returns South African-listed global companies fared less well on rand strength – British American Tobacco (-1.9%) and Aspen (-2.5%) detracted but the valuations of these companies
remain attractive Listed property counters (-9.9%) fell – on valuation concerns of the larger counters in the sector The rand (+4.9% vs the US dollar) gained on positive political sentiment and US dollar weakness – but material financial risks persist at SOEs despite nascent corporate
governance improvements The managers have retained the portfolio’s bond position despite the bond rally – the benign inflation outlook and strong rand should induce the SARB to reduce interest rates
in the coming months
SCENARIO A B C D E
Foord return for preceding day 0.25% 0.02% 0.03% -0.25% -0.25% Benchmark return for preceding day 0.03% 0.03% 0.03% 0.03% 0.03% Relative performance for preceding day 0.22% -0.01% 0.00% -0.28% -0.28% Compounded 365-day effective annual fee >0.50% >0.50% >0.50% >0.50% <0.50% * Performance fee sharing rate 10.00% 10.00% 10.00% 10.00% 10.00% Daily performance fee rate 0.02% 0.00% 0.00% -0.03% -0.03% Effective annualised fee rate applied 9.44% 0.63% 1.00% -8.81% 0.50%
* When the compounded 365-day effective annual fee decreases below 0.5%, a minimum annual fee of 0.5% is levied.
ANNUALISED COST RATIO (CLASS R)
12 MONTHS 36 MONTHS
TER —Basic 1.15% 1.15%
—Performance -0.63% 0.07%
Transaction costs 0.00% 0.00%
Total cost ratio 0.52% 1.22%