tax expenditures for noncash charitable contributions
TRANSCRIPT

National Tax Journal, June 2011, 64 (2, Part 2), 651–688
TAX EXPENDITURES FOR NONCASH CHARITABLE CONTRIBUTIONS
Deena Ackerman and Gerald Auten
This paper examines the itemized deduction for donations of property to charitable organizations, its benefi ts to charitable organizations and their benefi ciaries, and the associated tax expenditures. In 2005, taxpayers deducted $48 billion in noncash donations, resulting in a tax expenditure of $9 billion. High-income taxpayers primarily donated stock and other appreciated property, thereby also avoiding the capital gains tax liability due on appreciation of the assets had they been sold, while middle-income taxpayers primarily donated used clothing and household items. We focus on donations of vehicles using tax and online vehicle auction data. Taxpayer valuations are compared with auction prices of vehicles of the same make, model, and year. The results imply that either taxpayers are overstating the likely value of their vehicle or donating vehicles of higher average quality than those sold in online auctions. Donations of vehicles and vehicle valuations declined substantially after tax reforms were enacted in 2004.
Keywords: tax expenditures, charitable contributions, personal income taxes
JEL Codes: H20, H24
I. INTRODUCTION
Each year, individuals donate a wide variety of goods to charity, ranging from the mundane, such as used clothing and household items, to unique or valuable objects
such as museum quality art, real estate, and corporate stock. In 2005, over 25 million itemizing taxpayers reported $48 billion in deductions for noncash contributions, accounting for about one-fourth of all charitable deductions. While the recipient charities and their benefi ciaries receive substantial benefi ts from these donations, the associated loss in tax revenues or tax expenditure is also substantial: over $9 billion for 2005. The donation of such diverse types of property and the magnitude of the tax expenditure
Deena Ackerman: Offi ce of Tax Analysis, U.S. Department of the Treasury, Washington, DC, USA ([email protected])Gerald Auten: Offi ce of Tax Analysis, U.S. Department of the Treasury, Washington, DC, USA ([email protected])

National Tax Journal652
raise many issues with respect to the valuation of donated property, the enforcement of tax rules, and the effects of the deduction on charities.
Public fi nance experts offer two primary rationales for allowing a deduction for charitable donations of cash and property. The fi rst focuses on incentives: the charitable deduction provides an incentive to increase giving by lowering the price of a charitable gift relative to other consumption (Feldstein, 1980; Auten, Sieg, and Clotfelter, 2002). The deduction increases economic effi ciency to the extent that charities increase the supply of public goods (such as changing the distribution of income by providing benefi ts to low-income households) or services with positive externalities (such as education or the arts), assuming that these goods and services are under-provided in the absence of the deduction. Since the tax subsidy increases with marginal tax rates, some economists have suggested replacing the current deduction with a tax credit, thereby equalizing the tax incentive for charitable giving for all taxpayers. A tax deduc-tion may still be preferred for other reasons, such as greater responsiveness to the tax incentive by high-income taxpayers subject to higher marginal tax rates.1 The second rationale focuses on the appropriate measurement of income subject to tax: donations transfer resources from the donor to a charity for a purpose such as aiding the needy. In terms of the Haig-Simons standard and ignoring any “warm glow” or other intangible benefi ts from the donation, the ultimate consumption is done by and benefi ts someone other than the donor. Since the donor’s net worth has decreased as a result of the gift, a taxpayer’s ability to pay is reduced and it is therefore appropriate to deduct the value of the donation when calculating taxable income.2
Although the deduction for noncash charitable contributions is one of the larger tax expenditures, the existing literature examining the deduction is relatively limited. This paper expands this literature in three ways. First, the paper presents new data on the types of property that are deducted as charitable donations on individual income tax returns and new estimates of the associated tax expenditure. 3 Second, using new data
1 Many studies, including O’Neil, Steinberg, and Thompson (1996), have found high-income taxpayers to be more responsive to the tax incentive for charitable contributions than lower income taxpayers (but see Bakija and Heim, 2011). In addition, some proponents argue that the charitable donations of high-income taxpayers to education, health, and the arts may involve larger positive externalities than the donations of lower-income taxpayers. See Ackerman and Auten (2006) for a discussion.
2 Andrews (1972), for example, argued that the charitable deductions is appropriate under an ideal income tax since the consumption benefi ts, other than the satisfaction of making the gift, accrue largely to others. In the case of donations for the benefi t of the needy, Andrews argued that “the consumption…has been shifted to the recipients rather than the donor and should not be subjected to taxation at rates designed to apply to the donor’s standard of living and saving” (Andrews, 1972, p. 347). In the case of philanthropy more broadly defi ned, he argued that “the goods and services produced do have something of the character of common goods,” while the Haig-Simons defi nition is aimed at the private consumption of divisible goods and services (Andrews, 1972, p. 346). Note that this analysis ignores donor “club goods” benefi ts that result from donating to a charity in which the donor participates, such as a symphony concert series or a religious organization.
3 While corporations also make noncash charitable donations, the analysis presented here focuses on con-tributions reported on individual income tax returns.

Tax Expenditures for Noncash Charitable Contributions 653
on internet auction sales of used cars, the paper examines the deductions claimed for donating used vehicles and the effects of new legislation that tightened the rules. Finally, the paper examines policy issues related to the effi ciency and effectiveness of the tax expenditure for noncash donations and options for reform.
II. CURRENT LAW TREATMENT OF NONCASH DONATIONS
Since 1917, individual taxpayers have been allowed a deduction for contributions of cash or property to eligible organizations. Under current law, only those taxpayers who itemize may claim a deduction for charitable contributions, although the standard deduction is sometimes viewed as including an implicit allowance for some nominal amount of charitable contributions.4
Two long-standing principles of the charitable deduction are that taxpayers are allowed to deduct the fair market value of property donated to a qualifi ed charity and that the tax code should not favor some types of charities over others — the tax system should remain neutral and allow individuals to choose which charities to support. Over time and generally in response to perceived abuses, Congress has legislated many exceptions to these general principles. Congress has limited the charitable deduction to the lesser of the fair market value or the taxpayer’s basis (generally cost less any depreciation) for certain types of property donations. These include, (1) inventory property; (2) tangible personal property not used in a manner related to the charity’s exempt purpose; (3) patents and certain other intellectual property; (4) property (other than publicly-traded stock) donated to certain private foundations; and (5) certain taxidermy property (e.g., stuffed antelope heads).
In some cases, the amount of the allowed deduction depends on how the charity uses the property. For example, donors are allowed to deduct the fair market value of a painting that is donated to a museum that will display it, but may only deduct the basis if the painting is donated to a charity that sells it at a fundraising auction. Since the limitation to the lesser of market value or basis eliminates any special incentive for donating inventory, donations of certain types of inventory property, such as food and drug donations for the needy and computers for schools, qualify for an enhanced deduction that is greater than the taxpayer’s basis. In general, these enhanced deductions are limited to the lesser of one half the excess of fair market value over basis or twice basis in order to prevent the taxpayer from making an after-tax profi t on donated items.5
4 A charitable deduction for non-itemizers was temporarily available in 1982–1986, but expired at the end of 1986. Ackerman and Auten (2006) discuss recent proposals to expand the charitable deduction to non-itemizers.
5 This is sometimes called the “baking cookies problem.” Suppose a taxpayer could bake cookies with low-cost ingredients and claim a fair market value charitable deduction based on prices charged in premium cookie stores. With a suffi cient markup, the taxpayer could make an after-tax profi t by giving away cook-ies or other products whose value to the charity may be much less than the deduction. This is generally prevented by the rules limiting the enhanced deduction to twice basis.

National Tax Journal654
Individuals’ charitable deductions in a given year are also limited by a set of income-based ceilings. The total deduction for charitable contributions is generally limited to 50 percent of the taxpayer’s adjusted gross income (AGI). The deduction for con-tributions of appreciated property is generally limited to 30 percent of AGI, thereby limiting an individual’s ability to claim a deduction for the full value of appreciated property on which no capital gains tax has been paid. Deductions of contributions to certain private foundations, where the donor may retain control over the disbursement of the donated assets, are also limited to 30 percent of AGI (20 percent for donations of appreciated property). Contributions exceeding these limits in a given year may be carried forward for up to fi ve years. Deductions for charitable contributions are also subject to the “Pease” limitation on itemized deductions, under which itemized deduc-tions for high-income taxpayers are reduced by three cents for each dollar of income above a threshold. While this provision was phased out in 2006–2012, it is scheduled to return in 2013, although an Administration Budget proposal would limit this return to households with incomes over $250,000.
Additional rules govern how taxpayers document and value their charitable contribu-tions, generally becoming more stringent as the value of the donation increases. For small donations of property under $250 each, taxpayers must either obtain a receipt from the charity or keep some form of reliable records. Ironically, the rules for cash donations are currently stricter than those for property donations for which the taxpayer’s claimed value may be more open to question. Beginning in 2007, a cash donation of any amount must be supported by a either a bank record or a written communication from the charity. For property or cash donations of $250 or more, taxpayers must obtain a contemporaneous receipt from the charitable organization, but need not attach it to the return. Donors of noncash gifts totaling more than $500 are required to fi le Form 8283 which requires additional detailed information about the donated property, including the type of property, the donee, and the method used to value the property. A qualifi ed appraisal is generally required for donations of property valued at $5,000 or more (except for publicly-traded securities for which values are publicly known). The appraisal must be attached to the return if the value of the donated property exceeds certain limits. Ultimately, individual taxpayers (and, to a lesser extent, the appraisers they may hire), and not the donees, are generally responsible for establishing the value of donations — even for donations for which a receipt is required.6
In recent years, Congress has tightened the rules for donations of vehicles and used clothing. Prior to 2005, vehicle donations were subject to the same rules as donations of most other used property. Internal Revenue Service (IRS) form instructions made no mention of vehicle donations, but a publication on charitable deductions suggested that taxpayers could use used car pricing guides “as a starting point.” An example subtracted the cost of needed repairs in determining value, but was not explicit about which market
6 Charities are required to provide a statement declaring the value of the charitable gift portion of a donation over $75 when the value of the contribution is split between a deductible and nondeductible portion. For example, a donor might receive a tote bag, CD, or dinner at a gala as a result of their contribution.
Tax Expenditures for Noncash Charitable Contributions 655
price was appropriate (retail, private party sale, wholesale, or trade-in value).7 Thus, taxpayers had considerable discretion in assigning a value to their donated vehicle and, as discussed in a later section, the amounts claimed by taxpayers often greatly exceeded the ultimate benefi t to the charity. In response to perceived abuses and the large gap between the permitted deduction and the proceeds received by the charity, Congress tightened the rules governing vehicle donations in the American Jobs Creation Act (AJCA) of 2004. Starting in 2005, when the charity does not use a donated vehicle directly for a charitable purpose, the deduction is limited to the lesser of the gross proceeds from the sale of the vehicle by the charity or $500. In some cases, this amount may be less than the fair market value in the hands of the donor. If the charity intends to use the vehicle for an exempt charitable purpose, such as giving it to a low-income household or using it to deliver meals to the elderly, the taxpayer may claim a full fair market value deduction with an appraisal required only if the deduction claimed is more than $5,000. New reporting rules require the charity to provide the donor and IRS with information about the use of the donated vehicle: either the sales proceeds or certifi cation that the vehicle would be used for an exempt purpose. Revised IRS instructions on assigning fair market value refer to the private party price in standard used car pricing guides, which is lower than the retail price. Because of the perceived abuses associated with vehicle donations, the new policy broke the long-standing principle that fair market value of property is determined in the hands of the donor without regard to the value of the property to the charity. Similarly, because of concerns about deductions being claimed for the donation of “worthless” patents, another AJCA provision limited the deduction for patent donations to a declining percentage of the revenues received by the charity. For clothing donated after August 17, 2006, taxpayers are only allowed a deduction for used clothing in “good” condition or better, and appraisals are required on items valued at more than $500.
III. WHAT DO PEOPLE ACTUALLY DEDUCT?
Table 1 shows deductions for total and noncash charitable contributions for tax years 2004 and 2005. Both total and noncash charitable deductions increased by 10.8 percent in 2005 over 2004. In 2005, 41.4 million tax returns (31 percent of the 134.4 million returns fi led and 87 percent of the 47.8 million returns with itemized deduc-tions) reported charitable contributions. About 61 percent of those with charitable deductions claimed deductions for a noncash donation. Overall, taxpayers claimed total deductions for noncash contributions of $48 billion, accounting for 26 percent of total charitable deductions. Noncash charitable deductions are claimed by taxpayers in all income classes, generally accounting for 18 to 20 percent of total deductions in most income groups except for approximately the top 5 percent of taxpayers and those with
7 The main used car pricing guides are Kelly Blue Book, NADA Guides, and Edmunds, which are not mentioned by name in IRS instructions. These guides do not provide pricing information for vehicles in poor condition. Instructions before and after the law change were provided in IRS (2004) and IRS (2008).

National Tax Journal656
T abl
e 1
Char
itabl
e Co
ntrib
utio
ns a
nd T
ax E
xpen
ditu
res,
2004
and
200
5In
com
e Q
uint
ile/
Perc
entil
e
Ret
urns
(Tho
usan
ds)
Am
ount
s ($M
illio
ns)
Non
cash
Per
cent
age
Tota
l C
ontri
butio
nsN
onca
sh
Con
tribu
tions
Tota
l C
ontri
butio
nsN
onca
sh
Con
tribu
tions
Tota
l Tax
Ex
pend
iture
Non
cash
Tax
Ex
pend
iture
Perc
enta
ge
of T
otal
By
Inco
me
Cla
ssPa
nel A
: 200
4Lo
wes
t76
540
71,
212
299
5913
24.6
0.7
Seco
nd2,
640
1,45
44,
425
989
292
6922
.42.
3M
iddl
e6,
431
3,64
513
,022
2,41
71,
353
291
18.6
5.6
Four
th11
,620
7,11
428
,538
5,08
24,
193
825
17.8
11.7
80–9
0%8,
711
5,70
525
,135
4,64
34,
822
937
18.5
10.7
90–9
5%5,
057
3,45
319
,531
3,76
34,
641
870
19.3
8.7
95–9
9%4,
285
2,84
725
,712
5,46
77,
454
1,40
021
.312
.6To
p 1%
1,07
562
547
,903
20,6
9113
,544
4,29
643
.247
.7To
tal
40,6
2325
,267
165,
564
43,3
7336
,371
8,70
526
.210
0.0
Inco
me
Cla
ss ($
1,00
0s)
Neg
ativ
e50
2327
975
398
27.0
0.2
0–25
2,29
21,
230
3,45
383
416
340
24.2
1.9
25–5
09,
510
5,41
319
,300
3,50
72,
075
432
18.2
8.1
50–7
59,
721
6,03
224
,494
4,41
73,
669
725
18.0
10.2
75–1
007,
222
4,67
820
,356
3,79
53,
768
743
18.6
8.7
100–
250
9,64
06,
561
40,8
708,
164
10,2
991,
943
20.0
18.8
250–
500
1,43
791
113
,155
2,88
84,
144
764
22.0
6.7
500–
1,00
046
727
38,
718
2,66
62,
631
543
30.6
6.1
$1,0
00 +
245
130
34,8
5217
,004
9,57
13,
501
48.8
39.2
Tota
l40
,623
25,2
6716
5,56
443
,373
36,3
718,
705
26.2
100.
0

Tax Expenditures for Noncash Charitable Contributions 657
Pane
l B: 2
005
Low
est
74
9
382
1,
197
26
2
61
1
021
.9
0.5
Seco
nd2,
717
1,4
13
4,52
7
917
29
2
61
20.3
1.
9M
iddl
e6,
456
3,6
08 1
2,95
5 2
,344
1,3
58
272
18.1
4.
9Fo
urth
11,9
77 7
,294
29,
904
5,3
08 4
,407
81
417
.8 1
1.0
80–9
0% 8
,903
5,7
99 2
6,82
0 4
,622
5,2
21
936
17.2
9.
690
–95%
5,1
32 3
,453
20,
491
3,9
02 4
,872
89
019
.0
8.1
95–9
9% 4
,321
2,7
93 2
7,73
5 5
,904
8,1
561,
442
21.3
12.
3To
p 1%
1,0
98
617
59,
674
24,7
6715
,861
4,92
041
.5 5
1.5
Tota
l41
,381
25,3
7118
3,39
148
,057
40,2
459,
351
26.2
100.
0In
com
e C
lass
(1,0
00s)
Neg
ativ
e
51
2
8
269
6
8
36
525
.2
0.1
0–25
2,1
63 1
,112
3,2
86
696
15
9
35
21.2
1.
425
–50
9,0
47 5
,047
18,0
22 3
,318
1,8
89
380
18.4
6.
950
–75
9,6
95 5
,915
24,3
66 4
,349
3,6
29
668
17.8
9.
075
–100
7,2
86 4
,718
21,0
69 3
,632
3,7
61
687
17.2
7.
610
0–25
010
,552
7,0
1344
,267
8,1
2111
,052
1,95
618
.3 1
6.9
250–
500
1,6
95 1
,048
15,4
79 3
,723
4,7
42
857
24.0
7.
750
0–1,
000
55
6
316
10,3
35 2
,320
3,0
28
531
22.4
4.
8$1
,000
+
307
16
146
,208
21,7
9911
,929
4,22
447
.2 4
5.4
Tota
l41
,381
25,3
7118
3,39
148
,057
40,2
459,
351
26.2
100.
0N
otes
: Cas
h in
com
e is
defi
ned
in th
e App
endi
x. D
epen
dent
fi le
rs a
re in
clud
ed in
tota
ls b
ut n
ot a
lloca
ted.
Sour
ce: I
RS
Stat
istic
s of I
ncom
e, In
divi
dual
Inco
me
Tax
File
s, 20
04 a
nd 2
005.
Tab
ulat
ions
by
the
auth
ors.

National Tax Journal658
negative incomes. Noncash contributions are even more important for high-income donors, accounting for 41–43 percent of total contributions by taxpayers in the top 1 percent of the income distribution during these years. The value of noncash contribu-tions is highly concentrated, with the top 1 percent of taxpayers accounting for about half of total noncash contributions (48–52 percent) and the top 10 percent accounting for more than two-thirds of noncash contributions.
The tax expenditure for the deduction for noncash charitable contributions was $8.7 billion in 2004 and $9.4 billion in 2005. In 2005, the noncash tax expenditure repre-sented 23 percent of the total tax expenditure of $40.2 billion for charitable deductions. Overall, the tax expenditure for noncash contributions equaled 19.5 percent of noncash contributions in 2005, and 19.9 percent of the noncash contributions of the top 1 percent of taxpayers. The fact that the effective tax rate on the top 1 percent of taxpayers is not much higher than the overall effective rate is likely the effect of the 3 percent “Pease phaseout” of itemized deductions for high-income taxpayers. This provision increases the tax effi ciency of the deduction for charitable contributions by effectively providing a 3 percent fl oor under itemized deductions for high-income taxpayers while generally preserving the marginal incentive for increasing contributions.
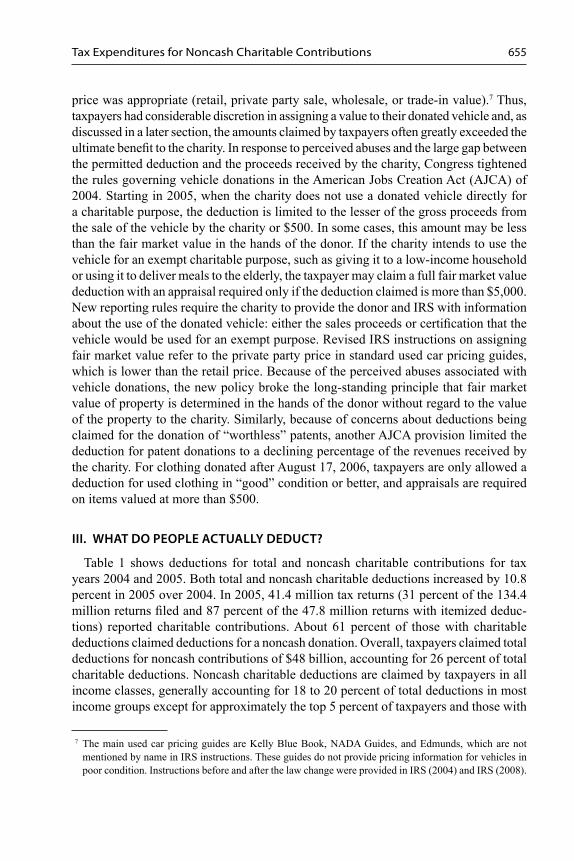
A different perspective on the amounts of deductions claimed for noncash donations is provided by Figure 1, which shows a frequency distribution of the amounts of noncash
0
1
2
3
4
5
6
7
8
9
Re
turn
s (M
illio
ns)
>1000
Source: Internal Revenue Service, Statistics of Income, 2005 Individual Income Tax File. Tabulationsby the authors. Value is upper limit for contribution amount. Rightmost bar includes returns withnoncash contributions over $1,000.
Figure 1Distribution of Returns by Amount of Noncash Contribution, 2005

Tax Expenditures for Noncash Charitable Contributions 659
charitable contributions reported for 2005 up to $1,000, with the last bar representing all noncash donations over $1,000. The most notable feature is the sharp spike at $500, the threshold beyond which taxpayers are required to report the type of property donated, the name of the recipient charity, the signature of an appraiser (if required), and other detailed information about the deductions being claimed on a separate form (IRS Form 8283). While this spike in donations is curious and may appear suspicious, there is no way to know the proportion of taxpayers who donated property worth more than $500 and rounded down compared to those that rounded up to the largest number that they could claim without making a detailed report.8 The sharp drop in the number of taxpay-ers donating between $550 and $1,000 may indicate that many taxpayers limited the deduction claimed to avoid fi ling the additional form.
The remaining analysis focuses on noncash donations reported by taxpayers on Form 8283 for taxpayers whose total noncash contributions exceed $500. While only one-fourth of the taxpayers rep orting noncash donations fi led this form, these taxpayers accounted for almost 85 percent of the value of these deductions and all of the larger donations.9
A. Types of Donated Property
As shown in Table 2, noncash charitable donations increased by 10.5 percent from $37.2 billion in 2003 to $41.1 billion in 2005. Stock and mutual funds accounted for about 40 percent (38.5 to 41.4 percent) of the total amount of noncash deductions. While real estate was the second largest category at 15.9 percent in 2003, its share dropped to about 10 percent in 2004 and 2005 as real estate donations declined by about one-third. Deductions for clothing donations grew signifi cantly over this period and exceeded real estate donations in 2004 and 2005 as about 700,000 additional taxpayers claimed such donations and average deductions also increased. In 2005, clothing donations accounted for 17.2 percent of noncash deductions and donations of household items, such as furniture and kitchenware, accounted for an additional 9.4 percent. In 2005, 72 percent of those with noncash donations reported donations of clothing and 44 percent reported donations of household items. Deductions for donations of vehicles, which were subject to much scrutiny and ultimately rule tightening, were much smaller, with deductions of $2.4 billion or 6.3 percent of the total in 2003, decreasing to only $0.6 billion and 1.5 percent of the total in 2005.
8 Buchheit, et al. (2005) were the fi rst to document the tendency for taxpayers to bunch deductions in the $400 to $500 range, and attributed this to the $500 threshold for fi ling Form 8283 which requires taxpayers to report detailed information about the donated property. They found that this bunching dates to 1985 when Form 8283 and the $500 threshold were introduced. Previously, taxpayers were required to attach a statement describing noncash donations of any amount. While the new form was intended to improve compliance by requiring additional reporting, Buchheit, et al. found that an unintended side effect was to encourage taxpay-ers to increase claimed noncash contributions to just below the fi ling threshold for the form.
9 In 2005, the $41.1 billion in noncash donations reported on Form 8283 represented 85 percent of the $48.1 billion in noncash deductions claimed on Schedule A. Some taxpayers report more than $500 in noncash contributions, but fail to attach the required Form 8283.

National Tax Journal660
B. Distribution of Noncash Donations by Income, Size of Deduction, and Type of Donee
Table 3 shows the distribution of donations of broader categories of property by income class. Not surprisingly, donations of stock account for a large percentage of the donations of the highest income households. For example, stock donations accounted for 63 percent of the noncash charitable donations of the top 1 percent of taxpayers and 71 percent of the noncash donations of taxpayers with incomes of $1 million and over. These results are consistent with higher income taxpayers having both the greater tax incentives to donate appreciated property and larger amounts of such property. While not shown in the table, the donations data provide some evidence that much of the stock donated by high-income taxpayers had signifi cant appreciation. For example, for stock donated by the top 1 percent of taxpayers, the total reported basis was only about 15 percent of market value.10
Table 2Noncash Charitable Deductions by Type of Property 2003–2005
Property Type
Number of Returns with Donations
(Thousands)
Deductions Claimed
Total ($Millions) Percent of Total
2003 2004 2005 2003 2004 2005 2003 2004 2005Stock 178 177 189 14,325 15,546 17,006 38.5 40.7 41.4 Other investments 5 5 5 1,079 1,037 1,577 2.9 2.7 3.8 Real estate 24 25 18 5,913 3,958 4,099 15.9 10.4 10.0 Easements 2 3 3 1,736 1,595 2,123 4.7 4.2 5.2 Art and collectibles 88 109 111 830 931 1,245 2.2 2.4 3.0 Food 167 195 197 79 105 106 0.2 0.3 0.3 Clothing 4,056 4,452 4,746 5,836 6,337 7,080 15.7 16.6 17.2 Electronics 473 551 518 376 476 475 1.0 1.2 1.2 Household items 2,384 2,628 2,870 3,231 3,464 3,858 8.7 9.1 9.4 Vehicles 803 918 310 2,334 2,628 610 6.3 6.9 1.5 Other 590 847 819 1,436 2,130 2,891 3.9 5.6 7.0 All property 5,960 6,565 6,559 37,177 38,206 41,071 100.0 100.0 100.0
Notes: The sum of the numbers in the rows exceeds the number in the total because some returns report more than one type of donation. Descriptions of the property types are provided in the Appendix.Source: Internal Revenue Service, Statistics of Income, Individual Income Tax Returns, Form 8283 Studies for 2003–2005. Tabulations by the authors.
10 This may understate the basis percentages because some taxpayers reported a zero basis. Although some taxpayers, such as executives who received “founders” stock, may have a zero basis, it is not possible to distinguish cases of unreported basis from those where the basis is zero. For stock donated by taxpayers with incomes of $1 million and over, the basis was 12 percent of the value. Wilson (2008) reports the cost basis data on stock.

Tax Expenditures for Noncash Charitable Contributions 661
Ta bl
e 3
Non
cash
Cha
ritab
le D
educ
tions
by
Type
of P
rope
rty
and
Inco
me,
200
4
Inco
me
Qui
ntile
/ Pe
rcen
tile
Am
ount
of D
educ
tions
($M
illio
ns)
Perc
ent o
f Tot
al N
onca
sh D
educ
tions
Stoc
kR
eal
Esta
te
Clo
thin
g an
d H
H
Item
sVe
hicl
esO
ther
Tota
lSt
ock
Rea
l Es
tate
Clo
thin
g an
d H
H
Item
sVe
hicl
esO
ther
Tota
lLo
wes
t
112
50
11
3
46
57
377
29.8
13.1
29.9
12.1
15.1
100.
0Se
cond
8
88
316
68
77
55
6 1
.415
.856
.812
.113
.810
0.0
Mid
dle
1
5
0
957
22
1 1
82 1
,376
1.1
0.0
69.6
16.0
13.3
100.
0Fo
urth
12
6
691,
933
56
0 3
82 3
,069
4.1
2.2
63.0
18.2
12.4
100.
080
–90%
6
5
252,
067
61
9 3
84 3
,160
2.1
0.8
65.4
19.6
12.2
100.
090
–95%
44
4 2
901,
617
52
3 4
29 3
,305
13.4
8.8
48.9
15.8
13.0
100.
095
–99%
1,1
97 6
562,
098
37
9 5
94 4
,924
24.3
13.3
42.6
7.7
12.1
100.
0To
p 1%
13,5
364,
362
69
9
212
2,56
921
,377
63.3
20.4
3.3
1.0
12.0
100.
0To
tal
15,5
465,
553
9,80
1 2
,628
4,67
838
,206
40.7
14.5
25.7
6.9
12.2
100.
0In
com
e C
lass
N
egat
ive
10
3
47
3
6
21
40
247
41.6
19.1
14.4
8.5
16.3
100.
00–
25k
1
0
90
27
9
61
49
489
2.0
18.5
57.1
12.4
10.0
100.
025
–50k
3
1
1
1,32
0 3
08 2
87 1
,947
1.6
0.1
67.8
15.8
14.7
100.
050
–75k
11
8
68
1,70
6 5
08 3
26 2
,725
4.3
2.5
62.6
18.6
11.9
100.
075
–100
k
35
2
51,
680
498
326
2,5
63 1
.4 1
.065
.519
.412
.710
0.0
100–
250k
1,0
45
767
3,47
7 9
02 8
22 7
,013
14.9
10.9
49.6
12.9
11.7
100.
025
0–50
0k
928
80
6
816
150
408
3,1
0829
.825
.926
.3 4
.813
.110
0.0
500–
1,00
0
973
80
3
274
70
540
2,6
6136
.630
.210
.3 2
.620
.310
0.0
$1,0
00+
12,2
612,
932
21
3 1
081,
877
17,3
9270
.516
.9 1
.2 0
.610
.810
0.0
Tota
l 15
,546
5,55
39,
801
2,62
84,
678
38,2
0640
.714
.525
.7 6
.912
.210
0.0
Not
es: I
ncom
e is
cas
h in
com
e as
defi
ned
in th
e A
ppen
dix.
The
Sto
ck c
ateg
ory
incl
udes
mut
ual f
unds
. Rea
l est
ate
in th
is ta
ble
incl
udes
con
serv
atio
n an
d fa
çade
eas
e-m
ents
. Clo
thin
g an
d H
H it
ems i
nclu
des c
loth
ing,
acc
esso
ries,
and
othe
r hou
seho
ld it
ems.
The
Oth
er c
ateg
ory
incl
udes
oth
er se
curit
ies,
art a
nd c
olle
ctib
les,
book
s and
ot
her i
ntel
lect
ual p
rope
rty, f
ood,
ele
ctro
nics
, and
oth
er p
rope
rty. A
dditi
onal
det
ails
are
pro
vide
d in
the A
ppen
dix.
Sour
ce: I
RS
Stat
istic
s of I
ncom
e, F
orm
828
3 St
udy,
200
4. T
abul
atio
ns b
y th
e au
thor
s.

National Tax Journal662
Tabl
e 4
Don
atio
ns b
y Ty
pe o
f Pro
pert
y an
d Si
ze o
f Ded
uctio
ns, 2
004
Num
bers
of R
etur
ns (T
hous
ands
)
Type
of P
rope
rty
Size
of D
educ
tion
Med
ian
Ded
uctio
n($
Mill
ions
)U
nder
$5
00$5
00–
1,00
0$1
,000
–5,
000
$5,0
00–
10,0
00$1
0,00
0–10
0,00
0$1
00,0
00–
1 M
illio
n$1
Mill
ion
and
over
Tota
lSt
ock
32
4936
7114
.42.
117
79,
817
Oth
er in
vest
men
ts2
01
01
1.1
0.1
52,
804
Rea
l est
ate
22
42
104.
60.
825
26,0
00C
onse
rvat
ion
ease
men
ts1
1.9
0.2
320
7,00
0A
rt an
d co
llect
ible
s38
1939
47
1.1
0.1
109
800
Food
143
2623
21
195
149
Clo
thin
g87
61,
373
2,09
593
164,
452
982
Elec
troni
cs29
010
814
84
155
145
4H
ouse
hold
item
s81
168
11,
071
5015
2,62
882
5Ve
hicl
es15
8076
455
40.
791
82,
225
Oth
er34
718
927
918
131.
50.
284
766
4To
tal
2,52
82,
481
4,47
126
413
925
.43.
66,
565
969

Tax Expenditures for Noncash Charitable Contributions 663
Am
ount
s of D
educ
tions
($M
illio
ns)
Type
of P
rope
rty
Size
of D
educ
tion
Med
ian
Ded
uctio
n($
Mill
ions
)U
nder
$5
00$5
00–
1,00
0$1
,000
–5,
000
$5,0
00–
10,0
00$1
0,00
0–10
0,00
0$1
00,0
00–
1 M
illio
n$1
Mill
ion
and
over
Tota
lSt
ock
115
026
21,
951
3,68
89,
493
15,5
4687
,801
Oth
er In
vest
men
ts0
13
3434
165
71,
037
202,
031
Rea
l Est
ate
28
1444
11,
301
2,19
23,
958
156,
008
Con
serv
atio
n ea
sem
ents
3277
778
61,
595
511,
704
Art
and
colle
ctib
les
912
106
2617
328
132
493
18,
573
Food
1817
4610
112
105
535
Clo
thin
g24
298
14,
236
599
238
1230
6,33
71,
423
Elec
troni
cs61
7230
724
122
476
864
Hou
seho
ld it
ems
197
484
2,20
933
722
513
3,46
41,
318
Vehi
cles
560
1,96
935
568
142
292,
628
2,86
1O
ther
7613
459
811
029
342
948
92,
130
2,51
3To
tal
608
1,76
39,
630
1,74
03,
478
6,98
714
,001
38,2
065,
820
Not
es: S
ize o
f ded
uctio
n re
pres
ents
tota
l ann
ual d
educ
tions
for e
ach
type
of p
rope
rty cl
aim
ed b
y th
e tax
paye
r. In
com
e is c
ash
inco
me a
s defi
ned
in th
e app
endi
x.
Stoc
k ca
tego
ry in
clud
es m
utua
l fun
ds. A
dditi
onal
det
ails
are
pro
vide
d in
the A
ppen
dix.
An
aste
risk
indi
cate
s les
s tha
n $0
.5 m
illio
n or
few
er th
an 5
00 re
turn
s.So
urce
: IR
S St
atis
tics o
f Inc
ome,
For
m 8
283
Stud
y, 2
004.
Tab
ulat
ions
by
the
auth
ors.

National Tax Journal664
Among middle-income households, donations of clothing and other household items and vehicles are much more important. Except for the top 10 percent of taxpayers and those with low or negative incomes, donations of clothing and household items generally accounted for about two-thirds of the value of noncash deductions and vehicle dona-tions accounted for another 12 to 20 percent.11 Donations of stock generally accounted for only small percentages of the noncash deductions of lower and middle-income taxpayers.
Table 4 shows the distribution of the size of annual deductions claimed for each type of property in 2004. In this table, for taxpayers with more than one reported donation of a type of property, all donations of each type of donated property are aggregated. The average annual deduction of corporate stock was $87,801, but the median deduction was only $9,817. Thus many donations of stock are for relatively modest amounts. While only about 2,100 taxpayers donated corporate stock valued at $1 million or more (1.2 percent of those with stock donations), these large donations accounted for $9.5 billion or 61 percent of the $15.5 billion value of all stock donations. Similarly, 55 percent of the $4.0 billion in donations of real estate were accounted for by taxpayers contributing at least $1 million. In contrast, the typical deduction amounts for clothing were much smaller, though perhaps larger than one might have expected given that most of the value of such donations is from households with incomes under $100,000. The median deduction for donations of clothing was $982, and two-thirds of the value of clothing donations was accounted for by taxpayers who deducted between $1,000 and $5,000. The size of these deductions may be partly the result of the so-called “ItsDeductible” phenomenon of the inclusion of valuation programs along with computer tax prepara-tion programs.12 Such programs provide taxpayers with suggested values for deduc-tions for different items of clothing that depend on the taxpayer’s self-assessment of their condition. ItsDeductible calls itself the “Bluebook of Donated Items.” While the values in the computer programs are said to refl ect market prices, values used in some earlier versions of the program often exceeded retail prices at high-volume depart-ment stores.13 The large amounts being claimed for clothing donations have generated various proposals for reform and stirred Congress to deny a deduction for clothing in less than “good” condition beginning in 2005. While relatively little of the value of deductions in Table 4 is from individual donations of less than $500, taxpayers are
11 The smaller percentage for clothing and household items in the lowest quintile refl ects some large stock donations by wealthy taxpayers with negative incomes.
12 For comparison, the mean clothing donation of $1,423 was almost as high as the mean household expenditure on apparel (excluding apparel services and other apparel) of $1,552 in the 2004 Consumer Expenditure Survey. Brown (2008) provides additional discussion of clothing deductions.
13 For example, in 2003, ItsDeductible valued used maternity pants at $24. In that year, the retail price for maternity pants at mass-market stores was between $18 and $28 (numbers based on an online “shopping trip” by Treasury Staff). The values suggested by ItsDeductible seem to have been reduced in recent years, but may still be higher than values in other sources. Another indicator of the deductions claimed by some taxpayers is that for those taxpayers reporting their cost basis for clothing donations, the deduction claimed was 35 percent of reported cost.

Tax Expenditures for Noncash Charitable Contributions 665
not required to report this detailed information when total noncash deductions are less than $500.
The public policy merit of deductions for noncash donations may depend on who receives the donations. As shown in Table 5, the largest amounts of noncash donations by taxpayers making more than $500 in noncash contributions went to private founda-tions and large national charities such as the Salvation Army, Goodwill, and similar organizations. The types of property donations differed greatly, however, as foundations primarily received donations of stock, while donations of clothing and household items accounted for most of the deductions for donations to the large national and international charities. While foundations received the majority of all stock donations (56 percent and $8.9 billion), 18 percent went to educational institutions and 11 percent went to religious organizations. Donations of other types of property were generally distributed widely across different categories of charitable organizations.
Table 6 focuses in more detail on 2004 donations of food, clothing, and household items and the charities that receive these types of donations. Charities and religious organizations that accept these types of donations may be viewed as more oriented toward social welfare activities and the provision of benefi ts to low-income households. Overall, these charities received about $16 billion in noncash donations, about 40 percent of all noncash donations. A group of about 10 of the largest national and international charities were the largest recipients of clothing, computers, and other household items, accounting for well over half of each type of property. These organizations accounted for only about one-sixth of donated vehicles, however, and received relatively little in the way of stock and real estate donations. Overall median deduction amounts for all types of property were about $500 for all types of donees. The 25th percentile deduction for most types of donations was generally about $200, while the 75th percentile deduc-tion was generally $1,000 to $1,200. Median deductions for vehicles were signifi cantly larger, while deductions for food donations were typically small. Many donors reported multiple donations, however, so that total annual donations were larger than what is shown in this table.
IV. VEHICLE DONATIONS: A CASE STUDY OF A POLICY CHANGE
The donations of cars, vans, and light trucks examined in this section make an interesting case study for two reasons: (1) recent law changes affected the deduc-tions available to individuals donating vehicles, and (2) car auction data available to the authors expand our knowledge about the actual resale values of used vehicles. Although anecdotal evidence and audit results suggest that many taxpayers overstated the value of their automobile donations, direct evidence of overvaluation is hard to fi nd because audits rates are low and supporting information about the donated vehicles on tax returns contains little detail. However, the limited information available suggests that over-reporting was common. For example, a U.S. Government Accountabiliy Offi ce (GAO) (2003) study examined a small set of donated automobiles and found that most of them were resold at auction at a small fraction of the value claimed on the

National Tax Journal666
Table 5 Di stribution of Types of Property Donations by Type of Donee, 2004
Charity Type
Amounts of Deductions ($Millions)
StockReal
Estate
Clothing and HH Items Vehicles Other Total
Arts and cultural 473 494 91 24 401 1,483
Education 2,791 376 91 97 638 3,993
Environment 188 1,322 37 62 152 1,761
Health 279 55 468 433 192 1,426
National/international 272 120 6,541 471 668 8,072
Public benefi t 462 620 1,120 610 308 3,120
Religious 1,726 528 1,040 474 388 4,156
Foundations 8,850 715 156 309 796 10,826
Other 505 1,323 256 148 1,137 3,368
All Charities 15,546 5,553 9,801 2,628 4,678 38,206
Charity Type
Percent of Deductions
StockReal
Estate
Clothing and HH Items Vehicles Other Total
Arts and cultural 3.0 8.9 0.9 0.9 8.6 3.9
Education 18.0 6.8 0.9 3.7 13.6 10.5
Environment 1.2 23.8 0.4 2.4 3.2 4.6
Health 1.8 1.0 4.8 16.5 4.1 3.7
National/international 1.7 2.2 66.7 17.9 14.3 21.1
Public benefi t 3.0 11.2 11.4 23.2 6.6 8.2
Religious 11.1 9.5 10.6 18.0 8.3 10.9
Foundations 56.9 12.9 1.6 11.8 17.0 28.3
Other 3.3 23.8 2.6 5.6 24.3 8.8
All Charities 100.0 100.0 100.0 100.0 100.0 100.0
Source: IRS Statistics of Income, Form 8283 Study, 2004. Tabulations by the authors.Notes: Stock category includes mutual funds. Real estate includes conservation and façade easements. Clothing and HH items includes clothing, accessories, and other household items. National/international charities include large national or international social welfare charities generally with local chapters. Public benefi t charities include those that provide individual or community benefi ts but are not included in other categories. See the Appendix for additional details.

Tax Expenditures for Noncash Charitable Contributions 667
Tabl e 6Deductions for Noncash Donations to Social Welfare Charities, 2004
Total Deductions ($Millions)
Type of Charity StockReal
Estate Food Clothing ComputersHH
Items Vehicles Other AllNational/international 159 30 5 4,273 238 1,962 439 342 7,448Religious 1,818 537 36 600 57 389 342 300 4,079Thrift stores 1 0 0 168 11 105 0 17 302Other charities 0 0 64 1,269 170 1,008 1,654 0 4,166Total charities 1,977 567 105 6,310 476 3,464 2,436 660 15,995
Distribution of Size of DeductionsType of Charity Mean Deduction Amount ($Millions)National/international 46,550 6,967 366 877 773 861 2,160 704 912Religious 13,255 71,919 199 824 803 897 2,691 1,269 2,125Thrift stores 8,884 0 964 799 715 934 615 824Other charities 0 0 356 693 680 723 2,655 0 973Total charities 14,061 48,362 281 826 739 821 2,554 878 1,086Type of Charity 25th Percentile Deduction ($Millions)National/international 3,031 115 240 150 200 1,150 150 220Religious 1,513 175 16 240 200 150 1,500 56 163Thrift stores 2,587 0 200 250 75 259 100 250Other charities 0 0 22 200 150 135 1,500 0 190Total charities 1,101 175 18 225 150 180 1,395 122 200Type of Charity Median Deduction ($Millions)National/international 3,043 300 500 400 490 1,850 384 500Religious 3,867 26,000 26 500 450 480 2,200 350 500Thrift stores 3,192 0 800 500 475 500 300 500Other charities 0 0 75 400 300 325 2,225 0 450Total charities 3,867 10,000 50 480 350 430 2,125 364 498Type of Charity 75th Percentile Deduction ($Millions)National/international 25,225 475 1,090 1,055 1,100 2,800 725 1,120Religious 10,180 67,000 129 1,000 1,000 1,050 3,500 857 1,272Thrift stores 4,250 0 960 1,005 1,100 1,030 1,000 1,034Other charities 0 0 225 750 688 800 3,550 0 1,196Total charities 10,557 88,746 210 1,000 900 1,000 3,500 926 1,200Notes: Donations in this table are the individual donations reported separately on Form 8283. Only social welfare and other charities receiving donations of clothing, food, and household items are included in this table. The national/international category includes the largest national and international charities, most with major programs that collect and distribute clothing, and household items. Thrift stores are those other than those of the large national charities. Other charities include only those charities reported on Form 8283 as being recipients of donations of food, clothing, or household items. The stock category includes mutual funds. Real estate includes conservation and façade easements. See the Appendix for more detailed defi nitions. An asterisk indicates too few observations.Source: IRS Statistics of Income, Form 8283 Study, 2004. Tabulations by the authors.

National Tax Journal668
returns.14 Recent law changes have limited taxpayer discretion when valuing vehicles donated for resale. The rule changes in 2005 combined with the auction data provide an opportunity to explore the effects of the new law and to examine taxpayer valuation behavior. To preview the results, this law change (combined with the expectation of increased scrutiny by the IRS) led to a 66 percent decrease in the number of vehicle donations and a 50 percent decrease in the average deduction.
A. Historical Background on Vehicle Donations
Vehicle donation programs have existed for at least thirty years and initial programs were small. By 1991, however, at least six national charities (including Goodwill Industries, the National Kidney Foundation, and the Salvation Army) were operating successful vehicle donation programs that generally accepted trucks, boats, and RVs as well as cars. Although vehicle donation programs were still limited and relatively unknown by the general public, by 1992 the California Attorney General’s Offi ce had already taken notice of the large gap between amounts raised by commercial fundrais-ers through the sale of donated vehicles and the amounts ultimately received by chari-ties (Cabot, 2002; California Offi ce of the Attorney General, 2004). Rapid expansion continued throughout the 1990s and by tax year 2000 GAO (2003) estimated that 733 thousand vehicles were donated to charity at a cost to the IRS of $654 million. That year, the American Kidney Foundation’s “Kidney Car Program,” the nation’s largest program, collected more than 72,000 automobiles (Cabot, 2002).
Although the fi rst vehicle donation programs were run by the charities themselves, a for-profi t industry soon developed to assist non-profi ts in the processing of donated automobiles and light trucks. This development enabled smaller charities to accept donations, and by 2001 approximately 4,300 charities were accepting vehicle donations (GAO, 2003). Most charities accepting donations had contractual relationships with private companies under which donated vehicles would be picked up, towed, processed, and ultimately sold by the private contractor at an auction (often for liquidation prices) or to a salvage yard. The for-profi t handler would supply a receipt identifying the auto-mobile, but making no reference to condition. The taxpayer could claim a charitable deduction based on the “fair market value” of the vehicle. The charity would receive a share of the net proceeds from the sale or a fi xed payment per car. After reducing the sales proceeds by vehicle processing (including towing) and advertising costs, the benefi t to the charity would generally be a small percentage of the amount claimed by
14 In 36 of the 54 cases examined in detail, the vehicle sold at auction for less than 15 percent of the amount claimed as a deduction on the taxpayers return. Similarly, the charity received 5 percent or less of the amount claimed as a deduction on the taxpayer’s return in 36 cases. The GAO noted that their results are suggestive, but cannot be generalized because the small sample examined in detail included only 54 vehicles donated to four charities in different states. These results are consistent with the authors’ experi-ence that many people seem to have a car donation story, usually one involving a generous interpretation of the law.

Tax Expenditures for Noncash Charitable Contributions 669
the donor as a charitable deduction. The for-profi t handlers would receive the bulk of the sale proceeds, while taxpayers typically claimed much higher values on their returns.15 Charities contracting with for-profi t fi rms might do little more than cash a monthly check. Reports from the period suggest that many donated automobiles were in extremely poor condition. For example, an executive at a major processor reported in an interview with the Nonprofi t Times (Sinclair, 2000) that nearly half the cars received didn’t run at the time the donations were accepted, and sold on average for $400 (factoring in those that were nearly worthless). However, it should be noted that even with the small benefi ts to the charities per car relative to total revenues or total deductions, vehicle donation programs often generated a steady stream of revenues for charities that participated.
In February 2004, the Administration’s Budget included a proposal to require an appraisal for donated vehicles, and that June the Senate Finance Committee conducted hearings on abusive practices across the nonprofi t sector (U.S. Senate Finance Commit-tee, 2004). Congress included the tightening of the valuation rules for vehicles described in Section II as part of the American Jobs Creation Act of 2004.
B. What the Tax Data Tell Us about Vehicle Donations
This section explores the donations of automobiles, vans, and light trucks (hereafter, “vehicles”) using a unique dataset that combines tax return information on deductions claimed for used vehicles donations in 2003–2005 with sales information for similar used vehicles sold in online auctions in 2003. The tax data span the recent law changes that were designed to limit abusive deductions for vehicle donations. These data are matched to sales data constructed from the roughly 300,000 vehicles sold on eBay in 2003. Although we do not match a donated vehicle to the sales price of that particular vehicle, we are able to match donated vehicles to auction data for vehicles of the same year, make, and model, the only information consistently available in both datasets.16 This dataset is used to explore how the deductions claimed on tax returns for donated vehicles compare to the distribution of internet auction prices of similar vehicles.
Table 7 shows basic summary statistics for charitable donations of all vehicles reported on Form 8283. Although taxpayers donate boats, airplanes, and other vehicles, the overwhelming majority of donations are of automobiles and light trucks.17 Nearly all taxpayers donate only one vehicle in a given year, although some donate larger num-bers, including vehicle “collections.” Vehicles donated in 2003 and 2004 were valued by the taxpayers or their agents. In 2005, the vehicles were valued in one of two ways:
15 The California Attorney General’s Offi ce reported that charities received only $11.5 million or 31 percent of the $37 million gross proceeds of commercial fundraisers from the sale of donated vehicles in 1991 (Cabot, 2002). The GAO (2003) study concluded that charities were receiving very little relative to the values claimed by taxpayers.
16 Taxpayers typically reported only year, make, and model of donated vehicles. Only a small percentage reported information about mileage, condition, VIN number, or title number.
17 Other donated vehicles include golf carts, racing cars, and Segways. The number of total vehicles in Table 7 differs slightly from SOI totals in recent SOI Bulletin articles due to coding decisions by the authors.

National Tax Journal670
Tabl
e 7
Ded
uctio
ns fo
r Don
atio
ns o
f Veh
icle
s, 20
03–2
005
Inco
me
Cat
egor
y
2003
20
04
2005
Vehi
cle
Don
atio
nsVa
lue
of
Oth
er
Non
cash
Vehi
cle
Don
atio
nsVa
lue
of
Oth
er
Non
cash
Vehi
cle
Don
atio
nsVa
lue
of
Oth
er
Non
cash
Num
ber
of V
ehic
les
Ded
uctio
n A
mou
ntTa
x B
enefi
tN
umbe
r of
Vehi
cles
Ded
uctio
n A
mou
ntTa
x B
enefi
tN
umbe
r of
Veh
icle
sD
educ
tion
Am
ount
Tax
Ben
efi t
Neg
ativ
e1.
43.
20.
02.
74.
411
.40.
113
.70.
73.
40.
03.
8
$0–2
5k32
.075
.33.
486
.229
.757
.24.
261
.97.
35.
00.
210
.9
$25–
50k
169.
541
8.6
48.1
478.
913
2.0
285.
434
.034
5.6
42.8
45.9
5.2
72.2
$50–
75k
200.
146
7.8
73.4
606.
021
0.3
495.
786
.566
2.9
60.0
65.0
10.0
94.4
$75–
100k
159.
939
4.7
87.6
489.
019
9.6
492.
595
.561
0.4
46.2
52.0
8.9
106.
2
$100
–250
k23
8.1
649.
717
4.2
903.
730
7.5
773.
820
1.0
1,03
8.8
100.
614
4.9
37.6
245.
0
$240
–500
k 25
.910
1.5
33.6
151.
736
.811
6.1
39.2
202.
814
.223
.07.
449
.1
$500
–1 m
il6.
834
.410
.862
.811
.044
.315
.614
6.2
4.5
10.8
3.5
37.6
$1 m
illio
n +
2.9
15.3
4.6
221.
04.
827
.810
.042
8.0
2.7
14.2
5.2
209.
8
Tota
l83
6.6
2,16
0.5
435.
83,
002.
0
935.
92,
304.
148
6.1
3,51
0.2
27
9.0
364.
277
.982
9.1
Not
e: In
com
e cl
asse
s ar
e ba
sed
on c
ash
inco
me
as d
efi n
ed in
the
App
endi
x. V
ehic
les
incl
ude
auto
mob
iles,
vans
, and
ligh
t tru
cks.
Don
atio
ns o
f col
lect
ions
of
vehi
cles
are
exc
lude
d. D
olla
r val
ues a
re in
mill
ions
of d
olla
rs; n
umbe
r of v
ehic
les a
re in
thou
sand
s.So
urce
: Int
erna
l Rev
enue
Ser
vice
, Sta
tistic
s of I
ncom
e, 2
003–
2005
Indi
vidu
al In
com
e Ta
x R
etur
ns. T
abul
atio
ns b
y th
e au
thor
s.

Tax Expenditures for Noncash Charitable Contributions 671
(1) taxpayers could donate the vehicle to charity for resale and accept the gross proceeds as the value of the automobile, or (2) taxpayers could donate the vehicle for an exempt purpose and deduct their best estimate of the private party price. The valuation method used in 2005 cannot be distinguished in the data. Nearly a million vehicles were donated in 2004, an increase of 12 percent from 2003. Part of this increase may refl ect donations accelerated due to the stricter valuation rules that became effective in 2005. The total value of the vehicles in 2004 claimed by taxpayers was $2.3 billion, or nearly two-thirds of the noncash giving by those donating vehicles. Taxpayers in this year received nearly half a billion dollars in benefi ts from these donations. After the law changed in 2005, the total number of donated vehicles fell by 70 percent while the total value of deductions claimed dropped by 84 percent. The total tax expenditure dropped 83 percent to less than $80 million. This appears to be a permanent change, as data for 2006 show that the total number of vehicles donated remained about the same as in 2005 (Wilson, 2008).
Table 8 shows median values for donations of common automobiles and light trucks by income class. As expected, the median value of donated vehicles generally increases
Table 8Median Deductions for Donated Vehicles, 2003–2005
Median Values for Common Makes and Models Between 5 and 22 Years Old
Income Category
Year2003
2004
2005
Vehicle Value
Tax Benefi t
Vehicle Value
Tax Benefi t
Vehicle Value
Tax Benefi t
Negative 4,525 0 2,800 0 5,000 0
$0–25 2,000 50 1,560 69 500 0
$25–50 2,050 268 1,600 198 500 75
$50–75 2,130 316 2,125 333 700 105
$75–100 2,350 488 2,000 375 800 125
$100–250 2,575 661 2,275 558 825 207
$240–500 3,350 1,050 2,800 896 1,275 429
$500–1 million 3,565 1,234 3,800 1,148 1,200 432
$1 million+ 4,000 1,225 3,775 1,270 1,985 639
Total 2,305 394 2,130 388 750 147Notes: Income classes are based on cash income as defi ned in the Appendix. Vehicles include automobiles, vans, and light trucks. Donations of vehicle collections are excluded. In general, vehicles less than fi ve years old may be inventory property, and vehicles more than 22 years old may be collectibles. They are therefore excluded. Source: Internal Revenue Service, Statistics of Income, 2003–2005 Individual Income Tax Returns. Tabulations by the authors.

National Tax Journal672
with income. Median tax savings increases with income because higher income indi-viduals face higher marginal rates and donate higher value vehicles. Most taxpayers donate older vehicles — the average age (when age is reported) is around 13 years. After the law changed in 2005, the average age of donated vehicles remained around 13 years, but disproportionately fewer vehicles less than nine years old were donated.
Figure 2 presents the percentile distribution of taxpayer vehicle valuations in each of the three years. In 2003, only ten percent of the cars were valued at $1,000 or less while sixty percent were valued at $2,000 or more. The distribution in 2004 is quite similar (although 2004 values are slightly below 2003 throughout the distribution). In contrast, 2005 valuations are consistently far below those in 2003 and 2004. Also, in 2005 nearly one-third of the donated automobiles were valued at $500; no such bunch-ing is apparent prior to the law change. Taxpayers with vehicles worth up to $500 are not required to participate in the information reporting regime, and instead establish the value by themselves. As discussed previously, bunching suggests that taxpayers are not claiming fair market values, but instead either intentionally understating the value of the donation to avoid higher compliance costs and audit risk, or overstating
0
1,000
2,000
3,000
4,000
5,000
0 10 20 30 40 50 60 70 80 90
Percentile
2003
2004
2005
Va
lue
($
)
Source: Internal Revenue Service, Statistics of Income, 2003–2005 Individual IncomeReturns; eBay Motors 2003. Tabulations by the authors.
Figure 2Percentile Rankings of Taxpayer Valuation of Donated
Automobiles Before and After the Law Change

Tax Expenditures for Noncash Charitable Contributions 673
the value in the belief that small overstatements to values under the threshold will pass unnoticed.
Figure 3 provides a comparison of auction prices and taxpayer valuations for the donations of 55 Ford Tauruses in 2003. This fi gure shows the mean fair market value claimed by taxpayers by model year and the mean and standard deviation by model year of the eBay auction prices for over 120,000 Ford Tauruses sold that year (the standard deviations are shown in gray). As is clear from the graph, taxpayer vehicles were consistently valued as if they were of better quality than most Tauruses of the same model year. For a 13-year-old Taurus, the taxpayer mean valuation corresponds to an LX sedan in excellent condition with 80,000 miles, a moon roof, and other pre-mium features. Based on Kelly Bluebook values as of March 2008, the auction mean price corresponds to an LX sedan in good condition, with 120,000 miles, and manual windows and mirrors. The difference between the auction prices and the taxpayer valuations doesn’t necessarily refl ect abuse by these taxpayers — the comparisons are between different cars. However, since the evidence supports the generally poor condition of donated automobiles, this fi gure does call into question the accuracy of taxpayer claims.
0
1,000
2,000
3,000
4,000
5,000
6,000
7,000
87 89 90 91 92 93 94 95 96 97 98 99
Vehicle Year
Taxpayer Value
Va
lue
($
)
Auction Price
Source: Internal Revenue Service, Statistics of Income, 2003–2005 Individual IncomeReturns; eBay Motors 2003. Tabulations by the authors.
Figure 3Taxpayer and Auction Valuations of Used Ford Tauruses by Model Year
(2003 Tax Year and Sales)

National Tax Journal674
A closer focus on auction prices and taxpayer valuations is presented in Figure 4, which compares the taxpayer valuations with auction prices using normalized prices and the conditional distribution function for those prices.18 A normalizing procedure is needed in order to analyze taxpayer valuations of widely disparate vehicles (e.g., a 1988 Ford Escort and a 1998 E-class Mercedes). In the fi rst step, means and standard deviations of auction prices were computed for each vehicle type by year, make, and model to construct normalized price distributions for each vehicle type. Then, each donated vehicle was assigned a value between zero and one depending on its location in the distribution of auctioned vehicle prices for the same make, model and year. A value
18 Over two-thirds of the common make and year vehicles in the tax data (i.e., excluding antique cars and inventory) could be matched to the auction data. Most of the unmatched vehicles contained incomplete descriptions on the taxpayer’s return.
0
0.25
0.5
0.75
1
0% 25% 50% 75% 100%
No
rma
lize
d P
rice
Percentile Ranking of Vehicles by Normalized Price
2003
2004
2005
50%
Source: Internal Revenue Service, Statistics of Income, 2003–2005 IndividualIncome Tax Returns; eBay Motors 2003. Tabulations by the authors.
Figure 4Prior to the Law Change, Taxpayers Valued their Vehicles Far Above the
Sale Prices of Similar Automobiles

Tax Expenditures for Noncash Charitable Contributions 675
of 0.5, for example, means that the taxpayer’s claimed deduction for the vehicle equals the mean price of all auctioned vehicles of that make, model and year. In general, the value of this variable gives the probability that a vehicle of this year, make, and model would sell at auction for less than the taxpayer’s valuation.
The normalized price variable (conditional on year, make, and model) can be inter-preted as a measure of implied quality. For example, a vehicle valued at the auction mean price is, by defi nition, of average quality for used vehicles of that year, make, and model and is represented in the cumulative distribution variable by 0.5. A value signifi cantly above 0.5 implies that the quality of the donated vehicle is far better than the average — perhaps due to condition, mileage, or features. A signifi cantly lower value implies that the donated vehicle is of below average quality.
In 2003, 80 percent of the matched donated vehicles were valued at more than the conditional mean values of internet auction prices, and nearly half of the taxpayers valued their vehicles in the top ten percent of the auctioned automobile distributions. In other words, taxpayers’ claims were consistent with most taxpayers donating cars in very good condition. Taxpayer valuations for 2004 and 2005 can be examined using a stylized aged distribution of the 2003 auction values. This requires the assumption that automobiles of a given make and model do not change much in quality from one year to the next and depreciate similarly over time. Although this analysis does not provide direct evidence of any taxpayer’s overstatement, it suggests that overall, taxpayer valuations in 2003 and 2004 are implausibly high although slightly lower after the announcement of the policy change due either to more conservative valuations or accelerated end-of-year donations of low-value vehicles prior to the law change. In 2005, conditional values dropped signifi cantly — nearly 70 percent of the 2005 donations were valued below the conditional mean of auction prices. The interpretation of 2005 is diffi cult, however. While most of the donations should have been valued at wholesale price when sold by the charity, vehicles used directly for charitable purposes could still be valued at the private party price, which is the price represented in the auction data.
Finally, Table 9 presents a limited series of regressions that explore the relationship between relative implied automobile quality (as measured by taxpayer valuation rela-tive to auction prices) and taxpayer and automobile characteristics. Some regressions are probit models with a value of 1 for donations with taxpayer valuations at least one standard error higher than the mean eBay value for that vehicle’s make, model, and year. The dependent variable in regressions 5 and 6 is the value between 0 and 1 discussed above which measures the claimed quality of the donated vehicles relative to comparable auctioned vehicles. Regressions 1 and 3 examine a basic noncompliance probit model where the independent variables are income and tax price. The coeffi cients on income are not statistically signifi cant but are consistently small and negative in all of the probit equations, which could imply slightly less overstatement of value or quality by higher income taxpayers. The coeffi cient on the tax price of charitable donations is negative in all of the probit equations, consistent with the idea that higher tax rates are associated with a greater tendency to claim an unusually high vehicle value or quality — but the coeffi cient is statistically signifi cant only in regression 3 where the basic probit model

Table 9Regression Results for Taxpayer Vehicle Valuations
Probit EquationsNormalized Price IV Regressions
Variable 1 2 3 4 5 6Log (Tax Price) –1.602 –1.421 –1.577 –1.141 0.112 –0.057
(1.053) (1.038) (0.612) (0.616) (0.381) (0.313)Log(Cash Income) –0.189 –0.141 –0.146 –0.043 0.008 0.000
(0.140) (0.139) (0.084) (0.084) (0.043) (0.037)Married –0.035 –0.056 –0.086 –0.114 –0.016 –0.014
(0.192) (0.196) (0.118) (0.121) (0.042) (0.031)Age less than 45 –0.293 –0.298 –0.209 –0.230 –0.034 –0.004
(0.274) (0.284) (0.162) (0.167) (0.044) (0.036)Age 45–54 –0.407 –0.414 –0.294 –0.327 –0.083 –0.029
(0.276) (0.285) (0.162) (0.169) (0.048) (0.036)Age 55–64 –0.051 –0.052 0.027 0.014 –0.016 0.024
(0.286) (0.295) (0.169) (0.174) (0.047) (0.038)Paid Preparer –0.420 –0.135 –0.083 –0.051
(0.275) (0.161) (0.044) (0.032)Computer Prepared –0.450 –0.166 –0.111 –0.080
(0.291) (0.171) (0.050) (0.035)Luxury Automobile –0.397 –0.291 –0.074 –0.069
(0.244) (0.156) (0.049) (0.034)Age of Automobile 0.019 –0.001 –0.001 0.002
(0.019) (0.010) (0.004) (0.003)2003 Return 0.467 0.133
(0.092) (0.020)Constant 2.124 1.842 1.326 0.300 0.857 0.671
(1.391) (1.417) (0.841) (0.874) (0.395) (0.341)R2/Pseudo R2 0.016 0.028 0.015 0.042 0.034 0.066
Observations 1,074 1,074 2,873 2,873 1,074 2,873 Notes: The dependent variable in the probit regressions equals one if the taxpayer valued the donated vehicle at least one standard error above the mean auction price for vehicles of the same make, model, and year sold on internet auctions in 2003. The dependent variable in regressions 5 and 6 is a normalized price — a number between zero and one that shows the relative position of the deduction amount for the donated vehicle in the conditional distribution of prices of vehicles of the same make, model, and year sold in an internet auction in 2003. All regressions are weighted by the sample weights. The sample includes cars, vans and light trucks between fi ve and 23 years old.Source: Internal Revenue Service, Statistics of Income 2003–2005 Individual Income Tax Returns; and eBay Motors 2003.

Tax Expenditures for Noncash Charitable Contributions 677
is applied to pooled 2003 and 2004 data. The income and tax price variables were not statistically signifi cant in regressions 5 and 6 in which dependent variable is the nor-malized price variable. Some regressions consider an expanded model with additional variables of interest. Taxpayers who used computer software such as TurboTax (but did not use a paid preparer) were less likely to assign a high value to their automobile, although this was statistically signifi cant in only two of the regressions. Taxpayers were less likely to claim a large deduction (relative to the distribution of internet auction prices for similar vehicles) for donations of older cars and for donations of vehicles of luxury makes and models, although these were statistically signifi cant in only some specifi cations. Those donating vehicles in 2003 were more likely to assign a high value to their automobile, but this may be a result of the defl ation strategy for 2004 values. Overall, the results of these regressions may provide insight into factors affecting tax-payers valuations of donated relative to typical market prices, but the general low level of statistical signifi cance means that no strong conclusions can be drawn.
C. Eff ects of the Law Change
It is clear from the data that the change in the law in 2005 had major effects on vehicle donations. Taxpayers are donating fewer automobiles (or at least not claiming suffi cient value to require reporting the donation on Form 8283), and they are claiming lower values for these vehicles. Charities also report a large drop in donations and associ-ated revenues; they also report a drop in the average value of donated automobiles.19 There is evidence of other changes within the industry. For example, some donation programs are specializing in either disposal (accepting all cars for quick turnover) or exempt purpose donations (accepting only automobiles suitable for the poor or other groups) (GAO, 2008).
V. ISSUES IN EVALUATING THE TAX EXPENDITURE FOR NONCASH DONATIONS
A. Valuation Issues
A key issue raised by the deduction for property gifts is determining the fair market value of donated property. For publicly traded securities with active markets, this is relatively straight-forward because transactions with arms-length prices are widely reported and liquid markets allow charities to turn such donations into cash at relatively low cost.20 Valuation can be more diffi cult for securities that are not publicly traded
19 See Rowland (2005) and Stokeld (2005). Volunteers of America, which runs a large program, reported a drop of about 40 percent from the previous year. GAO (2008) found that six of the 10 charities from the 2003 study saw a drop in donations in 2006.
20 Even for publicly-traded securities, there are some ambiguities, such as establishing the date for determin-ing the market value when there are lags between mailing a letter authorizing a donation, receipt of the letter, and the sale of the security. IRS regulations provide specifi c rules, but these may not be known by taxpayers. There have been various court cases dealing with this issue.

National Tax Journal678
or traded in thin markets, and for other types of property. As a result, there have been many disputes between taxpayers and the IRS, and many cases of abuses by taxpay-ers. The valuation of donations of works of art, for example, has long been an area of disputes, abuses, and court cases. While art auctions establish the value of particular works and the works of some artists, the values of other works and works by other art-ists can be diffi cult to determine. Prior to 1968, there were many cases of abuses such as purchasing works of art and then claiming a much higher market value when the art is donated to a charity after a short time or selling works of art to a charity at a “below market price” and then claiming a deduction for the discount. In response to problems like these, Congress authorized the IRS to establish the Art Advisory Panel in 1968 to review values claimed by taxpayers. While works of art, real estate, conservation and façade easements, and other high value property can potentially be valued by profes-sional appraisers, appraisal is art as well as science and opinions vary widely among even the most scrupulous appraisers.21
For other types of property, there are multiple markets where the goods are exchanged with signifi cant differences in prices. For used cars, for example, the price of a used car purchased from a dealer is commonly three to four times higher than the price the dealer would offer on a trade-in or the price at an auction, with the typical price of private party sales being somewhere in between. For used clothing, the prices charged by premium used clothing stores are likely to be much higher than prices at thrift shops operated by religious organizations, fl ea markets, or garage sales. While these prices vary widely, they are all prices at which transactions occur and could be said to refl ect fair market value.22 The variation may in part refl ect intangible characteristics such as style and designer label. Prices may include an implicit or explicit warranty or assurance of quality, condition, or cleanliness. In other cases, low prices may refl ect a desire on the part of the charity to offer subsidized clothing to low-income families. The challenge for tax policy is to set appropriate standards with clear rules and regulations that result in consistent and fair deductions by taxpayers.
Furthermore, there is a natural tension between the competing goals of requiring more accurate valuation and limiting complexity and burden, particularly with low value items like articles of clothing. From a tax policy perspective, appraisals, audit, or even elaborate record keeping on such items may not be appropriate. On the other hand, in 2005, the individually small valuation decisions by over fi ve million taxpay-ers translated into at least $7 billion of deductions for clothing and household items.23
21 The Pension Protection Act of 2006 strengthened requirements for appraisers and appraisals used to value charitable contributions. Proposed regulations issued in 2008 intended to implement this legislation require appraisers to have verifi able education and experience, and to provide examples of education and recognized appraiser certifi cation. To the extent that standards and certifi cations exist, however, they are determined at the state level.
22 Charities are paid a few cents per pound for clothing resold to for-profi t vendors, which could also be considered the fair market value.
23 Since these data only include donations reported on Form 8283 and most donations of lower and middle-income households consist of such items, the actual total is likely to be higher.

Tax Expenditures for Noncash Charitable Contributions 679
A related question is who should have the responsibility and bear the burden of valu-ing donated property. Current rules generally place the responsibility and burden on the taxpayer, but some proposals would require recipient charities to provide valuations or guidance on valuations.24 Unlike normal market transactions, where the buyer and seller have opposing interests, charities currently have no incentive to limit the values claimed by donors of property. They may have an incentive to support high valuations in order to obtain a desired gift. This lack of opposing parties further complicates the issue of proper valuations and the search for appropriate reforms. A 2003 dispute between the IRS and a taxpayer over violins sold at a below-market price to the New Jersey Symphony Orchestra illustrates this issue (Jones, Johnstone, and Kozinn, 2004).25 In this case, the taxpayer’s valuation was far higher than the orchestra’s own assessment of the instruments’ value. Although the charity had no legal responsibility to ensure the accuracy of the taxpayer’s return, the Senate Finance Committee questioned whether the charity was complicit in the apparent abuse.
Another issue is that the value received by the charity can be much less than the value claimed by the donor as a charitable deduction. As discussed above, in the case of donated vehicles sold at auction, the charity only receives the net proceeds from the auction net of processing expenses, while the donor taxpayer can deduct gross proceeds, and prior to 2005 could deduct full fair market value. Similarly, the costs of turning donations of used clothing or household items into cash or restoring them to usable condition may be substantial relative to the value claimed for the deduc-tion. Finally, the solicitation and receipt of certain property donations may divert the energies and resources of the charity toward the operation or oversight of a business activity that has little or nothing to do with its charitable purpose and also reduce the charity’s goodwill (an asset). Such effects were noted with respect to the involvement of charities in the donation of used cars, but this problem may arise for other similar activities.
These concerns need to be weighed against the public benefi ts from charitable dona-tions of property. Donations of fi ne art and items of historical value to museums and libraries allow the public to benefi t from seeing and studying items that might other-wise only be enjoyed by the wealthy. Donations of clothing and used household items may mean that goods that would otherwise be thrown away are recycled or reused.26 Noncash donations that present valuation problems and may not be effi cient from a
24 Some recent proposals, for example, would require charities to provide taxpayers with lists of clothing values or prices charged in their stores.
25 A second case involved the Smithsonian Institution and a donation of gems. Both cases involved “below market” purchases.
26 For example, over 2.5 billion pounds of textile waste was recycled in the United States in 2007, 35 percent of which was clothing. Although much of the clothing is recycled into cleaning rags, as much as one-third of the clothing is resold in Africa, South America, and Asia (see citations in the following footnote). A second example involves the recycling of luxury kitchens; a recent The New York Times article describes a charity that removes and resells luxury kitchens that might otherwise have been discarded. The tax incen-tive encourages remodelers to participate, even though their interest in the recipient charity (an addiction prevention program) may be minimal (Haughney, 2008).

National Tax Journal680
narrow tax policy perspective may seem less ineffi cient when additional goals are considered.27
B. Is the Conventional Tax Expenditure Understated for Appreciated Property?
When a taxpayer donates appreciated stock or other property that has appreciated in value, the taxpayer potentially escapes capital gains tax on the amount of appreciation (assuming that the taxpayer would otherwise have sold the property around the time of the donation) as well as receiving a fair market value deduction.28 Furthermore, because under current law collectibles face higher capital gains rates than stock (a maximum rate of 28 percent as compared to 15 percent), donated collectibles receive the most favored treatment of all. This differential treatment may have implications for the mix of property and cash donated, and may have implications for charities in terms of the mix of goods they receive or in terms of disposal costs and risks. In prior periods when tax rates were considerably higher, some taxpayers could actually save more in tax from the charitable deduction and avoidance of capital gains taxation than the market value of the property, thereby making money by giving it away (Auten, Clotfelter, and Schmalbeck, 2000). By ignoring capital gains taxes, traditional calculations may understate the total revenue cost of the tax expenditure.
Deviations between the value received by the charity and the value obtained by the taxpayer raise issues with respect to how tax expenditures are measured. Tax expendi-tures for charitable contributions are generally measured by calculating the additional revenue if the deduction were repealed. Deductions for donations of appreciated property, however, raise the question of whether the foregone capital gains revenues should be treated as an additional amount of tax expenditure. This would, of course, be inconsistent with the traditional procedures. And it is not known whether the taxpayer would have otherwise immediately sold the asset or would have held it until death at which time the gain would have been exempt due to step-up in basis. However, some scholars have argued that failing to tax the capital gain is inappropriate under an income tax, thereby implicitly considering the capital gains an additional tax expenditure (Halperin, 2002).
Although the tax expenditure may be higher per dollar of donation and per dollar of value to the charity for donations of appreciated property than for donations of cash (due to the avoidance of the capital gains tax), effi ciency concerns may be reduced if the price responsiveness of noncash giving is greater than that of cash giving. For example, a high degree of responsiveness is suggested by the fact that for the highest
27 However, availability of a supply of cheap used clothing is not always considered desirable — some nations have banned the import of used clothing, arguing that such clothes undermine the local clothing manufacturing industry. See van der Westhuizen (2007), the Secondary Materials and Recycled Textiles Association (2008), and Wicks and Bigston (1996) for a range of positions.
28 If the property were not donated, the taxpayer would have the opportunity to hold for life and then no capital gains tax would be owed as heirs would receive the benefi t of the step-up in basis at death (except those dying in 2010).

Tax Expenditures for Noncash Charitable Contributions 681
income group, noncash charitable contributions declined signifi cantly as a share of total charitable contributions and average noncash contributions fell by about 50 percent after the Tax Reform Act of 1986 made appreciation in property donations a preference item under the alternative minimum tax (AMT).29 Clotfelter (1990) found that donations of art to 19 art museums and of appreciated property to 16 private universities declined signifi cantly from 1985 to 1988 after a temporary surge in 1986. O’Neil, Steinberg, and Thompson (1996) found that the price elasticity for noncash charitable donations was substantially larger than that of cash donations (–1.30 versus –0.78). When they divided their sample by income class, they found that the responsiveness of noncash giving increased with income and was very large for the highest income class, but was insignifi cant or of the wrong sign for taxpayers with incomes under $200,000 in 1985. These results may indicate different factors at work for lower and middle-income tax-payers reporting noncash donations, and suggest that the conventional measure of tax price used may not be appropriate for these taxpayers.30 Eaton and Milkman (2004) found that the proportion of noncash donations was highly sensitive to the relative price of noncash donations, with an elasticity that often exceeded –1.0 in absolute value. Thus, there is some evidence that noncash donations may be more responsive to tax incentives for charitable contributions.
VI. POLICY ISSUES: OPTIONS AND CONSIDERATIONS
Policymakers might consider reforming the tax expenditure for noncash charitable contributions in several ways including reducing the cost of the tax expenditure, making the tax expenditure more effi cient, improving compliance, increasing the “fairness” of its distributional effects, and increasing the amount of charitable contributions and the associated benefi ts to charitable purposes. Clearly, there are tradeoffs among these goals, as options to reduce revenue costs could result in reduced contributions to charities that provide valuable social and public services. The challenge for policymakers is to fi nd policies that address perceived problems without reducing valuable donations or the services provided by charities. This section provides a brief summary of several reforms of the tax expenditure for noncash charitable contributions that have been suggested in various tax reform studies.
Some proposals focus on improving compliance through increased reporting or stricter valuation requirements. Third-party reporting is thought to be particularly effective.
29 Auten, Cilke, and Randolph (1992) data show that mean noncash contributions on tax returns with constant law real AGI over $1,000,000 declined from about $40,000 in 1983–1985 to about $20,000 in 1988–1990. This comparison excludes the transitory shifting that occurred between 1986 and 1987 and thus refl ects a longer term response.
30 In particular, since, as discussed earlier in this paper, high-income taxpayers tend to donate appreciating property while low-income taxpayers primarily donate used clothing and household items, the conventional price of giving may have been mismeasured for lower income taxpayers in assuming that capital gains tax would have been saved on their contributions.

National Tax Journal682
Some reformers propose requiring charities to provide receipts to both taxpayers and the IRS that specify the value of donated property once it exceeds some threshold.31 New reporting requirements, however, would impose higher compliance costs on charities and introduce privacy concerns as donors would have to provide their Social Security numbers to charities. Evidence suggests that being forced to report additional information on tax forms can improve compliance. Other compliance options would be to reduce the $500 threshold at which taxpayers are required to report detailed information about their noncash donations or to revise the form on which noncash donations are reported.32
Others have suggested that compliance could also be improved by tightening the valuation requirements for property donations (Independent Sector, 2005). The Pen-sion Protection Act of 2006 tightened the thresholds for imposing accuracy penalties on taxpayers, required qualifi ed appraisers to meet new education and experience requirements, and imposed new penalties on appraisers for valuation misstatements. The IRS promptly issued guidance followed by proposed regulations detailing new requirements and defi nitions of qualifi ed appraisals and qualifi ed appraisers. While the new penalties on appraisers strengthen their position relative to donors desiring overly generous valuations, it is too soon to know how well the new requirements will work in practice. Because of the diffi culty of valuing used clothing and monitoring compli-ance, a Joint Committee on Taxation (JCT) (2005) report included a proposal to limit deductions of clothing and household items to $500 per taxable year. The Independent Sector (2005) argued, however, that the cap would discourage donation of higher value and high quality clothing, while continuing to allow a deduction for items of little value. The extreme option would be to eliminate the deduction for donations of certain types of property. Proposals have been offered that would eliminate deductions for clothing and accessories, and/or household items. Recent changes in the Pension Protection Act of 2006 eliminated the deduction for clothing and household items unless the items are in good condition or better, effective for donations after August 17, 2006, but this seems to have had only a small temporary effect on the amounts of such deductions.
The tax expenditure for charitable contributions could be reduced and the effi ciency of the charitable deduction increased by imposing a fl oor under deductions for charitable contributions, including a possible separate fl oor for noncash donations. The President’s Advisory Panel on Federal Tax Reform (2005) proposed that the charitable deduction be limited to donations in excess of one percent of income. Others have suggested fi xed dollar fl oors. As shown by Ackerman and Auten (2006), a fl oor can result in a substan-tial effi ciency gain while still providing an incentive at the margin for most taxpayers
31 This approach would mark a major break with current policy, because the valuation burden would be shifted to charities and their agents. Charities have argued against such ideas, arguing that they would lead to disputes between charities and donors and to unwarranted pressure on the charities to infl ate values.
32 As noted earlier, Buchheit, et al. (2005) found that noncash deductions were bunched just below the threshold for detailed reporting. Tax forms could be revised to improve compliance as one section of the current form only applies to donations of partial interests valued at under $5,000, which are likely very rare, while not requiring VIN numbers or mileage for donated vehicles.

Tax Expenditures for Noncash Charitable Contributions 683
to increase charitable contributions. Because the compliance problems differ between cash and noncash contributions, separate fi xed dollar fl oors (such as $200) could be imposed under cash and noncash donations or a fl oor could be placed only on noncash donations (Brown, 2008).
Some proposals would reduce the cost of noncash deductions by limiting the deduc-tion on appreciated property to a taxpayer’s basis in the property.33 A Joint Committee on Taxation (2005) proposal would limit deductions to the lesser of fair market value or basis for most noncash donations, with exceptions for publicly traded securities and possibly property to be used to substantially further exempt purposes.34 Limiting the charitable deduction to basis, however, could result in reduced charitable donations of property, such as occurred after the Tax Reform Act of 1986 (Auten, Cilke, and Randolph, 1992; Clotfelter, 1990). As an alternative approach to addressing valuation problems associated with property gifts while maintaining the incentive for donating appreciated property, the President’s Advisory Panel on Federal Tax Reform (2005) suggested allowing owners of appreciated property to sell the property and claim the full sale proceeds as a deduction without being taxed on the capital gain. While this proposal would largely eliminate valuation issues, safeguards would be needed to ensure arms’ length transactions.
VII. SUMMARY AND CONCLUSIONS
This paper examines the tax expenditure for the deduction for noncash charitable donations using income tax data on taxpayer deductions for donations of property, and includes a detailed examination of donations of used vehicles. The fi ndings indicate that high-income taxpayers tend to donate appreciable property such as stock and real estate, while most of the donations of lower and middle-income taxpayers consist of used clothing and household items. One implication of this fi nding is that econometric estimates of the tax price elasticity of charitable contributions may be biased because of their implicit assumption that taxpayers are donating appreciated property. Taxpayer deductions claimed for donations of used vehicles are compared to private party internet sales of vehicles of the same make, model, and year. Consistent with other studies, the evidence suggests that the taxpayer valuations are much higher than the prices of most internet auction sales. Either taxpayers were donating very high quality vehicles (less likely) or they were overstating the true values of their vehicles (more likely).
33 Current limitations include the lower percentage of income limits on donations of appreciated property, and the stricter rules governing donations of certain appreciated property to private foundations.
34 Halperin (2002) argues that the correct approach for tax policy reasons would be to treat gifts of appreci-ated property as taxable events. Taxpayers would continue to claim a full fair market deduction, but would separately pay capital gains tax on the amount of appreciation. Imposing the capital gains tax would be more favorable for taxpayers than limiting the deduction to basis in some cases. Halperin considers an exception of for property uniquely important to the charitable mission of the recipient, such as art donated to an art museum.

National Tax Journal684
ACKNOWLEGEMENTS
A previous version of this paper was presented at the NBER Conference, “Incentive and Distributional Consequences of Tax Expenditures” held on March 27–29, 2008. This paper refl ects the views of the authors and does not necessarily refl ect the views or policies of the U.S. Department of the Treasury. The authors thank Janette Wilson and Michael Strudler of the IRS Statistics of Income Division for their work in pre-paring the noncash contributions data, Jim Poterba, Susan Brown, Eve Elgin, David Joulfaian, Don Kiefer, Ruth Madrigal, Karl Scholz, the conference participants, and two anonymous referees for helpful suggestions, and Brett Hollenbeck for his research assistance.
REFERENCES
Ackerman, Deena, and Gerald E. Auten, 2006. “Floors, Ceilings, and Opening the Door for a Non-Itemizer Deduction.” National Tax Journal 59 (3), 509–530.
Andrews, William D., 1972. “Personal Deductions in an Ideal Income Tax.” Harvard Law Review 86 (2), 309–385.
Auten, Gerald E., James Cilke, and William C. Randolph, 1992. “The Effects of Tax Reform on Charitable Contributions.” National Tax Journal 45 (3), 267–290.
Auten, Gerald E., Charles T. Clotfelter, and Richard L. Schmalbeck, 2000. “Taxes and Philanthropy among the Wealthy.” In Slemrod, Joel (ed.), Does Atlas Shrug? The Economic Consequences of Taxing the Rich, 392–424. Harvard University Press and Russell Sage Foundation, Cambridge, MA and New York, NY.
Auten, Gerald E., Holger Sieg, and Charles T. Clotfelter, 2002. “Charitable Giving, Income and Taxes: An Analysis of Panel Data.” American Economic Review 92 (1), 371–382.
Bakija, Jon, and Bradley T. Heim, 2011. “How Does Charitable Giving Respond To Incentives and Income? New Estimates From Panel Data.” National Tax Journal 64 (2, Part 2), 615–650.
Brown, Susan, 2008. “From Rags to Riches? Rethinking the Charitable Contribution Deduction for Donations of Used Clothes and Furnishings.” Unpublished manuscript. Washington, D.C.
Buchheit, Steve, Teresa Lightner, John Masselli, and Robert Ricketts, 2005. “Noncash Charitable Giving: Evidence of Aggressive Taxpayer Reporting Following a Compliance Change.” Journal of the American Taxation Association 27 (Supplement), 1–17.
Cabot, Tyler, 2002. “The Tow-Away Tax Break: Why Car Donation Programs Benefi t Everyone but the Charities They’re Intended to Help.” Washington Monthly, June, 39–42.
California Offi ce of the Attorney General, 2004. Attorney General’s Summary of Charitable Solicitations by Commercial Fundraisers, Supplemental Report: Donations of Personal Property, (Thrift Stores, Vehicle Donation Programs, etc.). California Department of Justice, Sacramento, CA.

Tax Expenditures for Noncash Charitable Contributions 685
Clotfelter, Charles T., 1990. “The Impact of the Tax Reform Act on Charitable Giving: A 1989 Perspective.” In Slemrod, Joel (ed.), Do Taxes Matter? The Impact of the Tax Reform Act of 1986, 203–235. MIT Press, Cambridge, MA.
Eaton, David H., and Martin I. Milkman, 2004. “An Empirical Examination of the Factors that In-fl uence the Mix of Cash and Noncash Giving to Charity.” Public Finance Review 32 (6), 610–630.
Feldstein, Martin, 1980. “A Contribution to the Theory of Tax Expenditures: The Case of Chari-table Giving.” In Aaron, Henry J., and Michael J. Boskin (eds.), The Economics of Taxation, Essays in Honor of Joseph Peckman, 99–122. Brookings Institution, Washington, DC.
Halperin, Daniel, 2002. “A Charitable Contribution of Appreciated Property and the Realization of Built-in Gains.” Tax Law Review 56, 1–34.
Haughney, Christine, 2008. “Not Your Style? They’ll Take It.” New York Times, April 10, http://www.nytimes.com/2008/04/10/garden/10recycle.html.
Independent Sector, 2005. Panel on the Nonprofi t Sector: Strengthening Transparency, Gov-ernance, and Accountability of Charitable Organizations (A Final Report to Congress and the Nonprofi t Sector). Independent Sector, Washington, DC.
Internal Revenue Service, 2004. Publication 4303: A Donor’s Guide to Car Donations. Internal Revenue Service, Washington, DC.
Internal Revenue Service, 2008. Publication 4303: A Donor’s Guide to Car Donations (Rev 03-2008). Internal Revenue Service, Washington, DC.
Joint Committee on Taxation, 2005. “Options to Improve Tax Compliance and Reform Tax Expenditures.” JCS-02-05. U.S. Government Printing Offi ce, Washington, DC.
Jones, Richard Lezin, David Cay Johnston, and Allan Kozinn, 2004. “A Violin’s Value, And What to Pay The I.R.S. Fiddler.” The New York Times, May 2, http://www.nytimes.com/2004/05/02/nyregion/a-violin-s-value-and-what-to-pay-the-irs-fi ddler.html.
O’Neil, Cherie, Richard Steinberg, and G. Rodney Thompson, 1996. “Reassessing the Tax-favored Status of the Charitable Deduction for Gifts of Appreciated Assets.” National Tax Journal 49 (2), 215–233.
President’s Advisory Panel on Federal Tax Reform, 2005. Simple, Fair, and Pro-Growth: Propos-als to Fix America’s Tax System. U.S. Government Printing Offi ce, Washington D.C.
Rowland, Kara, 2005. “Running on Empty.” The Washington Times, December 29, Business Section, 10.
Secondary Materials and Recycled Textiles Association, 2008. “Textile Recycling Fact Sheet.” Secondary Materials and Recycled Textiles Association, Bethesda, Maryland, http://www.textilerecycle.org/.
Sinclair, Matthew, 2000. “IRS Plans Inspections of Car Donations.” Nonprofi t Times, Morris Plains, NJ, (April), http://www.nptimes.com/apr00/aprfro1.html.

National Tax Journal686
Stokeld, Fred, 2005. “Charities Report Dip in Vehicle Donations in Wake of New Rules.” Tax Notes Today, 113–1 (June 14).
U.S. General Accounting Offi ce, 2003. Vehicle Donations: Benefi ts to Charities and Donors, but Limited Program Oversight. GAO-04-73. USGAO, Washington, DC.
U.S. General Accountability Offi ce, 2008. Vehicle Donations: Selected Charities Report Mixed Experiences after Changes in Vehicle Donation Rules. GAO-08-367. USGAO, Wash-ington, DC.
U.S. Senate Finance Committee, 2004. Keeping Bad Things from Happening to Good Charities. Hearing (June 22). U.S. Senate, Finance Committee, Washington, DC, http://fi nance.senate.gov/sitepages/hearing062204.htm.
Wilson, Janette, 2008. “Individual Noncash Contributions, 2005.” Internal Revenue Service Statistics of Income Bulletin, Spring, 68–89.
van der Westhuizen, Carlene, 2007. “Trade and Poverty: Case Study of the South African Clothing Industry.” Journal for Studies in Economics and Econometrics 31 (2), 109–124.
Wicks, Rick, and Arne Bigsten, 1996. “Used Clothing as Development Aid: The Political Economy of Rags.” Swedish International Development Cooperation Agency, Göteborg, Sweden.
APPENDIX
Cash income is defi ned to include wages and salaries, tip income, taxable and tax-exempt inter-est, dividend income, alimony, net income from businesses (sole proprietorships, partnerships, and S corporations), farm income, net rental income, royalty income, net capital gain or loss in AGI, other gain or loss, unemployment compensation, taxable and non-taxable pension and annuity income, Social Security benefi ts (including the non-taxable portion), and other income included in AGI. Net operating losses carried over from prior years are added back. Alimony payments are subtracted to refl ect available cash income. These sources of income are as reported on individual income tax returns and supplemented by data from information returns on Social Security benefi ts received but not subject to tax. The inclusion of tax-exempt interest and Social Security benefi ts are important improvements to income as generally measured on income tax returns. The inclusion of Social Security benefi ts is particularly important because it is the main source of income of many older households.
The property and donee categories are based on the defi nitions developed by the IRS Statistics of Income and described in Wilson (2008). The stock category includes mutual funds. Other investments include bonds, futures, life insurance policies, and partnerships. Real estate includes commercial and residential real property. In some tables, easements for building façades and land conservation are combined with other real estate. Electronics includes computers, televisions, DVD players, and similar items. Household items include appliances, furniture, toys, and books. Vehicles include cars, trucks, boats, planes, trains, and motorcycles. The national/international category includes the largest national and international charities, many with major programs to

Tax Expenditures for Noncash Charitable Contributions 687
collect and distribute clothing and household items. Public benefi t charities include those that provide individual or community benefi ts but are not included in other categories. This category includes homeless shelters, food banks, and political think tanks. In some analysis of donations of food, clothing, and household items, thrift stores other than those of the large national charities are broken out as a separate category.
