tax evasion, income inequality and opportunity … evasion, income inequality and opportunity cost s...
TRANSCRIPT

Tax Evasion, Income Inequality and Opportunity Costs of Compliance
Kim M. Bloomquist Senior Economist
Internal Revenue Service Office of Research Washington, D.C.
Paper presented at the 96th Annual Conference of the National Tax Association
Drake Hotel Chicago, IL
November, 2003

Abstract – This paper argues that widening income inequality contributes to the propensity to evade by both
reducing the probability of detection and increasing compliance opportunity costs. Lower detection probability
occurs as rising inequality gradually alters the composition of income from being employment-based (i.e.,
matchable) to investment-based (i.e., non-matchable). Greater economic polarization also increases the financial
strain on many former middle-class taxpayers, thus raising their opportunity cost of compliance. In addition, the
compliance opportunity costs for wealthy taxpayers also could increase if they perceive a growing exchange
inequity between their tax burdens and public sector benefits. This paper tests the hypothesis that rising income
inequality contributes to tax evasion in the United States. Empirical analysis for the period 1947-2000 finds a
positive correlation between the underreporting rate for wage and salary income and the top decile wage share. This
finding suggests that enforcement policies aimed at reducing income tax evasion may lose some effectiveness in an
environment of increasing inequality.

1
Tax Evasion, Income Inequality and Opportunity Costs of Compliance INTRODUCTION
If asked to identify a single indicator that best described the overall condition of the U.S. economy in recent
decades, a measure of income inequality would likely be among the top candidates. A recent study by Piketty and
Saez (2001) finds that between 1970 and 2000 the share of income (not including capital gains) reported by the top
decile of U.S. income tax filers grew from 31.5 percent to 43.9 percent. Similarly, the share of total wages going to
the top decile rose from 25.7 percent to 36.0 percent. In fact, as Figure 1 below shows, the level of wage inequality
has surpassed pre-World War II era levels.
FIGURE 1 TOP DECILE INCOME SHARES AND WAGE SHARES: 1927-2000
15%
20%
25%
30%
35%
40%
45%
50%
1927
1932
1937
1942
1947
1952
1957
1962
1967
1972
1977
1982
1987
1992
1997
Source: Piketty and Saez (2001), updated data from http://www.nber.org/data-appendix/w8467.
Shar
e (in
%)
Top Decile Income Share Top Decile Wage Share
It is surprising; therefore, that such a significant alteration of the economic landscape has largely escaped the
attention of economists who study the causes of tax evasion. A collection of papers in Slemrod, ed. (1996) and a
paper by Slemrod and Bakija (1999) examined how tax law changes in the 1980s may have contributed to the
growing income gap. However, as Figure 1 shows, the upturn in wage inequality preceded by nearly a decade much
of the major tax legislation passed during the Reagan Administration. Bishop, Chow, Formby and Ho (1994)
investigated the effects of evasion and tax noncompliance1 on the distribution of U.S. income and taxes. Their
1 Following Bishop, Chow, Formby and Ho (1994), this paper uses the terms evasion and noncompliance interchangeably. While taxpayer noncompliance may be intentional or unintentional and, in some cases, may actually result in overpayment of taxes; on balance, most noncompliance represents underreporting of income leading to underpayment of taxes.
2
analysis, using Taxpayer Compliance Measurement Program (TCMP) data for 1979, 1982 and 1985, found no
evidence that noncompliance had a statistically significant influence on tax progressivity. The question of reverse
causality; that is, how and to what extent widening pre-tax inequality may be contributing to the growth of tax
noncompliance, has been addressed only recently by Bloomquist (2003a).
Bloomquist (2003a) sees income inequality as a nexus between the two main competing views on income tax
evasion: expected utility (EU) theory and behavior theory. The economists’ EU model of individual tax evasion
(Allingham and Sandmo, 1972; Yitzaki, 1974) implies, ceteris paribus, a positive relationship between the
opportunity to underreport income and the act of doing so. Roth, Scholz, and Witte (1989, pg. 137) suggest middle-
income taxpayers have fewer opportunities to evade since the Internal Revenue Service (IRS) is able to match most
of their income using information documents (e.g., Form W-2 for wage and salary income). This view is supported
by Cox (1984) who observed a nonlinear relationship (inverted U-shape) between compliance rate and income using
1979 random audit data for U.S. taxpayers. This same phenomenon also has appeared in other TCMP studies
(Fratanduono, 1986).
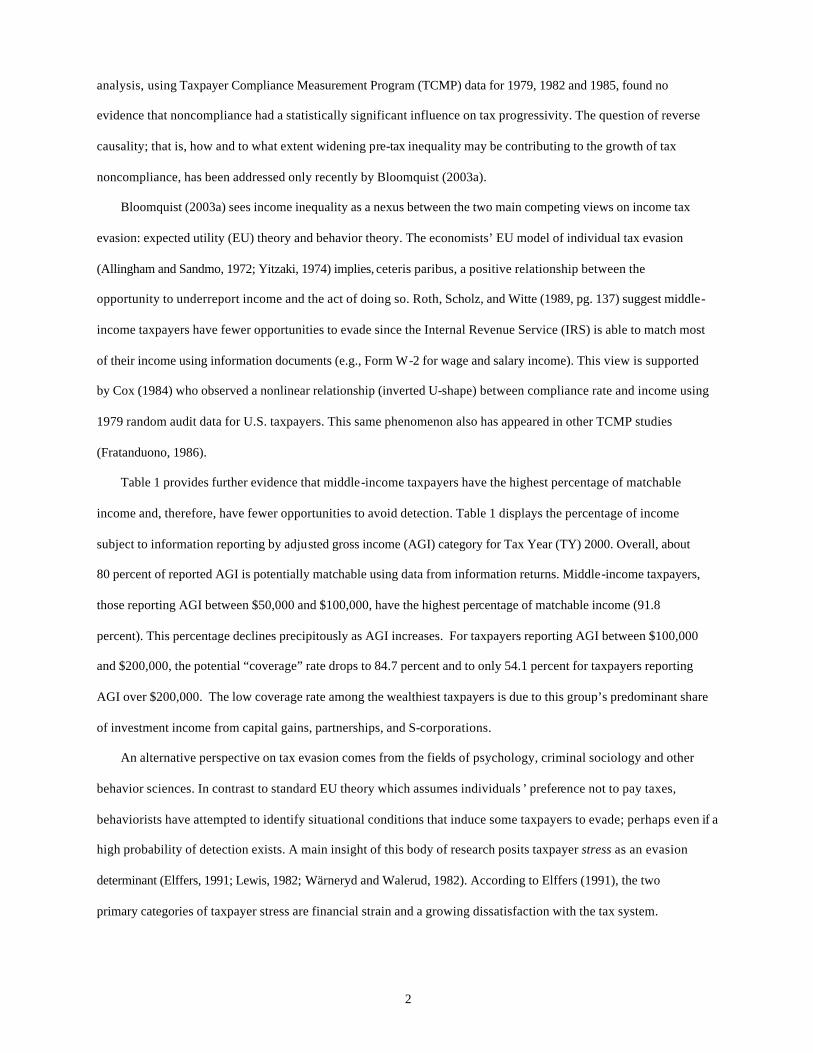
Table 1 provides further evidence that middle-income taxpayers have the highest percentage of matchable
income and, therefore, have fewer opportunities to avoid detection. Table 1 displays the percentage of income
subject to information reporting by adjusted gross income (AGI) category for Tax Year (TY) 2000. Overall, about
80 percent of reported AGI is potentially matchable using data from information returns. Middle-income taxpayers,
those reporting AGI between $50,000 and $100,000, have the highest percentage of matchable income (91.8
percent). This percentage declines precipitously as AGI increases. For taxpayers reporting AGI between $100,000
and $200,000, the potential “coverage” rate drops to 84.7 percent and to only 54.1 percent for taxpayers reporting
AGI over $200,000. The low coverage rate among the wealthiest taxpayers is due to this group’s predominant share
of investment income from capital gains, partnerships, and S-corporations.
An alternative perspective on tax evasion comes from the fields of psychology, criminal sociology and other
behavior sciences. In contrast to standard EU theory which assumes individuals ’ preference not to pay taxes,
behaviorists have attempted to identify situational conditions that induce some taxpayers to evade; perhaps even if a
high probability of detection exists. A main insight of this body of research posits taxpayer stress as an evasion
determinant (Elffers, 1991; Lewis, 1982; Wärneryd and Walerud, 1982). According to Elffers (1991), the two
primary categories of taxpayer stress are financial strain and a growing dissatisfaction with the tax system.

3
Category TotalUnder
$50,000$50,000 to
under $100,000$100,000 to
under $200,000$200,000
or moreNumber of returns 129,373,503 92,844,990 25,673,487 8,083,447 2,771,579 Share of returns 100.0% 71.8% 19.8% 6.2% 2.1%
Income Types That Are MatchableSalaries and wages $4,456,167,436 $1,514,257,995 $1,411,967,125 $769,635,607 $760,306,709Taxable interest $199,321,668 $60,487,940 $43,299,912 $29,828,456 $65,705,360Dividends $146,987,679 $27,255,346 $27,140,172 $26,866,194 $65,725,967State income tax refunds $18,309,835 $3,238,864 $5,775,709 $3,422,724 $5,872,538Capital gains distributions $15,802,819 $6,251,729 $4,823,521 $3,534,268 $1,193,301Taxable IRA distributions $98,966,628 $27,614,976 $31,201,565 $23,972,086 $16,178,001Taxable pensions and annuities $325,827,700 $142,318,759 $109,585,417 $51,914,489 $22,009,035Rents and royalties $83,534,529 $24,437,239 $19,478,866 $15,636,341 $23,982,083Unemployment compensation $16,913,306 $12,204,865 $3,700,671 $869,193 $138,577Taxable Social Security benefits $89,964,020 $21,365,588 $44,430,182 $16,763,164 $7,405,086Gambling earnings $16,762,039 $3,021,472 $3,029,717 $2,984,700 $7,726,150
Income Types That Are Not MatchableSchedule C $275,330,871 $98,152,285 $60,187,817 $51,657,045 $65,333,724Alimony received $6,178,184 $2,697,768 $2,211,451 $466,151 $802,814Taxable net capital gains and losses $642,224,339 $43,328,950 $48,940,773 $66,463,852 $483,490,764Sales of property other than capital assets $15,809,150 $6,064,989 $2,351,211 $1,994,882 $5,398,068Partnership and S-Corp net income $357,936,129 $45,557,672 $24,461,188 $40,461,648 $247,455,621Estate & trust net income $13,227,879 $1,566,039 $1,373,695 $1,619,191 $8,668,954Farm net income $25,575,353 $13,072,653 $6,436,020 $2,962,155 $3,104,525Other income $34,368,250 $8,544,001 $5,292,145 $5,130,592 $15,401,512
Total amount of matchable income $5,468,557,659 $1,842,454,773 $1,704,432,857 $945,427,222 $976,242,807Total amount of non-matchable income $1,370,650,155 $218,984,357 $151,254,300 $170,755,516 $829,655,982Total Income $6,839,207,814 $2,061,439,130 $1,855,687,157 $1,116,182,738 $1,805,898,789
Percent of income that is matchable 80.0% 89.4% 91.8% 84.7% 54.1%Source: Calculated by author using data from Table 1 of Campbell and Parisi (2002).
TABLE 1
* Net Income Plus Deficit Basis with losses added to income. This concept reflects the total amount that IRS must verify.
INCOME REPORTED ON TY00 INDIVIDUAL INCOME TAX RETURNS, BY TYPE OF INCOME AND BY SIZE OF ADJUSTED GROSS INCOME*(in Thousands of Dollars)

4
Financial strain refers to a deterioration of economic status. Taxpayers may be tempted to evade if their household
expenses exceed income. In a survey study of criminal behavior, Carroll (1989) notes that “the lack of money often
motivates the search for an opportunity to commit a crime.”
Taxpayer dissatisfaction may arise from several sources: the perception of unfair treatment, the complexity and
burden of the tax system, and the perception that the value of public goods and services received is less than taxes
paid (exchange inequity). Several studies have noted an apparent inverse relationship between exchange inequity
and support for taxation (Citrin, 1979; Alm, Bahl, and Murray, 1990; Scholz and Lubell, 1998). Lewis’s (1979)
survey results indicating that wealthier people “have a greater antipathy towards taxation” suggest taxpayer
dissatisfaction increases as the gap widens between taxes levied and the value of public goods received. Perhaps the
quintessential example of this attitude is Leona Helmsley’s proclamation that “only the little people pay taxes.”
Thus, both EU and behavior theorists might view inequality as an evasion determinant; however, each group
would see a different mechanism at work. On the one hand, behaviorists see the increased level of financial and
social stress associated with widening inequality as a motive for some individuals to begin or increase evasion. On
the other hand EU theorists, typically economists, observing a positive correlation between evasion activity and
inequality, might attribute the cause to falling transaction visibility. However, regardless of interpretation, more
inequality equates to mo re evasion.
Using time-series data for the period 1947-99, Bloomquist (2003a) found a statistically significant correlation
between income inequality and U.S. wage and salary underreporting in an extended EU modeling framework. This
paper updates these findings through the year 2000 and substitutes the top decile share of wage income from Piketty
and Saez (2001) for the inequality measure − U.S. Census Bureau Gini Coefficients − used in the earlier study. A
potential problem with the Census Bureau’s Gini Coefficients in times series studies is the lack of comparability
since 1993 due to a change in data collection procedures. Although Bloomquist (2003a) adjusted the Gini
Coefficients to account for this issue, there remains some uncertainty about the amount of adjustment required
(Ryscavage, 1995). Another issue relates to the use of Gini Coefficients based on income from sources other than
wages and salaries in a model to explain wage and salary underreporting. It is unclear whether a change in inequality
due to a change in net business income, for example, should necessarily influence the reporting of wages and
salaries.

5
The remainder of the paper is organized as follows. The next section provides further rationale for including
income inequality as a determinant of tax noncompliance. Section three describes the data and analytical approach
used to explain changes in wage and salary underreporting from 1947-2000. Section four presents the estimation
results. The fifth and final section summarizes the study’s main findings and draws some implications for tax
administrators.
THE RELATIONSHIP BETWEEN INCOME INEQUALITY AND REPORTING NONCOMPLIANCE
This section presents some additional evidence for treating income inequality as a determinant of reporting
noncompliance. Specifically, it is argued that widening inequality: 1) reduces transaction visibility as non-wage
sources of income gradually comprise a larger share of total income and 2) increases compliance opportunity costs
by exposing greater numbers of taxpayers to financial strain and exchange inequity.
Inequality and Transaction Visibility2
One of the few generally accepted facts in the literature on tax compliance economics is the existence of a
positive relationship between transactions visibility and reporting compliance. Over the years, various government
and academic studies have affirmed this relationship (Klepper and Nagin, 1989; Long and Swingden, 1990;
Andreoni, Erard, and Feinstein, 1998). Random taxpayer audits have consistently shown higher compliance rates
among income items subject to third-party information reporting and withholding (i.e., matchable) versus
nonmatchable sources of income (Christian, 1994). In the 1988 TCMP study, the average weighted net misreporting
percentage of reported income was 1.8 percent for matchable income and 22.6 percent for nonmatchable income
(Internal Revenue Service, 1996).3
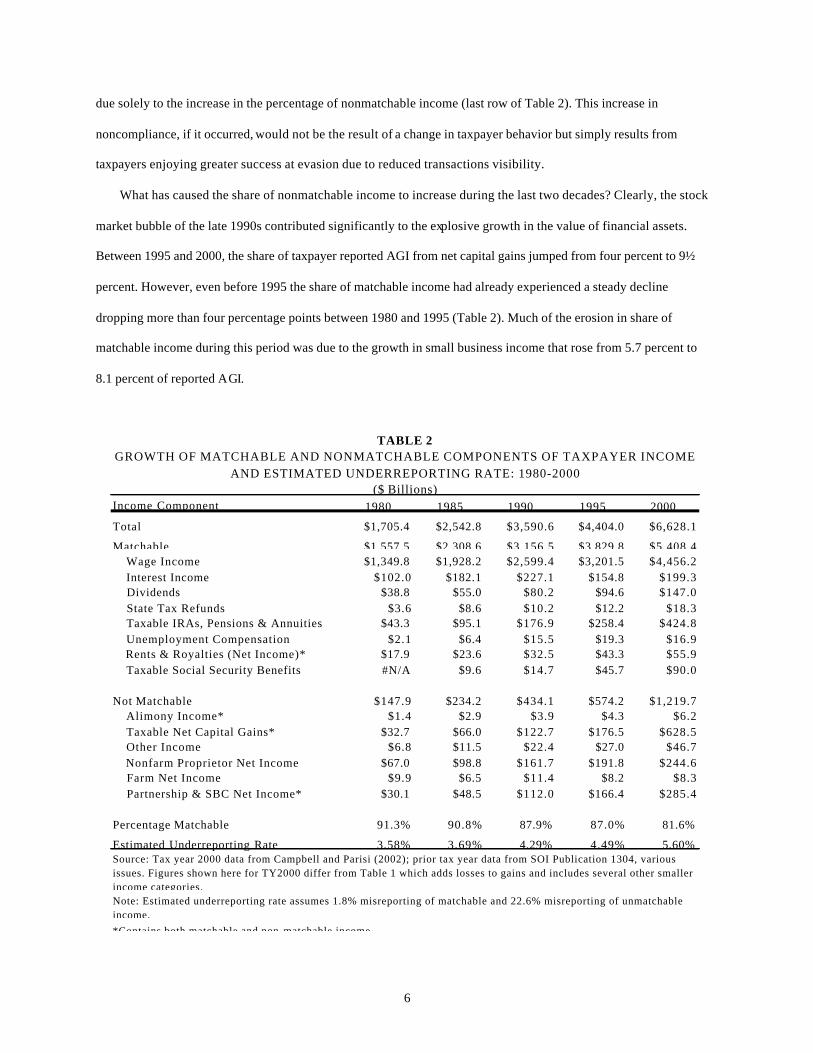
Table 2 shows the trend in matchable and nonmatchable sources of income between 1980 and 2000. In 1980,
91.3 percent of total reported taxp ayer income was matchable. By 2000, this percentage had fallen nearly ten
percentage points to 81.6 percent. The principal factor responsible for this trend was the faster than average growth
in the nonmatchable income components of taxable net capital gains and partnership and small business corporation
(SBC) net income.
Holding constant the 1988 TCMP misreporting rates for matchable and nonmatchable income, it is estimated
that between 1980 and 2000 overall income underreporting rose from 3.6 percent to 5.6 percent of reported income
2 The following material draws heavily from Bloomquist (2003b). 3 The estimate for nonmatchable income excludes Informal Supplier Income. Estimates reflect weighting based on share of reported AGI.
6
due solely to the increase in the percentage of nonmatchable income (last row of Table 2). This increase in
noncompliance, if it occurred, would not be the result of a change in taxpayer behavior but simply results from
taxpayers enjoying greater success at evasion due to reduced transactions visibility.
What has caused the share of nonmatchable income to increase during the last two decades? Clearly, the stock
market bubble of the late 1990s contributed significantly to the explosive growth in the value of financial assets.
Between 1995 and 2000, the share of taxpayer reported AGI from net capital gains jumped from four percent to 9½
percent. However, even before 1995 the share of matchable income had already experienced a steady decline
dropping more than four percentage points between 1980 and 1995 (Table 2). Much of the erosion in share of
matchable income during this period was due to the growth in small business income that rose from 5.7 percent to
8.1 percent of reported AGI.
Income Component 1980 1985 1990 1995 2000
Total $1,705.4 $2,542.8 $3,590.6 $4,404.0 $6,628.1
Matchable $1,557.5 $2,308.6 $3,156.5 $3,829.8 $5,408.4 Wage Income $1,349.8 $1,928.2 $2,599.4 $3,201.5 $4,456.2 Interest Income $102.0 $182.1 $227.1 $154.8 $199.3 Dividends $38.8 $55.0 $80.2 $94.6 $147.0 State Tax Refunds $3.6 $8.6 $10.2 $12.2 $18.3 Taxable IRAs, Pensions & Annuities $43.3 $95.1 $176.9 $258.4 $424.8 Unemployment Compensation $2.1 $6.4 $15.5 $19.3 $16.9 Rents & Royalties (Net Income)* $17.9 $23.6 $32.5 $43.3 $55.9 Taxable Social Security Benefits #N/A $9.6 $14.7 $45.7 $90.0
Not Matchable $147.9 $234.2 $434.1 $574.2 $1,219.7 Alimony Income* $1.4 $2.9 $3.9 $4.3 $6.2 Taxable Net Capital Gains* $32.7 $66.0 $122.7 $176.5 $628.5 Other Income $6.8 $11.5 $22.4 $27.0 $46.7 Nonfarm Proprietor Net Income $67.0 $98.8 $161.7 $191.8 $244.6 Farm Net Income $9.9 $6.5 $11.4 $8.2 $8.3 Partnership & SBC Net Income* $30.1 $48.5 $112.0 $166.4 $285.4
Percentage Matchable 91.3% 90.8% 87.9% 87.0% 81.6%
Estimated Underreporting Rate 3.58% 3.69% 4.29% 4.49% 5.60%
TABLE 2GROWTH OF MATCHABLE AND NONMATCHABLE COMPONENTS OF TAXPAYER INCOME
AND ESTIMATED UNDERREPORTING RATE: 1980-2000($ Billions)
Source: Tax year 2000 data from Campbell and Parisi (2002); prior tax year data from SOI Publication 1304, various issues. Figures shown here for TY2000 differ from Table 1 which adds losses to gains and includes several other smaller income categories.Note: Estimated underreporting rate assumes 1.8% misreporting of matchable and 22.6% misreporting of unmatchable income.*Contains both matchable and non-matchable income.

7
The secular trend of increasing nonmatchable income appears to be related to widening income inequality.
According to the IRS’ Statistics of Income (SOI), the share of AGI (including capital gains) of the top five percent
of taxpayers with highest reported incomes rose from 24.1 percent in 1986 to 35.3 percent in 2000.4 However, as the
distribution of income has shifted to the wealthiest top five percent of households in recent years, this group’s share
of nonmatchable income has increased even faster.
Table 3 shows that between 1980 and 2000 the average annual rate of growth (AAR) for nonmatchable income
was 9.2 percent (inflation-adjusted dollars) for the top five percent of taxpayers with the highest reported AGI
versus 4.2 percent for the bottom 95 percent of taxpayers. Moreover, while the share of nonmatchable income grew
for both groups, the top five percent of taxpayers saw their nonmatchable income grow from 19.1 percent of total
AGI in 1980 to 37.9 percent in 2000, nearly doubling in two decades. The increasing share of nonmatchable income
that has accompanied the trend of widening inequality may have brought about a surge in evasion activity. However,
there is no hard evidence to confirm that this, in fact, has occurred.
Taxpayer AGI Category 1980 1990 2000 AARAll Taxpayers Total AGI $3,564.0 $4,730.7 $6,628.1 3.2% Matchable AGI $3,254.9 $4,158.8 $5,408.4 2.6% Nonmatchable AGI $309.1 $571.9 $1,219.7 7.1% % Nonmatchable AGI 8.7% 12.1% 18.4%
Top 5% Taxpayers Total AGI $761.3 $1,305.8 $2,239.9 5.5% Matchable AGI $616.1 $961.7 $1,391.7 4.2% Nonmatchable AGI $145.2 $344.0 $848.2 9.2% % Nonmatchable AGI 19.1% 26.3% 37.9%
Bottom 95% Taxpayers Total AGI $2,802.6 $3,424.9 $4,388.2 2.3% Matchable AGI $2,638.7 $3,197.0 $4,016.7 2.1% Nonmatchable AGI $163.9 $227.9 $371.5 4.2% % Nonmatchable AGI 5.8% 6.7% 8.5%
TABLE 3GROWTH IN MATCHABLE AND NONMATCHABLE INCOME FOR TOP FIVE
PERCENT AND BOTTOM 95 PERCENT OF TAXPAYERS:TAX YEARS 1980, 1990 AND 2000
(Billion $2000)
Source: SOI Publication 1304 for 1980 and 1990; Campbell and Parisi, 2002. CPI-U deflator used to adjust for inflation.
4 Internal Revenue Service, Statistics of Income Division, Unpublished Statistics, September 2002.

8
Inequality and Compliance Opportunity Costs
In a study of criminal behavior Carroll (1989) found, perhaps unsurprisingly, that an overriding factor in the
decision to commit a crime is the lack of money. Both Fajnzylber, Lederman, and Loayza (2002) and Ehrlich (1973)
found a positive correlation between crime rates and income inequality and attribute the growing incidence of crime
to a lack of economic opportunity. Witte and Woodbury (1985) report higher tax compliance in areas with low
unemployment rates and poverty. In a study of tax return data for small corporations, Rice (1992) found firms whose
profit margins fell below their industry median exhibited higher rates of noncompliance than firms with above
average profits. What this research suggests is some individuals with limited resources have a higher propensity to
evade due to their vulnerability to financial strain. Their need for money in the present outweighs the expected
future costs of detection and punishment. In other words, such individuals have a high discount rate that favors
present over future consumption.
However, financial strain is not the only factor that may affect compliance opportunity costs. The perception of
an ever-increasing gap in the reciprocal relationship between taxpayer and government (exchange inequity) has been
cited by Citrin (1979) as a cause of revolt among high-income taxpayers (the so-called “Revolt of the Haves”).
Scholz and Lubell (1998) observed that wealthy taxpayers who benefited from the Tax Reform Act (TRA) of 1986
exhibited an improved attitude toward compliance and the opposite response from those whose tax obligations
increased under TRA 1986. These empirical findings support other theoretical work (Falkinger, 1988; Pommerehne,
Hart, and Frey, 1994) that also link evasion activity to taxpayers’ cost-benefit assessment of public sector goods and
services. However, unlike some individuals who might be motivated by a specific “need” for money that would
otherwise be allocated to taxes, taxpayers reacting to perceived exchange inequity are simply concluding that the
opportunity cost associated with full compliance outweighs the possibility of detection and fines at some future date.
Modifying the standard EU model of evasion to take into account compliance opportunity costs, the expected
income from evasion (YE) is defined as
( )( ) nE rpzzyY −+Φ+−+−= 1)1(]1[ τττ
Where p is the probability of detection (usually equated with the “audit” rate), t is the marginal tax rate, y is annual
total taxable income, z is the amount of income underreported and F is the penalty per dollar evaded. If successful at
avoiding detection, the taxpayer enjoys zt more income than if fully compliant. If audited with probability p, the
taxpayer remits the tax deficiency (zt) plus an additional amount, zF , which represents the penalty for

9
noncompliance. The term ( )( ) nrpz −+Φ+ 1τ is the present value of the additional taxes and penalties imposed
upon detection n time periods in the future. The present value of these future costs is determined using the discount
rate r which varies positively with the taxpayer’s opportunity cost of compliance.
Taxpayers will elect to underreport income if the expected income from evasion exceeds income under full
compliance. In mathematical terms,
( )( ) )1(1)1(]2[ ττττ −>+Φ+−+− − yrpzzy n
Simplifying, we obtain the following expression
( )( ) 01]3[ >+Φ+− −nrpzz ττ
Expression 3 implies that a rational individual will evade if the net present value of the additional income from
evasion is greater than zero. This mo del predicts that even with 100 percent probability of detection, individuals
with sufficiently high discount rates (and/or a long detection lag time) would be willing to accept reduced income in
the future for more income in the present. This result is consistent with a two period dynamic model described in
Andreoni (1992).
It is difficult to subject expression 3 to an empirical test due to our inability to directly observe r, the
individual’s discount rate.5 However, data are available that allow us to determine if the hypothesized positive
relationship between compliance opportunity costs and underreporting behavior has empirical support. Table 4
displays selected characteristics of U.S. tax filers who received Form W-2 wage and salary income in TYs 1998,
1999 and 2000. Column 1 of Table 4 is the wage category determined by summing wage and salary earnings
reported by employers to IRS on Form(s) W-2. Column 2 is the number of filers with Form W-2 income. Columns 3
and 4 are the number and percentage of filers whose reported amount of wage and salary income on their income tax
return (Form 1040) was less than the summed amount on all Form(s) W-2 for the same tax year. Column 5 is the
total amount of wage and salary income reported on Form(s) W-2 and column 6 is the amount underreported. 6
Column 7 is the gross underreporting percentage (i.e., column 6 divided by column 5) and column 7 is the average
number of W-2 forms per filer in each wage category.
5 To the author’s knowledge, there is also no known data concerning changes in n, the time between an act of evasion and its detection. 6 This is the amount of wage and salary income underreported prior to enforcement actions by the IRS, such as Automated Underreporter (AUR) document matching program.

10
WageCategory
Filers WithW-2 Income Count Percent
Total W-2 Income
($Millions)
Underreported W-2 Income($Millions)
Gross Underreporting
Percentage
Average No. Forms W-2
per Filer
Tax Year 1998
<$10K†
25,403,983 2,732,682 10.8% $116,147.3 $2,510.2 2.2% 1.02
$10-20K†
19,461,379 1,847,643 9.5% $289,469.1 $3,748.8 1.3% 1.08
$20-$30K†
15,528,803 1,008,498 6.5% $384,625.2 $3,008.0 0.8% 1.15 $30-50K
‡19,321,606 887,079 4.6% $754,980.9 $4,357.7 0.6% 1.36
$50-75K 12,335,159 478,883 3.9% $751,272.2 $5,144.3 0.7% 1.62 $75-100K 5,185,528 208,470 4.0% $442,970.5 $3,972.2 0.9% 1.72 >$100K* 4,890,148 325,535 6.7% $936,449.0 $14,025.6 1.5% 1.63
Total 102,126,605 7,488,789 7.3% $3,675,914.3 $36,766.8 1.0% 1.24
Tax Year 1999
<$10K†
25,496,143 3,035,859 11.9% $118,124.7 $2,993.6 2.5% 1.02
$10-20K†
19,417,410 2,022,455 10.4% $289,416.5 $4,218.2 1.5% 1.07
$20-$30K†
15,872,367 1,073,184 6.8% $393,080.5 $3,184.3 0.8% 1.13
$30-50K‡
20,595,274 926,542 4.5% $804,956.7 $5,233.1 0.7% 1.30 $50-75K 13,402,872 555,670 4.1% $818,765.9 $5,736.4 0.7% 1.60 $75-100K 5,812,667 270,283 4.6% $498,118.0 $5,839.4 1.2% 1.72 >$100K 5,621,837 278,843 5.0% $1,058,187.0 $18,315.2 1.7% 1.64
Total 106,218,571 8,162,836 7.7% $3,980,649.2 $45,520.2 1.1% 1.24
Tax Year 2000
<$10K†
24,918,770 2,994,285 12.0% $116,132.8 $3,234.2 2.8% 1.02
$10-20K†
19,070,828 2,085,346 10.9% $283,689.6 $4,638.0 1.6% 1.06
$20-$30K†
16,320,238 1,202,025 7.4% $403,811.0 $4,189.9 1.0% 1.11
$30-50K‡
21,002,457 1,169,242 5.6% $817,826.0 $6,794.4 0.8% 1.27 $50-75K 13,412,162 487,295 3.6% $818,362.2 $4,404.7 0.5% 1.56 $75-100K 6,445,118 244,367 3.8% $551,165.0 $3,294.5 0.6% 1.70 >$100K 6,587,918 295,725 4.5% $1,331,691.0 $11,445.6 0.9% 1.64
Total 107,757,489 8,478,285 7.9% $4,322,677.6 $38,001.2 0.9% 1.24
Source: Compliance Research Information System (CRIS)
† Indicates both Underreporter Percentage and Underreporting Percentage are significant at the 95% confidence level.
‡ Indicates Underreporter Percentage is significant at the 95% confidence level.
* Indicates Underreporting Percentage is significant at the 95% confidence level.
REPORTING CHARACTERISTICS OF U.S. TAX FILERS WITH FORM W-2 WAGE AND SALARY INCOME: TY1998-2000
Underreporter
TABLE 4
The data in Table 4 show that filers with less than $30,000 in Form W-2 wage and salary income underreport
with greater “frequency” and as a larger percentage of income. In all three years, filers with less than $30,000 in
wages exhibited higher levels of underreporting noncompliance versus those with more than $50,000 in wage
income. Filers with $30,000 to $50,000 in W-2 income appear to be a borderline category whose members
underreport with greater frequency but not more so as a fraction of total income than those with higher incomes.

11
Only in 1998, do filers with annual W-2 wages in excess of $100,000 underreport a larger percentage of their
earnings than filers in the next lowest wage category; otherwise, the reporting characteristics of the highest wage
group are not statistically different from those filers with wage and salary income between $75,000 and $100,000.
We cannot infer from the data in Table 4 that the more frequent underreporting behavior of low wage filers is
willful or unintentional, or even whether this behavior is economically motivated versus some other reason (e.g.,
unfamiliarity with tax laws). However, the pattern of behavior is consistent with the view that underreporting is
more prevalent among individuals subject to financial strain. Further support for this view is indicated by the high
concentration of individuals claiming head of household filing status among those who underreport. In TY 2000,
filers claiming head of household filing status accounted for about 14 percent of all individual returns, but
represented 21.4 percent of returns with underreported W-2 income.
Table 4 also indicates some weak evidence of underreporting among high wage filers. The underreporting
percentage for TY 1998 filers with more than $100,000 in W-2 wages is statistically significant at the 95 percent
confidence level, although results for TY 1999 and 2000 are inconclusive. As a group, high income filers do not
appear to have more W-2 forms than filers in adjacent income categories. Therefore, having more sources of wage
income does not explain the occasional tendency to underreport. Nor is it likely that financial strain is a problem for
most filers in this category. However, filers in the highest wage category could have greater variation in year-to-year
income that might explain this behavior. Unfortunately, the source for Table 4 − the Compliance Research
Information System (CRIS) − does not contain panel data, so this hypothesis could not be tested.
Whether the weak hints of underreporting by some high wage earners shown in Table 4 are evidence of a
response to exchange inequity remains an open question. CRIS data are based on a stratified random sample of
approximately 130,000 taxpayer returns in each tax year. Further analysis using a larger data set may yield more
statistically robust results but are unlikely to reveal an underlying motive or motives.
Summary
The foregoing discussion has argued that the recent trend of widening income inequality in the U.S. may be
contributing to evasion propensities by reducing transaction visibility and increasing compliance opportunity costs.
Taxpayers in the top five percent of reported AGI saw their nonmatchable income increase from 19.1 percent of
total AGI in 1980 to 37.9 percent in 2000, nearly doubling in two decades. Standard EU theory suggests this
development should lower compliance among filers so affected. Also, TY 1998-2000 tax returns exhibit higher rates

12
of wage and salary underreporting among filers with less then $30,000 in wage income. This empirical evidence,
while not conclusive, supports the hypothesis of higher misreporting among low-income individuals most likely to
have high compliance opportunity costs.
DESCRIPTION OF DATA AND ANALYTICAL APPROACH7
Bloomquist (2003a) estimated a model to explain the variation in the underreporting rate for U.S. wage and
salary income for the period 1947-1999. This paper updates those findings through TY 2000. The decision to limit
the analysis to wage and salary income underreporting was made for several reasons. First, although TCMP audits
find low noncompliance rates for wage and salary income (about one percent, similar in magnitude to the
underreporting rates shown in Table 4), this category still accounted for a significant share of underreported income
by filers ($19.9 billion or 9.2 percent of net misreported income in 1988) (IRS, 1996). When nonfilers are added, the
underreporting rate increases to about four percent of total wages and salaries (see column D of Table A-1).
Second, wage and salary income is the single most frequently reported category of income on tax returns. Over
85 percent of all individual tax returns in 2000 reported at least some wage and salary income (Campbell and Parisi,
2002).
Third, using wage and salary income rather than total AGI simplifies and reduces the number of required
predictor variables. Rhoades (1999) recently proposed an extension of the standard EU model that allows detection
probability to vary depending on each taxpayer’s mix of income (i.e., matchable and nonmatchable). However, since
wage income has been subject to information reporting (and withholding) for the entire period of study, the variable
for detection probability may be defined simply as the audit rate.8 Also, research on the deterrence impact of
penalties has found little significance between the size of penalties and compliance (Roth, Scholz, and Witte, 1989).
Those studies that have included a penalty predictor use assessed penalties (Crane and Nourzad, 1986; Engel and
Hines, 1998). However, there is often little correspondence between the amount of penalties assessed and those
actually collected.9 Based on this reasoning, the decision was made to exclude penalty rates from the analysis.
The last, and perhaps most salient, issue is reliability of the evasion measure. While most experts believe that
randomly audited tax returns provide the most reliable measure of tax noncompliance (Andreoni, Erard, and
Feinstein, 1998), the small number of observations from past TCMP studies limits the use of these data for time-
series analysis. The U.S. Bureau of Economic Analysis (BEA) produces an alternative measure of misreported
7 The material in this section closely follows the discussion in Bloomquist (2003a). 8 The rationale for this assumption is given in a later section. 9 This would be even more difficult to determine for wage and salary underreporting alone.

13
income. This measure, known as the AGI gap, is defined as the difference between BEA’s estimate of AGI and
taxpayer-reported AGI (Parker, 1987).
Although the total AGI gap has been used as a compliance measure in previous empirical research (Crane and
Nourzad, 1986; Engel and Hines, 1998), its reliability as a measure of tax evasion is questionable. This is because a
significant share of the total AGI gap is due to nonfarm proprietors’ income that relies on data from individual tax
returns.10 In contrast, the wage and salary component of the AGI gap (henceforth called the “wage gap”) uses data
reported by employers to the U.S. Bureau of Labor Statistics.
The wage gap is not an estimate of underreported wage and salary income, as it includes income earned by low-
income individuals who are not required to file tax returns. This is because these so-called “legitimate nonfilers” are
covered by BEA’s personal income estimates, but not necessarily by IRS’ AGI totals that include only incomes
reported on tax returns that are filed.11 The wage gap also reflects errors and omissions in the estimates of
reconciliation items and the net effects of errors in BEA’s personal income and IRS’ AGI estimates. Despite these
differences, however, the wage gap can provide an independent estimate of underreporting if adjusted for the
variation due to low-income legitimate nonfilers. Adjustment of the wage gap is discussed in the following section.
Description of the Data BEA Wage Gap: The relative wage gap is the dependent variable in this study. The latest published estimates of the
wage gap (Park, 2002) cover the period from 1959 to 2000. Upon written request, BEA will provide data beginning
in 1947. Figure 2 displays the BEA wage gap in nominal dollars (line) and as a percent of BEA -adjusted wages (bar)
for the period 1947 to 2000. From the late 1940s to the early 1950s, the relative wage gap decreased from about
three percent of wages to one percent by 1982. In subsequent years, the relative wage gap ascended rapidly reaching
an all-time high of nearly six percent in 1999. In 2000, the nominal wage gap was estimated to be $257.1 billion.
As previously mentioned, the wage gap is not an accurate measure of underreport ing since BEA includes
income from low-wage earners who are exempt from filing a tax return. In order to account for the presence of these
legitimate nonfilers, the reported wage gap was adjusted using audit data for a sample of nonfilers from the 1988
TCMP study (Erard and Ho, 2001). The resulting “modified” wage gap is used in the remainder of this study. The
methodology used to derive the modified wage gap is described in the Appendix.
10 In 2000, approximately 52 percent of the AGI gap was due to nonfarm proprietors’ income. 11 Some low-income individuals who are not required to file returns nevertheless file to claim refunds or the Earned Income Tax Credit (EITC). The incomes reported by these individuals are included in IRS’ AGI totals.

14
FIGURE 2BUREAU OF ECONOMIC ANALYSIS (BEA) WAGE GAP : 1947-2000
0%
1%
2%
3%
4%
5%
6%
1947 1957 1967 1977 1987 1997
Year
Relative Wage Gap (Bar)
$0
$50
$100
$150
$200
$250
$300$ Billions (Line)
Source: Park (2002) and personal correspondence with Thae Park for data prior to 1959.
Average Marginal Tax Rate: Theoretical studies indicate that tax rates have an ambiguous effect on compliance,
depending upon taxpayer attitudes toward risk, the structure of the penalty function, and other criteria (Andreoni,
Erard, and Feinstein, 1998; Yitzaki, 1974). The results of empirical research are equally mixed. Clotfelter (1983)
finds a positive correlation between marginal tax rates and evasion using 1979 TCMP data. Feinstein (1991), using
pooled 1979 and 1982 TCMP data reports the opposite relationship.
The tax rate used in this study is a weighted average marginal tax rate on ordinary income (excluding Social
Security and Medicare).12 The weights represent the share of total family income received by each quintile and the
top five percent of families as reported by the U.S. Census Bureau. Historical average marginal tax rates range from
a minimum of 21.3 percent in 1965 to a maximum of 36.1 percent in 1981. During the 1970s and early 1980s
taxpayers experienced the phenomenon known as “bracket creep” as inflation pushed them into higher tax brackets
although their real income may not have increased. For example, the average marginal income tax rate for the period
1947 to 1966 was 24.9 percent compared to 30.0 percent from 1967 to 1986. Bracket creep was eliminated with the
passage of TRA 1986, which adjusted income tax brackets for inflation. From 1987 to 2000, the average marginal
tax rate was 25.8 percent.
The data indicate a significant negative correlation between the average marginal tax rate and modified wage
gap (r = -0.536) during the period from 1947 to 2000. In the years since 1987, the average marginal tax rate has
12 This analysis excludes payroll taxes since, for most wage earners, these taxes are withheld by the employer and are not reported on the individual’s tax return.

15
remained relatively stable with only slight variation, mainly due to shifts in the distribution of income while the
wage gap has continued to climb.
The negative correlation between the tax rate and underreporting of wage income may seem counterintuitive at
first glance. However, higher marginal rates increase the amount withheld from paychecks. This may cause fewer
taxpayers to be in a balance due status at the end of the year and, therefore, less reluctant to report their true total
income. This would occur if the rate of withholding rises faster than the effective tax rate (ETR). There is some
evidence that this took place. The average ETR increased from 9.5 percent for the period 1950-66 to 9.9 percent for
the period 1967-86 (IRS, 2001, Table 8, p. 282). In contrast, the average marginal tax rate rose from 24.9 percent to
30.0 percent during the same period or an increase five times greater than the increase in the ETR. Therefore,
taxpayer withholding of wages appears to have increased faster than the effective tax burden during this period.
The hypothesized enhanced compliance resulting from a change in balance due status has been explained in
terms of prospect theory (Kahneman and Tversky, 1979). Taxpayers perceive a balance due as a loss, and become
more willing to take a “risky” position when reporting income and deductions. Several studies have noted evidence
of a positive correlation between balance due status and reporting noncompliance (Christian, 1994; Chang and
Schultz, 1990). As an additional check, the correlation coefficient between the average marginal tax rate and percent
of returns with a balance due for the period 1947 to 1986 is –0.499 and significant at the one percent level. This may
at least partly explain the negative correlation between tax rates and the relative wage gap, especially in the period
before 1987. Consistent with theoretical studies, however, the expected sign for the tax rate variable is assumed
indeterminate.
Wage and Salary Income: The income variable used in this analysis is real median wage and salary income. This
variable is a weighted average of median wage and salary income for male and female workers reported in the
Census Bureau’s March Current Population Survey. The correlation coefficient between the wage gap and median
wage and salary income is -0.003 and is not statistically significant. However, the direction of the sign is consistent
with earlier work indicating that increases in true income lead to less than proportionate increases in the level of
underreporting (Crane and Nourzad, 1986). A negative sign on this variable is anticipated for the estimated model.
Probability of Detection: Third-party reporting of income and withholding may influence evasion behavior by
raising the taxpayer’s perceived as much as the actual risk of detection. Taxpayers have little information by which
to judge the efficacy of the tax authority’s use of information documents. However, this uncertainty may work in the
favor of IRS. According to Long and Swingen (1990), “If the taxpayer knows or even just thinks that the tax agency

16
already has the information, they are less likely to deliberately cheat.” In the only detailed study to date on the
impact of information document matching on reporting noncompliance, Plumley (1996) found that the IRS’
computerized document matching program had no statistically measurable impact on compliance during the period
1982 to 1991, despite the fact that the number of information documents processed per return increased by nearly 60
percent (from five to eight) during this time period. Plumley concludes, “Taxpayers apparently assumed that the
matching was already in place, judging from the earlier compliance statistics.”
Following this earlier research, the present study assumes that the compliance effect of third-party reporting
historically has resulted mainly from its presence, rather than from its effectiveness in identifying evasion.13
Therefore, this study assumes that variations in the wage gap due to detection probability from 1947 to the present
may be attributed to changes in the audit rate. For this study, an audit is defined as the so-called district or “face-to-
face” audit with adjustments as recommended by Engel and Hines (1998) for years before 1954. Although the IRS’
definition of what constitutes an “audit” has changed over the years, the concept that receives the most media
attention is the probability of the traditional “face-to-face” audit. Presumably, this is the information taxpayers have
at hand when deciding whether to evade.
Researchers have noted the likely endogeneity of audit rates and evasion, especially in studies of evasion by
individuals. Several alternative approaches have been proposed to address this issue (Plumley, 1996; Dubin, Graetz,
and Wilde, 1990). However, at the national level the number of audits performed appears largely due to budgetary
constraints rather than to the incidence of noncompliance. If this were not the case, there should have been a large
jump in audits beginning in the early 1980s. The fact that this did not occur reinforces the notion that, at least with
national level data, the issue of endogeneity may be ignored.
IRS publishes its audit rates on a fiscal year basis. This means that the published audit rate generally refers to
the previous year’s tax returns. In addition, audit rates lag a year in publication, meaning that taxpayers generally
only know about audit coverage from two years ago. If taxpayers base their compliance decisions on the latest
available information, then a two-year lag seems appropriate. This is the approach taken in this study. Over the study
period, the audit ratet-2 displays a negative correlation with the wage gap (r = -0.335). A negative sign is expected
for the regression coefficient.
Top Decile Wage Share: The inequality measure used for this study is the top decile wage share (pre-tax) from the
study by Piketty and Saez (2001). Their measure is based on tax return data reported by U.S. taxpayers. The Pearson
13 This does not imply that computerized matching of information documents is not an effective enforcement tool. However, the ability of the IRS to fully exploit automated technology must be placed in context with the availability of human resources to work specific cases.

17
correlation coefficient between this variable and the modified wage gap is 0.493. A positive sign is expected on the
regression coefficient for the inequality measure.
There is no single explanation for the rise in U.S. wage inequality over the past two decades, although Burtless
(1999) attributes much of this increase to changing household composition such as the shift from two-parent to
single-parent families and a higher correlation of husband and wife earnings. Piketty and Saez (2001) suggest
changing social norms regarding the acceptability of very high pay could explain most of the remaining increase in
the share of wage and salary income going to the top ten percent of earners.
Unemployment Rate: Finally, the unemployment rate is included as a predictor variable to account for variation in
the modified wage gap not due to evasion. Although the modified wage gap is adjusted to account for the unreported
income of legitimate nonfilers, the lack of annual data on nonfilers suggests the modified wage gap may not be
sensitive to year-to-year changes in employment levels. Adding the unemployment rate as an independent variable
allows us to pick up this source of variation.
The modified wage gap is negatively correlated with the unemployment rate (r = -0.446). Thus, the evasion rate
appears to rise when the unemployment rate is falling. This likely occurs as more low-income earners enter the
workforce when the economy improves. Many of these employees are temporary, part-time, or seasonal workers
who hold jobs created to meet the surge in demand. Others are full-time workers hired at entry-level positions. Since
many of those who hold these jobs earn less the minimum amount needed to file a tax return, their appearance in the
labor market likely pulls the wage gap upward. For this reason, a negative sign is anticipated for unemployment rate.
Estimated Model
The estimated regression model is:
ttttttt URPTAXRATEMEDWAGEAUDITWG εββββββ ++++++= − 5432210 90]4[
The dependent variable is the modified wage gap (WGt). The predictor variables are the audit rate with a two-year
lag (AUDITt-2), inflation-adjusted median wage and salary income in thousands of year 2000 dollars (MEDWAGEt),
the average marginal tax rate (TAXRATEt), top decile wage share (P90t) and the unemployment rate (URt). Because
the dependent variable is the relative modified wage gap, this model provides only a partial view of the hypothesized
role of inequality on evasion. Specifically, since the wage gap is based almost exclusively on matchable income
(with some exceptions, such as tip income), the top decile wage share only accounts for variation in the dependent
variable due to changing opportunity costs of compliance.

18
ESTIMATION RESULTS
Equation 4 was estimated using the maximum likelihood method with correction for first-order and second-
order serial correlation. The regression output is shown in Table 5. The variables URt and P90t have the expected
signs and are statistically significant with a probability of 0.1 or less. All other variables have the exp ected signs but
are not statistically significant. The Durbin-Watson statistic indicates the estimated model has been corrected for the
presence of serial autocorrelation.
Based on the estimated coefficients, a decline of one point in the top decile wage share would reduce the wage
gap by 0.16 percentage points. This finding suggests that reducing the level of income inequality may lower tax
evasion by reducing both the opportunity and motive to evade. However, proposals aimed at reducing inequality that
are seen as coercive may be resisted politically as compared to measures emphasizing voluntary participation.
Instead, political leaders, as they have at least since the time of Solon, may opt to deal with unpopular measures like
income redistribution only after the emergence of a crisis that has left no alternative course of action.14
Explanatory Variables Coefficient t Ratio Approx. Prob.Intercept 1.335 0.58 0.564URt -0.075 -1.77 0.084TAXRATEt -0.033 -1.55 0.128P90t 0.156 1.97 0.055AUDIT t-2 -0.051 -0.49 0.625MEDWAGEt -0.076 -1.47 0.148
?1 0.379 2.91 0.006
?2 0.528 3.90 0.000
Adjusted R-Square 0.862Durbin-Watson 1.84N 52
ESTIMATION RESULTSTABLE 5
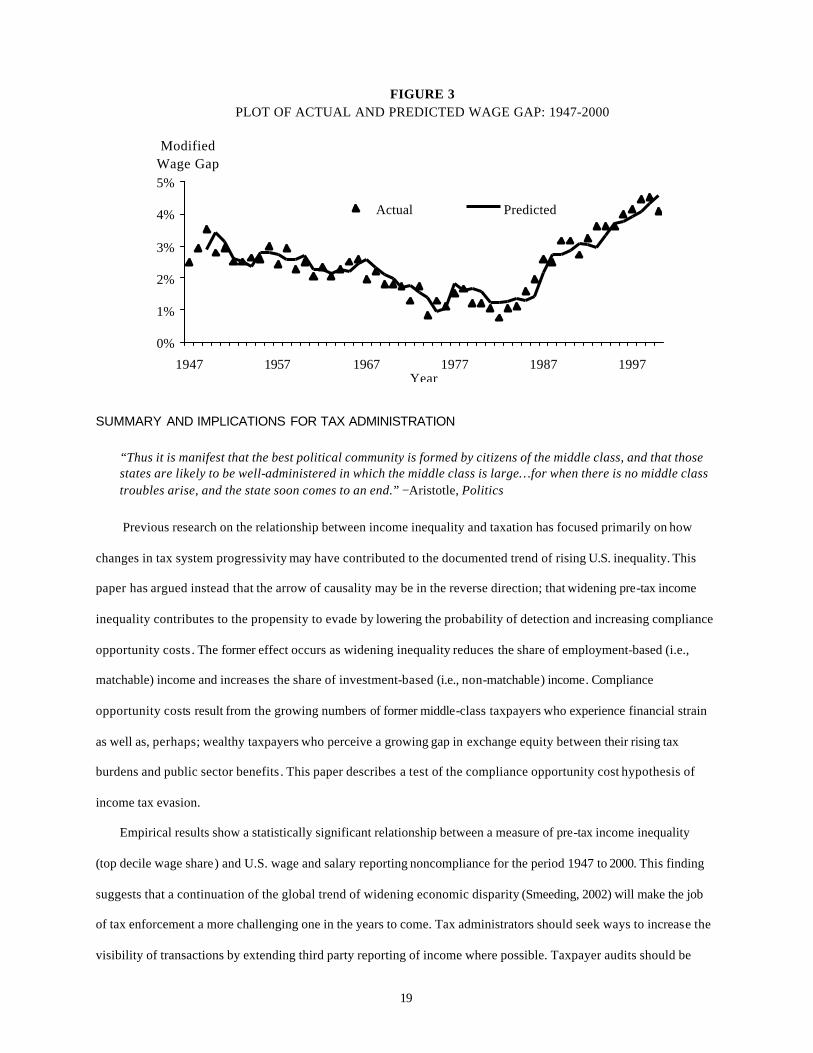
Figure 3 displays a plot of the actual versus predicted wage gap using the estimated regression coefficients.
14 Durant and Durant (1968) give the following account, originally from Plutarch, of the Greek tyrant Solon who was elected supreme archon of Athens in 594 B.C. during a time when the disparity in wealth between the rich and poor had reached a crisis level. “Solon…a businessman of aristocratic lineage…devalued the currency, reduced all personal debt, ended imprisonment for debt, forgave some taxes and mortgage interest, established a progressive income tax that taxed the rich at a rate 12 times the poor, and paid education expenses for the sons of those who died defending Athens in time of war. The rich protested that his measures were outright confiscation; the radicals complained that he had not gone far enough in redistributing the land; but within a generation almost all agreed that his reforms had saved Athens from revolution."
19
FIGURE 3PLOT OF ACTUAL AND PREDICTED WAGE GAP: 1947-2000
0%
1%
2%
3%
4%
5%
1947 1957 1967 1977 1987 1997Year
ModifiedWage Gap
Actual Predicted
SUMMARY AND IMPLICATIONS FOR TAX ADMINISTRATION
“Thus it is manifest that the best political community is formed by citizens of the middle class, and that those states are likely to be well-administered in which the middle class is large…for when there is no middle class troubles arise, and the state soon comes to an end.” −Aristotle, Politics
Previous research on the relationship between income inequality and taxation has focused primarily on how
changes in tax system progressivity may have contributed to the documented trend of rising U.S. inequality. This
paper has argued instead that the arrow of causality may be in the reverse direction; that widening pre-tax income
inequality contributes to the propensity to evade by lowering the probability of detection and increasing compliance
opportunity costs . The former effect occurs as widening inequality reduces the share of employment-based (i.e.,
matchable) income and increases the share of investment-based (i.e., non-matchable) income. Compliance
opportunity costs result from the growing numbers of former middle-class taxpayers who experience financial strain
as well as, perhaps; wealthy taxpayers who perceive a growing gap in exchange equity between their rising tax
burdens and public sector benefits . This paper describes a test of the compliance opportunity cost hypothesis of
income tax evasion.
Empirical results show a statistically significant relationship between a measure of pre-tax income inequality
(top decile wage share) and U.S. wage and salary reporting noncompliance for the period 1947 to 2000. This finding
suggests that a continuation of the global trend of widening economic disparity (Smeeding, 2002) will make the job
of tax enforcement a more challenging one in the years to come. Tax administrators should seek ways to increase the
visibility of transactions by extending third party reporting of income where possible. Taxpayer audits should be

20
directed primarily at income sources not covered by third-party reporting, such as business and investment income.
Enhanced customer service and a simplified tax code should make it easier for many taxpayers to comply.
On the other hand, tax compliance programs that negatively impact taxpayers’ financial status may have the
unintended consequence of increasing, rather than reducing, evasion. For example, if the adoption of a single flat
rate tax system shifts more of the total tax burden onto low-income households, evasion by this group of taxpayers
may increase. Alternatively, relying on the wealthy to pay for an ever-increasing share of public goods and services
may bring about a situation where “Atlas shrugs” − the phrase Slemrod (2000) uses to characterize high income
earners’ possible response to higher tax rates. If the finding reported here is an indication, then further polarization
of the nation’s income distribution could act to undermine current and future tax enforcement efforts.
Acknowledgments
The author expresses thanks to Dr. Chih-Chin Ho for his assistance in deriving the modified wage gap and
comments from two anonymous reviewers on an earlier version of this paper. The views expressed here are those of
the author and should not be interpreted as those of the U.S. Internal Revenue Service.

21
REFERENCES
Allingham, Michael G., and Agnar Sandmo. “Income Tax Evasion: A Theoretical Analysis.” Journal of Public Economics 1 (November, 1972): 323-38. Alm, James, Roy Bahl, and Matthew N. Murray. “Tax Structure and Tax Compliance.” The Review of Economics and Statistics 72 No. 4 (November, 1990): 603-613. Andreoni, James. “IRS as Loan Shark: Tax Compliance with Borrowing Constraints” Journal of Public Economics 49 No. 1 (October 1992): 35-46. Andreoni, James, Brian Erard and Jonathan Feinstein. “Tax Compliance,” Journal of Economic Literature 36 (June 1998): 818-860. Bishop, John A., Victor Chow, John P. Formby and Chih-Chin Ho. “The Redistributive Effects of Noncompliance and Tax Evasion in the U.S.” In Taxation, Poverty and Income Distribution, edited by John Creedy. Aldershot, England: Edward Elgar Publishing Company, 1994. Bloomquist, Kim M. “U.S. Income Inequality and Tax Evasion: A Synthesis,” Tax Notes International 31 No. 4 (July 28) 2003a:347-367.
Bloomquist, Kim M. “Trends as Changes in Variance: The Case of Tax Noncompliance,” Paper presented at the IRS Research Conference, June 2003b. Online copy available at http://www.irs.gov/pub/irs-soi/bloomquist.pdf. Campbell, David and Michael Parisi. “Individual Income Tax Returns, 2000”, SOI Bulletin, (Fall 2002): 7-44. Carroll, John S. “A Cognitive-Process Analysis of Taxpayer Compliance.” In Taxpayer Compliance, Vol. 2: Social Science Perspectives, edited by Jeffrey A. Roth, John T. Scholz, and Ann Dryden Witte. Philadelphia: University of Pennsylvania Press, 1989. Chang, Otto H., and Joseph J. Schultz. “The Income Tax Withholding Phenomenon: Evidence From TCMP Data,” The Journal of the American Taxation Association 12 No. 1 (Fall 1990): 88-93. Christian, Charles W. “Voluntary Compliance With The Individual Income Tax: Results From the 1988 TCMP Study,” The IRS Research Bulletin, IRS Publication 1500 (Rev.9-94), (1993/1994): 35-42. Citrin, Jack. “Do People Want Something for Nothing: Public Opinion on Taxes and Government Spending,” National Tax Journal 32 No. 2 (Supplement 1979): 113-129. Clotfelter, Charles T. “Tax Evasion and Tax Rates: An Analysis of Individual Returns,” The Review of Economics and Statistics 65 No. 3 (August 1983): 363-373. Cox, Dennis. “Raising Revenue in the Underground Economy,” National Tax Journal 37 No. 3 (1984):283-288. Crane, Steven E. and Nourzad, Farrokh. “Inflation and Tax Evasion: An Empirical Analysis,” The Review of Economics and Statistics 68 No. 2 (May 1986): 217-223.

22
Dubin, Jeffrey A., Graetz, Michael J. and Wilde, Louis L. “The Effect of Audit Rates on the Federal Individual Income Tax, 1977-1986”, National Tax Journal 43 No. 4 (1990): 395-409. Durant, Will and Ariel Durant. The Lessons of History, NewYork, New York, Simon and Schuster, 1968. Elffers, Henk. Income Tax Evasion: Theory and Measurement, Erasmus University Rotterdam, Kluwer, 1991. Engel, Eduardo M.R.A., and James R. Hines Jr. Understanding Tax Evasion Dynamics, Publication No. 98-22, Office of Tax Policy Research, University of Michigan, 1998. Erard, Brian, and Chih-Chin Ho. “Searching for Ghosts: Who Are the Nonfilers and How Much Tax Do They Owe?” Journal of Public Economics 81 (2001): 25-50. Ehrlich, I. “Participation in Illegitimate Activities: A Theoretical and Empirical Investigation,” Journal of Political Economy 81 No. 3 (1973): 521-565. Falkinger, Josef. “Tax Evasion and Equity: A Theoretical Analysis,” Public Finance/Finances Publiques 3 (1988): 388-395. Fajnzylber, Pablo, Daniel Lederman, and Norman Loayza. “What causes violent crime?” European Economic Review, 46, No. 7 (2002): 1323-1357. Feinstein, Jonathan S. “An Econometric Analysis of Income Tax Evasion and Its Detection,” Rand Journal of Economics 22 No. 1 (1991): 14-35. Fratanduono, Richard J. “Trends in Voluntary Compliance of Taxpayers Filing Individual Tax Returns,” Trend Analysis and Related Statistics, IRS Document 6011 (Rev. 3-86), (1986): 15-26. Graetz, Michael J. The U.S. Income Tax: What It Is, How It Got That Way, and Where We Go from Here. New York, W.W. Norton, 1999. Internal Revenue Service. Federal Tax Compliance Research: Individual Income Tax Gap Estimates for 1985, 1988, and 1992, IRS Publication 1415 (Rev. 4-96), Washington, D.C., 1996. Internal Revenue Service. Statistics of Income Bulletin, Spring 2001, Washington, D.C. 2001. Kahneman, Daniel, and Amos Tversky. “Prospect Theory: An Analysis of Decision Under Risk,” Econometrica 47 No. 2 (1979): 263-291. Klepper, Steven, and Daniel Nagin. “The Criminal Deterrence Literature: Implications for Research on Taxpayer Compliance” In Taxpayer Compliance, Vol. 2: Social Science Perspectives, Jeffrey A. Roth, John T. Scholz, and Ann D. Witte (eds.), Philadelphia: University of Pennsylvania Press, 1989. Lewis, Alan. “An Empirical Assessment of Tax Mentality,” Public Finance/Finances Publiques 34 No. 2 (1979): 245-257.

23
Lewis, Alan. The Psychology of Taxation, Oxford: Martin Robertson, 1982. Long, Susan, and Judyth Swingen. “Third Party Information Reporting and Compliance.” In Research Conference Report, How Do We Affect Taxpayer Behavior?, Internal Revenue Service Document 7302 (3-91), Washington, D.C., 1990. Park, Thae S. “Comparison of BEA Estimates of Personal Income and IRS Estimates of Adjusted Gross Income,” Survey of Current Business (November 2002): 13-20. Parker, Robert, P. “Improved Adjustments for Misreporting of Tax Return Information Used to Estimate the National Income and Product Accounts, 1977,” Survey of Current Business (June 1984): 17-25. Piketty, Thomas and Emmanuel Saez. “Income Inequality in the United Sates, 1913-1998,” NBER Working Paper 8467, National Bureau of Economic Research, 2001. Data updated through 2000 downloadable from NBER web site (http://www.nber.org/data-appendix/w8467). Plumley, Alan H. The Determinants of Individual Income Tax Compliance: Estimating The Impacts of Tax Policy, Enforcement, and IRS Responsiveness, Internal Revenue Service, Publication 1916 (Rev. 11-96), Washington, D.C., 1996. Pommerehne, Werner W., Albert Hart, and Bruno S. Frey. “Tax Morale, Tax Evasion and the Choice of Policy Instruments in Different Political Systems,” Public Finance/Finances Publiques 49 (Supplement): 52-69. Rhoades, Shelley C. “The Impact of Multiple Component Reporting on Tax Compliance and Audit Strategies,” The Accounting Review 74 No. 1 (1999): 63-85. Rice, Eric M. “The Corporate Tax Gap: Evidence on Tax Compliance by Small Corporations.” In Why People Pay Taxes: Tax Compliance and Enforcement, edited by Joel Slemrod. Ann Arbor: University of Michigan Press, 1992. Roth, Jeffrey A., John T. Scholz, and Ann D. Witte (eds.) Taxpayer Compliance, Vol. 1: An Agenda for Research, Philadelphia, University of Pennsylvania Press, 1989. Ryscavage, Paul. “A Surge in Growing Income Inequality?”, Monthly Labor Review (August 1995): 51-61. Scholz, John T, and Mark Lubell. “Adaptive political attitudes: Duty, Trust, and Fear as Monitors of Tax Policy”, American Journal of Political Science 42 No. 3 (July 1998): 903-920. Slemrod, Joel, (ed.) Tax Progressivity and Income Inequality, Cambridge, Cambridge University Press, 1996. Slemrod, Joel, (ed.) Does Atlas Shrug? The Economic Consequences of Taxing the Rich, Cambridge, Harvard University Press, 2000. Slemrod, Joel and Jon Bakija. “Does Growing Inequality Reduce Tax Progressivity? Should it?,” Publication No. 99-3, Office of Tax Policy Research, University of Michigan, 1999.

24
Smeeding, Timothy M. “Globalization, Inequality and the Rich Countries of the G-20: Evidence from the Luxembourg Income Study (LIS),” Paper presented at the G-20 Meeting, Globalization, Living Standards and Inequality: Recent Progress and Continuing Challenges, Sydney Australia, May 26-29, 2002. Warneryd, K., and B. Walerud. “Taxes and Economic Behavior: Some Interview Data on Tax Evasion in Sweden,” Journal of Economic Psychology 2, (1982): 187-211. Witte, A. D., and D.F. Woodbury. “The Effect of Tax Laws and Tax Administration on Tax Compliance: The Case of the U.S. Individual Income Tax,” National Tax Journal 38 No. 1 (1985): 1-14. Yitzaki, Shlomo. “A Note on Income Tax Evasion: A Theoretical Analysis”, Journal of Public Economics 3 No. 2 (1974): 201-202.

25
APPENDIX15
One can think of the BEA’s reported wage gap as being comprised of three components: 1) underreporting by
filers, 2) unreported income by persons with a legal obligation to file and 3) unreported income by legitimate
nonfilers (i.e., persons with income below the legal filing threshold). In the 1988 TCMP, filer underreporting was
estimated at $19.9 billion. Data from a special survey of nonfilers conducted as part of the 1988 TCMP survey
allows us to estimate second component of the wage gap. The third component we will estimate as a residual.
To determine the amount of nonfiler wage and salary income in 1988 we rely on data reported in Erard and Ho
(2001). Using audit data from 3,549 secured delinquent returns of nonfilers, the authors estimate that an additional
7.9 million individual tax returns should have been filed in 1988. The mean total income (before adjustments and
credits) on these returns was $12,448 ($1988). Wages and salaries accounted for 69.9 percent of total nonfiler
income. Of the 7.9 million estimated nonfilers, only 41 percent had some taxes withheld (less than one half the 87
percent withholding rate for filers). Using this information, we estimate nonfiler unreported wage and salary income
in 1988 as: 7.9 million nonfilers * $12,448 * 0.699 * 0.59 = $40.6 billion
The $40.6 billion figure does not include the wages of nonfilers with an obligation to file and some withholding.
However, given the considerable uncertainties involved in deriving the various IRS and BEA “gap” measures, a
more conservative estimate seems appropriate. We now derive a modified wage gap for 1988 as the sum of
underreported wage and salary income for filers ($19.9 billion) and nonfilers ($40.6 billion), for a total of $60.5
billion. This amount represents 75.6 percent of the 1988 reported wage gap of $80.0 billion. Therefore, we estimate
legitimate nonfilers accounted for $19.5 billion, or 24.4 percent, of the reported wage gap in 1988.
Since we only have nonfiler data for one year, we cannot repeat this procedure for the remaining 53 years of
data in our time-series. However, we can adjust the reported wage gap for other years using the 1988 modified wage
gap to reported wage gap ratio of 0.756. The results are shown in columns C and D of Table A-1. Table A-1 also
compares historical TCMP estimates of filer underreporting (column F of Table A-1) to corresponding data
estimated using the modified wage gap (column G). The entries in column G are calculated for TCMP years by
multiplying the modified wage gap by the ratio of 1988 filer underreporting divided by the 1988 modified wage gap
($19.9 billion / $60.5 billion = 0.329). The mean absolute percentage error, or MAPE, for all eight years is 20.0
percent and drops to 11.8 percent when the values for 1969 and 1988 are excluded.
15 This appendix is from Bloomquist (2003a) with data added in Table A-1for TY 2000.

26
TABLE A-1 DERIVATION OF MODIFIED WAGE GAP AND COMPARISON WITH TCMP DATA