tax competition between sub-central … competition between sub-central governments ... closer to...
TRANSCRIPT

COM/CTPA/ECO/GOV/WP(2011)13
1
COM/CTPA/ECO/GOV/WP(2011)13
OECD Network on Fiscal Relations across Levels of Government
TAX COMPETITION BETWEEN SUB-CENTRAL GOVERNMENTS
Hansjörg Blöchliger and José Pinero-Campos.
COM/CTPA/ECO/GOV/WP(2011)13
2
TABLE OF CONTENTS
TAX COMPETITION BETWEEN SUB-CENTRAL GOVERNMENTS ..................................................... 4
1. Introduction and summary ....................................................................................................................... 4 2. What is sub-central tax competition? ....................................................................................................... 5
Tax competition is a strategic game ......................................................................................................... 5 Tax rate interaction is widespread ............................................................................................................ 6 Tax base mobility: how households and firms react to sub-central tax changes ...................................... 7
3. The determinants of tax competition ..................................................................................................... 10 Tax autonomy ......................................................................................................................................... 10 The tax mix ............................................................................................................................................ 11 Fiscal equalisation .................................................................................................................................. 16 Tax and spending policy interact............................................................................................................ 17 Jurisdictional size and agglomeration effects ......................................................................................... 18 Capitalisation .......................................................................................................................................... 19
4. The effect of tax competition: some “stylised facts” ............................................................................. 19 Tax rate differences vary across countries and types of tax ................................................................... 19 Tax rates are lower in wealthier SCGs ................................................................................................... 20 There is no “race to the bottom”, and tax rates tend to converge ........................................................... 24 Differences in tax raising capacity are not exacerbated by tax competition .......................................... 25 Tax competition is likely to increase public sector efficiency ............................................................... 27
5. Government responses to perceived excesses of tax competition ......................................................... 27 Moving towards property taxation ......................................................................................................... 28 Harmonised sub-central tax bases .......................................................................................................... 28 Fiscal equalisation .................................................................................................................................. 29 Other constraints on sub-central tax autonomy ...................................................................................... 29
BIBLIOGRAPHY ......................................................................................................................................... 31
Annex ............................................................................................................................................................. 36
Boxes
1. Vertical tax competition ........................................................................................................................ 6 2. Testing for horizontal tax interaction .................................................................................................... 7 3. Testing for tax base mobility ................................................................................................................. 9 4. Why did the tax rates of the French régions rise? ............................................................................... 26
Tables
A1. Tax competition in OECD countries: a selection of empirical studies ............................................... 36 A2. Taxing power of sub-central governments .......................................................................................... 38 A3. Variations in tax raising capacity and tax autonomy .......................................................................... 39 A4. Spearman rank correlations of tax capacity rankings .......................................................................... 40 A5. Tax revenues and tax rate variations ................................................................................................... 41
COM/CTPA/ECO/GOV/WP(2011)13
3
Figures
1. Taxing power of sub-central governments .......................................................................................... 11 2. Taxing power and the tax mix ............................................................................................................. 12 3. SCG tax rate variations across countries and types of tax .................................................................. 20 4. Implicit SCG tax rates and tax raising capacity are negatively correlated .......................................... 22 5. SCG tax rate evolution 1997-2007, selected countries ....................................................................... 25 6. Tax rate evolution in French régions .................................................................................................. 26 7. Disparities in tax raising capacity are lower in countries with large tax autonomy ............................ 27 A1. Sub-central government corporate income tax .................................................................................... 43 A2. Sub-central government personal income tax ..................................................................................... 44 A3. Sub-central government recurrent taxes on immovable property ....................................................... 45

COM/CTPA/ECO/GOV/WP(2011)13
4
TAX COMPETITION BETWEEN SUB-CENTRAL GOVERNMENTS
1. Introduction and summary
1. Tax competition is the strategic interaction of tax policy between sub-central governments (SCG) with the objective to attract and retain mobile tax bases. Tax competition rests on firms’ and households’ willingness and ability to shift the tax base – i.e. profits, capital, income, consumption etc. – after SCG tax policy changes. There is no tax competition without tax base mobility. The views on the benefits and costs of tax competition differ widely: while some consider that tax competition brings sub-central fiscal policy closer to citizen’s preferences, increases the efficiency of the public sector and avoids tax and spending excesses, others argue that tax competition leads to a distorted tax structure, to growing tax rate disparities and to an under-provision of publicly provided services. The degree of tax competition is likely to vary across countries and over time and is strongly shaped by the fiscal and institutional framework. Tax competition is not only an issue for federal countries, but also for unitary countries where local governments often have far-reaching tax autonomy.
2. While tax competition is only one element of inter-jurisdictional competition, this note concentrates on how SCGs use taxation for economic development purposes. The paper is organised as follows: The next section defines tax competition more precisely, investigates how widespread sub-central tax competition is across the OECD and provides an overview on tax-induced mobility. The third section highlights the main determinants affecting the extent and intensity of sub-central tax competition. The fourth section presents a set of original data on the impact of tax competition on tax rates, tax revenues, and disparities in tax raising capacity. The fifth and final section presents policy options that may help harness the benefits of tax competition while reducing its drawbacks. The paper relies on the Fiscal Network’s database, a questionnaire sent to OECD members in 2009, an expert workshop held in 2010, and recent academic research. This is one of the first paper by the OECD Secretariat that deals with SCG tax competition from an economic perspective.
3. The results can be summarised as follows:
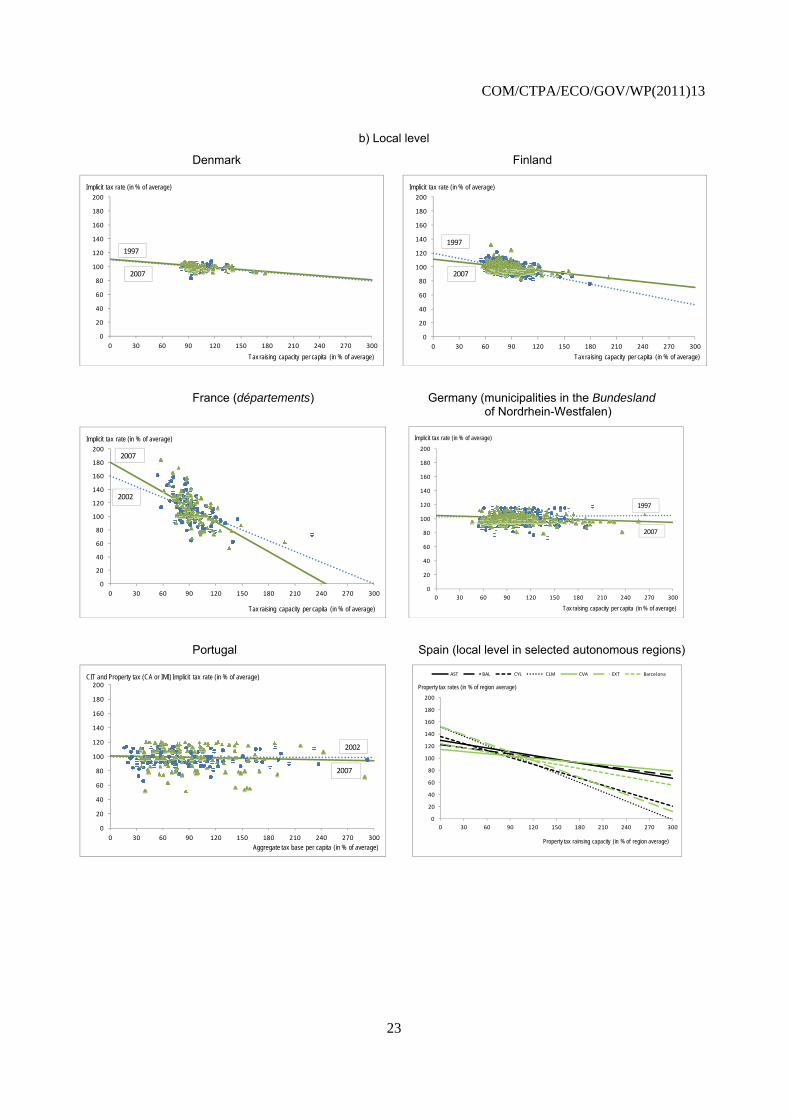
Tax competition is widespread: SCG tax policy interaction – or tax mimicking – occurs in most countries and concerns all taxes and all government levels. The mobility of individuals and firms is – among other things – affected by tax levels, and SCGs use of taxation as a strategic means to attract mobile factors. While attracting mobile tax bases might be the main rationale for SCGs to adapt their tax policy (“genuine” tax competition), tax interaction may also be the result of the benchmarking of fiscal outcomes by voters across jurisdictions (political or yardstick competition).
Some sub-central taxes are more prone to tax competition than others: The intensity of tax competition depends on the tax category households and firms are subject to. Sub-central business taxes, i.e. taxes on capital and capital income, are most prone to tax base mobility and hence tax competition, followed by sub-central personal income taxes. Taxes on residential property are the least affected by tax competition. Competition on consumption taxes depends strongly on the size of jurisdictions.

COM/CTPA/ECO/GOV/WP(2011)13
5
Several other factors affect tax competition and tax base mobility: Large jurisdictions with agglomeration economies are less affected by tax base mobility and tend to set higher tax rates. Capitalisation, i.e. the impact of taxation on property prices, reduces tax base mobility and tax competition. Spending on public services, especially infrastructure and education may compensate for higher tax rates and reduce competitive pressure. Fiscal equalisation reduces tax base mobility and tax competition.
SCG tax rates tended to converge and to go up rather than down: For the countries under scrutiny, tax competition did not lead to a “race to the bottom” of tax rates. Except for some sub-central corporate income tax and top marginal personal income tax rates, tax rates went up rather than down. Also, tax rates tended to converge, i.e. differences in tax rates across SCGs tended to become smaller over time.
High tax raising capacity is associated with low tax rates: SCGs with higher tax raising capacity (i.e. wealth) tend to have lower tax rates, and this relationship has become somewhat stronger during the last decade. Two reasons may explain this outcome: a) poor SCGs may need higher taxes to fund similar public service levels; b) poor SCGs may be less efficient than SCGs with high tax raising capacity.
Countries with large SCG tax autonomy have lower tax disparities. Countries with wide-reaching SCG tax autonomy tend to have smaller inter-regional differences in tax raising capacity. This result suggests that tax autonomy allows poorer SCGs to better foster their economic and fiscal base, making it easier for them to catch up with the national average. The result is in line with recent research on the determinants of regional convergence/divergence.
Governments have several options to address perceived tax competition “excesses”: Governments apply several policy instruments to frame tax competition, of which some are more efficient than others. Efficient options include: shifting SCG taxation towards immovable property; the harmonisation of the tax base across SCGs and with central government; and the introduction and amendment of fiscal equalisation systems, thereby offsetting “excessive” differences in sub-central revenues and tax rates.
2. What is sub-central tax competition?
Tax competition is a strategic game
4. Tax competition is the strategic interaction of tax policy – in particular the setting of tax rates – between sub-central governments (SCGs). SCGs may use taxation as a means to promote local and regional economic development or to increase the tax base and hence tax revenues. Individuals and firms, assessing the costs and benefits of a given location may decide to relocate, thereby changing the distribution of tax revenues between jurisdictions and providing an incentive for other SCGs to adapt their tax policy. While the term “tax competition” usually suggests a strategy to attract mobile tax bases, SCGs may also change their fiscal policy because of pressure from voters who compare policy outcomes between neighbouring jurisdictions and hold their politicians accountable; this kind of tax interaction is often called “yardstick competition”.1 The two features are difficult to disentangle, and in practice they often work in tandem.
5. Tax competition and its outcomes – such as tax base mobility, tax rates, disparities in tax raising capacity, investment and economic activity across SCGs – depends on a multitude of factors, including the autonomy SCGs have over their taxes, the sub-central tax mix and a number of institutional, economic and
1. The two forms of competition can also be seen in the light of “exit” and “voice”: while tax competition forms
the “exit” strategy for an individual or a firm, yardstick competition is the “voice” strategy.

COM/CTPA/ECO/GOV/WP(2011)13
6
fiscal variables. Furthermore, taxation is just one policy instrument, with SCGs having many other options to influence their economic and fiscal base, such as the level and efficiency of public services, spatial planning, the quality of infrastructure or the regulatory and administrative environment. Tax competition can hence not be looked at in isolation but must be seen in a broader context of the various interactions among SCGs and moreover with central government that often set the main fiscal parameters. Finally, vertical tax competition – which is not the topic of this paper – may partially offset the effects of horizontal tax competition (Box 1).
Box 1. Vertical tax competition
Vertical tax competition occurs when different government levels have individual discretion in setting rates on a common tax base. When an individual government or government level changes its tax rate, it affects the tax base for other government levels. For example, an increase in a central government capital tax reduces national savings, thereby reducing the capital stock in all sub-central jurisdictions. Similarly, an increase in the central government personal income tax reduces incentives to work and hence the income tax base for all SCGs. Since the tax increase imposed by one government level diminishes tax revenues for the other government levels, these in turn may have to increase their own taxes in order to rebalance budgets. The tax base becomes a common good, where each government level is imposing a tax externality on the others. Vertical tax competition can be quite pervasive in countries with concurrent taxation of corporate income, personal income or sales and turnover taxes. Examples are a central government income tax on which SCGs set individual surcharges or a combined central/sub-central VAT/sales tax.
Vertical and horizontal tax competition interact. Vertical tax competition tends to raise tax rates and hence to partially offset the effects of horizontal tax competition, but the overall effect depends on the tax mix and the elasticity of the shared tax base. Over-taxation might become an issue if an inelastic tax base – such as the property tax or some consumption taxes like the gasoline tax – is shared across government levels, while it could be less salient when a more mobile base – such as when the corporate or personal income tax – is shared. Vertical tax competition also depends on the extent to which the central government can commit as a “first mover” to a tax policy that SCGs then take as given. In other words, the more “hierarchical” the relationship between the central and the sub-central level, the less significant is vertical tax competition. Finally, government’s objective functions in terms of taxation as well as political economy constraints – such as voter’s behaviour – limit the extent to which government levels can exploit the joint tax base. Tax policy coordination across government levels may further help reduce vertical tax competition and excessive taxation (for an overview see Keen, 1998; Wilson, 2001 or Devereux, Lockwood and Redoano, 2007).
Tax rate interaction is widespread
6. Tax competition has become a prominent fiscal policy issue, mainly due to the perceived increase of tax base mobility and the threat of tax erosion. As a result, various studies have been carried out, showing the extent to which tax policy, in particular tax rate setting, interacts between jurisdictions. The studies cover all types of taxes, all sub-central government levels and around half of all OECD countries. Several studies assess whether SCGs use tax rate setting as a means to attract mobile tax bases – “genuine” tax competition – or whether tax policy changes reflect voters’ tax preferences, i.e. yardstick competition. However, only few studies address the issue of how tax competition affects the mobility of households and firms. The main findings of these studies are as follows (a summary on methodological issues is provided in Box 2; individual studies are shown in Annex Table A1):
Tax rate mimicking is widespread: Tax interaction – or tax mimicking – between jurisdictions is widespread, concerns almost all countries and sub-central government levels, and all types of taxes. The reaction is usually positive, i.e. if a SCG lowers its tax rates, other SCGs also lower their taxes, and vice versa. The reaction rate varies between 0.3 and 0.7, i.e. an average 10% tax rate increase/decrease in neighbouring SCGs is met with a 3 to 7% increase/decrease in the own tax rate.
Mimicking is stronger for income than for property taxes. Corporate income taxes and, to a lesser extent, personal income taxes are more prone to tax mimicking than property taxes, i.e. the reaction rate is higher. Also, a closer analysis of tax base mobility and voting behaviour reveals
COM/CTPA/ECO/GOV/WP(2011)13
7
that property tax interaction tends to be of the yardstick (political) competition type, while income tax interaction tends to be of the tax competition type. For consumption taxes, much depends on geography and the size of jurisdictions.
Tax competition depends on various economic and geographical factors: Urbanised and populous SCGs benefit from agglomeration economies, which allows them to set higher tax rates. Tax competition is fiercer between small than between large SCGs and fiercer between local governments than between state/regional governments. Jurisdictions that are adjacent or that have strong economic ties are more engaged in tax competition.
Intergovernmental grants play a crucial role for tax competition: The intergovernmental fiscal framework plays a crucial role for SCG tax policy. Equalisation grants tend to attenuate tax competition. Non-equalising grants in general tend to lower tax rates, probably because SCGs need less own resource revenue to fund their public services.
There is often a leader in tax competition, putting pressure on others: Some competition is asymmetric in the sense that there is a leader in the tax game whose policies are then followed by other SCGs. Small SCGs appear to be the leader, because they can react faster and because tax mobility is higher in their case.
Vertical may partially offset horizontal tax competition: Vertical tax competition, i.e. the competition of different government levels for the same tax base, usually leads to rising tax rates and may hence partly offset the impact of horizontal competition (Box 1).
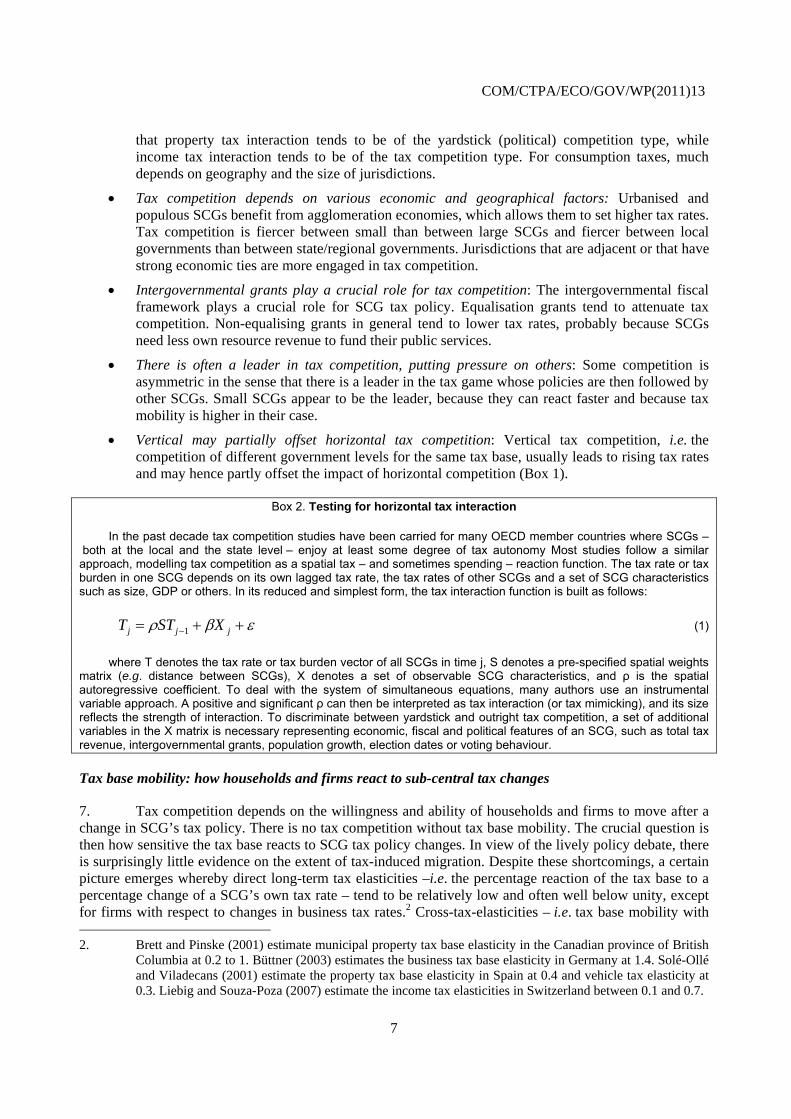
Box 2. Testing for horizontal tax interaction
In the past decade tax competition studies have been carried for many OECD member countries where SCGs – both at the local and the state level – enjoy at least some degree of tax autonomy Most studies follow a similar approach, modelling tax competition as a spatial tax – and sometimes spending – reaction function. The tax rate or tax burden in one SCG depends on its own lagged tax rate, the tax rates of other SCGs and a set of SCG characteristics such as size, GDP or others. In its reduced and simplest form, the tax interaction function is built as follows:
jjj XSTT 1 (1)
where T denotes the tax rate or tax burden vector of all SCGs in time j, S denotes a pre-specified spatial weights matrix (e.g. distance between SCGs), X denotes a set of observable SCG characteristics, and ρ is the spatial autoregressive coefficient. To deal with the system of simultaneous equations, many authors use an instrumental variable approach. A positive and significant ρ can then be interpreted as tax interaction (or tax mimicking), and its size reflects the strength of interaction. To discriminate between yardstick and outright tax competition, a set of additional variables in the X matrix is necessary representing economic, fiscal and political features of an SCG, such as total tax revenue, intergovernmental grants, population growth, election dates or voting behaviour.
Tax base mobility: how households and firms react to sub-central tax changes
7. Tax competition depends on the willingness and ability of households and firms to move after a change in SCG’s tax policy. There is no tax competition without tax base mobility. The crucial question is then how sensitive the tax base reacts to SCG tax policy changes. In view of the lively policy debate, there is surprisingly little evidence on the extent of tax-induced migration. Despite these shortcomings, a certain picture emerges whereby direct long-term tax elasticities –i.e. the percentage reaction of the tax base to a percentage change of a SCG’s own tax rate – tend to be relatively low and often well below unity, except for firms with respect to changes in business tax rates.2 Cross-tax-elasticities – i.e. tax base mobility with 2. Brett and Pinske (2001) estimate municipal property tax base elasticity in the Canadian province of British
Columbia at 0.2 to 1. Büttner (2003) estimates the business tax base elasticity in Germany at 1.4. Solé-Ollé and Viladecans (2001) estimate the property tax base elasticity in Spain at 0.4 and vehicle tax elasticity at 0.3. Liebig and Souza-Poza (2007) estimate the income tax elasticities in Switzerland between 0.1 and 0.7.

COM/CTPA/ECO/GOV/WP(2011)13
8
respect to changes in other SCGs – are even lower. The relatively sluggish reaction of households and firms to tax policy changes also implies that most SCGs are located on the rising slope of their revenue hill (or Laffer) curve, i.e. SCGs do not appear to maximise tax revenues. If they wished to maximise tax revenues, they would have to raise rather than lower tax rates.
8. The current evidence on tax base mobility and tax elasticities can be summarised as follows (methodological aspects are reviewed in Box 3):
Households and firms have different ways to react to tax rate changes, beyond spatial mobility. They may change their investment behaviour, reduce property size, they may reduce labour supply, or they may simply try to avoid paying taxes, while staying at the same place. These are mostly reactions at the margin, and the relevant indicator to assess a non-migratory reaction is usually marginal tax rates, such as marginal income or capital tax rates. But migration is an all-or-nothing decision, i.e a household or firm either relocates or does not; it cannot migrate a bit. Moreover, the tax codes of most countries favour such a one/zero decision by ascertaining that most SCG taxes are paid at the place of residence or at the place of consumption. Exceptions to this rule concern a few origin-based consumption taxes, taxes on immovable property and taxes levied on the self-employed. Given this specific character of spatial mobility, the appropriate indicator to assess relocation patterns of households and firms is the average tax burden.3 Given that most SCGs have the power to set tax rates on a centrally defined tax base only, sub-central statutory tax rates are an adequate measure to assess tax base mobility.
The standard model of tax competition posits that firm’s net after-tax marginal capital return and household disposable income have to be uniform across jurisdictions. A change in tax policy, which changes relative after-tax revenue, hence gives raise to migration. However, SCGs may also compete on the spending side. They may adapt the provision of public services that tend to specifically affect capital returns and household revenues, such as infrastructure or education. In this sense, it is often useful to think of SCGs engaged in fiscal competition rather than tax competition, and to perceive both SCG and private sector behaviour accordingly, given that both sides of the sub-central budget might help attract or retain mobile tax bases.4
The willingness to relocate depends on the characteristics of individual households or firms. Mobility is different across social groups and types of firms. In general, spatial mobility is higher for labour market entrants, immigrants or young families, which are more likely to change both residence and workplace. Also, mobility tends to be higher for high-income earners since their potential tax savings are larger, while social transfers are more important for low-income earners. On the other hand, social changes like the emergence of two-income households might reduce mobility for certain income earners. As regards businesses, younger firms and start-ups have a higher mobility and tend to mind taxation more when taking location decisions. Firms with a high proportion of human and intangible capital are more mobile than firms with important physical assets. Often individual and firm mobility are strongly connected, especially for smaller firms in the service sector that depend on highly qualified labour, which means that SCGs have to take
3. Devereux and Griffith (1998) suggest that the average tax burden is the relevant decision variable for the
choice of location by multi-jurisdictional firms. Kleven, Landais and Saez (2010) use the total tax burden in their assessment of high income earners’ mobility across EU countries, i.e. the sum of CIT, PIT, social security contributions and VAT.
4. Several studies on sub-central fiscal competition conclude that SCGs, rather than engaging in pure tax competition, also change their spending policies, which points at the importance of including the spending side when assessing migration patterns (See the section on spending and public services).
COM/CTPA/ECO/GOV/WP(2011)13
9
into account both their corporate and personal income tax levels when assessing household and firm mobility.5
Finally, the decision to relocate depends on SCG characteristics such as labour and housing markets. In most countries, residential mobility is driven by labour or housing markets rather than by tax considerations. However, once people or firms decide to migrate, tax policy kicks in, and the choice of a new location might be based on tax levels, suggesting that tax-induced mobility is a “second-step consideration”.
9. Tax mobility is likely to have increased over the last decades, mainly because relocation costs have plummeted. Economic activities rely more and more on non-physical assets such as human capital, electronic commerce and intangible property, which are easier to move. Technological and financial innovations make tax base and profit shifting across SCG borders easier. Lower transport cost for both households and firms allow for larger distances to be covered between production, sale and consumption, and better transport infrastructure allows individuals to separate residence and workplace, thereby exploiting differences in fiscal advantages between nearby jurisdictions. As a result of higher tax base mobility, SCGs may potentially use taxation in a much more active and competitive way today than they did two or three decades ago. The following chapter will review the determinants of tax competition, tax rate setting and tax base mobility in greater detail and assess how they might have evolved over time.
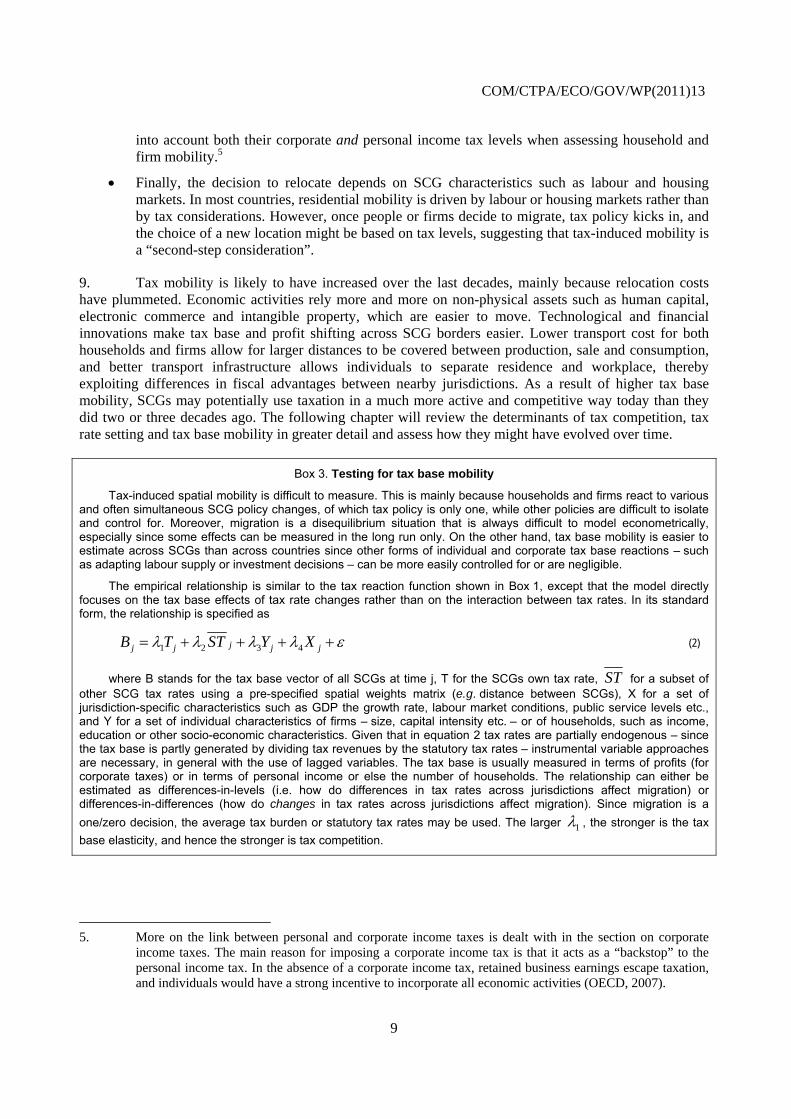
Box 3. Testing for tax base mobility
Tax-induced spatial mobility is difficult to measure. This is mainly because households and firms react to various and often simultaneous SCG policy changes, of which tax policy is only one, while other policies are difficult to isolate and control for. Moreover, migration is a disequilibrium situation that is always difficult to model econometrically, especially since some effects can be measured in the long run only. On the other hand, tax base mobility is easier to estimate across SCGs than across countries since other forms of individual and corporate tax base reactions – such as adapting labour supply or investment decisions – can be more easily controlled for or are negligible.
The empirical relationship is similar to the tax reaction function shown in Box 1, except that the model directly focuses on the tax base effects of tax rate changes rather than on the interaction between tax rates. In its standard form, the relationship is specified as
jjjjj XYSTTB 4321 (2)
where B stands for the tax base vector of all SCGs at time j, T for the SCGs own tax rate, ST for a subset of other SCG tax rates using a pre-specified spatial weights matrix (e.g. distance between SCGs), X for a set of jurisdiction-specific characteristics such as GDP the growth rate, labour market conditions, public service levels etc., and Y for a set of individual characteristics of firms – size, capital intensity etc. – or of households, such as income, education or other socio-economic characteristics. Given that in equation 2 tax rates are partially endogenous – since the tax base is partly generated by dividing tax revenues by the statutory tax rates – instrumental variable approaches are necessary, in general with the use of lagged variables. The tax base is usually measured in terms of profits (for corporate taxes) or in terms of personal income or else the number of households. The relationship can either be estimated as differences-in-levels (i.e. how do differences in tax rates across jurisdictions affect migration) or differences-in-differences (how do changes in tax rates across jurisdictions affect migration). Since migration is a
one/zero decision, the average tax burden or statutory tax rates may be used. The larger 1 , the stronger is the tax
base elasticity, and hence the stronger is tax competition.
5. More on the link between personal and corporate income taxes is dealt with in the section on corporate
income taxes. The main reason for imposing a corporate income tax is that it acts as a “backstop” to the personal income tax. In the absence of a corporate income tax, retained business earnings escape taxation, and individuals would have a strong incentive to incorporate all economic activities (OECD, 2007).
COM/CTPA/ECO/GOV/WP(2011)13
10
3. The determinants of tax competition
10. This section lays out the determinants of tax competition and tax base mobility of households and firms, both inside and outside the realm of fiscal policy. The main determinants considered are the degree of sub-central tax autonomy, the sub-central tax mix, the spending side of the sub-central budget, economic geography such as agglomeration effects and the size of jurisdictions, and capitalisation in property prices.
Tax autonomy
11. Tax competition depends on sub-central tax autonomy, defined as a SCG’s ability to determine its own tax policy. “Tax autonomy” is quite complex to define and measure. The OECD has transformed country-specific rules and regulations on sub-central taxation into a classification with altogether 11 categories of tax autonomy, ranging from extensive autonomy to none at all (Blöchliger and King, 2006). This classification allows assessing the share of taxes in GDP over which SCGs have some power, either to set tax rates on a centrally defined tax base, to vary the tax base using a centrally defined tax rate – this category is not used often – or to vary both the tax base and rates (simplified results are shown in Figure 2). Often strings are attached to autonomous taxes, such as the obligation for a SCG to consult with higher government levels when tax policy changes are imminent, or minimum and maximum tax rate provisions apply. A detailed decomposition of sub-central tax autonomy is shown in Table A2 in the annex.
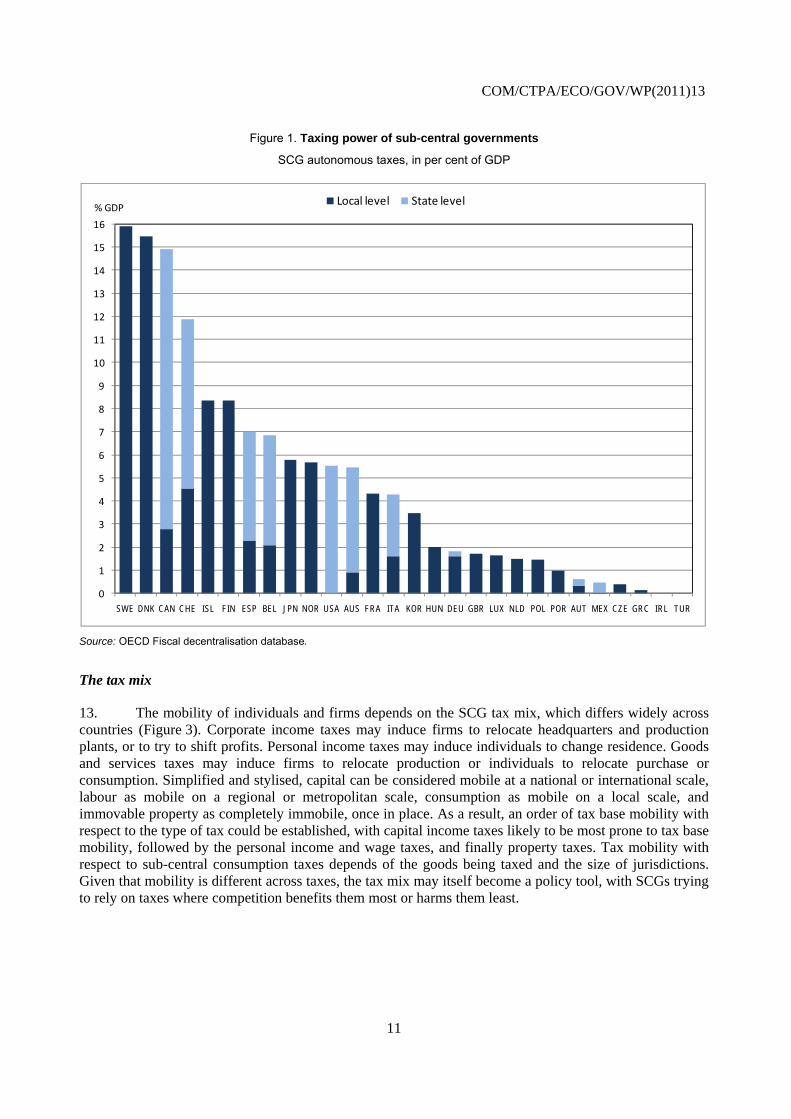
12. SCGs in most countries enjoy some taxing power and hence have the potential to compete on tax policy, but this power varies considerably across countries. Taxing power, as measured by the percentage of autonomous taxes in GDP or total tax revenue, is highest in “classical” federations such as Canada, Switzerland and the Unites States where the constitution often prevents central government from interfering with SCG tax policy. Some unitary countries – e.g. the Nordic countries – with a long-standing tradition of local self-government also grant strong taxing powers. More autonomy is usually allowed over property taxes than over income or consumption taxes, which are often embedded in tax sharing systems with no tax power for an individual SCG. While property taxes are the most important autonomous taxes with around 33%, the more mobile personal income taxes make up around 30% of autonomous SCG tax revenue. Consumption taxes make up around 24% of autonomous SCG tax revenue on average, while corporate income taxes make up around 9%.
COM/CTPA/ECO/GOV/WP(2011)13
11
Figure 1. Taxing power of sub-central governments
SCG autonomous taxes, in per cent of GDP
0
1
2
3
4
5
6
7
8
9
10
11
12
13
14
15
16
SWE DNK CAN CHE ISL FIN ESP BEL JPN NOR USA AUS FRA ITA KOR HUN DEU GBR LUX NLD POL POR AUT MEX CZE GRC IRL TUR
Local level State level% GDP
Source: OECD Fiscal decentralisation database.
The tax mix
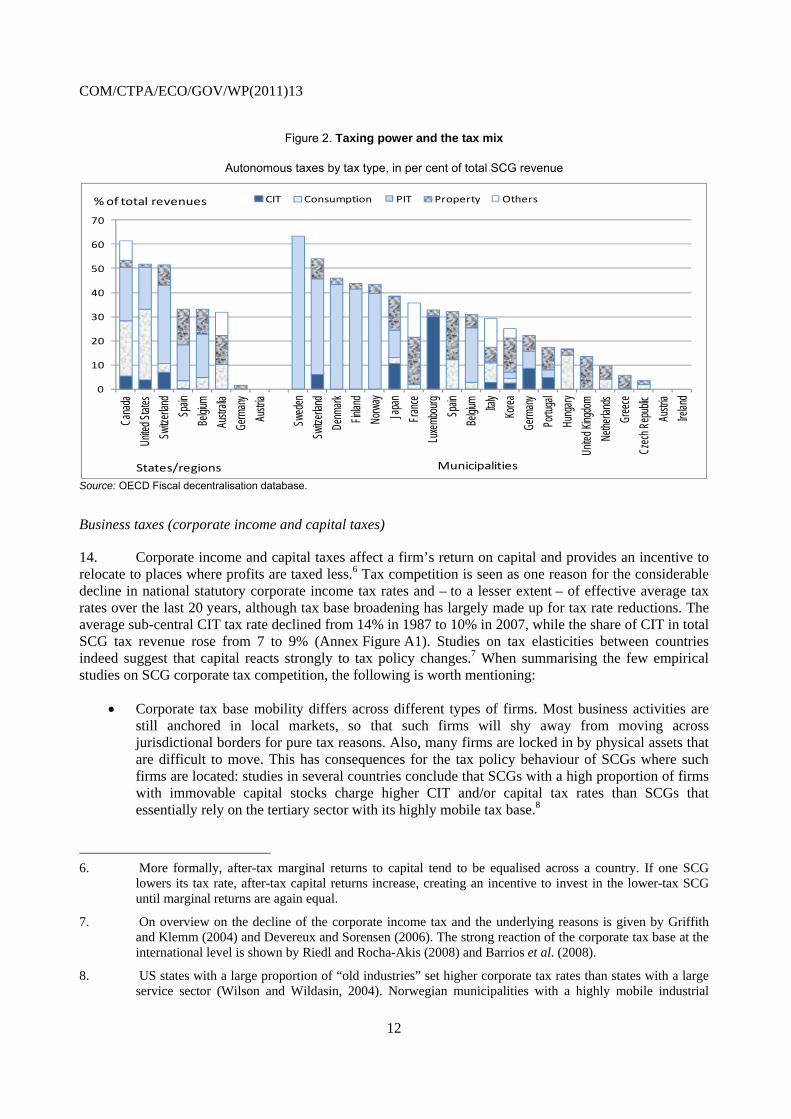
13. The mobility of individuals and firms depends on the SCG tax mix, which differs widely across countries (Figure 3). Corporate income taxes may induce firms to relocate headquarters and production plants, or to try to shift profits. Personal income taxes may induce individuals to change residence. Goods and services taxes may induce firms to relocate production or individuals to relocate purchase or consumption. Simplified and stylised, capital can be considered mobile at a national or international scale, labour as mobile on a regional or metropolitan scale, consumption as mobile on a local scale, and immovable property as completely immobile, once in place. As a result, an order of tax base mobility with respect to the type of tax could be established, with capital income taxes likely to be most prone to tax base mobility, followed by the personal income and wage taxes, and finally property taxes. Tax mobility with respect to sub-central consumption taxes depends of the goods being taxed and the size of jurisdictions. Given that mobility is different across taxes, the tax mix may itself become a policy tool, with SCGs trying to rely on taxes where competition benefits them most or harms them least.
COM/CTPA/ECO/GOV/WP(2011)13
12
Figure 2. Taxing power and the tax mix
Autonomous taxes by tax type, in per cent of total SCG revenue
0
10
20
30
40
50
60
70
Cana
da
Unite
d Stat
es
Switz
erlan
d
Spain
Belgi
um
Austr
alia
Germ
any
Austr
ia
Swed
en
Switz
erlan
d
Denm
ark
Finlan
d
Norw
ay
Japa
n
Fran
ce
Luxe
mbou
rg
Spain
Belgi
um Italy
Kore
a
Germ
any
Portu
gal
Hung
ary
Unite
d King
dom
Nethe
rland
s
Gree
ce
Czec
h Rep
ublic
Austr
ia
Irelan
d
CIT Consumption PIT Property Others
States/regions
% of total revenues
Municipalities
Source: OECD Fiscal decentralisation database.
Business taxes (corporate income and capital taxes)
14. Corporate income and capital taxes affect a firm’s return on capital and provides an incentive to relocate to places where profits are taxed less.6 Tax competition is seen as one reason for the considerable decline in national statutory corporate income tax rates and – to a lesser extent – of effective average tax rates over the last 20 years, although tax base broadening has largely made up for tax rate reductions. The average sub-central CIT tax rate declined from 14% in 1987 to 10% in 2007, while the share of CIT in total SCG tax revenue rose from 7 to 9% (Annex Figure A1). Studies on tax elasticities between countries indeed suggest that capital reacts strongly to tax policy changes.7 When summarising the few empirical studies on SCG corporate tax competition, the following is worth mentioning:
Corporate tax base mobility differs across different types of firms. Most business activities are still anchored in local markets, so that such firms will shy away from moving across jurisdictional borders for pure tax reasons. Also, many firms are locked in by physical assets that are difficult to move. This has consequences for the tax policy behaviour of SCGs where such firms are located: studies in several countries conclude that SCGs with a high proportion of firms with immovable capital stocks charge higher CIT and/or capital tax rates than SCGs that essentially rely on the tertiary sector with its highly mobile tax base.8
6. More formally, after-tax marginal returns to capital tend to be equalised across a country. If one SCG
lowers its tax rate, after-tax capital returns increase, creating an incentive to invest in the lower-tax SCG until marginal returns are again equal.
7. On overview on the decline of the corporate income tax and the underlying reasons is given by Griffith and Klemm (2004) and Devereux and Sorensen (2006). The strong reaction of the corporate tax base at the international level is shown by Riedl and Rocha-Akis (2008) and Barrios et al. (2008).
8. US states with a large proportion of “old industries” set higher corporate tax rates than states with a large service sector (Wilson and Wildasin, 2004). Norwegian municipalities with a highly mobile industrial

COM/CTPA/ECO/GOV/WP(2011)13
13
Corporate taxes may not be the only relevant tax for a firm’s decision to relocate. To the extent to which labour income taxes are shifted forward (i.e. onto the firm), – rather than backward (i.e. onto consumers) –, a part of the tax burden on labour may also be relevant for corporate relocation decisions. In this case, the sum of corporate and personal income taxation is likely to be the relevant tax burden. Differences in the relative tax burden for firms and households would point at different SCG fiscal policy strategies in attracting firms and highly qualified labour.9
Much of the allegedly high tax base mobility can be ascribed to profit shifting rather than tax base shifting, i.e. the true relocation of investment activities or the workforce across borders. Profits are typically more mobile than the underlying investment, and SCG tax policy changes may result in a redistribution of profits between jurisdictions that fail to reflect actual shifting economic activity.10
15. An important issue in sub-central business taxation is how to treat firms with activities in several jurisdictions and how to “apportion” tax liabilities between jurisdictions. Countries use apportionment formulas, both to ensure a “fair” distribution of business tax revenue and to avoid inter-jurisdictional profit shifting. Apportionment formulas rely on a mix of factors such as the number of employees, payroll, property values, sales or turnover in each jurisdiction. As a reaction to tax competition and increasing profit shifting, countries have amended sub-central apportionment formulas, relying on factors that reduce incentives for firms to relocate or that are more difficult to manipulate. For example, an apportionment formula where profits are shared according to sales in each SCG is less prone to tax shifting than a formula based on employment or payroll. Since the 1990s, a large majority of US states has switched to apportionment formulas that weigh sales and turnover more heavily than other factors when assessing inter-jurisdictional tax liabilities.11 However, while apportionment based on sales or turnover is less prone to manipulation, it changes the character of the CIT, to resemble a destination-based consumption tax, thereby undermining the benefit principle of local taxation. Also, the administrative burden for firms to collect sales information may be large if many jurisdictions are involved. The relationship between parent companies and their subsidiaries across jurisdictional borders further complicates the situation.
Personal income taxes
16. Personal income taxes reduce a household’s net (labour) income and provide an incentive to migrate to places where income is taxed at lower rates. While an enormous empirical literature has studied labor supply and taxable income responses to taxation, there is little evidence on the effect of labour taxes on migration.12 As a general rule, sub-central personal income taxes appear to be less prone to tax competition than corporate business taxes, given the lower mobility of households compared to the mobility of firms. Despite increasing international labour mobility in a few segments, labour markets are
sector set lower user fees than municipalities with an immobile industrial sector (Carlsen, Langset and Rattsø, 2005).
9. An analysis across Swiss cantons shows a weak relationship between capital and personal income tax rates. Some cantons have high PIT rates and low CIT rates, while for others it is the opposite, pointing at different SCG strategies when trying to attract firms and high-income households.
10. Buettner (2003), one of the few studies estimating corporate tax base mobility across SCGs, acknowledges that the high values estimated for corporate mobility across German municipalities might reflect profit shifting rather than genuine relocation, but is unable to differentiate between the two sources of “mobility”.
11. Gichiru et al., (2009) and Edmiston and Arze del Granado (2006) provide an overview on the evolution of apportionment formulas in the United States.
12. The literature on reactions of the labour supply to tax changes is surveyed in Blundell and MacCurdy (1999) and Saez, Slemrod and Giertz (2009).

COM/CTPA/ECO/GOV/WP(2011)13
14
still essentially national or even regional. When summarising the evidence on SCG business tax competition, the following stands out:
Inter-jurisdictional mobility and the choice of residence appear to be more affected by labour market considerations (wages, employment etc.) and the housing market (availability, prices) than by taxation. Several older studies covering the 1980s and 1990s found that tax variables had little or no influence on the decision to relocate (e.g. Frey, 1981), while newer studies give more weight to tax-related migration.
Highly-skilled people and high-income earners have a higher propensity to migrate, and they are also more likely to migrate for tax-related reasons. SCG therefore tend to compete more on high-income households than on other income groups. To attract high-income earners some SCGs reduced the tax burden for high income earners considerably. As an example, Canadian and Swiss SCG top marginal tax rates have come down more than the rates for lower incomes.
The PIT is not the only tax that counts for a household’s relocation decision. Consumption taxes drive an additional wedge between earned and disposable income. If households cannot escape sub-central consumption taxes, they have to be taken into account when assessing a household’s total tax burden at a given location. When comparing the tax burden on labour income across countries, the OECD adds consumption taxes, income taxes and social security contributions in order to calculate the “tax wedge” (OECD, 2009).
Low tax-induced household mobility and low tax competition may be due to policy choices. In many countries, tax autonomy is usually restricted to setting a surcharge on a national tax, and in some countries legal provisions (e.g. Belgium or Portugal) prevent SCGs from introducing proportional (“flat”) taxes. As a result, sub-central PIT rates and PIT revenues have on average moved little over the past decade (Annex Figure A2).
17. In some instances PIT competition may have become more intense, however. Competition may be particularly strong within a regional labour market covering a multitude of jurisdictions, which allows individuals to choose workplace and residence separately and then to commute. The “shield of distance” is disappearing, and jurisdictions – especially within metropolitan areas – become competitors for residents. As a consequence, suburbs have usually lower income tax rates than the city centres, enabling them – together with restrictive zoning laws – to attract high-income residents (OECD, 2002). Also, PIT competition might lead to “income sorting”, i.e. to relatively homogenous SCGs with respect to income distribution within their jurisdiction.13
Goods and services taxes
18. Sub-central goods and services taxes comprise sub-central value-added taxes, sales taxes or excises like cigarette or gasoline taxes. Only a few OECD countries have sub-central autonomous goods and services taxes, i.e. taxes not embedded in tax sharing systems. Tax base mobility depends on the goods that are taxed, on how and where the goods are taxed, and on geography – cross-border shopping tends to be more of an issue for small than for large SCGs.14 Summing up:
Taxes on goods that are easy to transport and that have a high price elasticity are more prone to tax competition – a sub-central gasoline tax is easier to maintain than a sub-central cigarette tax.
13. A number of Swiss studies suggest that the cantons differ in income levels but are quite homogenous within
with regards to income distribution. Moreover, PIT tax rates and average household income are strongly and inversely related (for a summary of those studies, see Feld, 2009).
14. A survey on consumption tax competition is provided by Devereux et al. (2007)
COM/CTPA/ECO/GOV/WP(2011)13
15
Taxes with a narrow tax base such as excises are more prone to tax competition than taxes with a broad tax base like general sales taxes or a SCG value-added tax.
An origin-based consumption tax (i.e. taxes are paid where goods are produced) is more prone to tax competition than a destination based consumption tax (taxes are paid where the goods are consumed) because firms are more mobile than consumers.
19. Tax competition has likely intensified with the upcoming of e-commerce and the limited ability of SCGs to tax items purchased outside their jurisdiction, often with lower tax rates and leaky taxation rules on interstate trade.15
20. Several policies reduce tax competition on consumption taxes. Integrating these taxes into tax sharing systems is the most radical policy to reduce tax competition, i.e. leaving SCGs with no tax base and rate setting autonomy, as is the case in Germany or in Australia since the introduction of the Goods and Services Tax in the year 2000. Other, less radical, reforms have focused on sub-central consumption taxes that are less prone to tax competition, such as a destination-based dual central/sub-central VAT or a mix of central VAT/sub-central sales taxes. The recent tax base harmonisation of central and sub-central GST in Canada points in this direction. While such reforms are likely to raise the efficiency of the tax system and reduce tax competition, the cross-jurisdictional distributional consequences of such reforms make it difficult to find a consensus.16 In general, efficient SCG consumption tax systems are confined to large countries with large regional jurisdictions. SCGs in the European Union are prohibited from levying sales and consumption taxes by directives, with some consumption-like taxes being reviewed.17
Taxes on immovable property
21. Property taxes are a tax on the physical capital of businesses and households. Property is the least mobile tax base and generally seen as the most appropriate tax for SCGs, especially for the local level. Given the impossibility to move land and buildings, and the usually inelastic supply of land, taxation levels and changes are reflected in property prices. The salient features of immovable property taxation are:
Property taxation tends to provide the closest link between taxation and service levels for an individual household or firm. Low tax levels are usually associated with low service levels, and vice versa. This reduces the incentives for households (and partially firms) to migrate for purely tax-related reasons and the scope for SCGs to engage in property tax competition.
While the tax on residential property is primarily a tax on consumption of housing services and imputed rent from owner occupation, taxes on business property are in effect a tax on the return on investment. Business property taxes hence tend to be more distortionary than residential property taxes.
Property (capital) taxes are capitalised in the value of land and physical property. A change in taxation hence changes the value of residential and business property. This reduces the incentives to move into a jurisdiction that lowered its taxes since lower tax levels are compensated by higher
15. The US rules on interstate trade provide individuals and firms with many loopholes to escape consumption
taxes (Laubach, 2005). The same holds true for the state VAT in Brazil (de Mello, 2008).
16. Brazil is an example: the country is trying to move from an origin to a destination based state-level VAT. Such a reform would increase the tax system’s efficiency, but it would also change the distribution of tax revenues between states, especially between net exporters and importers, making it very difficult for states to find a consensus.
17. As an example, the Italian regional tax on productive activities (IRAP) was for some time considered a consumption tax.
COM/CTPA/ECO/GOV/WP(2011)13
16
property prices. Capitalisation might, however, not be complete for some property owners or in cases where new property is being made available, e.g. through new zoning laws, leaving room for migration.
Property tax-induced mobility tends to be higher for firms than for households. In countries with significant corporate and residential property taxation, SCG interaction on corporate property taxation is stronger than on residential property taxation – although tax rates still tend to be higher for business than for residential property taxes.
22. Most studies on residential property tax interaction suggest that SCG tax policy is mimicking the neighbours and can be traced back to voters’ preferences on tax and public service levels rather than the quest for new residents. Such tax interaction can hence essentially be considered to be of the “yardstick competition” type.18
23. The property tax share has declined during the last ten years, from around 35% to around 32% of total SCG tax revenue on average and in around two thirds of all countries (Annex Figure A3). Political economy may explain the erosion of both the residential and business property tax base. Voters contest the tax, not least because tax hikes show up in lower property prices. Moreover, the tax is not linked to ability to pay, especially for liquidity-constraint households like the elderly. The rise of property prices in the years prior to the financial crisis created sustained pressure on SCGs to limit property tax hikes, as exemplified by the “tax revolts” in several US states during the 1980s. As a result, a variety of – often social policy-induced – measures such as tax caps, abatements and exemptions, are gnawing at local property tax revenue (Augustine et al., 2009). In many OECD countries, the adaptation of the tax base, i.e. property/cadastral values, dates back years or even decades. As for business property taxation, firms do not vote and can hence exert limited pressure for lower taxes – which might explain why business property tax rates are generally higher than residential property tax rates –, although some SCGs, in an effort to promote their economies, have reduced tax rates and offered tax exemptions.
Fiscal equalisation
24. Fiscal equalisation is a transfer of fiscal resources across SCGs to offset differences in revenue raising capacity or public service cost.19 Fiscal equalisation is hence aimed at fostering inter-regional equity. Equalisation can also be seen as increasing efficiency since it prevents households from moving towards high-income SCGs, simply for receiving public services at lower tax rates. Fiscal equalisation is achieved by disbursing grants inversely related to a SCG's fiscal capacity: the higher the tax raising capacity of a SCG or the lower its cost, the fewer grants it gets. Fiscal equalisation works in two ways: a) it reduces differences between SCG’s tax raising capacity and costs, and b) it reduces the incentives for SCGs to lower tax rates and to attract mobile tax bases since additional revenues are compensated by lower grants, often at a high marginal tax rate. While fiscal equalisation tends to reduce inter-regional differences in tax raising capacity, it still allows SCGs to set tax rates according to their preferences in terms of public service levels.
18. There is no evidence on tax competition and tax base mobility for residential property taxes. Brueckner and
Saavedra claim strong tax interaction between local property tax rates in the United States but are unable to estimate tax base mobility. Only Conway and Houtenville (2006) find some evidence that property taxation could have an incentive for the elderly to move across US states, but the overall effect appears to be weak and mobility appears to be determined by service levels rather than taxation. Bordignon et al. (2003) see yardstick competition as the relevant driver for tax interaction among Italian municipalities. Lytkänen (2008) finds no evidence for property tax competition in Finland.
19. This section is mostly based on Blöchliger and Charbit (2009).
COM/CTPA/ECO/GOV/WP(2011)13
17
25. The design of fiscal equalisation systems affects SCG tax policy and tax competition. The higher marginal fiscal equalisation rates, the weaker are SCG incentives to lower their tax rates and to start a tax competition game. In the same vein, while the minimum guarantees often enshrined in fiscal equalisation systems reduce short-term fiscal disparities, they can create particular disincentives for poor SCGs to develop their economic and fiscal base. Equalisation based on tax raising capacity reduces tax competition more strongly than equalisation relying on cost and needs, since the former tackles the (re)distribution of tax raising capacity in a straightforward way. As a result, countries with cost equalisation tend to have wider tax differentials than countries with tax capacity equalisation (not shown). On the other hand, some equalisation systems based on tax raising capacity do not take inter-regional wage differences or standards of living into account, which may lead to inefficient redistribution and persisting tax rate differences (Albouy, 2009).
Tax and spending policy interact
26. Taxes fund public services. Hence, the revenue and the spending side of the budget interact. Households and firms choose their location based not only on tax considerations but on the relationship between taxes paid and services rendered. When competing, SCGs may therefore not only act on the tax side but also on the spending side, turning tax competition into more general fiscal competition. The scarce empirical evidence on the interaction between the tax and the spending side of SCG budgets can be summarised as follows:
SCGs faced with inter-jurisdictional competition tend to invest in immobile public service inputs that raise the productivity of private investment, such as physical infrastructure, environmental quality and education. Much competition across US states takes the form of productive spending targeted at households and firms rather than tax cuts.20 Higher tax rates tend to be compensated by higher public service levels, allowing households and firms to choose among different tax-service levels across jurisdictions (“Tiebout” hypothesis).
Within a country, low tax/low service level jurisdictions and high tax/high service level jurisdictions appear to co-exist over extended periods, without much fiscally-induced mobility. SCGs hardly change the “tax/public service level” group in which they are placed, given that changing it could entail fiscal imbalances over long periods.21 These results again point at the relevance of the “Tiebout” hypothesis, which posits that households and firms tend to group together across SCGs according to their tax-public service preferences.
Rather than cutting general tax levels, SCGs sometimes prefer to grant tax-benefit packages to highly mobile households and firms. In some countries, specific tax allowances combined with subsidies for new firms are an important policy tool for SCGs. Low tax autonomy and tax competition intensifies competition on the spending side, i.e. SCGs tend to use targeted subsidies and spending programmes more often.22
Minimum spending needs in some policy areas – e.g. social welfare – may put pressure on SCGs to raise tax rates. A part of tax rate differences observed across Swiss cantons appears to be due to minimal spending obligations and spillovers from adjacent jurisdictions rather than from
20. Fredrikson, List and Millimet (2003) present an overview on the various budget instruments that US states
have at hand, and how they use them strategically to attract mobile tax bases.
21. Benassy et al. (2007); Köthenbürger (2008).
22. Several Delegates of the OECD Fiscal Network pointed out that reducing tax autonomy shifts SCG fiscal competition to the spending side and towards the use of subsidies.

COM/CTPA/ECO/GOV/WP(2011)13
18
different preferences for public service levels. Also, if SCGs have little tax autonomy, competition turns to the spending side, with jurisdictions trying to reduce welfare spending.23
27. Inter-jurisdictional collaboration on the spending side – common in most OECD countries – may reduce tax competition. First, by funding services across jurisdictions – such as a common hospital or university – SCGs reduce cross-border externalities and distribute spending commitments more evenly, thereby reducing the scope for competing on tax rates. Second, and on more political economy grounds, inter-jurisdictional collaboration may make it difficult to compete on tax policy. A SCG that collaborates in various areas with its neighbours will hardly engage in a die-hard tax war with them.
Jurisdictional size and agglomeration effects
28. Geography and the administrative organisation of a country affect households and firms as well as the tax policy of individual SCGs. In particular, both the size and agglomeration effects play a role in explaining differences in tax rates across SCGs:
Large jurisdictions have “market power” that allows them to keep tax rates at a higher level. The reason is that tax elasticities are higher in small than in large jurisdictions, i.e. the move of a given number of firms or households has a stronger effect in a small than in a large SCG. While for the international level the size effect is well recognised – small countries, usually below one million, have lower tax rates than larger ones –, empirical tests at the sub-national level are lacking.24
Jurisdictions in the geographical core have higher tax rates than peripheral SCGs. The so-called “agglomeration economies” – due to highly productive firms, a pool of qualified and educated labour, good infrastructure etc. – provide an asset for both residents and firms, and this asset can be taxed. In Spain, municipalities benefitting from agglomeration economies have higher tax rates and a lower tax base mobility – up to 40% less – than those located outside an agglomeration. In the United States, metropolitan areas levy local wage and income taxes that suburban or peripheral areas are unable to levy. In Switzerland, cities tend to have higher PIT rates than the surrounding suburban municipalities.25
29. Persisting tax differences across jurisdictions can be seen as a boon to small and peripheral jurisdictions. Since these jurisdictions cannot provide the benefits of an agglomeration, their only policy tool to attract and retain firms and residents is tax policy, i.e. the ability to offer low taxation levels. Businesses that do not need an agglomeration to prosper or that do not require much public service input may choose to move their activities. In this vein, tax autonomy is a tool for small and peripheral regions to compete against the gravitational pull of large agglomerations.26 Tax competition could hence be seen as an institutional barrier against spatial concentration of economic activities, although “aggressive” low-tax policy by small, peripheral and sometimes poor SCGs usually meets with great scepticism and political resistance, often led by larger SCGs with higher tax rates.
23. Fischer (2004) points out that minimum service requirements explain a part of the observed tax variation in
Switzerland, while the other part is due to varying public service preferences between cantons. Fiva and Rattsø (2006) show how Norwegian municipalities interact strategically when granting welfare payments, in order to avoid attracting low-income households.
24. The size effect is examined in Riedl-Rocha (2004). Dharmapala and Hines (2006) examine the size effect at the international level.
25. See for Spain Jofre-Monseny and Solé Ollé (2008) and for the US Braid (1996).
26. Baldwin and Krugman (2004) point at the advantages of tax competition for small and peripheral regions.
COM/CTPA/ECO/GOV/WP(2011)13
19
Capitalisation
30. Capitalisation reflects the impact of changes in taxation on housing demand and housing prices and tends to reduce tax base mobility. A SCG that lowers its tax rates shores up demand for property within its jurisdiction while demand in other SCGs declines. Since land and buildings are immovable and their supply quite inelastic, differences in demand become reflected in property prices. Low tax jurisdictions have thus higher property prices and vice versa, other things equal. If tax rate changes were fully capitalised, moving after a tax hike would procure no benefit since rents and property values are immediately lowered by the net present value of future tax payments. Low- and middle-income households in particular may find it unattractive to move as their future rent could go up more than their tax bill would decline, while high-income earners may still have an excess tax benefit above capitalisation providing incentives to migrate. Capitalisation reduces inter-jurisdictional mobility, but it does not necessarily reduce SCG’s incentives to cut tax rates, as residents may still vote for tax cuts expecting capital gains on their property.
31. The capitalisation of tax level differences is well-documented, both for property taxes and, to a lesser extent, personal income taxes.27 However, effective capitalisation is difficult to measure since the rate at which future tax payments have to be discounted and the degree of capitalisation cannot be estimated separately. In general, results of various empirical studies suggest that there is rarely “full” capitalisation, and that various factors other than tax policy affect the degree of capitalisation.28 Older studies that examined mobility between SCGs indeed concluded that tax differentials have no significant impact on the number of migrants, one reason being capitalisation. Newer studies that distinguish between different social groups conclude that tax-induced migration is particularly relevant for young, well-educated families and high-income earners, implying that the discount rate is to some extent income-contingent.29 There is no study on the effect of capitalisation on corporate mobility.
4. The effect of tax competition: some “stylised facts”
32. This section deals with the impact of tax competition on main policy outcomes, such as how tax competition affects differences in tax rates across jurisdictions, the level and evolution of SCG tax raising capacity/tax rates and the accountability and efficiency of the public sector. While theory on the impact of tax competition is abundant, empirical evidence is scarce and often country-specific. A few stylised facts can, however, be drawn based on a questionnaire sent to member countries in 2009.
Tax rate differences vary across countries and types of tax
33. Differences in tax rates between SCGs vary across OECD countries and across types of tax (Figure 3). Tax rate differences – as measured by the variation coefficient of SCG tax rates – are largest in Switzerland and France; and smallest in Denmark and Sweden. Differences in corporate and personal income tax rates in terms of Gini coefficients tend to be larger than in consumption and property tax rates, though not much. Also, tax rate differences tend to have decreased over the last decade (Annex Tables A5). Tax rate differences could be seen as an outcome indicator measuring the intensity of tax competition in a country, with higher differences pointing at stronger competition. However, several 27. See, for example, for the United States Oates (1969) and for Switzerland Feld and Kirchgässner (1997).
28. US-studies of the 1990s assuming full capitalisation came up with a discount rate between 3 and 6%, which was lower than US long-term treasury bonds at that time, meaning that tax rate changes are actually not fully capitalised. Hilber and Mayer (2001) give an overview on public spending determinants of capitalisation in property prices.
29. An early study reporting little tax-induced mobility is Frey et al. (1981). Schmidheiny (2006) or Liebig et al. (2007) suggest that the young expect a better low tax-high property price trade-off over their life span.

COM/CTPA/ECO/GOV/WP(2011)13
20
caveats apply to this interpretation. On the one hand, tax rate differentials can be the result of factors other than tax competition. As an example, differences in property tax rates may be the result of yardstick rather than tax competition. On the other hand, tax competition can be very fierce but the result could be an equilibrium situation with similar tax rates everywhere.
Figure 3. SCG tax rate variations across countries and types of tax
Weighted variation coefficients, 2007
PITCIT
Prop. TaxCons. Tax
0
1
2
3
4
5
6
Canada*
Italy*
*
Spain STA
Switz. STA
Denm
ark
Finland
France
REG*
*
France
DEP**
Norw
ay
Portugal
Spain LO
C
Swed
en
Switz. LOC
Tax rates variation indicator
Note: The tax rate variation indicator is constructed by multiplying the tax rate variation coefficient with the share of that tax in general government tax revenue. The Italian IRAP and the French taxe professionelle are categorized as CIT. For Canada, indicators are obtained by multiplying the aggregate tax burden variation coefficient with the share of each tax in general government tax revenue.
Source: Fiscal Network database and questionnaire responses.
Tax rates are lower in wealthier SCGs
34. Tax rates appear to be consistently lower in wealthier SCGs than in poor SCGs, i.e. there is a negative relationship between tax rates and tax raising capacity (i.e. wealth)30 (Figure 6). There appears to be a sorting effect with respect to income levels, i.e. tax rates appear to have a consistent impact on the distribution of high-income households or firms across SCGs. This tends to confirm some presumptions on the relationship between a SCG’s tax rates and its wealth. It is sometimes even suggested that SCGs with weak tax raising capacity are forced to set higher tax rates in order to fund a given level of public services and to maintain fiscal sustainability, triggering a vicious circle of high taxes, low tax revenue, low service levels, outmigration and even higher taxes, although this is not in line with the data in Figure 6.
35. Comparing the set of countries and the years for which data are available, the following can be concluded (for detailed results see Annex Tables A3 and A4):
The relationship between tax rates and tax raising capacity is negative for all countries and levels of government except for Spain (state level), Portugal and Switzerland (local level). In around
30. Tax raising capacity is a measure to compare SCGs economic or fiscal wealth, comparable to GDP or
household income. It is defined as the tax revenue a SCG could obtain by applying a standard tax rate on a standard tax base. Tax raising capacity is expressed in per capita terms or in per cent of the national average.
COM/CTPA/ECO/GOV/WP(2011)13
21
two thirds of countries the relationship is statistically significant. Differences tend to be higher between the state levels of federal countries than between the local level of unitary countries.
For the 10 countries/SCG levels for which time series are available, the slope increased for seven countries – i.e. the gap between wealthy low-tax and poor high-tax SCGs widened – while the gap tended to close for only three countries. A few countries and government levels show little change in the relationship.
SCGs changed their rank in terms of tax raising capacity little, with rank correlation coefficients 0.83 or above for the 1997 to 2007 period, except for Mexico where the coefficient was 0.51. The SCG ranking order is particularly stable in Germany where the rank correlation coefficient reaches 0.99 for the 1997/2007 decade.
The tax mix appears to have a minor role in shaping differences in tax rates. Countries with a high share of sub-central CIT or PIT do not show higher tax rate differences. Also, spending responsibilities do not seem to affect the strength of the relationship, although testing for this would require a deeper analysis of SCG spending power.

COM/CTPA/ECO/GOV/WP(2011)13
22
Figure 4. Implicit SCG tax rates and tax raising capacity are negatively correlated
a) State level
Canada France (regions)
0
20
40
60
80
100
120
140
160
180
200
0 30 60 90 120 150 180 210 240 270 300
Implicit tax rate (in % of average)
Tax raising capacity per capita (in % of average)
1997
2006
0
20
40
60
80
100
120
140
160
180
200
0 30 60 90 120 150 180 210 240 270 300
Implicit tax rate (in % of average)
Tax raising capacity per capita (in % of average)
2002
2007
Italy Spain
0
20
40
60
80
100
120
140
160
180
200
0 30 60 90 120 150 180 210 240 270 300
Implicit tax rate (in % of average)
Tax raising capacity per capita (in % of average)
0
20
40
60
80
100
120
140
160
180
200
0 30 60 90 120 150 180 210 240 270 300
Implicit tax rate (in % of average)
Tax raising capacity per capita (in % of average)
2002
2007
Switzerland United States
0
20
40
60
80
100
120
140
160
180
200
0 30 60 90 120 150 180 210 240 270 300
Implicit tax rate (in % of average)
Tax raising capacity per capita (in % of average)
1998
2006
0
20
40
60
80
100
120
140
160
180
200
0 30 60 90 120 150 180 210 240 270 300
Implicit tax rate (in % of average)
Tax raising capacity per capita (in % of average)
1994
2007
COM/CTPA/ECO/GOV/WP(2011)13
23
b) Local level
Denmark Finland
0
20
40
60
80
100
120
140
160
180
200
0 30 60 90 120 150 180 210 240 270 300
Implicit tax rate (in % of average)
Tax raising capacity per capita (in % of average)
1997
2007
0
20
40
60
80
100
120
140
160
180
200
0 30 60 90 120 150 180 210 240 270 300
Implicit tax rate (in % of average)
Tax raising capacity per capita (in % of average)
1997
2007
France (départements) Germany (municipalities in the Bundesland of Nordrhein-Westfalen)
0
20
40
60
80
100
120
140
160
180
200
0 30 60 90 120 150 180 210 240 270 300
Implicit tax rate (in % of average)
Tax raising capacity per capita (in % of average)
2002
2007
0
20
40
60
80
100
120
140
160
180
200
0 30 60 90 120 150 180 210 240 270 300
Implicit tax rate (in % of average)
Tax raising capacity per capita (in % of average)
1997
2007
Portugal Spain (local level in selected autonomous regions)
0
20
40
60
80
100
120
140
160
180
200
0 30 60 90 120 150 180 210 240 270 300
CIT and Property tax (CA or IMI) Implicit tax rate (in % of average)
Aggregate tax base per capita (in % of average)
2002
2007
0
20
40
60
80
100
120
140
160
180
200
0 30 60 90 120 150 180 210 240 270 300
AST BAL CYL CLM CVA EXT Barcelona
Property tax rates (in % of region average)
Property tax rainsing capacity (in % of region average)

COM/CTPA/ECO/GOV/WP(2011)13
24
Sweden Switzerland (municipalities in the canton of Zürich)
0
20
40
60
80
100
120
140
160
180
200
0 30 60 90 120 150 180 210 240 270 300
Implicit tax rate (in % of average)
Tax raising capacity per capita (in % of average)
1997
2007
50
70
90
110
130
150
170
‐120 ‐100 ‐80 ‐60 ‐40 ‐20 0 20 40 60 80 100 120
Tax rate (in % of Zurich canton average)
Aggregate tax base per capita: % above or below Zurich canton average
97/98
2006
Note: Implicit tax rates are calculated as tax revenues divided by tax raising capacity and then normalised. Dots show values for 1997, triangles show values for 2007. In the figure for Spain, abbreviations stand for the name of individual autonomous regions.
Source: Fiscal decentralisation database, questionnaire on SCG tax competition.
36. The panel covers the majority of countries with SCG tax autonomy, so the results can be considered rather robust. As with many correlations, they do not imply causality and reverse causation cannot be excluded: seen from one side, poor SCGs set high rates because they need to fund minimal public service levels, sometimes defined by central government. Seen from the other side, high tax SCGs are poor because they set high taxes rates and hence reduce their economic potential. In both interpretations tax revenue elasticities are probably quite low on average, making tax reductions an unattractive policy tool and trapping SCGs in their current situation. The empirical studies on tax competition and tax base mobility give credence to both interpretations (see Annex Table A1).
There is no “race to the bottom”, and tax rates tend to converge
37. SCG tax rates tend to go up rather than down, and they tend to converge over time, regardless of the tax type (Figure 5). A “race to the bottom”, especially between wealthier SCGs, cannot be observed. This tends to contradict the view that tax competition may result in taxation levels too low to sustain adequate public service levels. Moreover, the trend for rising tax rate differences between SCGs cannot be confirmed: for the countries under scrutiny, tax rates mostly tend to converge rather than to diverge. While the results do not cover all OECD countries with highly autonomous SCGs, they nevertheless provide a fairly broad sample of SCG tax setting behaviour.
38. Different factors may explain why the “race-to-the bottom” hypothesis is not confirmed. First, in many countries where SCGs tap the same base as central government, vertical tax competition – which has the effect of increasing rather than decreasing tax rates – may countervail horizontal tax competition forces, as is best shown by the example of France (Box 5) but is also evident in more decentralised countries such as the United States or Switzerland. Second, in some countries SCGs are not allowed to lower tax rates below a certain threshold, so are actually prevented from further competing on tax policy once the bottom has been reached (Table A2). Third, many fiscal arrangements, particularly fiscal equalisation can actually reverse incentives and make SCGs increase rather than decrease their own tax rates, with a trend towards more equal taxation across SCGs (see the section on fiscal equalisation).

COM/CTPA/ECO/GOV/WP(2011)13
25
Figure 5. SCG tax rate evolution 1997-2007, selected countries
Switzerland (state level)
10.0
11.0
12.0
13.0
14.0
15.0
1997 1998 1999 2000 2001 2002 2003 2004 2005 2006 2007
Implicit tax rate (%)
Sweden (municipal PIT) Finland (municipal PIT)
‐
0.02
0.04
0.06
0.08
0.10
25
27
29
31
33
35
1993 1994 1995 1996 1997 1998 1999 2000 2001 2002 2003 2004 2005 2006 2007 2008 2009 2010
mean mean + stdv mean ‐ stdv coefficient of variation (RHS)Statutory tax rate
0.00
0.03
0.06
0.09
0.12
12
14
16
18
20
1970
1971
1972
1973
1974
1975
1976
1977
1978
1979
1980
1981
1982
1983
1984
1985
1986
1987
1988
1989
1990
1991
1992
1993
1994
1995
1996
1997
1998
1999
2000
2001
2002
2003
2004
2005
2006
2007
2008
mean mean ‐ stdev mean + stdev Coeficient of variationStatutory tax rate
Denmark (local level) France (regions)
20.0
21.0
22.0
23.0
24.0
25.0
1997 1998 1999 2000 2001 2002 2003 2004 2005 2006 2007
Personal Income tax rate (%)
0.0
0.5
1.0
1.5
2.0
2.5
3.0
3.5
1987 1988 1989 1990 1991 1992 1993 1994 1995 1996 1997 1998 1999 2000 2001 2002 2003 2004 2005 2006 2007 2008
Wheighted tax rate
Germany (municipal business surcharge or “Hebesatz”) United States (general sales tax at state level)
380.0
385.0
390.0
395.0
400.0
405.0
410.0
415.0
420.0
1997 1998 1999 2000 2001 2002 2003 2004 2005 2006 2007
Hebesatz
0.15
0.18
0.21
0.24
0.27
0.30
2
3
4
5
6
7
1978 1980 1982 1984 1985 1986 1987 1988 1989 1990 1991 1992 1993 1994 2000 2003 2004 2006 2007 2008
mean mean ‐ stdev mean + stdev coefficient of variation (RHS)
Source: OECD fiscal decentralisation database and questionnaire responses. Implicit tax rates (or tax burden) are calculated by dividing tax revenues by tax raising capacity
Differences in tax raising capacity are not exacerbated by tax competition
39. Differences in tax raising capacity – or economic wealth – across SCGs are negatively correlated with sub-central tax autonomy, i.e. the stronger sub-central tax autonomy in a country, the lower tax disparities (Figure 7 and Table A3). This result may be surprising. As shown above, it is often argued that tax autonomy and tax competition would trigger a vicious circle of growing differences in tax raising capacity over time. Wealthier regions could reduce tax rates, while poor regions could not, which in turn would lead to further tax base migration towards wealthier regions. In this line of argument, economic wealth in a country with large tax autonomy would be more unevenly distributed across jurisdictions than in a country with little tax autonomy. The results in Figure 7 and Table A3 suggest the opposite.
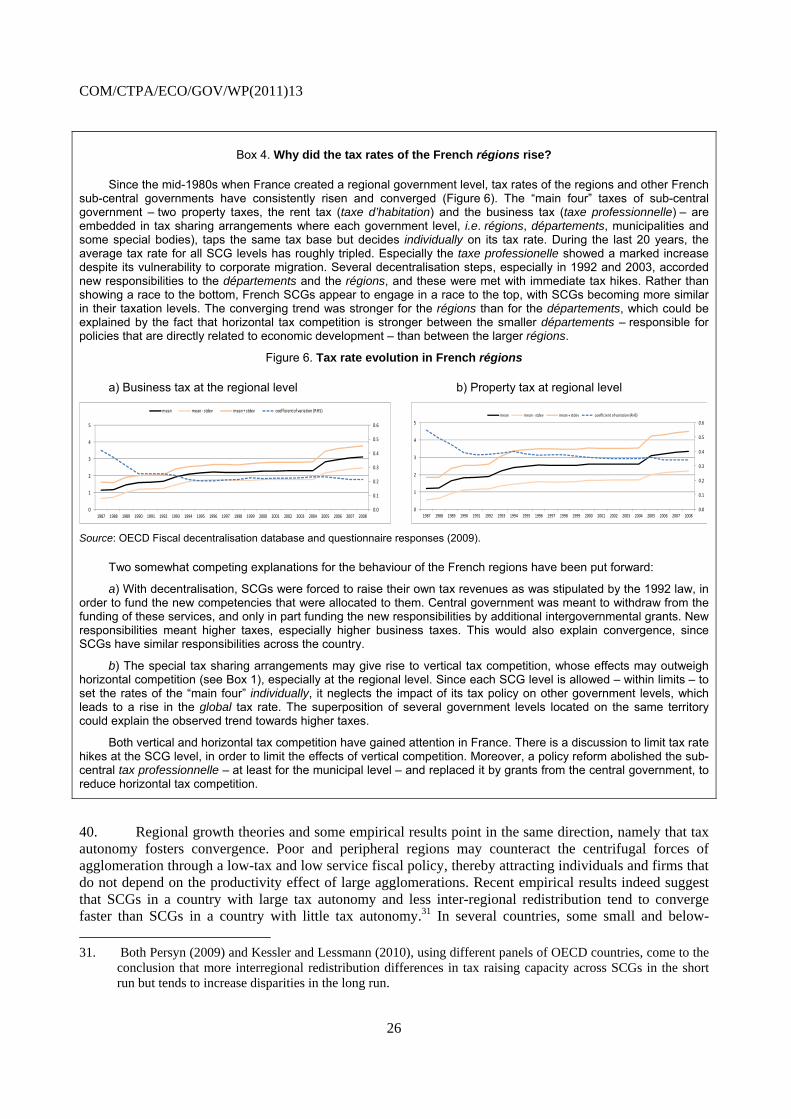
COM/CTPA/ECO/GOV/WP(2011)13
26
Box 4. Why did the tax rates of the French régions rise?
Since the mid-1980s when France created a regional government level, tax rates of the regions and other French sub-central governments have consistently risen and converged (Figure 6). The “main four” taxes of sub-central government – two property taxes, the rent tax (taxe d’habitation) and the business tax (taxe professionnelle) – are embedded in tax sharing arrangements where each government level, i.e. régions, départements, municipalities and some special bodies), taps the same tax base but decides individually on its tax rate. During the last 20 years, the average tax rate for all SCG levels has roughly tripled. Especially the taxe professionelle showed a marked increase despite its vulnerability to corporate migration. Several decentralisation steps, especially in 1992 and 2003, accorded new responsibilities to the départements and the régions, and these were met with immediate tax hikes. Rather than showing a race to the bottom, French SCGs appear to engage in a race to the top, with SCGs becoming more similar in their taxation levels. The converging trend was stronger for the régions than for the départements, which could be explained by the fact that horizontal tax competition is stronger between the smaller départements – responsible for policies that are directly related to economic development – than between the larger régions.
Figure 6. Tax rate evolution in French régions
a) Business tax at the regional level b) Property tax at regional level
0.0
0.1
0.2
0.3
0.4
0.5
0.6
0
1
2
3
4
5
1987 1988 1989 1990 1991 1992 1993 1994 1995 1996 1997 1998 1999 2000 2001 2002 2003 2004 2005 2006 2007 2008
mean mean ‐ stdev mean + stdev coefficient of variation (RHS)
0.0
0.1
0.2
0.3
0.4
0.5
0.6
0
1
2
3
4
5
1987 1988 1989 1990 1991 1992 1993 1994 1995 1996 1997 1998 1999 2000 2001 2002 2003 2004 2005 2006 2007 2008
mean mean ‐ stdev mean + stdev coefficient of variation (RHS)
Source: OECD Fiscal decentralisation database and questionnaire responses (2009).
Two somewhat competing explanations for the behaviour of the French regions have been put forward:
a) With decentralisation, SCGs were forced to raise their own tax revenues as was stipulated by the 1992 law, in order to fund the new competencies that were allocated to them. Central government was meant to withdraw from the funding of these services, and only in part funding the new responsibilities by additional intergovernmental grants. New responsibilities meant higher taxes, especially higher business taxes. This would also explain convergence, since SCGs have similar responsibilities across the country.
b) The special tax sharing arrangements may give rise to vertical tax competition, whose effects may outweigh horizontal competition (see Box 1), especially at the regional level. Since each SCG level is allowed – within limits – to set the rates of the “main four” individually, it neglects the impact of its tax policy on other government levels, which leads to a rise in the global tax rate. The superposition of several government levels located on the same territory could explain the observed trend towards higher taxes.
Both vertical and horizontal tax competition have gained attention in France. There is a discussion to limit tax rate hikes at the SCG level, in order to limit the effects of vertical competition. Moreover, a policy reform abolished the sub-central tax professionnelle – at least for the municipal level – and replaced it by grants from the central government, to reduce horizontal tax competition.
40. Regional growth theories and some empirical results point in the same direction, namely that tax autonomy fosters convergence. Poor and peripheral regions may counteract the centrifugal forces of agglomeration through a low-tax and low service fiscal policy, thereby attracting individuals and firms that do not depend on the productivity effect of large agglomerations. Recent empirical results indeed suggest that SCGs in a country with large tax autonomy and less inter-regional redistribution tend to converge faster than SCGs in a country with little tax autonomy.31 In several countries, some small and below-
31. Both Persyn (2009) and Kessler and Lessmann (2010), using different panels of OECD countries, come to the
conclusion that more interregional redistribution differences in tax raising capacity across SCGs in the short run but tends to increase disparities in the long run.

COM/CTPA/ECO/GOV/WP(2011)13
27
average tax capacity jurisdictions engage in an active low-tax policy, which helps them – at least partially – catch up with wealthier regions. However, reverse causality cannot be completely excluded: countries with low inter-regional disparities may be inclined to grant more tax autonomy to their SCGs.
Figure 7. Disparities in tax raising capacity are lower in countries with large tax autonomy
Values for 2007 and 19 countries/different SCG levels
AUS STAAUT STA
CAN STA
ITA STA
MEX STA
CHE STA
FRA
DEU LOC
ESP STA
FINJAPPOL
POR
ESP LOC
SWE
CHE LOC
DENUSA STADEU STA
0.00
0.05
0.10
0.15
0.20
0.25
0.30
0.35
0.40
0.45
0.50
0 5 10 15 20 25 30 35 40
Gini Coeffcient of tax raising capacity
Autonomous tax revenues (% of total tax revenues)
r2 = 0,41
Note: Results are significant at the 10% level.
Source: OECD Fiscal decentralisation database and questionnaire responses (2009).
Tax competition is likely to increase public sector efficiency
41. There is a general view that more tax competition leads to more efficiency in the public sector, both by making public providers more responsive to consumers’ tastes and by raising the quality and lowering the cost of publicly-funded services. Tax autonomy provides voters with an additional lever in shaping the public sector, namely to decide on tax levels, making them more aware of public service outcomes. Moreover, tax base mobility can put pressure on governments to reduce government size and to use public money efficiently. There is little empirical research that tests for the impact of tax autonomy and tax competition on public sector size and efficiency, however. In German municipalities, the extent of fiscal autonomy tends to have a positive impact on the efficiency of municipal spending (Geys, Heinemann and Kalb, 2010). Similar results appear to hold for Norway (Borg, 2009). In Swiss local and state governments, more tax autonomy and tax competition is associated with a smaller size of the public sector (Feld, Kirchgässner and Schaltegger, 2010). In the United States, revenue decentralisation tends to reduce the overall size of general government (Jin and Zou, 2002). As pointed out earlier, SCGs faced with tax competition tend to invest in immobile public service inputs that raise the productivity of private investment, such as physical infrastructure, environmental quality and, to some extent, education.
5. Government responses to perceived excesses of tax competition
42. Most countries with sub-central tax autonomy have to cope with SCGs making use of this autonomy. Tax interaction is widespread, and tax competition might have become stronger with the likely increase of tax base mobility. The fiscal and economic crisis might have boosted SCG’s incentives for strategic tax policy, as taxation is often one of the most straightforward policy measures a government has
COM/CTPA/ECO/GOV/WP(2011)13
28
to bolster its economy. In most countries, central government constrains sub-central tax competition, often due to the perception that it is “excessive”. This section presents and evaluates the most frequent policies likely to reduce tax competition.
Moving towards property taxation
43. An obvious move for countries to reduce SCG tax competition is to change the tax structure and to tax less mobile tax bases. Such a move would mean fostering property taxes and, to a lesser extent, consumption taxes at the expense of corporate and personal income taxes, especially for those countries where PIT and CIT make up a considerable part of SCG tax revenue. As shown in previous sections, tax interaction on the property tax is mainly of the yardstick competition type, i.e. reflecting political competition and citizen’s preferences for public services rather than the endeavour to attract mobile tax bases. If SCG tax autonomy is aimed at giving citizens the power to shape the size and structure of the public finances without too many side-effects from shifting tax bases, then property taxes are likely the best suited for the sub-central and particularly the local level. Moreover, property taxes are more friendly to economic growth than most other taxes, and distortions from tax exporting seem to be small. Despite its advantages, property taxation has declined as a share of SCG revenue, mainly for political economy reasons. The tax is highly visible, and capitalisation – i.e. higher taxes reduce property values – makes property-owners oppose tax hikes. Property tax reforms are hence likely to pass only within wider-reaching tax reforms bundling various elements (Brys, 2010).
44. Some sub-central consumption taxes are also less prone to tax competition. Destination-based VAT/sales taxes or a combination of central and sub-central VATs are taxing a relatively immobile tax base, namely final consumption. Moreover and after property tax, consumption taxes are the least damaging to economic growth. Recent tax reforms in Canada – where the provinces replaced a simple sales tax by a broader sub-central value-added tax – point at the growth-enhancing effects as well as the political feasibility of such reforms. As the Canadian example shows, sub-central consumption taxes are best suited for geographically “large” SCGs within “large” countries, where cross-border shopping and other tax externalities play a comparatively minor role. Finally, appropriate apportionment formulas – i.e. the rules and formulas according to which tax revenue of multi-jurisdictional firms is distributed – can make the corporate income tax more akin to a consumption tax and hence make it less sensitive to tax competition. In the last two decades, the US states have moved towards sales as the main apportionment indicator to distribute multi-jurisdictional firms’ CIT revenue across states, making the CIT akin to a sales tax. Similarly, parts of the personal income tax – e.g. income from immovable property – may be apportioned based on the origin of the income rather than residence of the taxpayer.
Harmonised sub-central tax bases
45. Central government or all SCGs together may “harmonise” the sub-central tax base, whereby tax base legislation is no longer at the discretion of an individual SCG. Tax base harmonisation can take on various forms, such as limiting the right to introduce or abolish a tax, the tax object, deductions such as tax credits and reliefs, limits on special tax benefit packages, and procedural aspects such as tax periods. The central government may either require SCGs to align their tax bases with an upper government level or among each other. With a harmonised tax base, SCGs’ only policy lever is tax rates, corresponding to the “b” category in the OECD’s tax autonomy classification. In the last decade, OECD countries have indeed on average shifted towards the “b” category (Blöchliger and Rabesona, 2009). In 2010 several Canadian provinces harmonised their sales taxes with the federal value added tax, while in 2001 an after a 10 years long transition period the Swiss cantons largely harmonised the tax bases for sub-central income taxes. Conversely, the lack of sub-central VAT tax base harmonisation in Brazil is seen as a major reason for the ongoing “tax war” between the Brazilian states. The main policy objective for the central government –

COM/CTPA/ECO/GOV/WP(2011)13
29
apart from moving from the origin to the destination principle – is to have a common tax base across the states and leaving states little or no discretion to grant exemptions and tax-benefit packages.
46. Tax base harmonisation has advantages and drawbacks. Tax base harmonisation can simplify the tax system and improve coordination across government levels, overcome information asymmetries and increase transparency about effective tax levels. It diminishes SCG’s incentive to rely on special tax benefit packages and to engage in “unfair” tax competition, and hence can be seen as limiting the influence of special interest groups on sub-central tax policy. On the other hand, tax base harmonisation deprives SCGs of the possibility to adapt their tax policy to special circumstances. Moreover, it reduces the probability of tax innovations at the local level and hence the virtues of decentralisation as a laboratory for fiscal policy. The relative weight of advantages and disadvantages may also depend on the type of tax. Tax base harmonisation might be particularly advantageous for consumption taxes, given the impact they have on internal and international trade and the role of tax exporting. As tax base harmonisation is often associated with tax base broadening, the respective political economy drivers must be taken into account.32
Fiscal equalisation
47. Most countries use fiscal equalisation as a tool for reducing negative impacts of tax autonomy and tax competition. Fiscal equalisation has two effects on SCG tax policy: a) it reduces ex post differences in tax raising capacity resulting from tax competition and tax base mobility, and b) it reduces ex ante incentives to engage in predatory tax practices.
48. Equalisation reduces – by definition – disparities between SCGs and reduces incentives to lower tax rates, and strong equalisation may result in higher rather than lower tax rates in some SCGs. Most equalisation systems put a higher marginal equalisation rate on poor than on wealthy jurisdictions, which can be particularly detrimental to economic and fiscal development efforts of poor SCGs. Horizontal equalisation, i.e. between wealthy and poor SCGs, tends to be more effective than vertical equalisation in reducing tax rate differences since it affects tax policy of all and not only the poor SCGs. Equalisation based on tax raising capacity has a stronger effect on reducing tax competition than systems that rely on cost and needs. In order for equalisation to be “efficiently redistributive” and to avoid persistent differences in tax rates, tax capacity equalisation could take inter-jurisdictional wage differences or living standards into account, or give a higher weight to populous and/or densely populated areas.33
Other constraints on sub-central tax autonomy
49. Countries have resorted to other policies that limit SCGs’ ability to compete on tax policy, partially in the wake of the financial and economic crisis. Several countries set maximum and minimum tax rates, thereby limiting sub-central tax autonomy and preventing perceived “excessive” or “predatory” tax rate setting. In 2009, Italy set up such provisions for regional taxes. Japan requires SCGs to set a standard tax rate unless a SCG can show a “financial reason” to do otherwise. While such provisions
32. The ongoing debate on the pros and cons of tax base harmonisation in Switzerland is summarised in Baur
(2010). Sales taxes harmonisation in the Canadian province of Ontario, broadening the consumption tax base, was coupled to a wide-ranging reform of the provincial tax system, thereby reducing distributional conflicts (OECD, 2010).
33. The horizontal equalisation scheme in Germany reduces disparities more efficiently than the vertical equalisation system in Canada. The move from cost-based towards more tax capacity-based equalisation has likely improved both efficiency and equity of the system in Portugal and Switzerland. The Austrian and German equalisation scheme have special distribution keys for large states and municipalities, while the Canadian and Swiss equalisation schemes do not (for a discussion on the characteristics of equalisation system see Blöchliger and Charbit, 2008)
COM/CTPA/ECO/GOV/WP(2011)13
30
reduce tax competition, they may also give rise to structural imbalances between tax revenues and spending needs, they reduce voter’s influence on taxation and public service levels, and they tend to prevent small and poor SCGs from using tax policy as an economic development tool. Another way to limit tax competition is to require SCGs to use progressive taxation, thereby limiting SCG’s ability to compete for mobile high-income earners. Belgium and Portugal require SCGs to have progressive personal income taxation. In Switzerland, degressive, i.e. less than proportional taxation is prohibited. Several countries allow SCGs to set proportional surcharges on progressive income taxes, keeping the system overall progressive. While some provisions maintaining progressivity and thus reducing tax competition could be justified on equity grounds, progressive personal income taxation tends to undermine incentives to work and, in the long term, slows down growth. Finally, territorial reforms such as jurisdictional mergers tend to reduce tax competition, especially if SCGs of different sizes and/or of different economic and fiscal wealth are merged.

COM/CTPA/ECO/GOV/WP(2011)13
31
BIBLIOGRAPHY
Albouy, D. (2010), “Evaluating the Efficiency and Equity of Federal Fiscal Equalization”, NBER Working Paper, No. 16144.
Allers, M.A. and J.P. Elhorst (2005), “Tax Mimicking and Yardstick Competition among Local Governments in the Netherlands”, International Tax and Public Finance, No. 12.
Augustine, N., M. Bell, D. Brunori and J. Youngman (eds.) (2009), “Erosion of the Property Tax Base”, Lincoln Institute of Land Policy, Cambridge/Mass.
Baldwin, R. and P. Krugmann (2004), “Agglomeration, Integration and Tax Harmonization“, NBER Working Paper, No. 9290.
Barrios, S., H. Huizinga, L. Laeven and G. Nicodeme (2008), “International Taxation and Multinational Firm Location Decisions”, Center for Economic Policy Research Discussion Paper, No. 7047.
Baur, M. (2010), “Harmonising the Tax Base: Pros and Cons”, presentation to the workshop on tax competition, Bern, www.oecd.org/dataoecd/46/19/45470610.pdf
Becker, S.O., P.H. Egger and V. Merlo (2009), “How Low Business Tax Rates Attract Multinational Headquarters: Municipality-Level Evidence from Germany”, CESifo Working Paper, No. 2517.
Bénassy-Quéré, A., N. Gobalraja and A. Trannoy (2007), “Tax and Public Input Competition”, Economic Policy, April.
Besley, T. and A. Case (1995), “Incumbent Behavior: Vote Seeking, Tax Setting and Yardstick Competition”, American Economic Review, Vo. 85, No. 1, March.
Bird, R. and T. Stauffer (2001), Intergovernmental Fiscal Relations in Fragmented Societies, Helbing and Lichtenhahn, Basel.
Blöchliger, H. (2008), “Market Mechanisms in Public Service Provision”, OECD Economics Department Working Papers, No. 626, OECD, Paris.
Blöchliger, H. and C. Charbit (2008), “Fiscal Equalisation”, OECD Economic Studies, Vol. 2008, OECD, Paris.
Blöchliger, H. and D. King (2006), “Less than You Thought: The Fiscal Autonomy of Sub-Central Governments”, OECD Economic Studies, No. 43, OECD, Paris.
Blöchliger, H. and O. Petzold (2009), “Taxes or Grants: What Revenue Sources for Sub-central Governments?”, OECD Economics Department Working Papers, No. 704, Paris.
Boadway, R. (2003), “The Theory and Practice of Equalization”, Queen’s Economics Department Working Paper, No. 1016.
Bordignon, M., F. Cerniglia and F. Revelli (2003), “In Search of Yardstick Competition: a Spatial Analysis of Italian Municipality Property Tax Setting”, Journal of Urban Economics, Vol. 54.
COM/CTPA/ECO/GOV/WP(2011)13
32
Braid, R.M. (1996), “Symmetric Tax Competition with Multiple Jurisdictions in Each Metropolitan Area”, American Economic Review ,Vol. 86.
Brett, C. and J. Pinkse (2000), “The Determinants of Municipal Tax Rates in British Columbia”, Canadian Journal of Economics, Vol. 34.
Brys, B. (2010), “Tax Reforms”, in: OECD, Making Reform Happen, Paris.
Bucovetsky, S. (1991), “Asymmetric Tax Competition”, Journal of Urban Economics, Vol. 30, No. 2
Büttner, T. (2001), “Local Business Taxation and Competition for Capital: the Choice of the Tax Rate”, Regional Science and Urban Economics, No. 31.
Büttner, T. (2003), “Tax Base Effects and Fiscal Externalities of Local Capital Taxation: Evidence from a Panel of German Jurisdictions”, Journal of Urban Economics, No. 54.
Carlsen, F., B. Langset and J. Rattsø (2005), “The Relationship between Firm Mobility and Tax Level: Empirical Evidence of Fiscal Competition between Local Governments”, Journal of Urban Economics, No. 58.
Conway, K.S and A. Houtenville (2001): “Elderly Migration and State Fiscal Policy: Evidence from the 1990 Census”, National Tax Journal 54.
Dahlby, B. and N. Warren (2003), “Fiscal Incentive Effects of the Australian Equalisation System”, The Economic Record, Vol. 79.
Devereux M.P. and P.B Sørensen (2006), “The Corporate Income Tax: International Trends and Options for Fundamental Reform”, European Economy Economic Papers, No. 264.
Devereux M.P., B. Lockwood and M. Redoano (2007), “Horizontal and Vertical Indirect Tax Competition: Theory and Some Evidence from the USA”, Journal of Public Economics, Vol. 91.
Dharmapala, D. and J.R. Hines (2006), “Which Countries Become Tax Havens?” NBER Working Paper, No. 12802.
Edmark, K. and H. Ågren (2008), “Identifying Strategic Interactions in Swedish Local Income Tax Policies”, Journal of Urban Economics, No. 63.
Edmiston, K. and F. Arze del Granado (2006): “Economic Effects of Apportionment Formula Changes”, Public Finance Quarterly, Vol. 34.
Esteller-Moré, A. and A. Solé Ollé (2002), “Tax Setting in a Federal System: The Case of Personal Income Taxation in Canada”, International Tax and Public Finance, Vol. 9.
Feld, L. P. and G. Kirchgässner (1997), “Kapitalisierung von Steuern und öffentlichen Leistungen in den Mietzinsen: Eine empirische Überprüfung der Tiebout-Hypothese für die Schweiz“, in: Schmid, H. and T. Slembeck (eds): Finanz- und Wirtschaftspolitik in Theorie und Praxis, pp. 64–92, S. Haupt, Bern.
Feld, L. P., J.-M. Josselin et Y. Rocaboy (2002), “Le mimétisme fiscal : une application aux Régions françaises“, La Documentation française, Économie et Prévision.
Feld, L.P. und E. Reulier (2009), “Strategic Tax Competition in Switzerland: Evidence from a Panel of the Swiss Cantons”, German Economic Review, Vol 10.
COM/CTPA/ECO/GOV/WP(2011)13
33
Feld, L.P. und G. Kirchgässner (2001), “Income Tax Competition at the State and Local Level in Switzerland”, Regional Science and Urban Economics, Vol. 31.
Feld, L., G. Kirchgässner and C. Schaltegger (2010), “Decentralized Taxation and the Size of Government: Evidence from Swiss State and Local Governments”, Southern Economic Journal, Vol. 77.
Ferede, E. and B. Dahlby (2010): “Tax Cuts, Economic Growth, and the Marginal Cost of Public Funds for Canadian Provincial Governments”, mimeo, University of Alberta, www.uofaweb.ualberta.ca/economics2/pdfs/WP-Dahlby-Ferede-Tax-Cuts-Economic-Growth-Dec09.pdf
Fischer, R. (2004), “Die Unterschiede in der Steuerbelastung der Kantone. Eine Analyse auf der Basis eines mikroökonomischen Haushaltsmodells”, Working Paper 6, Swiss Federal Finance Administration, www.efv.admin.ch/d/wirtsch/studien/berichte.htm
Fiva, J. and J. Rattsø (2006): “Welfare Competition in Norway: Norms and Expenditures”, European Journal of Political Economy 22.
Francois, I. (2010): “Sub-central Tax Competition: the French Case”, presentation to the Workshop on Tax Competition, Bern, www.oecd.org/dataoecd/46/38/45470485.pdf.
Fredriksson, P.G., J. A. List and D. L. Millimet: “Chasing the Smokestack: Strategic Policymaking with Multiple Instruments”, NBER Working Paper, No. 9801.
Frey, R.L. (1981), Von der Land- zur Stadtflucht. Bestimmungsfaktoren der Bevölkerungswanderungen in der Region Basel, Peter Lang, Bern/Frankfurt.
Gichiru, W, J. Hassemer, C. Maxim, R. Phetchareun and D. Ah Won (2009), “Sub-central Tax Competition in Canada, the United States, Japan and South Korea”, Paper prepared for the OECD Fiscal Network, LaFollette School of Public Affairs, www.lafollette.wisc.edu/publications/workshops.html
Griffith, R and A. Klemm (2004), “What Has Been the Tax Competition Experience of the Last 20 Years?”, Institute for Fiscal Studies Working Paper 04/05, London.
Hauptmeier, S., F. Mittermaier and J. Rincke (2008), “Fiscal Competition over Taxes and Public Inputs: Theory and Evidence”, Cesifo Working Paper, No. 2499.
Hayashi, M. and R. Boadway (2001), “An Empirical Analysis of Intergovernmental Tax Interaction: The Case of Business Income Taxes in Canada”, Canadian Journal of Economics, Vol. 34.
Heyndels, B. and J. Vuchelen (1998), “Tax Mimicking Among Belgian Municipalities”, National Tax Journal, Vol. 51, No. 1.
Hilber, C. and C. Mayer (2001): “Land Supply, House Price Capitalization, and Local Spending on Schools”, The Wharton School, University of Pennsylvania http://realestate.wharton.upenn.edu/newsletter/392.pdf (downloaded 17/12/2010).
Hoyt, W.H. (1992), “Market Power of Large Cities and Policy Differences in Metropolitan Areas”, Regional Science and Urban Economics, Vol. 22, No. 4.
COM/CTPA/ECO/GOV/WP(2011)13
34
Jofre-Monseny J. and A. Solé-Ollé (2008), “Which Communities Should Be Afraid of Mobility? The Effects of Agglomeration Economies on the Sensitivity of Firm Location to Local Taxes”, Cesifo Working Paper, No. 2311
Johansson, A., C. Heady, J. Arnold, B. Brys and L. Vartia (2008), “Taxation and Economic Growth”, OECD Economics Department Working Papers, No. 620, OECD, Paris.
John, A., H. Bloom and H.F. Ladd (1988), Property Taxes and House Values: The Theory and Estimation of Intrajurisdictional Property Tax Capitalization, Academic Press, San Diego, CA.
Kangasharju, A., A. Moisio, E. Reulier and Y. Rocaboy (2006), “Tax Competition among Municipalities in Finland”, Urban Public Economics Review.
Kessler A. and C. Lessmann (2010), “Interregional Redistribution and Regional Disparities: How Equalization Does (Not) Work”, CEPR Discussion Paper 8133, Center For Economic Policy Research.
Köthenbürger, M. (2008), “How Do Local Governments Decide on Public Policy in Fiscal Federalism? Tax vs. Expenditure Optimization”, Cesifo Working Paper, No. 2385.
Laubach, T. (2005): “Fiscal Relations Across Levels of Government in the United States”, OECD Economic Department Working Paper 462, Paris.
Liebig, T., P.A. Puhani und A. Sousa-Poza (2007), “Taxation and Internal Migration: Evidence from the Swiss Census Using Community-Level Variation in Income Tax Rates”, Journal of Regional Science, No. 47.
Lytkänen, T. (2008), “The Effect of Three-rate Property Taxation on Housing Construction”, VATT Discussion Papers 419, Helsinki.
Marè, M. (2007), “Sub-Central Consumption Taxes”, document prepared for the Annual Meeting of the Fiscal Network, OECD, Paris.
McLure, C. (2000), “Implementing Subnational Value Added Taxes on International Trade: The Compensating VAT (CVAT)”, International Tax and Public Finance, No. 7.
Mello, L. de (2008), “The Brazilian ‘Tax War’: The Case of Value-Added Tax Competition among the States”, Public Finance Review, Vol. 36.
Munch, J.R. (2002), “Do Local Tax and Public Services Affect Migration Patterns?” De Okonomiske Rad, www.dors.dk/graphics/Synkron-Library/Publikationer/Arbejdspapirer/arbpapir02.02.pdf
Oates, W.E. (1969), “The Effects of Property Taxes and Local Public Spending on Property Values: An Empirical Study of Tax Capitalization and the Tiebout Hypothesis,” Journal of Political Economy, Vol. 77.
OECD (2000), The Taxing Power of State and Local Governments, Paris.
OECD (2002), Territorial Reviews: Switzerland, Paris.
OECD (2007), Fundamental Reform of Corporate Income Tax, OECD Tax Policy Studies, Paris.
OECD (2009), Taxing Wages, Paris.
COM/CTPA/ECO/GOV/WP(2011)13
35
OECD (2010), “Canada: The Provincial Sales Tax Harmonisation”, in: Reforming Fiscal Relations and Local Government: Lessons From Ten Country Studies (forthcoming), Paris.
Persyn, D. (2009), “Interregional Redistribution, Growth and Convergence”, Vives Discussion Paper series, Catholic University of Leuven.
Price, R. (2010), “Achieving and Sustaining Fiscal Consolidation”, in OECD, Making Reform Happen, Paris.
Revelli, F. (2001), “Spatial Patterns in Local Taxation: Tax Mimicking or Error Mimicking?”, Applied Economics, Vol. 33.
Riedl, A. and S. Rocha-Akis (2008), “Testing the Tax Competition Theory: How Elastic Are National Tax Bases in Western Europe?”, Österreichische Nationalbank Working Paper, No. 142, Vienna.
Rork, J. (2003), “Coveting Thy Neighbors’ Taxation”, National Tax Journal, Vol. 56, No. 4.
Schaltegger, C.A. and D. Küttel (2002), “Exit, Voice, and Mimicking Behavior: Evidence from Swiss Cantons”, Public Choice, Vol.113.
Solé Ollé, A. (2003), “Electoral Accountability and Tax Mimicking: The Effects of Electoral Margins, Coalition Government, and Ideology”, European Journal of Political Economy, Vol 19.
Solé Ollé, A. and E. Viladecans Marsal (2003), “Fiscal and Growth Spillovers in Large Urban Areas,” Working Paper No. 2003/1, Institut d'Economia de Barcelona (IEB).
Wilson, J. and D. Wildasin (2004), “Capital Tax Competition: Bane or Boon”, Journal of Public Economics 88
Yinger, J. (1988), Property Taxes and House Values: The Theory and Estimation of Intrajurisdictional Property Tax Capitalization, Academic Press, Boston.

COM/CTPA/ECO/GOV/WP(2011)13
36
Annex
Table A1. Tax competition in OECD countries: a selection of empirical studies
Country SCG examined Tax examined Interaction effect Main observations
Australia States (Dahlby and Warren, 2003), Corporate income tax, consumption taxes, property taxes
Not tested States compete on property taxes. Equalisation grants reduce tax competition.
Belgium Municipalities (Heyndels and Vuchelen, 1998)
Property taxes 0.35 to 0.5 Interaction appears to be of the yardstick competition type. Close municipalities compete more than distant ones.
Brazil States (de Mello, 2007) Consumption tax (state VAT) 0.5 to 0.6 Interaction appears of the tax competition type. States use VAT rates explicitly as an economic development tool.
Canada Provinces (Esteller-Moré and Solé-Olé, 2002)
Personal income taxes 0.2 for PIT Relatively little PIT tax competition, probably due to large size of provinces.
Provinces (Boadway and Hayashi, 2001)
Corporate income tax 0.4 to 0.5 for CIT Larger provinces have higher tax rates.
Municipalities (Brett and Pinkse, 2000)
Property taxes 0.2 to 1 Interaction appears to be mainly of the yardstick competition type.
Provinces (Ferede and Dahlby, 2010)
Tax base elasticity for CIT, PIT and sales taxes
-2.3 (CIT), -0.8 (PIT) and -0.6 (sales tax)
Corporate income tax increases lead to decreases in the respective tax revenue.
Denmark Municipalities (Munch, 2002)
Personal income tax Not tested Lower tax rates lead to more in-migration, as does a lower municipal budget. Large municipalities have higher tax rates.
Finland Municipalities (Kangasharju et al., 2006)
Personal income tax 0.3 Tax rates rose over time. Municipalities receiving grants have higher tax rates. Demographic factors play no role for tax rates, but population density does.
France Départements, régions (Josselin and Rocaboy, 2002)
CIT (tax professionnel-le) ; property taxes
0.2 (short run) to 0.6 (long run) for CIT ; 0.08 to 0.2 for property taxes
Municipalities receiving more grants have higher tax rates. Tax rates rose and converged between 1984 and 1999.
Germany (selection)
Municipalities (Büttner, 2001) CIT (Gewerbesteuer) 0.06 if neighbors increase rates; -0.01 if nationwide increase
Tax competition works on a regional rather than national scale (commuting distances). .Large municipalities set higher tax rates.
Municipalities (Becker, Egger and Merlo, 2009)
CIT (Gewerbesteuer) and new firms
0.05 Factors such as size and availability of highly qualified workers play a larger role for investment and firm mobility than CIT rates.
Municipalities (Büttner, 2003)
CIT (Gewerbesteuer) < -1.0 Tax revenues react much stronger in small municipalities. Profit shifting could explain the observed high tax elasticity.
Italy Municipalities (Bordignon, Cerviglia and Revelli, 2003)
Property taxes 0.5 Interaction is of the yardstick competition type (mayors running for re-election).

COM/CTPA/ECO/GOV/WP(2011)13
37
Table A1. Tax competition in OECD countries: a selection of empirical studies (continued)
Netherlands Municipalities (Allers and Elhorst, 2005)
Property taxes 0.35 Interaction points to yardstick competition. Larger municipalities have lower tax rates. More grants are associated with higher tax rates.
Norway Municipalities (Carlson, Langset and Rattsø, 2005)
User fees 0.7 Municipalities with a higher share of immobile firms charge higher fees.
Spain (selection) Municipalities (Solé-Ollé, 2003)
Corporate income tax, property tax, vehicle tax
0.2 (CIT); 0.4 (property tax); 0.2 (vehicle tax)
Interaction tends to be of the yardstick competition type. Higher (non-equalising) grants are associated with lower tax rates. Higher household income is associated with lower tax rates.
Sweden Municipalities (Edmark and Agren, 2007)
Personal income tax 0.3 to 0.7 Interaction is of the tax competition rather than the yardstick competition type. More equalisation is associated with higher tax rates, as does population size (probably due to scale economies).
Switzerland (selection)
Cantons and municipalities (Feld and Reulier, 2008)
Personal income tax 0.5 to 1 Interaction is stronger for municipalities than for cantons and stronger for high-income SCGs. Large SCGs have higher tax rates than small ones.
Cantons and municipalities (Feld and Kirchgässner, 2001)
Personal income tax and residence
Not tested Interaction is of the tax competition rather than the yardstick competition type. The lower tax rates, the higher the propensity of high-income earners to settle there.
Cantons and municipalities (Schaltegger and Küttel, 2002).
Total cantonal and municipal revenues
Not tested SCGs engage in yardstick competition. The stronger fiscal autonomy, the lower yardstick competition.
United Kingdom England municipalities (Revelli, 2001)
Property taxes 0.4 to 0.5 Interaction could be both tax competition and yardstick competition. Higher (non-equalising) grants are associated with lower tax rates.
United States (selection)
Municipalities (Hendrik, Wu and Jacob, 2008)
Property taxes, sales taxes 0.3 to 0.8 for property taxes; no significant interaction for sales taxes
There appears little interaction on local sales taxes. Property tax interaction is of the yardstick competition type.
States (Rork, 2003) CIT, PIT, sales tax, cigarette tax, gas tax
0.2 (CIT), -0.1 (PIT), -0.2 (sales tax), 0.6 (cigarette and gas tax)
Consumption taxes prone to geographical mobility react strongly. Less mobile taxes react less or even with a decrease to increases elsewhere.
States (Braid, 1996) Personal income tax Agglomeration economies explain why urbanised states often have PIT while rural states do not.
Municipalities (Besley and Case, 1995)
Property tax 0.2 Interaction is of the yardstick competition type. Tax hikes reduce the probability of re-election.
Local governments (Kanbur and Keen, 1993)
Total tax burden 0.4 to 0.6 Interaction is stronger between municipalities of the same metro area than between municipalities of different metro areas.

COM/CTPA/ECO/GOV/WP(2011)13
38
Table A2. Taxing power of sub-central governments
Classification of SCG autonomous taxes, in per cent of total SCG tax revenue, 2005
Discretion on tax base and rates (type a)
Discretion on tax rates (type b)
Discretion on tax b ase
(type c)Total
Full Restricted
Australia 5.5 17.8States 4.6 14.8 53.2 - - - 53.2 noneLocal 0.9 2.9 100.0 - - - 100.0 none
Austria 0.6 1.4Länder 0.3 0.6 7.2 - - - 7.2 noneLocal 0.3 0.8 2.6 - 5.5 - 8.1 Property tax: maximum 500%, minimum 0% of standard rate
Belgium 6.8 15.3States 4.7 10.6 20.7 - 23.5 - 44.2 /- 6.75 percent of federal PITLocal 2.1 4.7 8.4 - 85.7 - 94.2
Canada114.9 43.2
Provinces 12.1 34.9 98.4 - - - 98.4Local 2.8 8.3 1.8 95.6 - - 97.4 none
Czech Republic 0.4 1.1Local 0.4 1.1 4.4 - 3.0 - 7.3 property tax rates between 30% and 500% of natinoal average
Denmark 15.5 32.3Local 15.5 32.3 - 85.8 4.8 - 90.6 Property tax: maximum 2.4%, minimum 0.6%
Finland 8.4 19.0Local 8.4 19.0 - 86.7 5.1 - 91.7 General property tax: maximum 1%, minimum 0.5% annually
France 4.3 9.9Local 4.3 9.9 67.5 - 8.3 10.2 85.9 Local business tax may not exceed 3.5% of value added
Germany 1.8 5.2Länder 0.2 0.6 - 2.9 - - 2.9Local 1.6 4.6 - 16.9 42.8 - 59.7 n.a.
Greece 0.1 0.5Local 0.1 0.5 - - 53.9 - 53.9 Property tax: maximum 0.35%, minimum 0.07%
Hungary 2.0 5.4Local 2.0 5.4 - - 87.0 - 87.0 n.a.
Iceland18.4 23.7
Local 8.4 23.7 - - 95.9 - 95.9 n.a.
Ireland 0.0 0.0Local 0.0 0.0 - - - - 0.0
Italy 4.3 8.2Regions 2.7 6.6 - - 58.7 - 58.7 PIT: maximum 1.4%, minimum 0.9%. Regional business tax: max 5.25%, min 3.25%Local 1.6 1.6 20.4 - 53.3 - 73.7 Property tax: maximum: 0.007%, minimum: 0.004%
Japan 5.8 21.2Local 5.8 21.2 0.2 50.8 33.2 - 84.2 PIT: all SCG set same rate. CIT: small variations (+/- 5% from average) possible
Korea 3.5 14.3Local 3.5 14.3 - - 75.7 - 75.7 Property tasx can be set +/-50% of standard rate set by Parliament
Luxembourg 1.7 4.4Local 1.7 4.4 98.5 - 0.2 - 98.7
Mexico 0.5 2.4States 0.4 2.1 13.8 - - - 13.8 noneLocal 0.0 0.2 22.8 - - - 22.8 none
Netherlands 1.5 3.9 0.0Local 1.5 3.9 - 73.6 26.4 - 100.0 n.a.
New Zealand n.a. n.a.Local n.a. n.a.
Norway 5.7 13.1Local 5.7 13.1 - 98.0 - - 98.0
Poland11.5 4.0
Local 1.5 4.0 - - 22.3 - 22.3 Property tax: maximum: 20 PLZ/sqm, minimum: 0.02 PLZ/sqm
Portugal 1.0 2.9Local 1.0 2.9 - - 47.6 - 47.6 Property tax: maximum: 0.5%, minimum: 0.2% (new buildings)
Slovak Republic n.a. n.a.Local n.a. n.a.
Spain 7.0 19.4Regions 4.7 13.1 60.1 - - - 60.1Local 2.3 6.3 22.6 - 49.5 - 72.2 Property tax: max: 1.3%, min: 0.4%. Vehicle tax also has max/min provisions
Sweden 15.9 32.2Local 15.9 32.2 - 100.0 - - 100.0 none
Switzerland 11.9 40.8States 7.3 25.1 100.0 - - - 100.0Local 4.6 15.6 3.0 - 97.0 - 100.0 Most states set lower/upper limits on local income tax rates
Turkey 0.0 0.0Local 0.0 0.0 - - - - 0.0
United Kingdom 1.7 4.8Local 1.7 4.8 - - 100.0 - 100.0 n.a.
United States 5.5 20.2States 5.5 20.2 100.0 - - - 100.0 Some states set upper limits on local property tax rates
Local2 0.0 0.0 - - - - 0.0
Unweighted average 0.0 0.0
States33.8 11.4 45.3 0.3 8.2 - 53.8
Local 3.0 7.9 13.9 21.7 30.3 0.4 66.2
Autonomous taxes as share of total SCG tax revenues
Autonomous taxes as share
of GDP
Autonomous taxes as share
of total tax revenue
Limitations on tax rate setting
1. 2002 figures. 2. Local governments in the United States show a wide variety of taxing powers, but it is not possible to identify the share of each. Source:Fiscal decentralisation database, questionnaire responses (2009).
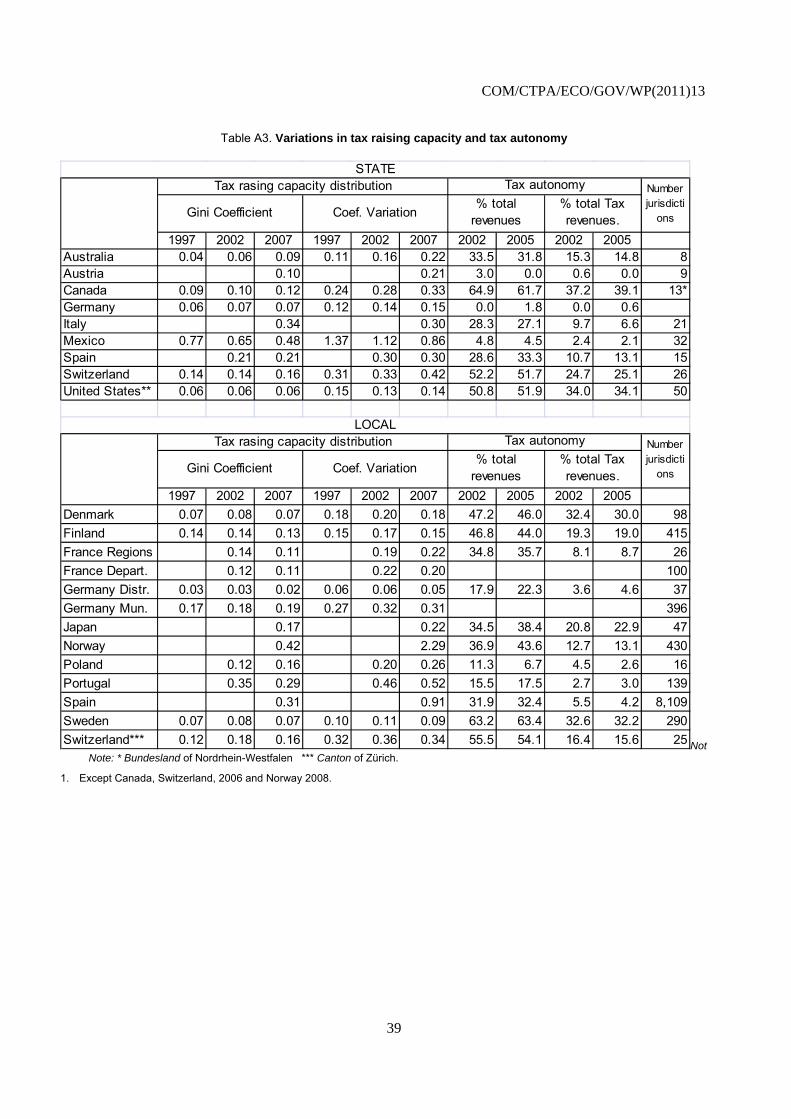
COM/CTPA/ECO/GOV/WP(2011)13
39
Table A3. Variations in tax raising capacity and tax autonomy
1997 2002 2007 1997 2002 2007 2002 2005 2002 2005Australia 0.04 0.06 0.09 0.11 0.16 0.22 33.5 31.8 15.3 14.8 8Austria 0.10 0.21 3.0 0.0 0.6 0.0 9Canada 0.09 0.10 0.12 0.24 0.28 0.33 64.9 61.7 37.2 39.1 13*Germany 0.06 0.07 0.07 0.12 0.14 0.15 0.0 1.8 0.0 0.6Italy 0.34 0.30 28.3 27.1 9.7 6.6 21Mexico 0.77 0.65 0.48 1.37 1.12 0.86 4.8 4.5 2.4 2.1 32Spain 0.21 0.21 0.30 0.30 28.6 33.3 10.7 13.1 15Switzerland 0.14 0.14 0.16 0.31 0.33 0.42 52.2 51.7 24.7 25.1 26United States** 0.06 0.06 0.06 0.15 0.13 0.14 50.8 51.9 34.0 34.1 50
1997 2002 2007 1997 2002 2007 2002 2005 2002 2005
Denmark 0.07 0.08 0.07 0.18 0.20 0.18 47.2 46.0 32.4 30.0 98
Finland 0.14 0.14 0.13 0.15 0.17 0.15 46.8 44.0 19.3 19.0 415
France Regions 0.14 0.11 0.19 0.22 34.8 35.7 8.1 8.7 26
France Depart. 0.12 0.11 0.22 0.20 100
Germany Distr. 0.03 0.03 0.02 0.06 0.06 0.05 17.9 22.3 3.6 4.6 37
Germany Mun. 0.17 0.18 0.19 0.27 0.32 0.31 396
Japan 0.17 0.22 34.5 38.4 20.8 22.9 47
Norway 0.42 2.29 36.9 43.6 12.7 13.1 430
Poland 0.12 0.16 0.20 0.26 11.3 6.7 4.5 2.6 16
Portugal 0.35 0.29 0.46 0.52 15.5 17.5 2.7 3.0 139
Spain 0.31 0.91 31.9 32.4 5.5 4.2 8,109
Sweden 0.07 0.08 0.07 0.10 0.11 0.09 63.2 63.4 32.6 32.2 290
Switzerland*** 0.12 0.18 0.16 0.32 0.36 0.34 55.5 54.1 16.4 15.6 25
Tax autonomy
% total revenues
% total Tax revenues.
STATE
Gini Coefficient Coef. Variation
Number jurisdicti
ons
Number jurisdicti
ons
Tax autonomy
% total revenues
% total Tax revenues.
LOCAL
Gini Coefficient Coef. Variation
Tax rasing capacity distribution
Tax rasing capacity distribution
NotNote: * Bundesland of Nordrhein-Westfalen *** Canton of Zürich.
1. Except Canada, Switzerland, 2006 and Norway 2008.

COM/CTPA/ECO/GOV/WP(2011)13
40
Table A4. Spearman rank correlations of tax capacity rankings
State level
Spearman rank correlation for ordered tax capacity in different periods
1997/2002 2002/2007 1997/2007
Australia 0.93 0.95 0.93
Austria
Canada 0.98 0.83 0.76
Germany 0.94 0.99 0.99
Mexico 0.78 0.62 0.51
Spain 0.96
Switzerland 0.89 0.92 0.81
United States 0.92 0.91 0.87
Local level
Spearman rank correlation for ordered tax capacity in different periods
1997/2002 2002/2007 1997/2007
Denmark 0.97 0.98 0.95
Finland 0.86 0.96 0.89
France Regions 0.98
France Depart. 0.97
Germany Distr. 0.90 0.90 0.87
Germany Mun. 0.84 0.78 0.74
Poland 0.97
Portugal 0.82
Sweden 0.97 0.96 0.91
Switzerland* 0.87 0.97 0.83
Note: US periods: 1994/1999, 1999/2007, 1994/2007.
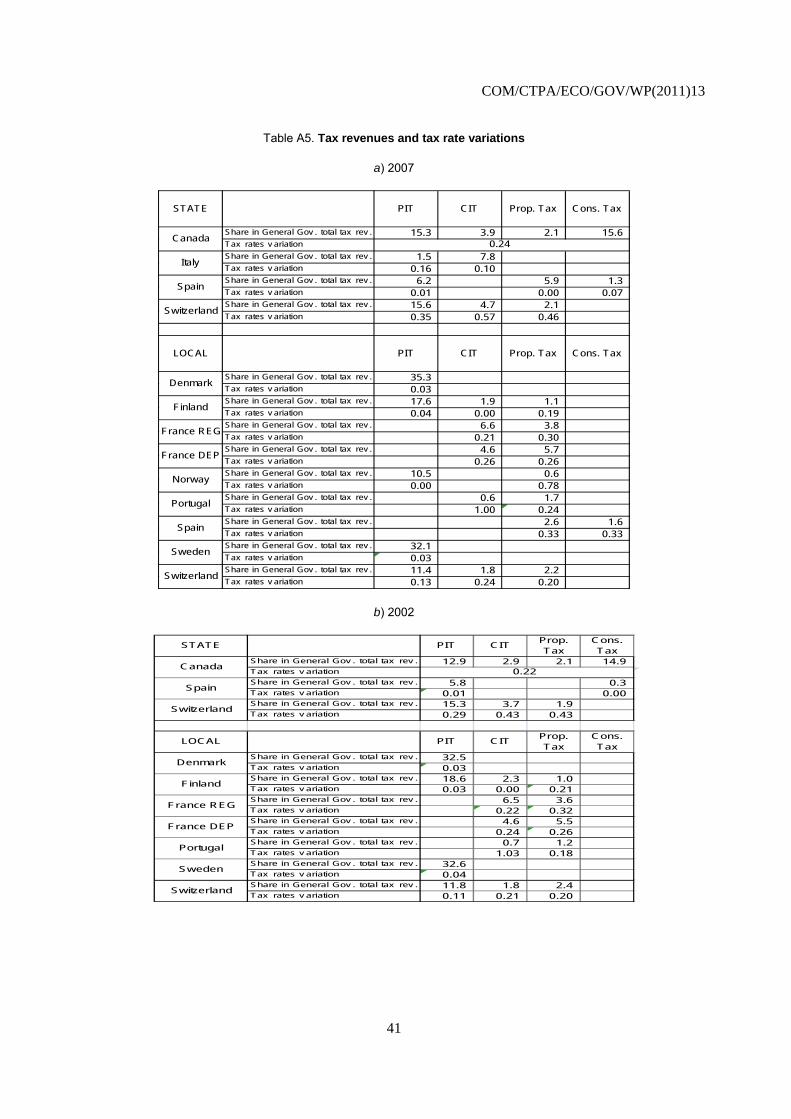
COM/CTPA/ECO/GOV/WP(2011)13
41
Table A5. Tax revenues and tax rate variations
a) 2007
STATE PIT CIT Prop. Tax Cons. Tax
Share in General Gov . total tax rev . 15.3 3.9 2.1 15.6Tax rates v ariation
Share in General Gov . total tax rev . 1.5 7.8Tax rates v ariation 0.16 0.10Share in General Gov . total tax rev . 6.2 5.9 1.3Tax rates v ariation 0.01 0.00 0.07Share in General Gov . total tax rev . 15.6 4.7 2.1Tax rates v ariation 0.35 0.57 0.46
LOCAL PIT CIT Prop. Tax Cons. Tax
Share in General Gov . total tax rev . 35.3Tax rates v ariation 0.03Share in General Gov . total tax rev . 17.6 1.9 1.1Tax rates v ariation 0.04 0.00 0.19Share in General Gov . total tax rev . 6.6 3.8Tax rates v ariation 0.21 0.30Share in General Gov . total tax rev . 4.6 5.7Tax rates v ariation 0.26 0.26Share in General Gov . total tax rev . 10.5 0.6Tax rates v ariation 0.00 0.78Share in General Gov . total tax rev . 0.6 1.7Tax rates v ariation 1.00 0.24Share in General Gov . total tax rev . 2.6 1.6Tax rates v ariation 0.33 0.33Share in General Gov . total tax rev . 32.1Tax rates v ariation 0.03Share in General Gov . total tax rev . 11.4 1.8 2.2Tax rates v ariation 0.13 0.24 0.20
Spain
Sweden
Switzerland
Norway
Portugal
France REG
France DEP
Denmark
Finland
Spain
Switzerland
Canada0.24
Italy
b) 2002
STATE PIT CITProp. Tax
Cons. Tax
Share in General Gov . total tax rev . 12.9 2.9 2.1 14.9Tax rates v ariation
Share in General Gov . total tax rev . 5.8 0.3Tax rates v ariation 0.01 0.00Share in General Gov . total tax rev . 15.3 3.7 1.9Tax rates v ariation 0.29 0.43 0.43
LOCAL PIT CITProp. Tax
Cons. Tax
Share in General Gov . total tax rev . 32.5Tax rates v ariation 0.03Share in General Gov . total tax rev . 18.6 2.3 1.0Tax rates v ariation 0.03 0.00 0.21Share in General Gov . total tax rev . 6.5 3.6Tax rates v ariation 0.22 0.32Share in General Gov . total tax rev . 4.6 5.5Tax rates v ariation 0.24 0.26Share in General Gov . total tax rev . 0.7 1.2Tax rates v ariation 1.03 0.18Share in General Gov . total tax rev . 32.6Tax rates v ariation 0.04Share in General Gov . total tax rev . 11.8 1.8 2.4Tax rates v ariation 0.11 0.21 0.20
Switzerland
0.22
Finland
France REG
France DEP
Portugal
Sweden
Canada
Spain
Switzerland
Denmark

COM/CTPA/ECO/GOV/WP(2011)13
42
c) 1997
STATE PIT CITProp. Tax
Cons. Tax
Share in General Gov . total tax rev . 8.8 2.2 1.4 8.3Tax rates v ariation
Share in General Gov . total tax rev . 14.6 3.2 1.7 0.0Tax rates v ariation 0.28 0.65 0.44
LOCAL PIT CITProp. Tax
Cons. Tax
Share in General Gov . total tax rev . 31.6Tax rates v ariation 0.03Share in General Gov . total tax rev . 17.5 3.7 0.9Tax rates v ariation 0.04 0.00 0.30Share in General Gov . total tax rev . 0.6 1.1Tax rates v ariation 1.16 0.00Share in General Gov . total tax rev . 30.2Tax rates v ariation 0.04
0.16
Sweden
Portugal
Finland
Denmark\
Switzerland
Canada3
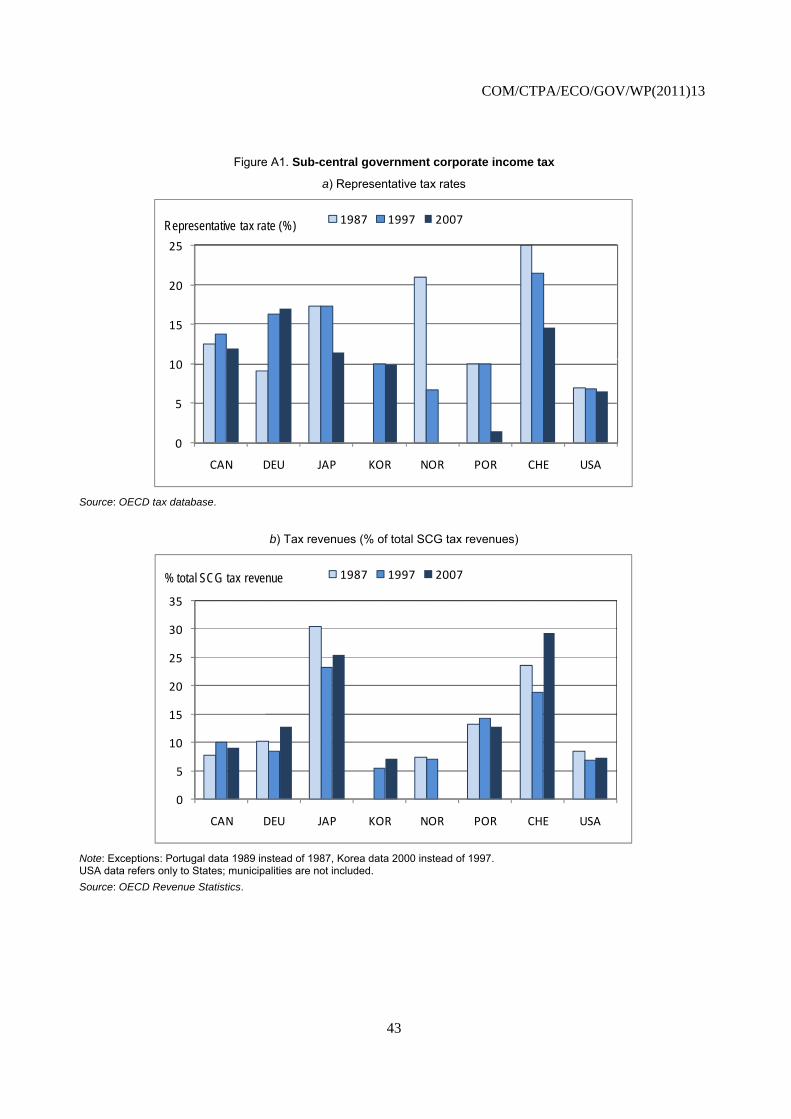
COM/CTPA/ECO/GOV/WP(2011)13
43
Figure A1. Sub-central government corporate income tax
a) Representative tax rates
0
5
10
15
20
25
CAN DEU JAP KOR NOR POR CHE USA
1987 1997 2007Representative tax rate (%)
Source: OECD tax database.
b) Tax revenues (% of total SCG tax revenues)
0
5
10
15
20
25
30
35
CAN DEU JAP KOR NOR POR CHE USA
1987 1997 2007% total SCG tax revenue
Note: Exceptions: Portugal data 1989 instead of 1987, Korea data 2000 instead of 1997. USA data refers only to States; municipalities are not included.
Source: OECD Revenue Statistics.
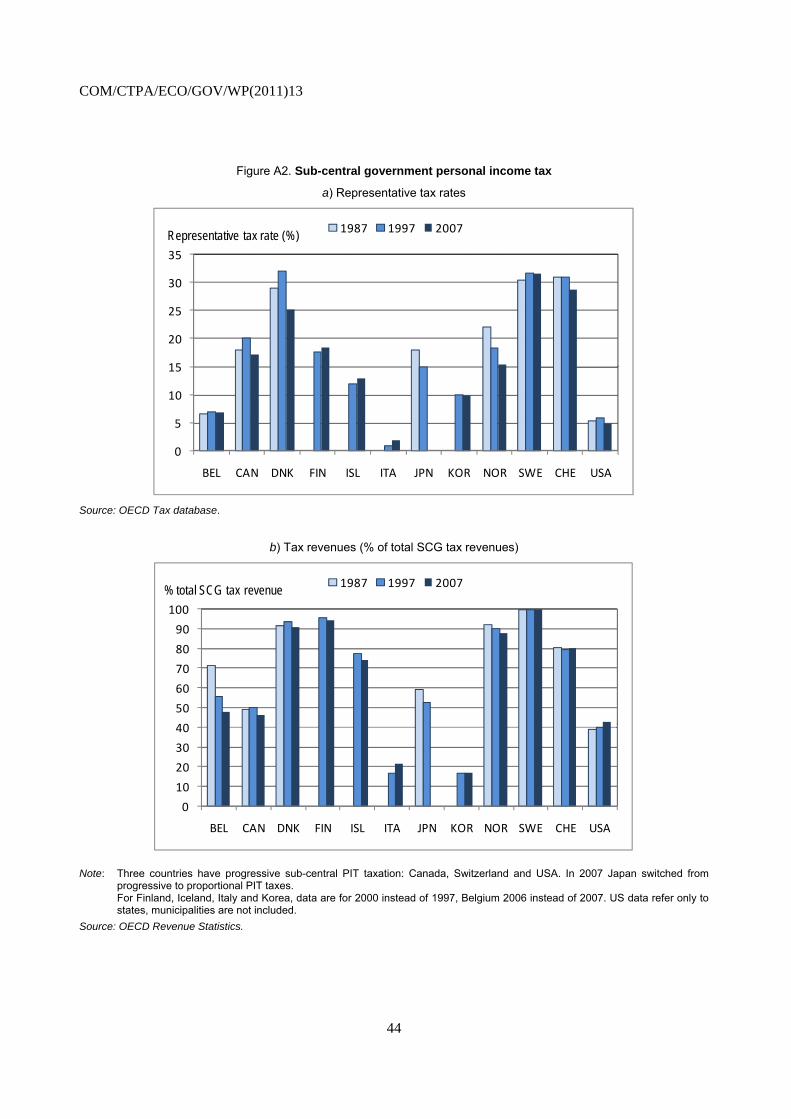
COM/CTPA/ECO/GOV/WP(2011)13
44
Figure A2. Sub-central government personal income tax
a) Representative tax rates
0
5
10
15
20
25
30
35
BEL CAN DNK FIN ISL ITA JPN KOR NOR SWE CHE USA
1987 1997 2007Representative tax rate (%)
Source: OECD Tax database.
b) Tax revenues (% of total SCG tax revenues)
0
10
20
30
40
50
60
70
80
90
100
BEL CAN DNK FIN ISL ITA JPN KOR NOR SWE CHE USA
1987 1997 2007% total SCG tax revenue
Note: Three countries have progressive sub-central PIT taxation: Canada, Switzerland and USA. In 2007 Japan switched from progressive to proportional PIT taxes.
For Finland, Iceland, Italy and Korea, data are for 2000 instead of 1997, Belgium 2006 instead of 2007. US data refer only to states, municipalities are not included.
Source: OECD Revenue Statistics.

COM/CTPA/ECO/GOV/WP(2011)13
45
Figure A3. Sub-central government recurrent taxes on immovable property
a) Sub-central recurrent taxes on immovable property in per cent of GDP, 2007
0.0
0.2
0.4
0.6
0.8
1.0
1.2
1.4
1.6
1.8
2.0
2.2
2.4
2.6
2.8
3.0
USA CAN FRA JAP NZL GBR ISL DNK ITA ESP KOR IRL FIN DEU SVK HUN NOR AUT CHE TUR CZE POR LUX SWE NLD
Local level State level% GDP
b) Property tax revenue in per cent of SCG total tax revenue, 1995-2005
0%
5%
10%
15%
20%
25%
30%
35%
40%
45%
1995 1996 1997 1998 1999 2000 2001 2002 2003 2004 2005
1000 Taxes on income, profits and capital gains
4000 Taxes on property
5000 Taxes on goods and services
Source: OECD Revenue Statistics.