tata steel analysis
DESCRIPTION
Secondary AnalysisTRANSCRIPT

1COMPANY ANALYSIS: TATA STEELBOAC, WG P2, SEC 3
COMPANY ANALYSIS FOR PAST 5 FINANCIAL YEARS
TATA STEEL
BOAC ASSIGNMENT
WORKING GROUP P2,
SECTION 3, PGP 1
Date: 18th September 2014
1

2COMPANY ANALYSIS: TATA STEELBOAC, WG P2, SEC 3
Introduction:
India is the 5th largest steel producing nation in the world with production of over 53
million tonne (MT). Steel production has grown at a compounded rate of 9% during the
period FY03 to FY08. The Indian steel sector has key advantages of domestic availability of
raw material and cheap labour. Steel is the most common material and is used in
infrastructure, housing, automobiles & consumer durables. The major products are semi-
finished product, ordinary steel products likes tube, pipes et cetera, hot rolled coils (HRC),
cold rolled coils (CRC) & specialty steel products like stainless steel pipes & foils etc.
Company Background:
Tata Steel Limited (formerly Tata Iron and Steel Company Limited (TISCO)) is an Indian
multinational steel-making company headquartered in Mumbai, Maharashtra, India, and a
subsidiary of the Tata Group. Tata Iron and Steel Company was established by Dorabji Tata
on August 25, 1907. On February 12, 2012 Tata Steel completed 100 years of steel making in
India. Tata Steel is in operations in 26 countries and its commercial presence is in over 50
countries. It has 80,000 employees across five continents. Tata Steel primarily serves
customers in the automotive, construction, consumer goods, engineering, packaging, lifting
and excavating, energy and power, aerospace, shipbuilding, rail and defence and security
sectors
Products:
Flat Products Long Products Construction
Flat Products: Hot Rolled, Cold Rolled, Metallic Coated, Direct Rolled Tubes Pre-finished
Steels Packaging, Steels Electro Plated, Steels Electrical Steels, Narrow Strip.
Long Products: Sections Special Profiles, Rail. Wires,Wire Rods, Speciality Steels and Bar
Plates
Construction Products: Structural Steel Floors, Walls, Roofs, Building Components
2

3COMPANY ANALYSIS: TATA STEELBOAC, WG P2, SEC 3
India Operations:
Tata Steel Jamshedpur Works: Produces Hot Roll Steel Sheet and Coils
Agrico, Jamshedpur : Manufactures agricultural implements
Tata Bearings Kharagpur Plant : It is one of India’s largest quality bearings
manufacturing units, with a capacity of over 37 million bearings per annum.
Tata Growth Shop Gamharia: Tata Steel Growth Shop (TGS), a division of Tata
Steel Ltd. is one of the largest designers and manufacturers of plants and equipment in
India.
Europe Operations:
UK (& Ireland) - There are 3 steelmaking facilities (Port Talbot, Rotherham and
Scunthorpe) with a combined crude steel production capacity of 11 MTPA. In all,
there are 17 manufacturing locations and 22 distribution centres.
The Netherlands - There is one steelmaking facility (Ijmuiden) and 5 manufacturing
locations with 2 distribution centres.
Rest of Europe, there are 17 manufacturing locations and nine 9 distribution centres.
South East Asian Operations:
NatSteel Singapore: It has a steelmaking and rolling operations of capacity 7,50,000
tonnes per annum
Tata Steel Thailand (TSTH): It is the largest producer of long steel products in
Thailand, with a manufacturing capacity of 1.7mtpa
The Siam IFuzhou Plant - NatSteel Xiamen, known for produces high end
reinforcement bars with seismic properties
The Siam Industrial Wire Co. Ltd. (SIW), Thailand : A part of Tata Steel Global
Wires Business and one of the world's leading manufacturers of steel wire.
3

4COMPANY ANALYSIS: TATA STEELBOAC, WG P2, SEC 3
Market Share:
It is the 11th largest steel producing company in the world in 2013, with an annual crude steel
capacity of 25.3 million tonnes, and the second largest private-sector steel company in India
(measured by domestic production) with an annual capacity of 9.7 million tonnes.
(Top 5 Companies: Capacity Share)
Major Competitors:
SAIL : Steel Authority of India Ltd
Jindal Steel and Power
Jindal South West
Bhushan Steel
ISPAT
4

5COMPANY ANALYSIS: TATA STEELBOAC, WG P2, SEC 3
New Developments :
Tata Steel has set a target of achieving an annual production capacity of 100 million tons by
2015; it is planning for capacity expansion to be balanced roughly 50:50 between Greenfield
developments and acquisitions.
Major Greenfield steel plant expansion projects planned by Tata Steel include
A 6 million tonne per annum capacity plant in Kalinganagar, Odisha, India
An expansion of the capacity of its plant in Jharkhand, India from 6.8 to 10 million
tonnes per annum;
A 5 million tonne per annum capacity plant in Chhattisgarh, India.
A 3 million tonne per annum capacity plant in Iran.
A 2.4 million tonne per annum capacity plant in Bangladesh.
A 10.5 million tonne per annum capacity plant in Vietnam.
A 6 million tonne per annum capacity plant in Haveri, Karnataka.
Revenues Generated:
The Tata Steel Group, with a turnover of Rs. 1, 48,614 Crores in FY 14.
30%
13%
52%
5%
Geographical Distribution of Revenue
IndiaSouth AsiaEurope Rest Of World
5

6COMPANY ANALYSIS: TATA STEELBOAC, WG P2, SEC 3
Production & Sales:
India: Crude Steel production reached 9.15 million tonnes in Financial Year 2013-14,
registering a 13% increase over the previous year.
In Financial Year 2013-14 EBITDA improved to Rs. 13,281 crores, up 14% from Rs.11,698
crores in Financial Year 2012-13.
Europe: Tata Steel produced 15.5 million tonnes of liquid steel in European Financial Year
2013-14, which was 2.2 million tonnes higher than the previous year.
Capital Employed by Geographies
6
45%
8%
38%
9%
Capital Used
IndiaSouth AsiaEuropeRest of World

7COMPANY ANALYSIS: TATA STEELBOAC, WG P2, SEC 3
Company Management:
Board Of DirectorsSl No
Name Of the Director Date Of Appointment
QualificationsDirectorship held in
other public companies
01 Mr. Cyrus P Mistry 21.05.2012 Graduate in Civil Engineering from Imperial College, UK ,M.Sc in Management from London Business School
Tata Sons Limited Tata Industries Limited The Tata Power Company Limited Tata Teleservices
Limited Tata Global Beverages Limited Tata Consultancy Services Limited Tata Motors Limited Tata Chemicals Limited The Indian Hotels
Company Limited
02 Mr. Ishaat Hussain 15.07.1999 Graduate in Economics from Delhi University and a member of ICAEW
Tata Sons Limited Titan Company Limited Voltas Limited Tata Teleservices
Limited Tata Industries Limited Tata AIG General
Insurance Co. Limited Tata AIA Life Insurance
Company Limited Tata Consultancy
Services Limited Tata Sky Limited The Bombay Dyeing & Manufacturing
Company Limited Tata Capital Limited Tata Capital Financial
Services Limited Viom Networks Limited
7

8COMPANY ANALYSIS: TATA STEELBOAC, WG P2, SEC 3
03 Mr. T V Narendran 19.09.2013 Mechanical Engineer fromREC (NIT), Trichy and MBA from IIM Calcutta
NIL
04 Mr. Nusli N Wadia 29.08.1979 Educated in UK The Bombay Dyeing and Manufacturing Company
Limited Wadia Techno-
Engineering Services Limited The Bombay Burmah
Trading Corporation Limited Britannia Industries
Limited Tata Chemicals Limited Tata Motors Limted Go Airlines (India)
Limited
05 Mr. Subodh Bhargava 29.05.2006 Mechanical Engineer fromUniversity of Roorke
Tata Communications Limited
TRF Limited GlaxoSmithKline
Consumer Healthcare Limited
Batliboi Limited Larsen & Toubro
Limited Tata Motors Limited
06 Mr. Jacobus Schraven 17.05.2007 Masters Degree in Law
NIL
07 Mr. B. Muthuraman 08.08.2000 BTech from IIT MadrasMBA , XLRI Jamshedpur
NIL
08 Mrs. Mallika Srinivasan 21.05.2012 Master of Business Management from Wharton Schoolof Business,
Tractors and Farm Equipment Limited
TAFE Access Limited TAFE Reach Limited TAFE Motors and
Tractors Limited
8

9COMPANY ANALYSIS: TATA STEELBOAC, WG P2, SEC 3
University of Pennsylvania, USAMaster of Arts in Econometrics from the University of Madras, Chennai
The United Nilgiri Tea Estates Company Limited
Tata Global Beverages Limited
09 Mr. O P Bhatt 10.06.2013 Graduate in Science and a post graduate inEnglish Literature (Gold Medalist)
Hindustan Unilever Limited
Tata Consultancy Services Limited
Oil and Natural Gas Corporation Limited
10 Mr. Andrew M. Robb 22.11.2007 N.A N.A11 Dr. Karl Ulrich Koehler 01.10.2010 Doctorate in
metallurgy at Clausthal University of Technology
N.A
12 Mr. D. K. Mehrotra 22.10.2012 Honours Graduate in Science from the University of Patna
NIL
13 Mr. Koushik Chatterjee 19.09.2013 Honours Graduate in Commerce from Calcutta University and a Fellow Member of the Institute of Chartered Accountants of India
NIL
There is no addition to the Board of Directors for the Year 2013-14.
Nine Board Meetings were held during the Financial Year 2013-14 and the gap between two
meetings did not exceed four months.
The Company pays sitting fees of Rs. 20,000 per meeting to the NEDs (Non Executive
Directors) for attending the meetings of the Board, Executive Committee of the Board,
9

10COMPANY ANALYSIS: TATA STEELBOAC, WG P2, SEC 3
Remuneration Committee, Audit Committee, Safety, Health and Environment Committee,
Nomination Committee, Committee of Investment & Projects and Committees constituted by
the Board from time to time.
For other meetings, viz. Investors’ Grievance Committee and Ethics and Compliance
Committee, the Company pays to the NEDs sitting fees of Rs. 5,000 per meeting.
Details of remuneration for 2013-14
Sr. No. NameCommission(in Lakhs)
Sitting Fees(in Lakhs)
1 Mr. Cyrus P. Mistry -- 4.80
2 Mr. B.Muthuraman 200 2.80
3 Mr. Nusli N. Wadia 110 3.60
4 Mr. S. M. Palia 15 1.0
5 Mr. Ishaat Hussain 110 5.30
6 Mr. Subodh Bhargava 105 3.30
7 Mr Jacobus Schraven 45 2.00
8 Mr. Andrew Robb 55 3.45
9 Mrs. Mallika Srinivasan 60 1.20
10 Mr. D.K. Mehrotra 75 1.80
11 Mr. O P Bhatt 75 2.20
12 Dr. Karl-Ulrich Koehler -- 3.00
Payable in Financial Year 2014-15
Share Capital:
Issued Share Capital : 2009-10: 88,81,26,020 shares of Rs. 10/- each
2010-11: 96,01,26,020 shares of Rs. 10/- each
2011-12: 97,21,26,020 shares of Rs. 10/- each
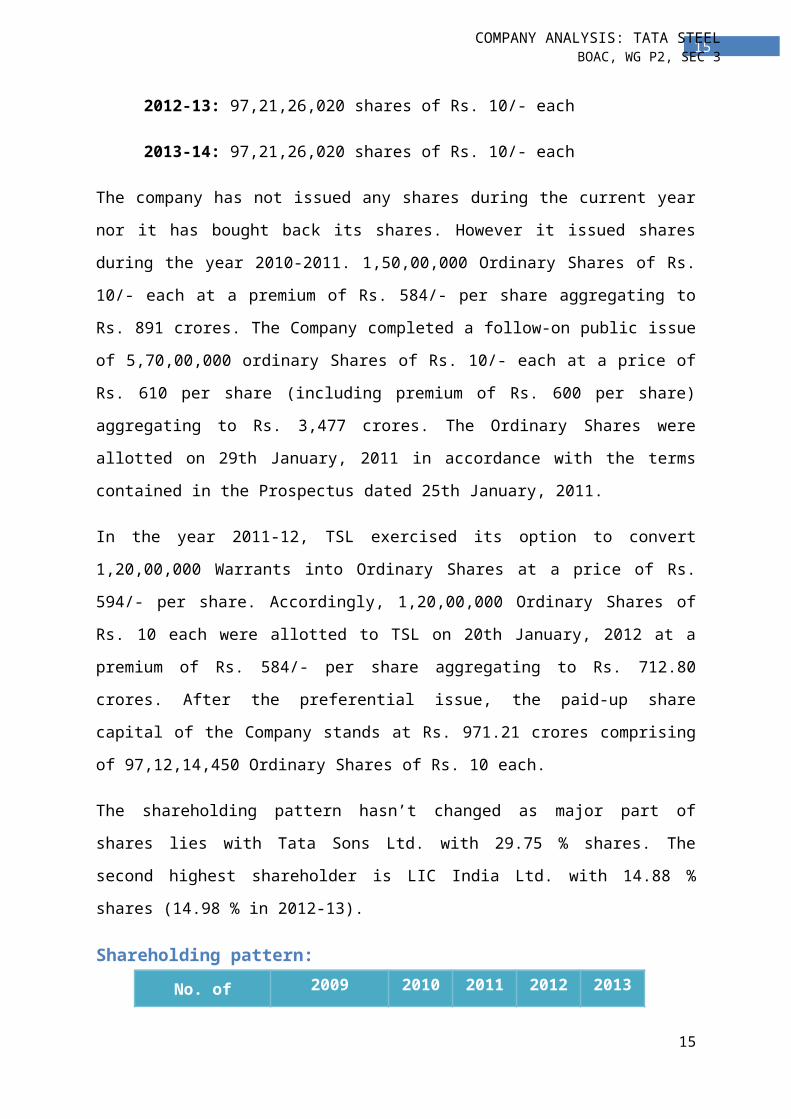
2012-13: 97,21,26,020 shares of Rs. 10/- each
2013-14: 97,21,26,020 shares of Rs. 10/- each
10

11COMPANY ANALYSIS: TATA STEELBOAC, WG P2, SEC 3
The company has not issued any shares during the current year nor it has bought back its
shares. However it issued shares during the year 2010-2011. 1,50,00,000 Ordinary Shares of
Rs. 10/- each at a premium of Rs. 584/- per share aggregating to Rs. 891 crores. The
Company completed a follow-on public issue of 5,70,00,000 ordinary Shares of Rs. 10/- each
at a price of Rs. 610 per share (including premium of Rs. 600 per share) aggregating to Rs.
3,477 crores. The Ordinary Shares were allotted on 29th January, 2011 in accordance with
the terms contained in the Prospectus dated 25th January, 2011.
In the year 2011-12, TSL exercised its option to convert 1,20,00,000 Warrants into Ordinary
Shares at a price of Rs. 594/- per share. Accordingly, 1,20,00,000 Ordinary Shares of Rs. 10
each were allotted to TSL on 20th January, 2012 at a premium of Rs. 584/- per share
aggregating to Rs. 712.80 crores. After the preferential issue, the paid-up share capital of the
Company stands at Rs. 971.21 crores comprising of 97,12,14,450 Ordinary Shares of Rs. 10
each.
The shareholding pattern hasn’t changed as major part of shares lies with Tata Sons Ltd. with
29.75 % shares. The second highest shareholder is LIC India Ltd. with 14.88 % shares (14.98
% in 2012-13).
Shareholding pattern:
No. of shares 2009 2010 2011 2012 2013
1 to 100 62.25 64.95 66.03 65.26 64.58
101 to 500 29.4 27.97 27.1 27.6 27.96
501 to 1000 4.37 3.71 3.63 3.81 3.97
1001 to 10000 3.72 3.14 3.04 3.13 3.27
10001 and above 0.26 0.23 0.2 0.2 0.22
The shares of Tata Steel has been listed in National and International stock exchanges. It has
been listed on following stock exchanges:
1. Bombay Stock Exchange Limited
2. National Stock Exchange of India Ltd.
3. Luxembourg Stock Exchange
4. London Stock Exchange
5. Singapore Exchange
11

12COMPANY ANALYSIS: TATA STEELBOAC, WG P2, SEC 3
Following table shows the data regarding the highest and lowest price at which shares of Tata
Steel were traded during last five years -
Book value is obtained by dividing Net worth by total number of shares. The book value of
shares of Tata Steel is Rs.629.01. The current market price is Rs. 498.75 whereas the face
value is Rs. 10.
For the year 2013-14, the Annual General meeting (AGM) was held on Wednesday, 14th of
August 2013.Following was the agenda of the AGM:
1. To receive, consider and adopt the Audited Statement of Profit and Loss for the year ended
31st March, 2014 and the Balance Sheet as at that date together with the Reports of the Board
of Directors and the Auditors thereon.
2. To declare dividend on the Ordinary Shares of the Company.
3. To appoint a director in the place of Mr. Cyrus P. Mistry (DIN: 00010178), who retires by
rotation and is eligible for re-appointment.
4. To appoint a director in the place of Mr. Ishaat Hussain (DIN: 00027891), who retires by
rotation and is eligible for re-appointment.
5. Appointment of Auditors To consider and if thought fit, to pass with or without
modification, the following Resolution as an Ordinary Resolution:
“RESOLVED THAT pursuant to the provisions of Section 139 and other applicable
provisions, if any, of the Companies Act, 2013 and Rules framed thereunder, as amended
from time to time, Deloitte Haskins & Sells LLP, Chartered Accountants (Firm's Registration
No. 117366W/W -100018), be and is hereby re-appointed as Auditors of the Company to
12
Year BSE NSE
Highest Lowest Highest Lowest
2009 653.65 209.85 653.7 209.8
2010 703.4 452.4 704.05 451.4
2011 637.55 335.25 638.38 335.35
2012 482 300.85 482.25 300.7
2013 425.05 198.6 425.9 198.25

13COMPANY ANALYSIS: TATA STEELBOAC, WG P2, SEC 3
hold office from the conclusion of this Annual General Meeting (AGM) till the conclusion of
the hundred and tenth AGM of the Company to be held in the year 2017 (subject to
ratification of their appointment at every AGM), at such remuneration plus service tax, out-
of-pocket, travelling and living expenses, etc., as may be mutually agreed between the Board
of Directors of the Company and the Auditors.”
6. To appoint a director in the place of Mr. T. V. Narendran (DIN: 03083605), who was
appointed as an additional director of the Company by the Board of Directors with effect
from 19th September, 2013 under Section 161(1) of the Companies Act, 2013 (“Act”), and
who holds office upto the date of the forthcoming Annual General Meeting but who is
eligible for appointment and in respect of whom the Company has received a notice in
writing from a member proposing his candidature for the office of Director under the
provisions of Section 160 of the Act.
7. Appointment of Mr. T. V. Narendran as the Managing Director, India & South East
Asia
To consider and if thought fit, to pass with or without modification, the following Resolution
as an Ordinary Resolution: “RESOLVED THAT pursuant to Sections 196, 197 and any
other applicable provisions of the Companies Act, 2013 (“Act”) and the Rules made
thereunder, as amended from time to time, read with Schedule V to the Act, the Company
hereby approves the appointment and terms of remuneration of Mr. T. V. Narendran (DIN:
03083605), Managing Director of the Company for the period from 19th September, 2013 to
18th September, 2018, not liable to retire by rotation, upon the terms and conditions set out in
the Explanatory Statement annexed to the Notice convening this meeting, including the
remuneration to be paid in the event of loss or inadequacy of profits in any financial year,
with liberty to the Directors to alter and vary the terms and conditions of the said appointment
in such manner so as to not exceed the limits specified in Schedule V to the Act, as may be
agreed to between the Directors and Mr. T. V. Narendran.
RESOLVED FURTHER THAT the Board be and is hereby authorised to take all such steps
as may be necessary, proper and expedient to give effect to this Resolution.”
8. Appointment of Mr. Nusli N. Wadia as an Independent Director
To consider and, if thought fit, to pass with or without modification, the following Resolution
as an Ordinary Resolution: “RESOLVED THAT pursuant to the provisions of Sections 149,
13

14COMPANY ANALYSIS: TATA STEELBOAC, WG P2, SEC 3
152 and other applicable provisions, if any, of the Companies Act, 2013 (“Act”) and the
Rules made thereunder read with Schedule IV to the Act, as amended from time to time, Mr.
Nusli N. Wadia (DIN: 00015731), a non-executive director of the Company, who has
submitted a declaration that he meets the criteria for independence as provided in Section
149(6) of the Act and who is eligible for appointment, be and is hereby appointed as an
Independent Director of the Company with effect from 14th August, 2014 up to 14th
February, 2019.”
9. Appointment of Mr. Subodh Bhargava as an Independent Director
To consider and, if thought fit, to pass with or without modification, the following Resolution
as an Ordinary Resolution: “RESOLVED THAT pursuant to the provisions of Sections 149,
152 and other applicable provisions, if any, of the Companies Act, 2013 (“Act”) and the
Rules made thereunder read with Schedule IV to the Act, as amended from time to time, Mr.
Subodh Bhargava (DIN: 00035672), a non-executive director of the Company, who has
submitted a declaration that he meets the criteria for independence as provided in Section
149(6) of the Act and who is eligible for appointment, be and is hereby appointed as an
Independent Director of the Company with effect from 14th August, 2014 up to 29th March,
2017.”
10. Appointment of Mr. Jacobus Schraven as an Independent Director
To consider and, if thought fit, to pass with or without modification, the following Resolution
as an Ordinary Resolution: “RESOLVED THAT pursuant to the provisions of Sections 149,
152 and other applicable provisions , if any, of the Companies Act, 2013 (“Act”) and the
Rules made thereunder read with Schedule IV to the Act, as amended from time to time, Mr.
Jacobus Schraven (DIN: 01462126), a non-executive director of the Company, who has
submitted a declaration that he meets the criteria for independence as provided in Section
149(6) of the Act and who is eligible for appointment, be and is hereby appointed as an
Independent Director of the Company with effect from 14th August, 2014 up to 7th February,
2017.”
11. Appointment of Mrs. Mallika Srinivasan as an Independent Director
To consider and, if thought fit, to pass with or without modification, the following Resolution
as an Ordinary Resolution: “RESOLVED THAT pursuant to the provisions of Sections 149,
152 and other applicable provisions, if any, of the Companies Act, 2013 (“Act”) and the
14
15COMPANY ANALYSIS: TATA STEELBOAC, WG P2, SEC 3
Rules made thereunder read with Schedule IV to the Act, as amended from time to time, Mrs.
Mallika Srinivasan (DIN: 00037022), a non-executive director of the Company, who has
submitted a declaration that she meets the criteria for independence as provided in Section
149(6) of the Act and who is eligible for appointment, be and is hereby appointed as an
Independent Director of the Company with effect from 14th August, 2014 up to 13th August,
2019.”
12. Appointment of Mr. O. P. Bhatt as an Independent Director
To consider and, if thought fit, to pass with or without modification, the following Resolution
as an Ordinary Resolution: “RESOLVED THAT pursuant to the provisions of Sections 149,
152 and other applicable provisions, if any, of the Companies Act, 2013 (“Act”) and the
Rules made thereunder read with Schedule IV to the Act, as amended from time to time, Mr.
O. P. Bhatt (DIN: 00548091), a non-executive director of the Company, who has submitted a
declaration that he meets the criteria for independence as provided in Section 149(6) of the
Act and who is eligible for appointment, be and is hereby appointed as an Independent
Director of the Company with effect from 14th August, 2014 up to 13th August, 2019.”
13. Ratification of Cost Auditors’ remuneration
To consider and, if thought fit, to pass with or without modification, the following Resolution
as an Ordinary Resolution: “RESOLVED THAT pursuant to Section 148 and other
applicable provisions, if any, of the Companies Act, 2013 ("Act") and the Rules made
thereunder, as amended from time to time, the Company hereby ratifies the remuneration of
Rs.12 lakhs plus out-of-pocket expenses payable to M/s. Shome & Banerjee, who are
appointed as Cost Auditors of the Company to conduct Cost Audits relating to such
businesses of the Company as may be ordered by the Central Government under the Act and
the Rules thereunder, for the year ending 31st March, 2015.”
The Directors have also proposed dividends in current year at the rate of 100 % i.e. Rs 10 per
ordinary share. Out of profit of Rs. 6412.19 crores during the current year, Rs. 971.21 crores
is dividend proposed which is approx. 15 % of the profit.
Auditors:Deloitte Haskins & Sells are the auditors of Tata Steel. They have been their auditors since a
long time. There have been no negative comments by the auditor in the audit report. The
15

16COMPANY ANALYSIS: TATA STEELBOAC, WG P2, SEC 3
audit report doesn’t recommend anything to present/potential investors as the duty of an
auditor is to give the true and fair view of the financial position of the company and not its
prospects. The auditors were paid Rs. 6.89 crores compensation in total (including cost-audit
fees, fees for services of auditors, for taxation, matters, out of pocket expenses).
Fixed Assets: Out of total assets, 38% comprises fixed assets (tangible, intangible and capital work-in-
progress). Tangible assets contribute Rs. 24,064.43 crores (56%) and intangible assets
contribute Rs. 201.32 crores (0.5 %) to the total fixed assets. The company has made
additional investments in both tangible assets (Rs.1003.11 crores) as well as intangible assets
(Rs.125.51 crores).
The company has also discarded and sold some assets during the year. The loss in such
sale/scrapping was Rs. 48.61 crores
Depreciation policy is different for different assets. For the year 2013-14, depreciation
constitutes about 4.5 % of the total revenue. Following is the policy regarding depreciation
(i) Capital assets whose ownership does not vest with the Company are depreciated over their
estimated useful life or five years, whichever is less.
(ii) In respect of other assets, depreciation is provided on a straight line basis applying the
rates specified in Schedule XIV to the Companies Act, 1956 or rates based on estimated
useful life whichever is higher. However, asset value upto Rs. 25,000 is fully depreciated in
the year of acquisition. The details of estimated life for each category of asset are as under:
(a) Buildings and Roads — 30 to 62 years
(b) Plant and Machinery — 3 to 30 years
(c) Railway Sidings — 21 years
(d) Vehicles and Aircraft — 5 to 18 years
(e) Furniture, Fixtures and Office Equipments — 5 years
(f) Intangibles (Computer Softwares) — 5 to 10 years
(g) Development of property for development of mines and collieries are amortised over the
useful life of the mine or lease period whichever is less, subject to maximum of 10 years.
(h) Major furnace relining expenses are depreciated over a period of 10 years (average
expected life).
16

17COMPANY ANALYSIS: TATA STEELBOAC, WG P2, SEC 3
(i) Freehold land is not depreciated.
(j) Leasehold land and other leasehold assets are amortised over the life of the lease.
At Tata Steel, Re 0.99 is revenue generated per rupee of investment in fixed assets
(42,498.67/42,775.15)
Inventories: The company holds various types of inventories which include:
(a) Raw materials
(b) Work-in-progress
(c) Finished and semi-finished goods
(d) Stock-in-trade of goods acquired for trading
(e) Stores and spares
The total investments in inventories during the current year is Rs. 6007.81 crores. Inventory
has been rising continuously since last five years. As compared to last year, it increased by
around 14%.
Long-term Borrowings:The sources of long term borrowings are broadly classified into SECURED and
UNSECURED loans. Secured loans are those loans that are protected by an asset or collateral
of some sort. If the borrower defaults in repaying the debt, the creditor takes the possession of
the asset.
The sources of long term borrowings include-
Loan from Joint Plant Committee – Steel Development Fund
Bonds/Debentures
Term loans from banks
Term loans from financial institutions
During the last five years, out of the total borrowings, the composition hasn’t changed much.
Unsecured loans contribute more than 90% to the total long term borrowings. Even, the
borrowings are not only made in INR but also in various currencies which include US dollars,
Japanese Yen, British Pound Sterling, Euros.
17

18COMPANY ANALYSIS: TATA STEELBOAC, WG P2, SEC 3
As against secured loans, Tata Steel have offered different assets as securities. Loan from
Joint Plant Committee – Steel Development Fund is secured by mortgages on all present and
future fixed assets, excluding land and buildings mortgaged in favor of Government of India,
land and buildings, plant and machinery and movables of the Tubes Division and the
Bearings Division mortgaged in favor of the financial institutions and banks, assets of the
Ferro Alloys Plant at Bamnipal mortgaged in favor of State Bank of India and assets of Cold
Rolling Complex (West) at Tarapur and a floating charge on other properties and assets
(excluding investments) of the Company, subject to the prior floating charge in favor of State
Bank of India and other banks.
During the year 2013-14, long term borrowings (Rs.23,808.09 crores ) contribute about 22%
to the total assets (Rs.1,11,040.41 crores). There was an increase in total long term
borrowings by about Rs. 240 crores as compared to 2012-13. This was due to raising of new
loans as well as repayment of some existing debts. Two new loans were taken from banks
worth $ 200 million (Rs. 1,198 crores) and Rs. 2,000 crores respectively whereas,
installments of many loans taken in terms of Euros were repaid along with loan of Rs. 1,500
crores.
With increase in the long term borrowings, the interest burden on the company increases. In
order to fulfill the interest obligations, the company needs to earn profit at a rate higher than
the interest rates on loan. Tata Steel was able to do just the same.
Cash generated from operating activities is Rs. 12,432.80 crores during the year whereas the
interest expense for the year is Rs.1820.58 crores. Thus, Tata Steel is generating enough
operating profits to pay off the interests.
Other Aspects:The company has invested a lot of resources in current as well as non-current investments.
Long-term investments are carried at cost less provision for diminution other than temporary,
if any, in value of such investments. Current investments are carried at lower of cost and fair
value. Out of total assets of Rs.111040.41 crores (2013-14), Rs.52318.56 crores has been
invested in non-current investments and Rs.2343.24 crores have been invested in current
investments. This shows that investments contribute around 49 % to the total assets.Trade
investments stand at Rs. 52,318.35 crores.
Tata Steel has made investments in various instruments as follows-
18

19COMPANY ANALYSIS: TATA STEELBOAC, WG P2, SEC 3
1. Investments in Equity Instruments (Subsidiary companies, Joint ventures,
Associate companies, etc.)
2. Investment in preference shares (Subsidiary companies)
3. Investment in Debentures/Bonds (Subsidiary companies, Associate
companies)
During the year 2013-14, the company earned following incomes from various investments
(Rs. In crores) -
(a) Dividend income
(i) Investment in subsidiaries 352.97
(ii) Investment in joint ventures and associates 69.36
(iii) Other non-current investments 58.69
(iv) From current investments 13.42
(b) Interest income 153.64
648.08
During the current year, there were some non-operating gains as well as losses, which include
(in crores Rs.) –
Profit on sale of non-current investments - 24.78
Loss on assets sold/discarded - 48.61
Loss on cancellation of forwards, swaps and options - 18.01
Loss on revaluation of foreign currency loans and swaps - 360.51
As compared to last year, current year profit has increased to Rs. 6412.19 crores from Rs.
5062.97. The increase of Rs. 150 crores was the result of increase in revenue from operations
combined with the decrease in consumption of raw materials. Inspite of revenue from
operations increased by around Rs.4000 crores, the consumption of raw materials decreased
by around Rs. 200 crores.
Tata Steel has generated Rs.12432.80 crores from operating activities during 2013-14. This
indicates a healthy business. However, there has been a net decrease in Cash & cash
equivalents because of various investments and purchase of fixed assets. Also, repayment of
19

20COMPANY ANALYSIS: TATA STEELBOAC, WG P2, SEC 3
borrowings as well as interest and dividend payment led to a major outflow of cash. Thus,
there is a big difference between operating profits and cash flows.
A. Contingent Liabilities
(a) Claims not acknowledged by the Company (Rs. Crores)
(i) Excise and Service Tax 415.27
(ii) Customs 13.71
(iii) Sales Tax and VAT 283.25
(iv) State Levies 271.73
(v) Suppliers and Service Contract 80.38
(vi) Labour Related 48.85
(vii) Income Tax 107.55
(viii) Royalty 14.01
(b) The Company has given guarantees aggregating Rs. 2,224.38 crores on behalf of
others.As at 31st March, 2014, the contingent liabilities under these guarantees
amounts to Rs. 2,224.38 crores.
(c) Claim by a party arising out of conversion arrangement - Rs. 195.82 crores. The
Company has not acknowledged this claim and has instead filed a claim of Rs. 139.65
crores on theparty. The matter is pending before the Calcutta High Court.
(d) The State Government of Odisha introduced "Orissa Rural Infrastructure and Socio
Economic Development Act, 2004" with effect from February 2005 levying tax on
mineral bearing land computed on the basis of value of minerals produced from the
mineral bearing land. The Company had filed a Writ Petition in the High Court of
Orissa challenging the validity of the Act. Orissa High Court held in November 2005
that State does not have authority to levy tax on minerals. The State Government of
Odisha moved to the Supreme Court against the order of Orissa High Court and the
case is pending with Supreme Court. The potential liability, as of 31st March, 2014
would be approximately Rs. 3,946.65 crores
(e) Interest expenditure on loans taken and deployed for Corus acquisition has been
disallowed in assessments with tax demand raised for Rs. 453 crores. Company has
deposited Rs. 300 crores as a precondition to prefer appeals and is reasonably
confident of succeeding in litigation, on due consideration of facts and legal position.
(f) The Company has been paying royalty on coal extracted from its quarries pursuant to
the judgement and order dated 23rd July, 2002 passed by the Jharkhand High Court.
20

21COMPANY ANALYSIS: TATA STEELBOAC, WG P2, SEC 3
However, the State Government demanded royalty at rates applicable to processed
coal. Though the Company has contested the above demand, it has started paying,
under protest, royalty on processed coal from November 2008. The demand of the
state mining authority has been confirmed by High Court vide its Judgment dated
12th March, 2014. High Court has concluded that the State cannot claim interest till
the Hon’ble Supreme Court decides the pending SLP’s filed by State and Company in
the year 2004. Company has filed SLP before Supreme Court against the order of the
High Court dated 12th March, 2014. In the hearing held on 2nd May, 2014, the case
has been referred to the Larger Bench of the Supreme Court. Principal demand
amount have been provided in the books. Interest amount of Rs. 301.83 crores has
been considered as contingent liability.
(g) The Company pays royalty on ore on the basis of quantity removed from the leased
area at the rates based on notification by the Ministry of Mines, Government of India
and the price published by India Bureau of Mines (IBM) on a monthly basis. An
additional demand of Rs. 148.15 crores has been raised by Deputy Director of Mines,
Joda, claiming royalty at sized ore rates on despatches of ore fines. The Company has
filed a revision petition on 14th November, 2013 before the Mines Tribunal,
Government of India, Ministry of Mines, New Delhi, challenging the legality and
validity of the demand raised and also to grant refund of royalty excess paid by the
Company. Accordingly, the demand of Rs. 148.15 crores has been considered as a
contingent liability.
(h) In terms of Agreements entered into in 2008-09 between Tata Teleservices Ltd.
(TTSL), Tata Sons Limited (TSL) and NTT DoCoMo, Inc. of Japan (Strategic
Partner-SP), the Company sold to the SP, 52,46,590 equity shares of Tata
Teleservices Ltd. (“TTSL”) at Rs. 116.09 per share which resulted in a profit of Rs.
49.77 crores in the same year. Tata Sons Limited is party to a Shareholders
Agreement with NTT DoCoMo, Inc. of Japan (Strategic Partner – SP) dated 25th
March, 2009 and amended on 21st May, 2010.
Ratio Analysis:1. Current ratio: The current ratio has been continuously decreasing since last five
years. This may be a cause of worry as the company may face short term liquidity
21

22COMPANY ANALYSIS: TATA STEELBOAC, WG P2, SEC 3
problems as current liabilities are increasing and current assets are decreasing. For the
current year, it is well below the standard of 2:1.
Current ratio of JSW stands at 0.82 and that of SAIL is 0.79. So Tata Steel’s ratio of
0.61 is quite below the competitors.
2. Quick ratio: As current ratio is showing a decreasing trend, quick ratio will also
follow the same trend. It is more serious issue as inventories form a major part of
current assets and cannot be liquidated in short period. Here also, it stands at 0.29 as
against the desirable ratio of 1:1.
In quick ratio also, the company lags behind its competitors. JSW stands at 0.71 and
SAIL stands at 0.62, whereas Tata Steel stands at mere 0.29.
3. Proprietary ratio: It shows the contribution of owners’ funds in total assets. The
owners’ funds have been increasingly contributing to the total assets and it stands at
around 55% which is a healthy sign. This means that most of the assets are purchased
through proprietors’ funds.
4. Return on assets: During the last five years, it shows as uneven trend. It increased in
2010-11 but reduced for the next two years and again increased in the last year. For
the current year, it stands at 5.77 % of total assets.
Return on assets of JSW is way above at 14.08% than that of Tata Steel (5.77%).
SAIL’s return on assets is 5.07%.
5. Earnings per share: In the last five years, EPS has shown uneven trends too. For
2010-11, it increased and for 2011-12, it decreased. Again, 2012-13 it increased to Rs.
74.54 and reduced to Rs. 64.21 in 2013-14.
As compared to competitors, Tata Steel’s EPS is Rs. 64.21 whereas that of JSW &
SAIL is Rs. 54.05 and Rs. 6.33.
6. Price-earnings ratio: Price earnings ratio showed a decreasing trend from 2009-10 to
2012-12. But during 2013-14, it increased to 6.13 as compared to 4.19 in the previous
year.
7. NP ratio: Net profit ratio is calculated so as to measure the profitability of the
company. If we look at the last five years, NP ratio is decreasing continuously. Even
though revenues are increasing, expenses are increasing at a faster rate. Thus, increase
in revenues has been off-set by the increasing expenses. There has been a marginal
increase in the last year owing to reduction in consumption of raw materials and
purchase of semi-finished and finished goods.
22
23COMPANY ANALYSIS: TATA STEELBOAC, WG P2, SEC 3
8. Return on capital employed: As the profit decreased, the return on capital also
decreased till 2012-13. However, as NP increased in the last year, the return on capital
also increased to more than 13 %.
9. Debt-equity ratio: Debt-equity ratio shows the amount of debt in the business against
per unit of share capital. Lower the debt-equity ratio, lower the interest burden on the
company and higher the profitability.
10. Return on shareholders’ equity: Return on shareholders’ funds reduced due to
reduction in profits. It shows the same trend as return on capital employed. In the year
2013-14, it increased marginally to 10.49 %.
11. Cash ratio: This again shows the liquidity position of the company. The current
liabilities has been piling up but the cash and cash equivalents have been continuously
decreasing. The firm generates cash from operating activities but due to purchase of
fixed assets and investments, cash balance has reduced from last year.
12. Interest coverage ratio: It shows as to how many times interest can be paid from
PBIT. As the long term borrowings are repaid, the company’s interest burden reduces.
Here, as the revenues have increased, PBIT has also increased. Interest expenses
haven’t increased at that high rate and thus interest coverage ratio has also increased.
13. Asset turnover ratio: It measures the efficiency of the management in utilization of
assets. Higher the assets turnover ratio, more is the utilization of assets. Here, assets
turnover is marginally increasing except in 2010-11. In 2013-14, it stands at 0.38
which means that assets are not utilized as it should have been utilized.
14. Book value: Net worth of the company is increasing every year, but new shares are
not issued after 2010-11. Thus, book value of the existing shares keeps on increasing.
Sr. No. Ratios 2009-10 2010-11 2011-12 2012-13 2013-14
1
Current Ratio =Current Assets/ Current LiabilitiesCurrent Ratio 1.36 1.38 0.76 0.70 0.61
2Quick ratio=Quick assets/current liabilitiesQuick Ratio 1.09 1.08 0.47 0.38 0.29
3Proprietary ratio=(proprietor's funds/Total assets)*100Proprietary ratio 50.47 52.42 54.71 54.19 55.07
4Return on assets=(Net profit/Assets)*100Return on assets 6.89 7.67 6.96 4.97 5.77
23

24COMPANY ANALYSIS: TATA STEELBOAC, WG P2, SEC 3
5
Earning per share=Profit available for eq. shareholders/no. of sharesEPS 56.22 71.46 67.16 74.54 64.21
6Price-Earnings ratio=market price/EPSP\E ratio 11.25 8.68 7.00 4.19 6.13
7NP ratio=(PAT/Total Revenue)*100NP Ratio 20.17 22.94 19.23 12.95 15.09
8
Return on Capital Employed=(PBT+finance cost) /( total capital employed) * 100Return on Capital Employed 14.02 16.11 15.93 12.33 13.58
9Debt-Equity Ratio=(Long Term debt/ Equity)Debt-equity ratio 0.68 0.52 0.41 0.43 0.39
10
Return on Shareholders' Equity=(Profit After Tax/Equity)*100Return on Shareholders' equity 24.35 14.63 12.73 9.17 10.49
11
Cash Ratio= (Cash & cash equivalents/Current Liabilities)*100Cash Ratio 35.94 31.60 23.35 13.45 5.09
12Interest Coverage Ratio= (PBIT/Interest Expense)Interest Coverage Ratio 5.78 6.63 6.12 5.18 6.34
13Asset Turn Over = Revenue from Operations / Total assetsAsset Turn Over 0.34 0.33 0.35 0.37 0.38
14
Fixed Assets Turnover Ratio = Revenue from Operations / Fixed AssetFixed Assets Turnover Ratio 1.56 1.72 1.24 1.14 0.98
15Book Value = Net Worth / No. of SharesBook Value 416.61 488.94 541.30 567.93 629.01
24