tata elxsi ltd transformational change driving growth...
TRANSCRIPT

Centrum Wealth Research is also available on: Bloomberg: CBWM <GO>, Thomson Reuters, Capital IQ and Factset
Please refer to important disclosures/disclaimers inside
Wealth Research April 21, 2016
Initiation Tata Elxsi Ltd
Transformational change driving growth BUY
Tata Elxsi (TELX) is a niche software design company that derives its business from two verticals – Software Development & Services (SDS ~95% of revenue) and Systems Integration (SI). TELX has seen a transformational change in its business model (closing down loss making segments and scaling down SI business) over the last few years, which led to higher revenue growth along with improvement in margins. Within the SDS segment, TELX has focus on Embedded Product Design (EPD) in high growth areas like automotive and broadcasting & communication. According to Nasscom, while the global Engineering & RD (E&RD) spends are expected to increase at 10% CAGR over FY13-FY20E, India is likely to grow at 15% p.a. The complex innovation requirements by the OEMs need to be cost effective which makes a good case for offshoring to India due to its capabilities along with cost advantage. Along with healthy margins and return ratios (EBITDA margins ~24%, RoEs ~45%), we expect revenue and net profit CAGR of 25% and 38% over FY15-18E. We initiate coverage on TELX with a ‘Buy’ rating and target price of ₹2,410.
Transformational change in the business – leading to higher growth trajectory:
The restructuring of business, focus on SDS and scale down low margin businesses led to significant improvement in financials. Further, the company has significantly scaled down its share of low margin SI business (from ~16% in 2012 to 5% in Q3FY16). All these initiatives led to improvement in revenue growth from 8% CAGR in FY07-11 to 19% CAGR in FY12-16E. Going ahead, we expect revenue CAGR of 25% over FY15-18E with growth driven primarily by the EPD business.
Increase in Global Engineering & RD spends – Opens offshoring opportunity:
With the continuous increase in automation and software led innovations, the global E&RD spend has increased from $980 billion in 2008 to $1400 billion 2013 and is expected reach $1600-1700 billion by 2020. The complex innovations requirement of OEM’s and Tier-1 suppliers needs to be cost effective which opens up offshoring opportunity to India given strong engineering capability along with cost advantage. According to NASCOM, India’s share in Global E&RD offshore market is expected to increase from 20% to 30% by 2020 to reach $35-40 billion. TELX is well placed to encash the opportunity in both automotive and broadcasting with an estimated addressable market of $600-700 million and $400-500 million respectively.
Strong balance sheet and return profile: TELX has a strong balance sheet with
zero debt, comfortable working capital (current ratio 2.5x) with cash conversion cycle of 38 -40 days. The change in the business mix has helped in improving margins (~24%) and return ratios. Generally, IT product companies in the growth phase have lower return ratios and companies with matured product profile have higher return ratios but moderate revenue growth. TELX is in the sweet spot having both revenue growth and healthy return ratios.
Risk factors: 1) Project driven business; 2) any strong currency fluctuation; 3) Slower
than expected growth in innovation within auto and broadcast sectors; 4) any significant slowdown in sales of top 5 products.
Premium valuation justified given growth and return ratios: It has been seen that
on average, IT product companies are valued higher than IT services companies. Within the IT product companies there are two distinct types – 1) High revenue growth but moderate margins and return ratios (trading at 22-33x FY18E earnings); 2) Companies with moderate revenue growth but high margins and return ratios (trading at 18x FY18E earnings). Thus TELX premium valuations are justified on the back of both robust revenue growth (~25% over FY15-18E), and return profile (~43-48% over FY15-18E).The stock has already seen some rerating on the back of this transformational change and we expect the premium valuations to continue going forward. We initiate with a ‘buy’ rating, with a target price of ₹2,410 valuing it at 28x its FY18E EPS of ₹86.1.
Key Data
Current Market Price (₹) 1,977
Target Price (₹) 2,410
Potential upside/downside (%) 21.9
Sector Relative to Market In-line
Stock Relative to Sector Outperform
Stock Information
BSE Code 500408
NSE Code TATAELXSI
Face Value (₹/Share) 10
No. of shares (Cr.) 3.1
Market Cap (₹ Cr.) 6,152.1
Free float (₹ Cr.) 3,383.7
52 Week H / L (₹) 2,396/978
Avg. Daily turnover (12M, ₹ Cr.) 156.1
Shareholding Pattern (%)
Mar-16 Mar-15
Promoters 44.8 44.9
Mutual Funds 1.5 0.7
FPIs 13.4 8.1
Others 40.3 46.3
1 year Indexed Price Performance
70
90
110
130
150
170
190
210
230
Apr 15 Jul 15 Oct 15 Jan 16 Apr 16
TELX IT Index BSE500
Price Performance (%)
1M 3M 6M 12M
TELX 1.4 15.4 6.2 76.4
BSE 500 3.2 7.2 2.7 6.0
BSE IT Index
3.8 8.9 -3.7 -4.2
Source: Bloomberg, Centrum Wealth Research
Siddhartha Khemka, Sr. VP Research
Financial Summary - Consolidated
Y/E Mar (₹ Cr.) Revenue YoY (%) EBITDA EBITDA (%) Adj. PAT YoY (%) EPS (₹) P/E (x) EV/EBITDA (x) RoE (%)
FY15A 849 9.6 177 20.9 102 41.2 32.77 60.3 34.0 39.3
FY16E 1,064 25.3 252 23.7 159 55.5 50.97 38.8 23.7 47.3
FY17E 1,334 25.4 323 24.2 206 29.7 66.12 29.9 18.2 45.1
FY18E 1,666 24.9 412 24.7 268 30.2 86.10 23.0 13.9 43.2
Source: Company, Centrum Wealth Research
Tata Elxsi Ltd
Centrum Broking Ltd. 2
Centrum Wealth Research
About the Company
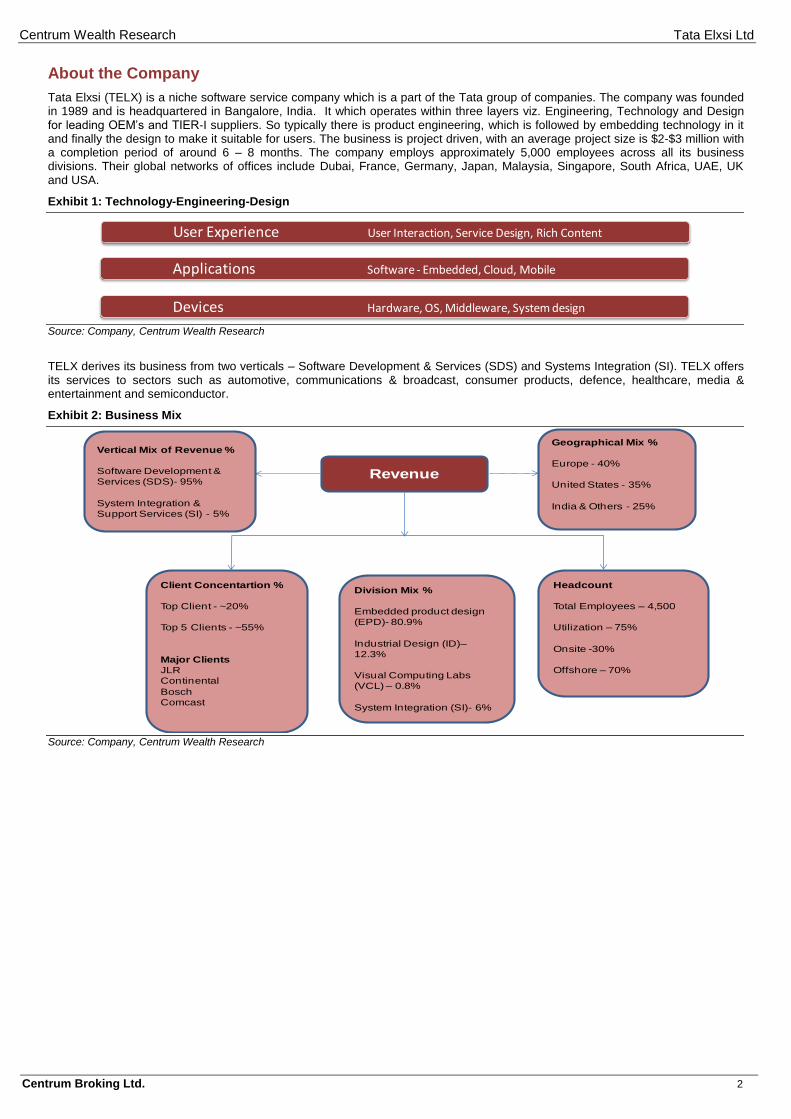
Tata Elxsi (TELX) is a niche software service company which is a part of the Tata group of companies. The company was founded in 1989 and is headquartered in Bangalore, India. It which operates within three layers viz. Engineering, Technology and Design for leading OEM’s and TIER-I suppliers. So typically there is product engineering, which is followed by embedding technology in it and finally the design to make it suitable for users. The business is project driven, with an average project size is $2-$3 million with a completion period of around 6 – 8 months. The company employs approximately 5,000 employees across all its business divisions. Their global networks of offices include Dubai, France, Germany, Japan, Malaysia, Singapore, South Africa, UAE, UK and USA.
Exhibit 1: Technology-Engineering-Design
Devices Hardware, OS, Middleware, System design
Applications Software - Embedded, Cloud, Mobile
User Experience User Interaction, Service Design, Rich Content
Source: Company, Centrum Wealth Research
TELX derives its business from two verticals – Software Development & Services (SDS) and Systems Integration (SI). TELX offers its services to sectors such as automotive, communications & broadcast, consumer products, defence, healthcare, media & entertainment and semiconductor.
Exhibit 2: Business Mix
Revenue
Vertical Mix of Revenue %
Software Development &
Services (SDS)- 95%
System Integration &
Support Services (SI) - 5%
Geographical Mix %
Europe - 40%
United States - 35%
India & Others - 25%
Client Concentartion %
Top Client - ~20%
Top 5 Clients - ~55%
Major Clients
JLR
Continental
Bosch
Comcast
Headcount
Total Employees – 4,500
Utilization – 75%
Onsite -30%
Offshore – 70%
Division Mix %
Embedded product design
(EPD)- 80.9%
Industrial Design (ID)–
12.3%
Visual Computing Labs
(VCL) – 0.8%
System Integration (SI)- 6%
Source: Company, Centrum Wealth Research
Tata Elxsi Ltd
Centrum Broking Ltd. 3
Centrum Wealth Research
Transformational changes in the business – Leading to higher growth trajectory
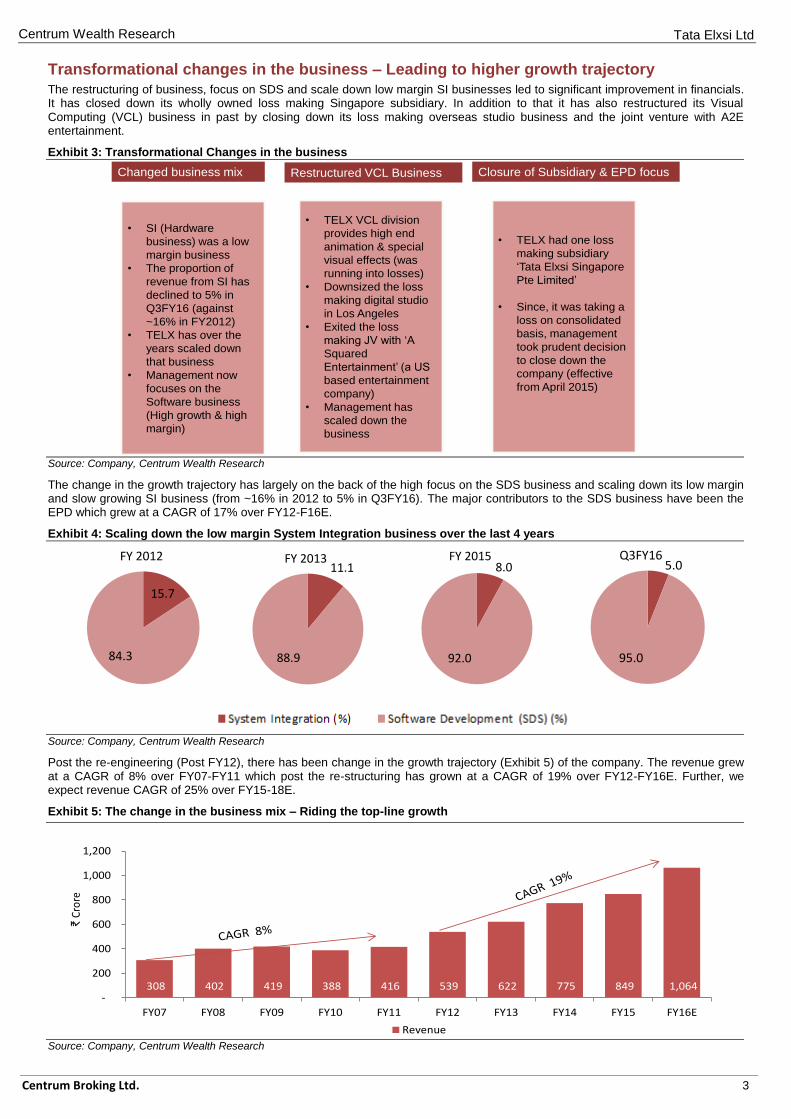
The restructuring of business, focus on SDS and scale down low margin SI businesses led to significant improvement in financials. It has closed down its wholly owned loss making Singapore subsidiary. In addition to that it has also restructured its Visual Computing (VCL) business in past by closing down its loss making overseas studio business and the joint venture with A2E entertainment.
Exhibit 3: Transformational Changes in the business
Changed business mix Restructured VCL Business Closure of Subsidiary & EPD focus
• TELX VCL division
provides high end
animation & special
visual effects (was
running into losses)
• Downsized the loss
making digital studio
in Los Angeles
• Exited the loss
making JV with ‘A
Squared
Entertainment’ (a US
based entertainment
company)
• Management has
scaled down the
business
• TELX had one loss
making subsidiary
‘Tata Elxsi Singapore
Pte Limited’
• Since, it was taking a
loss on consolidated
basis, management
took prudent decision
to close down the
company (effective
from April 2015)
• SI (Hardware
business) was a low
margin business
• The proportion of
revenue from SI has
declined to 5% in
Q3FY16 (against
~16% in FY2012)
• TELX has over the
years scaled down
that business
• Management now
focuses on the
Software business
(High growth & high
margin)
Source: Company, Centrum Wealth Research
The change in the growth trajectory has largely on the back of the high focus on the SDS business and scaling down its low margin and slow growing SI business (from ~16% in 2012 to 5% in Q3FY16). The major contributors to the SDS business have been the EPD which grew at a CAGR of 17% over FY12-F16E.
Exhibit 4: Scaling down the low margin System Integration business over the last 4 years
15.7
84.3
FY 2012
11.1
88.9
FY 2013
8.0
92.0
FY 2015
5.0
95.0
Q3FY16
Source: Company, Centrum Wealth Research
Post the re-engineering (Post FY12), there has been change in the growth trajectory (Exhibit 5) of the company. The revenue grew at a CAGR of 8% over FY07-FY11 which post the re-structuring has grown at a CAGR of 19% over FY12-FY16E. Further, we expect revenue CAGR of 25% over FY15-18E.
Exhibit 5: The change in the business mix – Riding the top-line growth
308 402 419 388 416 539 622 775 849 1,064 -
200
400
600
800
1,000
1,200
FY07 FY08 FY09 FY10 FY11 FY12 FY13 FY14 FY15 FY16E
₹Cr
ore
Revenue
Source: Company, Centrum Wealth Research
Tata Elxsi Ltd
Centrum Broking Ltd. 4
Centrum Wealth Research
Technological advancement in automotive & broadcasting sector to open significant off-shoring opportunity
A. Auto (~45% of the EPD revenue)
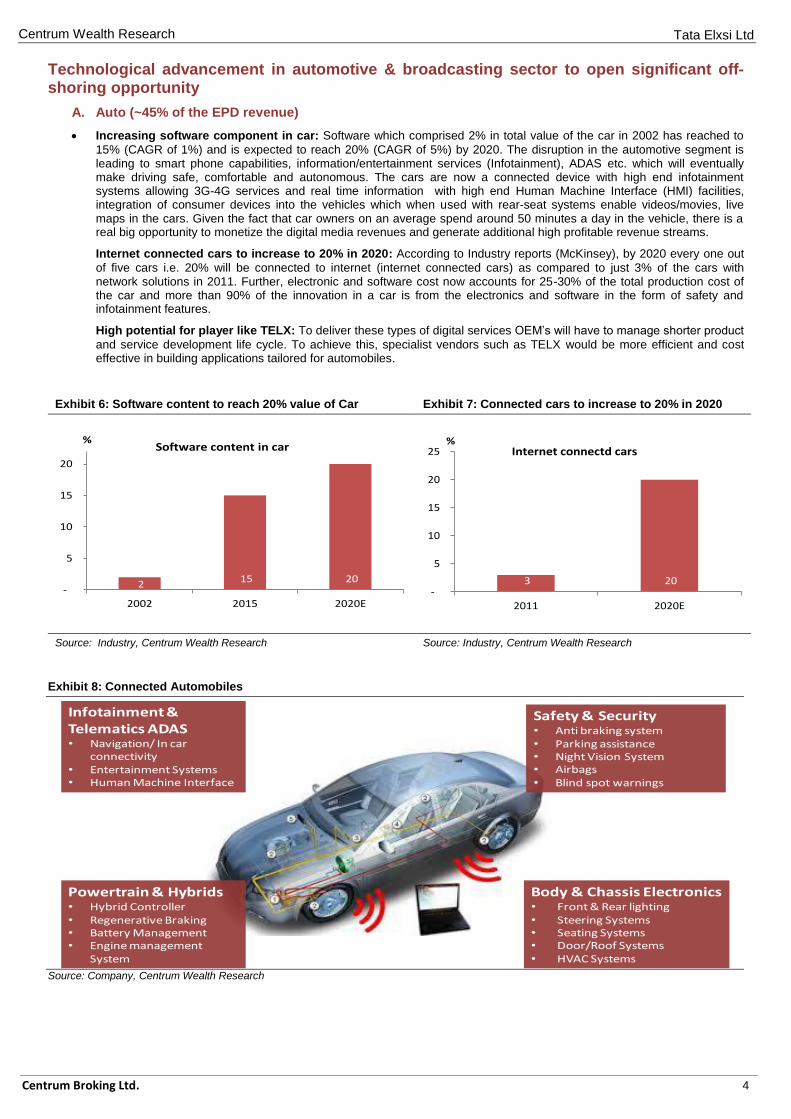
Increasing software component in car: Software which comprised 2% in total value of the car in 2002 has reached to
15% (CAGR of 1%) and is expected to reach 20% (CAGR of 5%) by 2020. The disruption in the automotive segment is leading to smart phone capabilities, information/entertainment services (Infotainment), ADAS etc. which will eventually make driving safe, comfortable and autonomous. The cars are now a connected device with high end infotainment systems allowing 3G-4G services and real time information with high end Human Machine Interface (HMI) facilities, integration of consumer devices into the vehicles which when used with rear-seat systems enable videos/movies, live maps in the cars. Given the fact that car owners on an average spend around 50 minutes a day in the vehicle, there is a real big opportunity to monetize the digital media revenues and generate additional high profitable revenue streams.
Internet connected cars to increase to 20% in 2020: According to Industry reports (McKinsey), by 2020 every one out
of five cars i.e. 20% will be connected to internet (internet connected cars) as compared to just 3% of the cars with network solutions in 2011. Further, electronic and software cost now accounts for 25-30% of the total production cost of the car and more than 90% of the innovation in a car is from the electronics and software in the form of safety and infotainment features.
High potential for player like TELX: To deliver these types of digital services OEM’s will have to manage shorter product
and service development life cycle. To achieve this, specialist vendors such as TELX would be more efficient and cost effective in building applications tailored for automobiles.
Exhibit 6: Software content to reach 20% value of Car Exhibit 7: Connected cars to increase to 20% in 2020
2 15 20
-
5
10
15
20
2002 2015 2020E
%Software content in car
3 20 -
5
10
15
20
25
2011 2020E
%Internet connectd cars
Source: Industry, Centrum Wealth Research Source: Industry, Centrum Wealth Research
Exhibit 8: Connected Automobiles
Body & Chassis Electronics• Front & Rear lighting• Steering Systems• Seating Systems• Door/Roof Systems• HVAC Systems
Infotainment & Telematics ADAS• Navigation/ In car
connectivity• Entertainment Systems• Human Machine Interface
Powertrain & Hybrids• Hybrid Controller• Regenerative Braking• Battery Management• Engine management
System
Safety & Security• Anti braking system• Parking assistance• Night Vision System• Airbags• Blind spot warnings
Source: Company, Centrum Wealth Research
Tata Elxsi Ltd
Centrum Broking Ltd. 5
Centrum Wealth Research
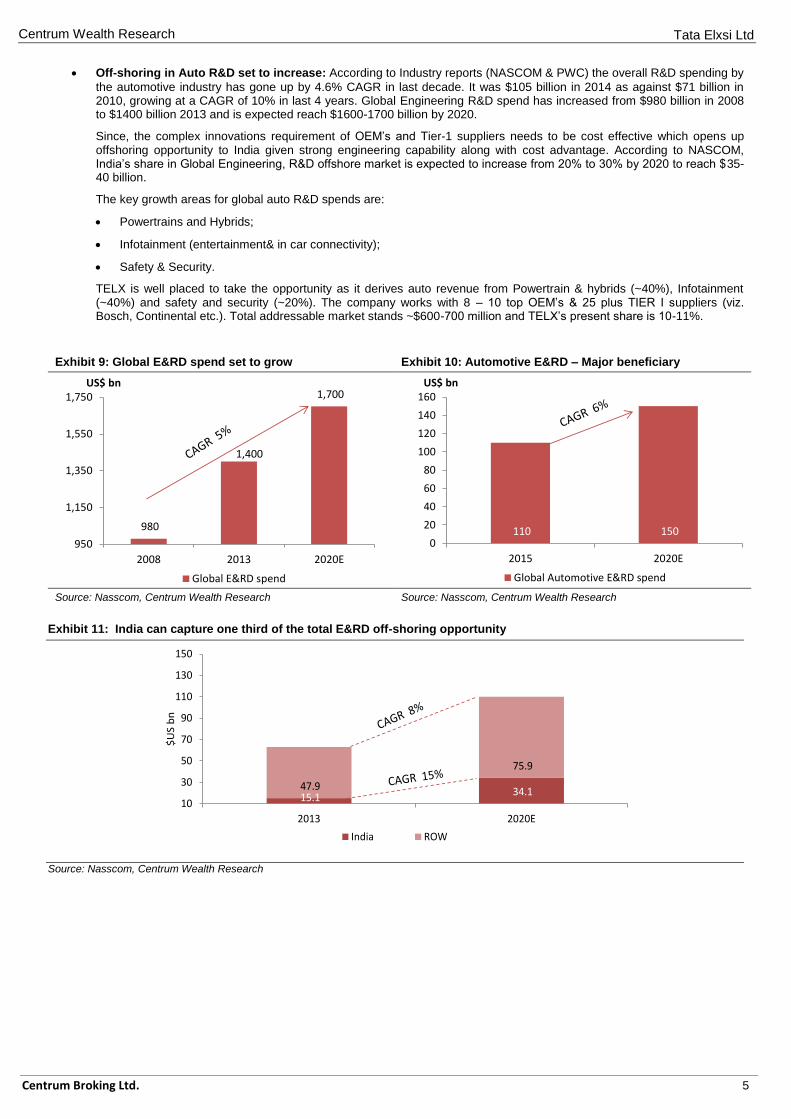
Off-shoring in Auto R&D set to increase: According to Industry reports (NASCOM & PWC) the overall R&D spending by
the automotive industry has gone up by 4.6% CAGR in last decade. It was $105 billion in 2014 as against $71 billion in 2010, growing at a CAGR of 10% in last 4 years. Global Engineering R&D spend has increased from $980 billion in 2008 to $1400 billion 2013 and is expected reach $1600-1700 billion by 2020.
Since, the complex innovations requirement of OEM’s and Tier-1 suppliers needs to be cost effective which opens up offshoring opportunity to India given strong engineering capability along with cost advantage. According to NASCOM, India’s share in Global Engineering, R&D offshore market is expected to increase from 20% to 30% by 2020 to reach $35-40 billion.
The key growth areas for global auto R&D spends are:
Powertrains and Hybrids;
Infotainment (entertainment& in car connectivity);
Safety & Security.
TELX is well placed to take the opportunity as it derives auto revenue from Powertrain & hybrids (~40%), Infotainment (~40%) and safety and security (~20%). The company works with 8 – 10 top OEM’s & 25 plus TIER I suppliers (viz. Bosch, Continental etc.). Total addressable market stands ~$600-700 million and TELX’s present share is 10-11%.
Exhibit 9: Global E&RD spend set to grow Exhibit 10: Automotive E&RD – Major beneficiary
980
1,400
1,700
950
1,150
1,350
1,550
1,750
2008 2013 2020E
US$ bn
Global E&RD spend
110 150 0
20
40
60
80
100
120
140
160
2015 2020E
US$ bn
Global Automotive E&RD spend
Source: Nasscom, Centrum Wealth Research Source: Nasscom, Centrum Wealth Research
Exhibit 11: India can capture one third of the total E&RD off-shoring opportunity
15.1 34.1 47.9
75.9
10
30
50
70
90
110
130
150
2013 2020E
$U
S b
n
India ROW
Source: Nasscom, Centrum Wealth Research

Tata Elxsi Ltd
Centrum Broking Ltd. 6
Centrum Wealth Research
B. Broadcasting & Communications (~55% of EPD revenue)
Broadcasting: The TV broadcasting industry has seen a rapid change along the value chain; there has been a transition
from analogous signals to digital then from standard definition to high definition and ultra-high definition. Further, the emergence of the video on demand, Over-the-top (OTT) content from internet has changed the dynamics of the broadcasting industry. If we take a look at our home today, we have various connected devices, Smart TV’s, phones, PC’s, laptops, landline which are connected via satellite, via cable or over IP for providing both content as well as data connectivity. The same is done within an ecosystem and TELX works with each member in the ecosystem.
The centre of the universe are Broadcast service providers or MSO’s which brings that broadband data or the content into the house via satellite/cable/IP, because the channels, the studios that create content have channels through the service providers, and the rest of the ecosystem supports the service providers, i.e. set top box suppliers, semiconductor chip vendors, middleware or conditional access vendors.
However, the emergence of OTT has disrupted the traditional broadcasting business affecting the entire value chain. It has created a new route into the home which bypasses the broadcast service providers to deliver content directly via the internet (like Hotstar). It will no longer involve any service provider (Tata sky, reliance digital, Videocon etc.) because the new route via internet has created a large market not only through pay TV’s concept but also through over the air and over the top content.
Thus, the market is evolving and TELX works with each member in the ecosystem. It works with the semiconductor vendors, with set top box companies to build those boxes & supply it to the suppliers and even with the Channels & Broadcasters providing OTT content. We believe, with the experience of more than 15 years, strong client base i.e. working with 2 Set top box companies of top 3 and working with top 3 MSO’s and an addressable market of $400 – 500 million ( presently TELX addresses 10% of the same), TELX has huge opportunity in the broadcasting segment.
Exhibit 12: Broadcasting – The ecosystem
Source: Company, Centrum Wealth Research
Communications: In communications, TELX has good hold in unified communications i.e. audio conferencing, video
conferencing, shared meetings etc., with the transition from hard devices on the table to applications in smart phones/laptops. Video conferencing does not need dedicated devices anymore; a camera on the laptop will help the same. TELX works with its clients for classical network infrastructure, the devices, the routers, switches, base stations etc. whether it is wired or wireless. Further, there has been cloud migration i.e. migration of physical products either partly or fully into the cloud, so the whole concept of the software-defined networks is the new area where TELX is working with its customers.
So, TELX does very specific things in communications, and the total addressable market of TELX is around ₹900/1000 crore and currently it has market share of 7-8% of the total addressable market, which again places TELX good opportunity to grow.
Tata Elxsi Ltd
Centrum Broking Ltd. 7
Centrum Wealth Research
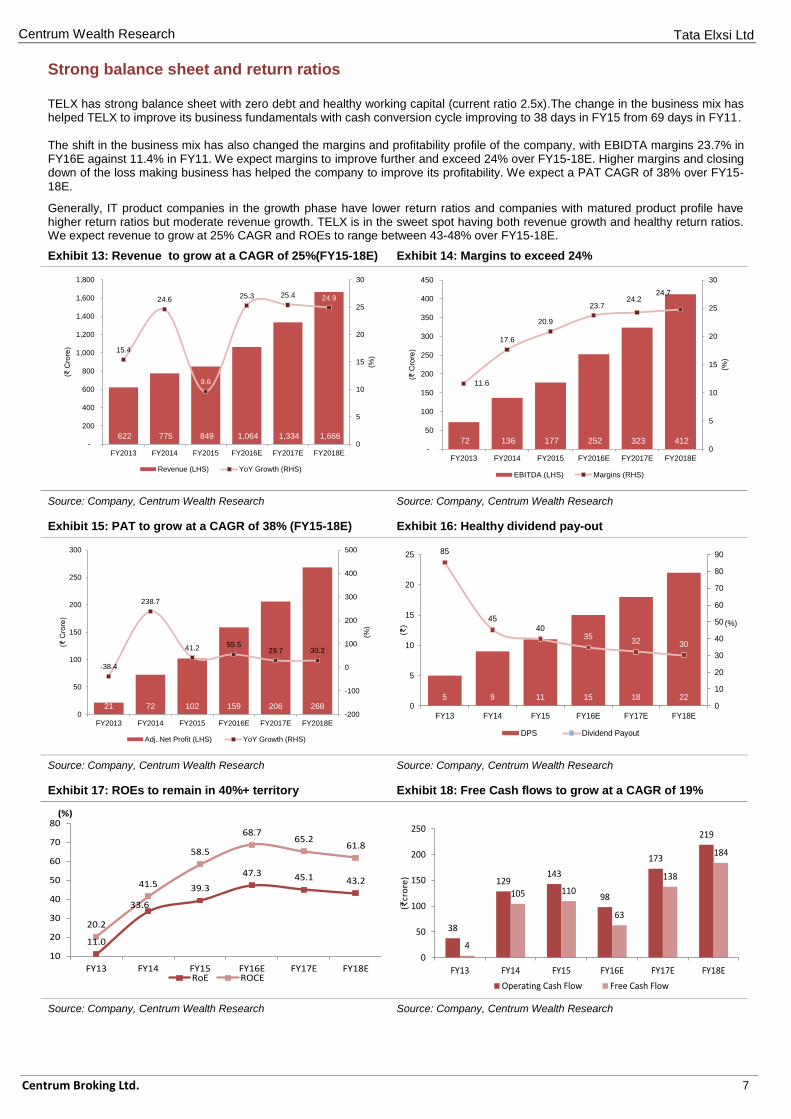
Strong balance sheet and return ratios TELX has strong balance sheet with zero debt and healthy working capital (current ratio 2.5x).The change in the business mix has helped TELX to improve its business fundamentals with cash conversion cycle improving to 38 days in FY15 from 69 days in FY11. The shift in the business mix has also changed the margins and profitability profile of the company, with EBIDTA margins 23.7% in FY16E against 11.4% in FY11. We expect margins to improve further and exceed 24% over FY15-18E. Higher margins and closing down of the loss making business has helped the company to improve its profitability. We expect a PAT CAGR of 38% over FY15-18E.
Generally, IT product companies in the growth phase have lower return ratios and companies with matured product profile have higher return ratios but moderate revenue growth. TELX is in the sweet spot having both revenue growth and healthy return ratios. We expect revenue to grow at 25% CAGR and ROEs to range between 43-48% over FY15-18E.
Exhibit 13: Revenue to grow at a CAGR of 25%(FY15-18E) Exhibit 14: Margins to exceed 24%
622 775 849 1,064 1,334 1,666
15.4
24.6
9.6
25.3 25.4 24.9
0
5
10
15
20
25
30
-
200
400
600
800
1,000
1,200
1,400
1,600
1,800
FY2013 FY2014 FY2015 FY2016E FY2017E FY2018E
(%)
(₹ C
rore
)
Revenue (LHS) YoY Growth (RHS)
72 136 177 252 323 412
11.6
17.6
20.9
23.724.2
24.7
0
5
10
15
20
25
30
-
50
100
150
200
250
300
350
400
450
FY2013 FY2014 FY2015 FY2016E FY2017E FY2018E
(%)
(₹ C
rore
)
EBITDA (LHS) Margins (RHS)
Source: Company, Centrum Wealth Research Source: Company, Centrum Wealth Research
Exhibit 15: PAT to grow at a CAGR of 38% (FY15-18E) Exhibit 16: Healthy dividend pay-out
21 72 102 159 206 268
-38.4
238.7
41.2 55.529.7 30.2
-200
-100
0
100
200
300
400
500
0
50
100
150
200
250
300
FY2013 FY2014 FY2015 FY2016E FY2017E FY2018E
(%)
(₹ C
rore
)
Adj. Net Profit (LHS) YoY Growth (RHS)
5 9 11 15 18 22
85
4540
3532 30
0
10
20
30
40
50
60
70
80
90
0
5
10
15
20
25
FY13 FY14 FY15 FY16E FY17E FY18E
(%)
(₹)
DPS Dividend Payout
Source: Company, Centrum Wealth Research Source: Company, Centrum Wealth Research
Exhibit 17: ROEs to remain in 40%+ territory Exhibit 18: Free Cash flows to grow at a CAGR of 19%
11.0
33.6
39.3
47.3 45.1 43.2
20.2
41.5
58.5
68.765.2
61.8
10
20
30
40
50
60
70
80
FY13 FY14 FY15 FY16E FY17E FY18E
(%)
RoE ROCE
38
129143
98
173
219
4
105 110
63
138
184
0
50
100
150
200
250
FY13 FY14 FY15 FY16E FY17E FY18E
(₹cr
ore
)
Operating Cash Flow Free Cash Flow
Source: Company, Centrum Wealth Research Source: Company, Centrum Wealth Research

Tata Elxsi Ltd
Centrum Broking Ltd. 8
Centrum Wealth Research
Exhibit 19: Quarterly Performance - Consolidated
Y/E Mar (₹ Cr.) Q3FY15 Q4FY15 Q1FY16 Q2FY16 Q3FY16
Revenue 221 231 244 264 274
YoY Growth % 10.7 9.3 27.7 28.1 23.7
Cost of Raw Material 19.3 23.2 17.1 17.3 14.2
% of sales 8.7 10.0 7.0 6.6 5.2
Personnel expenses 118 123 129 144 147
% of sales 53.1 53.2 53.0 54.5 53.8
Other Exp. 34 38 45 41 46
% of sales 15.5 16.2 18.5 15.7 16.8
EBIDTA 50.4 47.4 52.3 61.3 66.4
EBIDTA margin % 22.8 20.5 21.5 23.2 24.2
Depreciation 7.3 1.4 5.3 5.7 5.7
Interest - - - - -
Other Income 0.3 (0.1) 7.6 2.7 1.0
PBT 43.5 45.9 54.6 58.3 61.6
Provision for tax 15.7 15.6 18.9 20.2 21.7
Effective tax rate % 32.8 36.2 34.0 34.6 34.7
Net Profit 27.8 30.3 35.7 38.1 39.9
YoY Growth % 20.1 28.2 40.8 71.7 60.6
PAT margin % 12.5 13.1 14.7 14.5 14.6
Source: Company, Centrum Wealth Research
Risks Project driven business: The business is project driven, so there can be fluctuations in the orders which can impact revenues
and margins in particular quarter.
Any significant slowdown in sales of top 5 products.
Slower growth in Auto & Broadcast industry: Slower than expected growth in innovation within auto and broadcast sectors
Any strong currency fluctuation: Any sharp appreciation of INR against the USD and Euro will impact revenue as US and
Europe contributes ~75% of the revenue.
Tata Elxsi Ltd
Centrum Broking Ltd. 9
Centrum Wealth Research
Valuation
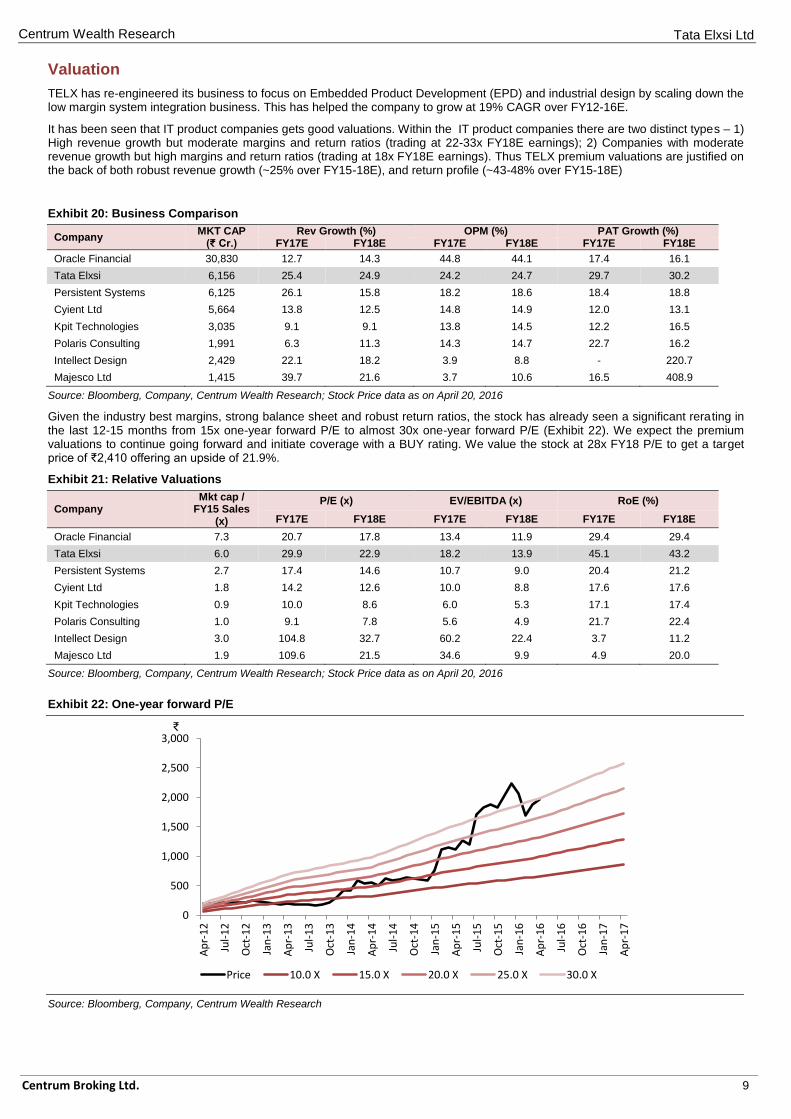
TELX has re-engineered its business to focus on Embedded Product Development (EPD) and industrial design by scaling down the low margin system integration business. This has helped the company to grow at 19% CAGR over FY12-16E.
It has been seen that IT product companies gets good valuations. Within the IT product companies there are two distinct types – 1) High revenue growth but moderate margins and return ratios (trading at 22-33x FY18E earnings); 2) Companies with moderate revenue growth but high margins and return ratios (trading at 18x FY18E earnings). Thus TELX premium valuations are justified on the back of both robust revenue growth (~25% over FY15-18E), and return profile (~43-48% over FY15-18E)
Exhibit 20: Business Comparison
Company MKT CAP
(₹ Cr.) Rev Growth (%) OPM (%) PAT Growth (%)
FY17E FY18E FY17E FY18E FY17E FY18E
Oracle Financial 30,830 12.7 14.3 44.8 44.1 17.4 16.1
Tata Elxsi 6,156 25.4 24.9 24.2 24.7 29.7 30.2
Persistent Systems 6,125 26.1 15.8 18.2 18.6 18.4 18.8
Cyient Ltd 5,664 13.8 12.5 14.8 14.9 12.0 13.1
Kpit Technologies 3,035 9.1 9.1 13.8 14.5 12.2 16.5
Polaris Consulting 1,991 6.3 11.3 14.3 14.7 22.7 16.2
Intellect Design 2,429 22.1 18.2 3.9 8.8 - 220.7
Majesco Ltd 1,415 39.7 21.6 3.7 10.6 16.5 408.9
Source: Bloomberg, Company, Centrum Wealth Research; Stock Price data as on April 20, 2016
Given the industry best margins, strong balance sheet and robust return ratios, the stock has already seen a significant rerating in the last 12-15 months from 15x one-year forward P/E to almost 30x one-year forward P/E (Exhibit 22). We expect the premium valuations to continue going forward and initiate coverage with a BUY rating. We value the stock at 28x FY18 P/E to get a target price of ₹2,410 offering an upside of 21.9%.
Exhibit 21: Relative Valuations
Company Mkt cap /
FY15 Sales (x)
P/E (x) EV/EBITDA (x) RoE (%)
FY17E FY18E FY17E FY18E FY17E FY18E
Oracle Financial 7.3 20.7 17.8 13.4 11.9 29.4 29.4
Tata Elxsi 6.0 29.9 22.9 18.2 13.9 45.1 43.2
Persistent Systems 2.7 17.4 14.6 10.7 9.0 20.4 21.2
Cyient Ltd 1.8 14.2 12.6 10.0 8.8 17.6 17.6
Kpit Technologies 0.9 10.0 8.6 6.0 5.3 17.1 17.4
Polaris Consulting 1.0 9.1 7.8 5.6 4.9 21.7 22.4
Intellect Design 3.0 104.8 32.7 60.2 22.4 3.7 11.2
Majesco Ltd 1.9 109.6 21.5 34.6 9.9 4.9 20.0
Source: Bloomberg, Company, Centrum Wealth Research; Stock Price data as on April 20, 2016
Exhibit 22: One-year forward P/E
0
500
1,000
1,500
2,000
2,500
3,000
Ap
r-1
2
Jul-
12
Oct
-12
Jan
-13
Ap
r-1
3
Jul-
13
Oct
-13
Jan
-14
Ap
r-1
4
Jul-
14
Oct
-14
Jan
-15
Ap
r-1
5
Jul-
15
Oct
-15
Jan
-16
Ap
r-1
6
Jul-
16
Oct
-16
Jan
-17
Ap
r-1
7
₹
Price 10.0 X 15.0 X 20.0 X 25.0 X 30.0 X
Source: Bloomberg, Company, Centrum Wealth Research

Tata Elxsi Ltd
Centrum Broking Ltd. 10
Centrum Wealth Research
Technical view on Tata Elxsi Ltd
Tata Elxsi is trading closer to its support range of 1900-1820 from where it is likely to gain demand as it is also where its 55 Week MA is currently placed at.
The overall structure is also suggesting trend-line support near the level.
Buying is recommended in case of dips towards the same for a 4 month target of 2250 while long positions should be guarded with a stop loss below 1775.
Exhibit 23: Technical Chart
Source: Company, Centrum Wealth Research
Tata Elxsi Ltd
Centrum Broking Ltd. 11
Centrum Wealth Research
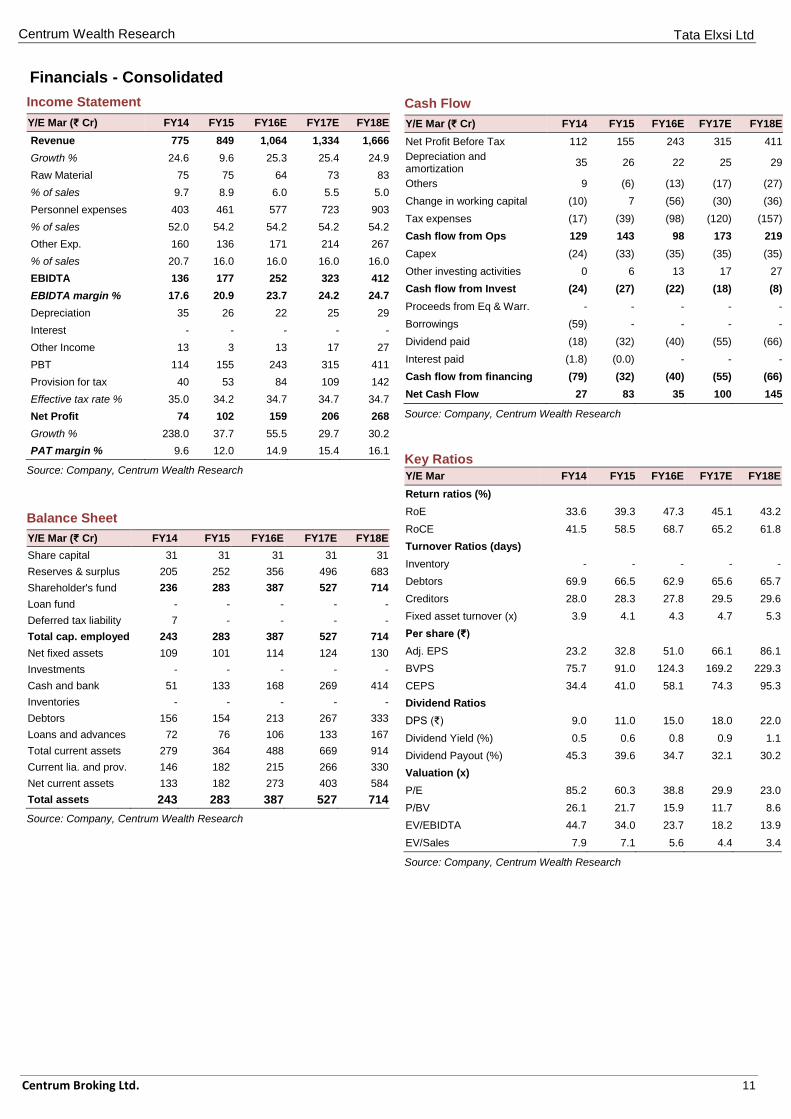
Financials - Consolidated
Income Statement
Y/E Mar (₹ Cr) FY14 FY15 FY16E FY17E FY18E
Revenue 775 849 1,064 1,334 1,666
Growth % 24.6 9.6 25.3 25.4 24.9
Raw Material 75 75 64 73 83
% of sales 9.7 8.9 6.0 5.5 5.0
Personnel expenses 403 461 577 723 903
% of sales 52.0 54.2 54.2 54.2 54.2
Other Exp. 160 136 171 214 267
% of sales 20.7 16.0 16.0 16.0 16.0
EBIDTA 136 177 252 323 412
EBIDTA margin % 17.6 20.9 23.7 24.2 24.7
Depreciation 35 26 22 25 29
Interest - - - - -
Other Income 13 3 13 17 27
PBT 114 155 243 315 411
Provision for tax 40 53 84 109 142
Effective tax rate % 35.0 34.2 34.7 34.7 34.7
Net Profit 74 102 159 206 268
Growth % 238.0 37.7 55.5 29.7 30.2
PAT margin % 9.6 12.0 14.9 15.4 16.1
Source: Company, Centrum Wealth Research
Balance Sheet
Y/E Mar (₹ Cr) FY14 FY15 FY16E FY17E FY18E
Share capital 31 31 31 31 31
Reserves & surplus 205 252 356 496 683
Shareholder's fund 236 283 387 527 714
Loan fund - - - - -
Deferred tax liability 7 - - - -
Total cap. employed 243 283 387 527 714
Net fixed assets 109 101 114 124 130
Investments - - - - -
Cash and bank 51 133 168 269 414
Inventories - - - - -
Debtors 156 154 213 267 333
Loans and advances 72 76 106 133 167
Total current assets 279 364 488 669 914
Current lia. and prov. 146 182 215 266 330
Net current assets 133 182 273 403 584
Total assets 243 283 387 527 714
Source: Company, Centrum Wealth Research
Cash Flow
Y/E Mar (₹ Cr) FY14 FY15 FY16E FY17E FY18E
Net Profit Before Tax 112 155 243 315 411
Depreciation and amortization
35 26 22 25 29
Others 9 (6) (13) (17) (27)
Change in working capital (10) 7 (56) (30) (36)
Tax expenses (17) (39) (98) (120) (157)
Cash flow from Ops 129 143 98 173 219
Capex (24) (33) (35) (35) (35)
Other investing activities 0 6 13 17 27
Cash flow from Invest (24) (27) (22) (18) (8)
Proceeds from Eq & Warr. - - - - -
Borrowings (59) - - - -
Dividend paid (18) (32) (40) (55) (66)
Interest paid (1.8) (0.0) - - -
Cash flow from financing (79) (32) (40) (55) (66)
Net Cash Flow 27 83 35 100 145
Source: Company, Centrum Wealth Research
Key Ratios
Y/E Mar FY14 FY15 FY16E FY17E FY18E
Return ratios (%)
RoE 33.6 39.3 47.3 45.1 43.2
RoCE 41.5 58.5 68.7 65.2 61.8
Turnover Ratios (days)
Inventory - - - - -
Debtors 69.9 66.5 62.9 65.6 65.7
Creditors 28.0 28.3 27.8 29.5 29.6
Fixed asset turnover (x) 3.9 4.1 4.3 4.7 5.3
Per share (₹)
Adj. EPS 23.2 32.8 51.0 66.1 86.1
BVPS 75.7 91.0 124.3 169.2 229.3
CEPS 34.4 41.0 58.1 74.3 95.3
Dividend Ratios
DPS (₹) 9.0 11.0 15.0 18.0 22.0
Dividend Yield (%) 0.5 0.6 0.8 0.9 1.1
Dividend Payout (%) 45.3 39.6 34.7 32.1 30.2
Valuation (x)
P/E 85.2 60.3 38.8 29.9 23.0
P/BV 26.1 21.7 15.9 11.7 8.6
EV/EBIDTA 44.7 34.0 23.7 18.2 13.9
EV/Sales 7.9 7.1 5.6 4.4 3.4
Source: Company, Centrum Wealth Research

Tata Elxsi Ltd
Centrum Broking Ltd. 12
Centrum Wealth Research
Appendix
Disclaimer Centrum Broking Limited (“CBL”) is a full-service, Stock Broking Company and a member of The Stock Exchange, Mumbai (BSE), National Stock Exchange of India Ltd. (NSE) and MCX-SX Stock Exchange Limited (MCX-SX). One of our group companies, Centrum Capital Ltd is an investment banker and an underwriter of securities. As a group Centrum has Investment Banking, Advisory and other business relationships with a significant percentage of the companies covered by our Research Group. Our research professionals provide important inputs into the Group's Investment Banking and other business selection processes.
Recipients of this report should assume that our Group is seeking or may seek or will seek Investment Banking, advisory, project finance or other businesses and may receive commission, brokerage, fees or other compensation from the company or companies that are the subject of this material/report. Our Company and Group companies and their officers, directors and employees, including the analysts and others involved in the preparation or issuance of this material and their dependants, may on the date of this report or from, time to time have "long" or "short" positions in, act as principal in, and buy or sell the securities or derivatives thereof of companies mentioned herein. CBLor its affiliates do not own 1% or more in the equity of this company Our sales people, dealers, traders and other professionals may provide oral or written market commentary or trading strategies to our clients that reflect opinions that are contrary to the opinions expressed herein, and our proprietary trading and investing businesses may make investment decisions that are inconsistent with the recommendations expressed herein. We may have earlier issued or may issue in future reports on the companies covered herein with recommendations/ information inconsistent or different those made in this report. In reviewing this document, you should be aware that any or all of the foregoing, among other things, may give rise to or potential conflicts of interest. We and our Group may rely on information barriers, such as "Chinese Walls" to control the flow of information contained in one or more areas within us, or other areas, units, groups or affiliates of CBL. CBL and its affiliates do not make a market in the security of the company for which this report or any report was written. Further, CBL or its affiliates did not make a market in the subject company’s securities at the time that the research report was published.
This report is for information purposes only and this document/material should not be construed as an offer to sell or the solicitation of an offer to buy, purchase or subscribe to any securities, and neither this document nor anything contained herein shall form the basis of or be relied upon in connection with any contract or commitment whatsoever. This document does not solicit any action based on the material contained herein. It is for the general information of the clients of CBL. Though disseminated to clients simultaneously, not all clients may receive this report at the same time. Centrum will not treat recipients as clients by virtue of their receiving this report. It does not constitute a personal recommendation or take into account the particular investment objectives, financial situations, or needs of individual clients. Similarly, this document does not have regard to the specific investment objectives, financial situation/circumstances and the particular needs of any specific person who may receive this document. The securities discussed in this report may not be suitable for all investors. The securities described herein may not be eligible for sale in all jurisdictions or to all categories of investors. The countries in which the companies mentioned in this report are organized may have restrictions on investments, voting rights or dealings in securities by nationals of other countries. The appropriateness of a particular investment or strategy will depend on an investor's individual circumstances and objectives. Persons who may receive this document should consider and independently evaluate whether it is suitable for his/ her/their particular circumstances and, if necessary, seek professional/financial advice. Any such person shall be responsible for conducting his/her/their own investigation and analysis of the information contained or referred to in this document and of evaluating the merits and risks involved in the securities forming the subject matter of this document.
The projections and forecasts described in this report were based upon a number of estimates and assumptions and are inherently subject to significant uncertainties and contingencies. Projections and forecasts are necessarily speculative in nature, and it can be expected that one or more of the estimates on which the projections and forecasts were based will not materialize or will vary significantly from actual results, and such variances will likely increase over time. All projections and forecasts described in this report have been prepared solely by the authors of this report independently of the Company. These projections and forecasts were not prepared with a view toward compliance with published guidelines or generally accepted accounting principles. No independent accountants have expressed an opinion or any other form of assurance on these projections or forecasts. You should not regard the inclusion of the projections and forecasts described herein as a representation or warranty by or on behalf of the Company, CBL, Centrum group, the authors of this report or any other person that these projections or forecasts or their underlying assumptions will be achieved. For these reasons, you should only consider the projections and forecasts described in this report after carefully evaluating all of the information in this report, including the assumptions underlying such projections and forecasts.
The price and value of the investments referred to in this document/material and the income from them may go down as well as up, and investors may realize losses on any investments. Past performance is not a guide for future performance. Future returns are not guaranteed and a loss of original capital may occur. Actual results may differ materially from those set forth in projections. Forward-looking statements are not predictions and may be subject to change without notice. We do not provide tax advice to our clients, and all investors are strongly advised to consult regarding any potential investment. CBL and its affiliates accept no liabilities for any loss or damage of any kind arising out of the use of this report. Foreign currencies denominated securities are subject to fluctuations in exchange rates that could have an adverse effect on the value or price of or income derived from the investment. In addition, investors in securities such as ADRs, the value of which are influenced by foreign currencies effectively assume currency risk. Certain transactions including those involving futures, options, and other derivatives as well as non-investment-grade securities give rise to substantial risk and are not suitable for all investors. Please ensure that you have read and understood the current risk disclosure documents before entering into any derivative transactions.
This report/document has been prepared by CBL, based upon information available to the public and sources, believed to be reliable. No representation or warranty, express or implied is made that it is accurate or complete. CBL has reviewed the report and, in so far as it includes current or historical information, it is believed to be reliable, although its accuracy and completeness cannot be guaranteed. The opinions expressed in this document/material are subject to change without notice and have no obligation to tell you when opinions or information in this report change.
This report or recommendations or information contained herein do/does not constitute or purport to constitute investment advice in publicly accessible media and should not be reproduced, transmitted or published by the recipient. The report is for the use and consumption of the recipient only. This publication may not be distributed to the public used by the public media without the express written consent of CBL. This report or any portion hereof may not be printed, sold or distributed without the written consent of CBL.
The distribution of this document in other jurisdictions may be restricted by law, and persons into whose possession this document comes should inform themselves about, and observe, any such restrictions. Neither CBL nor its directors, employees, agents or representatives shall be liable for any damages whether direct or indirect, incidental, special or consequential including lost revenue or lost profits that may arise from or in connection with the use of the information.
This document does not constitute an offer or invitation to subscribe for or purchase or deal in any securities and neither this document nor anything contained herein shall form the basis of any contract or commitment whatsoever. This document is strictly confidential and is being furnished to you solely for your information, may not be distributed to the press or other media and may not be reproduced or redistributed to any other person. The distribution of this report in other jurisdictions may be restricted by law and persons into whose possession this report comes should inform themselves about, and observe any such restrictions. By accepting this report, you agree to be bound by the fore going limitations. No representation is made that this report is accurate or complete.
The opinions and projections expressed herein are entirely those of the author and are given as part of the normal research activity of CBL and are given as of this date and are subject to change without notice. Any opinion estimate or projection herein constitutes a view as of the date of this report and there can be no assurance that future results or events will be consistent with any such opinions, estimate or projection.
This document has not been prepared by or in conjunction with or on behalf of or at the instigation of, or by arrangement with the company or any of its directors or any other person. Information in this document must not be relied upon as having been authorized or approved by the company or its directors or any other person. Any opinions and projections contained herein are entirely those of the authors. None of the company or its directors or any other person accepts any liability whatsoever for any loss arising from any use of this document or its contents or otherwise arising in connection therewith.
CBL and its affiliates have not managed or co-managed a public offering for the subject company in the preceding twelve months. CBL and affiliates have not received compensation from the companies mentioned in the report during the period preceding twelve months from the date of this report for service in respect of public offerings, corporate finance, debt restructuring, investment banking or other advisory services in a merger/acquisition or some other sort of specific transaction.
As per the declarations given by his/her, research analyst and the author of this report and/or any of his/her family members do not serve as an officer, director or any way connected to the company/companies mentioned in this report. Further, as declared by his/her, he/she has not received any compensation from the above companies in the preceding twelve months. Our entire research professionals are our employees and are paid a salary. They do not have any other material conflict of interest of the research analyst or member of which the research analyst knows of has reason to know at the time of publication of the research report or at the time of the public appearance.
While we would endeavor to update the information herein on a reasonable basis, CBL, its associated companies, their directors and employees are under no obligation to update or keep the information current. Also, there may be regulatory, compliance or other reasons that may prevent Centrum from doing so.
Non-rated securities indicate that rating on a particular security has been suspended temporarily and such suspension is in compliance with applicable regulations and/or Centrum policies, in circumstances where CBL is acting in an advisory capacity to this company, or any certain other circumstances.
This report is not directed to or intended for distribution to or use by, any person or entity who is a citizen or resident of or located in any locality, state, country or other jurisdiction where such distribution, publication, availability or use would be contrary to law or regulation or which would subject Centrum Broking Limited or its group companies to any registration or licensing requirement within such jurisdiction. Specifically, this document does not constitute an offer to or solicitation to any U.S. person for the purchase or sale of any financial instrument or as an official confirmation of any transaction to any U.S. person unless otherwise stated, this message should not be construed as official confirmation of any transaction. No part of this document may be distributed in Canada or used by private customers in United Kingdom.
The information contained herein is not intended for publication or distribution or circulation in any manner whatsoever and any unauthorized reading, dissemination, distribution or copying of this communication is prohibited unless otherwise expressly authorized. Please ensure that you have read “Risk Disclosure Document for Capital Market and Derivatives Segments” as prescribed by Securities and Exchange Board of India before investing in Indian Securities Market.

Tata Elxsi Ltd
Centrum Broking Ltd. 13
Centrum Wealth Research
Disclosures under the SEBI (Research Analysts) Regulations 2014
Disclosure of Interest Statement
1 Business activities of Centrum Broking Limited (CBL)
Centrum Broking Limited (hereinafter referred to as “CBL”) is a registered member of NSE
(Cash, F&O and Currency Derivatives Segments), MCX-SX (Currency Derivatives Segment) and
BSE (Cash segment), Depository Participant of CDSL and a SEBI registered Portfolio Manager.
2 Details of Disciplinary History of CBL CBL has not been debarred/ suspended by SEBI or any other regulatory authority from accessing /dealing in securities market.
3 Registration status of CBL CBL is registered with SEBI as a Research Analyst (SEBI Registration No. INH000001469)
4 Whether Research analysts or relatives’ have any financial interest in the subject
company and nature of such financial interest No
5 Whether Research analysts or relatives have actual / beneficial ownership of 1% or
more in securities of the subject company at the end of the month immediately
preceding the date of publication of the document.
No
6 Whether the research analysts or his relatives has any other material conflict of
interest No
7 Whether research analysts have received any compensation from the subject
company in the past 12 months and nature of products / services for which such
compensation is received
No
8
Whether the Research Analysts have received any compensation or any other
benefits from the subject company or third party in connection with the research
report
No
9 Whether Research Analysts has served as an officer, director or employee of the
subject company No
10 Whether the Research Analysts has been engaged in market making activity of the
subject company. No
Member (and BSE)
Regn No.: CAPITAL MARKET SEBI REGN. NO.: BSE: INB011454239 CAPITAL MARKET SEBI REGN. NO.: NSE: INB231454233
DERIVATIVES SEBI REGN. NO.: NSE: INF231454233 (TRADING & CLEARING MEMBER)
CURRENCY DERIVATIVES: MCX-SX INE261454230 CURRENCY DERIVATIVES:NSE (TM & SCM) – NSE 231454233
Depository Participant (DP) CDSL DP ID: 120 – 12200
SEBI REGD NO. : CDSL : IN-DP-CDSL-661-2012
PORTFOLIO MANAGER
SEBI REGN NO.: INP000004383
Website: www.centrum.co.in Investor Grievance Email ID: [email protected]
Compliance Officer Details:
Kavita Ravichandran (022) 4215 9842; Email ID: [email protected]
Centrum Broking Ltd. (CIN: U67120MH1994PLC078125)
REGD. OFFICE Address Bombay Mutual Bldg.,
2nd Floor, Dr. D.N. Road,
Fort, Mumbai - 400 001
Corporate Office & Correspondence Address Centrum House
6th Floor, CST Road, Near Vidya Nagari Marg,
Kalina, Santacruz (E) Mumbai 400 098.
Tel: (022) 4215 9000 Fax: +91 22 4215 9344