tastes, trends, touch points - understanding shoppers through machine learning
TRANSCRIPT
Tastes, Trends, Touch Points - Understanding
Shoppers Through Machine Learning
ShiSh Shridhar (@5h15h)Director, Retail Analytics
Microsoft Corp
Su Doyle (@sudoyle)RFID Applications Director
Checkpoint Systems

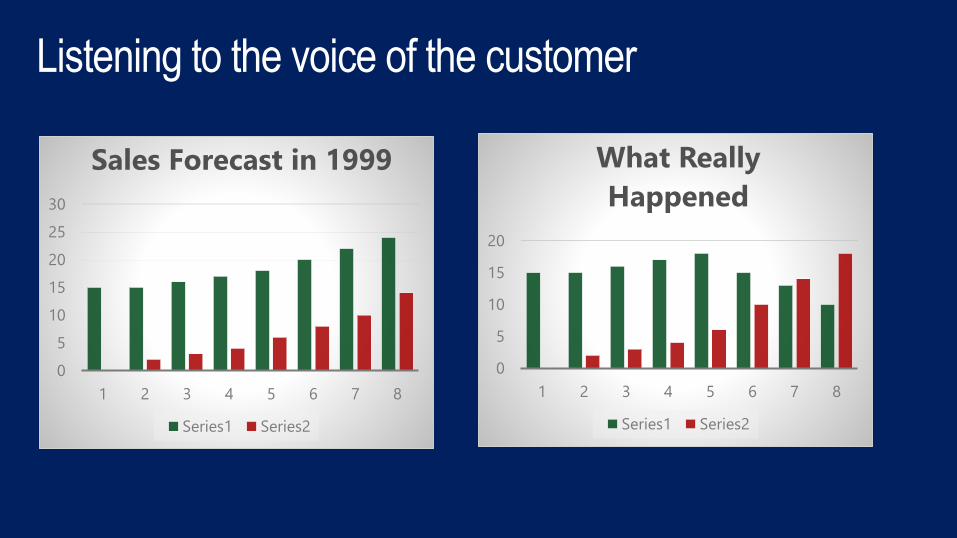
Listening to the voice of the customer
0
5
10
15
20
25
30
1 2 3 4 5 6 7 8
Sales Forecast in 1999
Series1 Series2
0
5
10
15
20
1 2 3 4 5 6 7 8
What Really
Happened
Series1 Series2
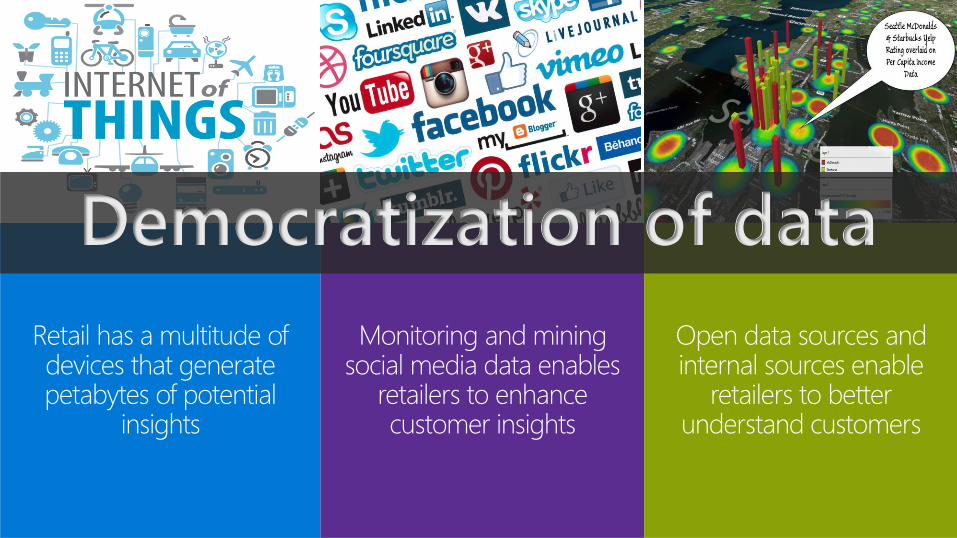
Retail has a multitude of devices that generate petabytes of potential
insights
Monitoring and mining social media data enables
retailers to enhance customer insights
Open data sources and internal sources enable
retailers to better understand customers
Democratization of data
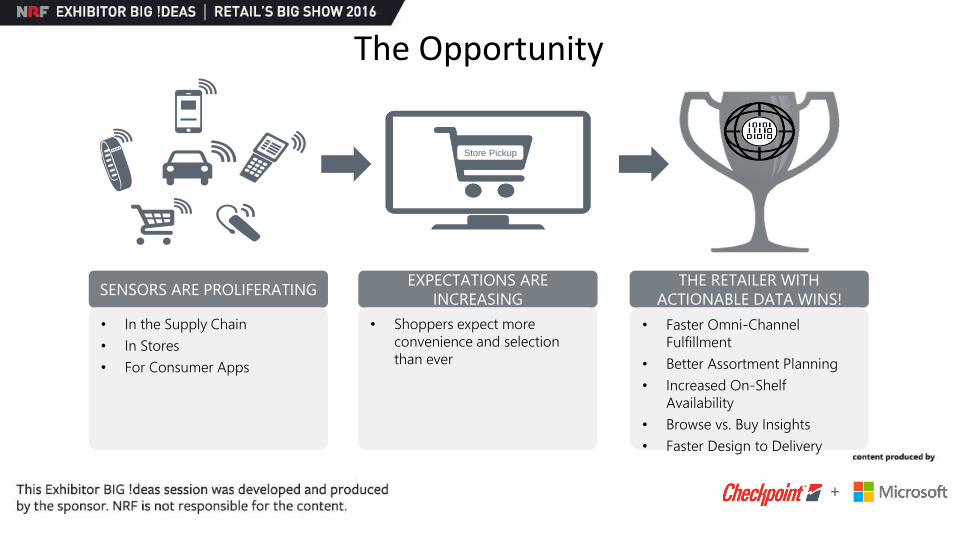
The Opportunity
+
SENSORS ARE PROLIFERATINGEXPECTATIONS ARE
INCREASING
THE RETAILER WITH
ACTIONABLE DATA WINS!
• In the Supply Chain
• In Stores
• For Consumer Apps
• Shoppers expect more
convenience and selection
than ever
• Faster Omni-Channel
Fulfillment
• Better Assortment Planning
• Increased On-Shelf
Availability
• Browse vs. Buy Insights
• Faster Design to Delivery
Store Pickup
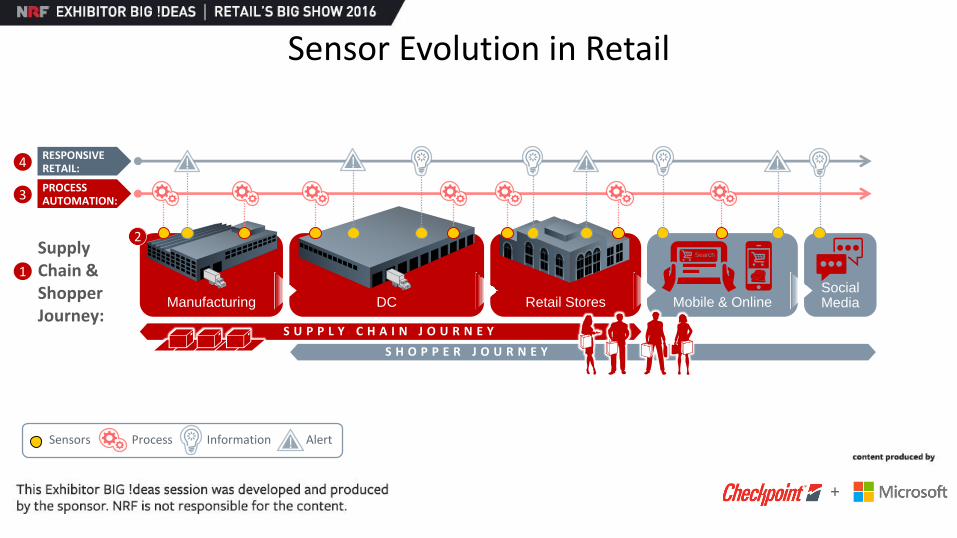
Sensor Evolution in Retail
+
Manufacturing Retail StoresDC
Supply Chain & ShopperJourney:
PROCESSAUTOMATION:
RESPONSIVERETAIL:
1
3
4
2
Mobile & OnlineSocial Media
Search
S U P P L Y C H A I N J O U R N E Y
S H O P P E R J O U R N E Y
!Sensors Process Information Alert
! !! !

Sensors & The Shopper Journey
+
1
2
3
4
5
6
7
8:0
0A
M
Friend shares photo
w/ link on Social
Media
“…Jenny,
I think these
are ur shoes
4 the big
event!”
9:1
5A
M
Jenny searches a local store online to see
if they have the shoes in her size – they
do! Jenny Reserves the Shoes to Try On In
Store after 4pm that Day.
• RFID-Enabled Inventory
Mgmt.
Search in Store
10
:45
AM
Store Associate Receives
Jenny’s Request, Locates
Shoes and Sets them Aside. The
shoes are a new style, so the store
associate receives an alert on her
phone to put a pair
on display.• RFID Pick – Pack
–Reserve
• RFID Display
Compliance
5:2
0P
M
Jenny Checks In at the
Store with her Loyalty
App. Her favorite jeans
are on sale -- and her
size
is in stock!
• Beacons
integrated with
Loyalty Apps
• RFID-Enabled
Inventory Mgmt.
Recommendations
Jenny tries on the jeans with the new
shoes and gets recommendations
on other items (in stock
at the store) to go
with the outfit.
• RFID Magic Mirror
• RFID-Enabled
Loyalty Apps
• RFID-Enabled
Inventory Mgmt.
Jenny purchases the shoes, jeans,
a new top and a bag to go with the outfit.
RFID at the point of
sale – mobile or checkout counter makes
processing the sale much faster and
automatically decrements inventory and
connects Jenny’s purchase to
her browsing & buying behavior.
• RFID-Enabled
POS
The retailer is able to connect the dots between
what Jenny browsed and purchased across
channels and what sorts of promotional offers she
responded to.
Building personas like Jenny helps retailers predict
which products, services and merchandise locations
shoppers are most likely to respond to.
• Sensor-based Analytics
• Machine Learning
40%Off
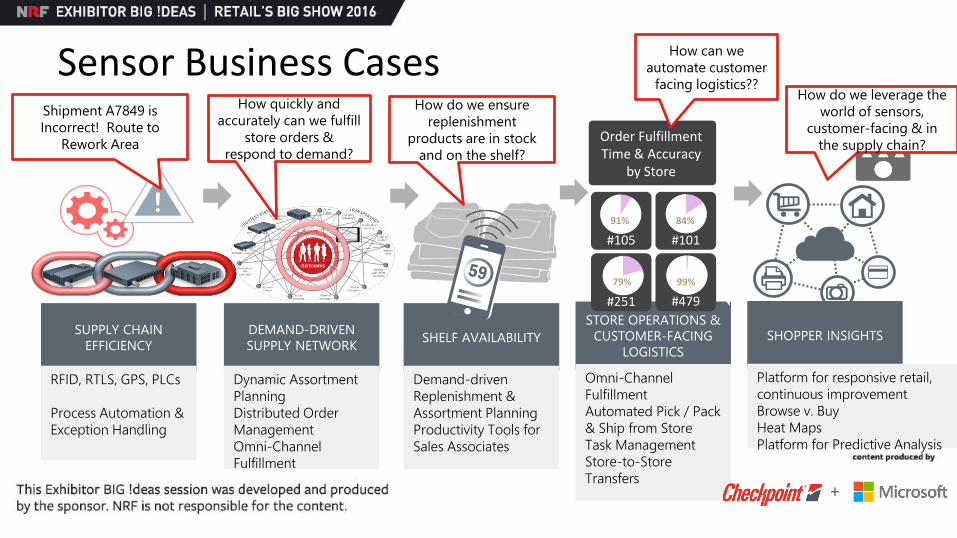
Sensor Business Cases
SUPPLY CHAIN
EFFICIENCY
DEMAND-DRIVEN
SUPPLY NETWORKSHELF AVAILABILITY
RFID, RTLS, GPS, PLCs
Process Automation &
Exception Handling
Dynamic Assortment
Planning
Distributed Order
Management
Omni-Channel
Fulfillment
Demand-driven
Replenishment &
Assortment Planning
Productivity Tools for
Sales Associates
STORE OPERATIONS &
CUSTOMER-FACING
LOGISTICS
Omni-Channel
Fulfillment
Automated Pick / Pack
& Ship from Store
Task Management
Store-to-Store
Transfers
SHOPPER INSIGHTS
Platform for responsive retail,
continuous improvement
Browse v. Buy
Heat Maps
Platform for Predictive Analysis
!
#105
Order Fulfillment Time & Accuracy
by Store
#101
#251 #479
91% 84%
99%79%
Shipment A7849 is
Incorrect! Route to
Rework Area
How quickly and
accurately can we fulfill
store orders &
respond to demand?
How do we ensure
replenishment
products are in stock
and on the shelf?
How do we leverage the
world of sensors,
customer-facing & in
the supply chain?
How can we
automate customer
facing logistics??
+
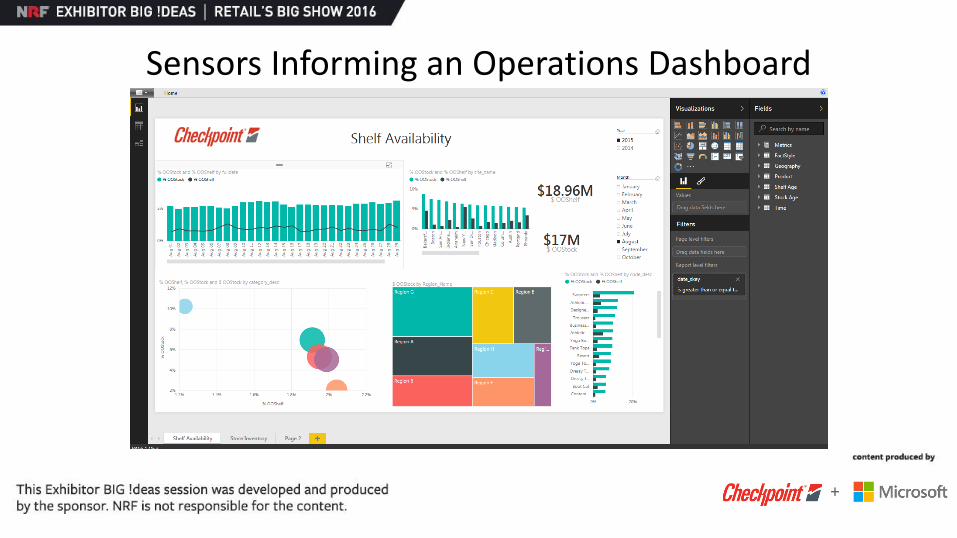
Sensors Informing an Operations Dashboard
+

Imagine if…
Imagine a seamless, personalized experience for
your customers, in stores and online. Imagine
understanding your customer’s needs and
supplying the right products at the right time.
Imagine sales associates spending more time with
customers, providing personalized assistance and
incentives, and increasing sales.
Imagine anticipating demand and effectively
scheduling staff. Imagine optimizing operations,
reducing waste, and enabling your employees to
make better decisions.
10

What product or
service to
recommend to Joe ?

Will Sarah come
back with us next
month?

What targeted incentive to
retain your customers?


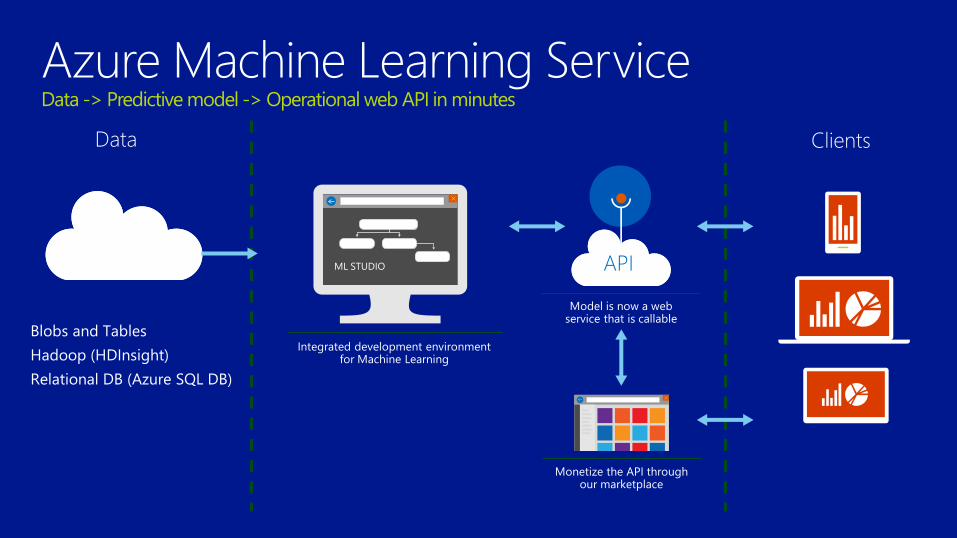
APIML STUDIO
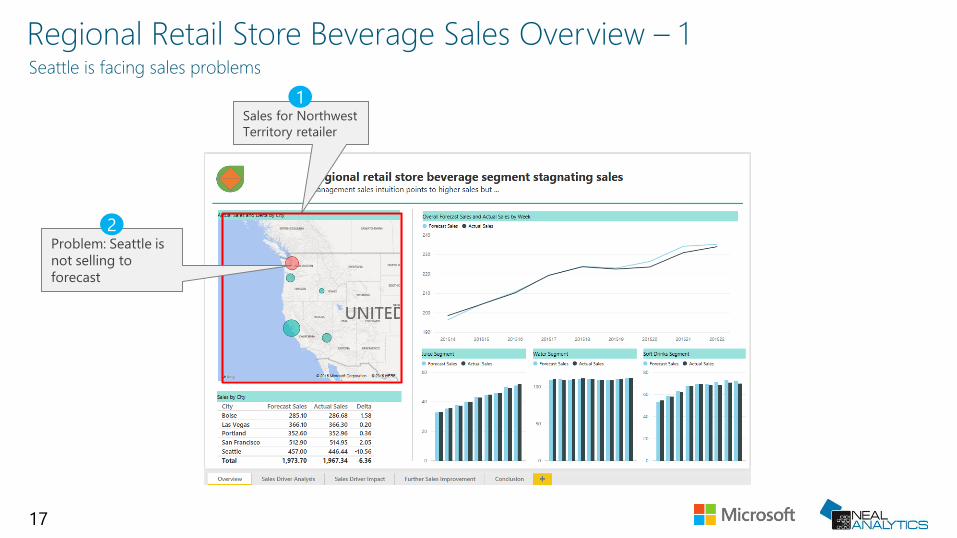
17
Sales for Northwest
Territory retailer
Problem: Seattle is
not selling to
forecast
1
2
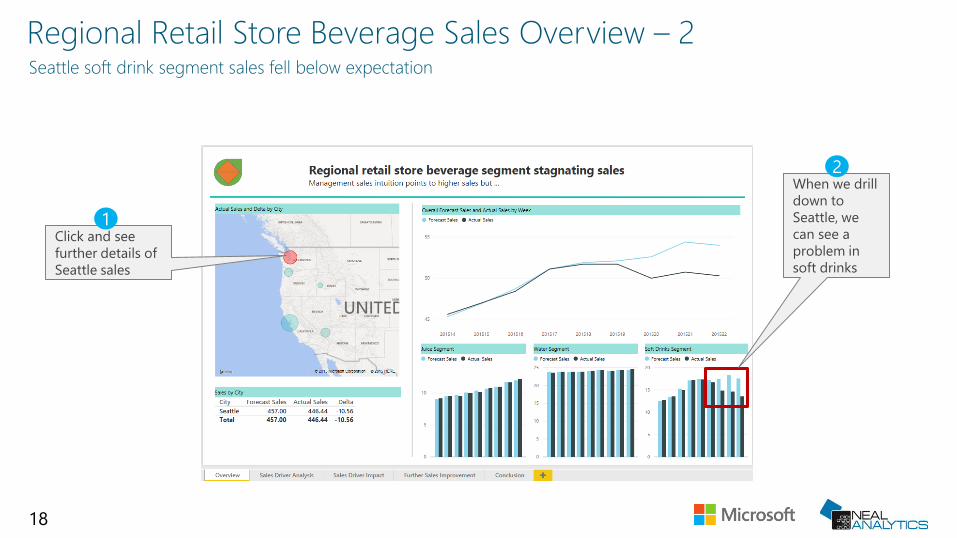
18
When we drill
down to
Seattle, we
can see a
problem in
soft drinks
Click and see
further details of
Seattle sales
1
2
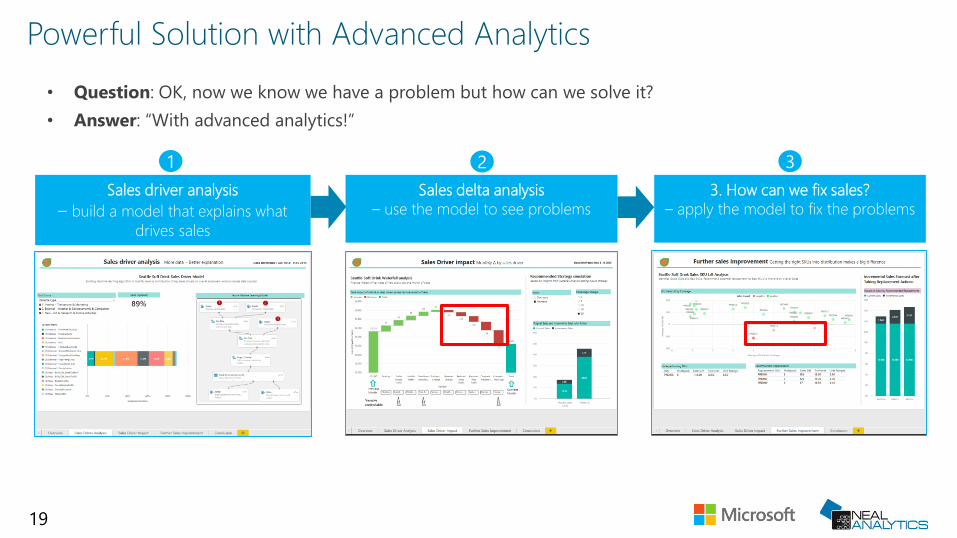
19
Sales driver analysis
– build a model that explains what
drives sales
Sales delta analysis
– use the model to see problems
3. How can we fix sales?
– apply the model to fix the problems
21 3
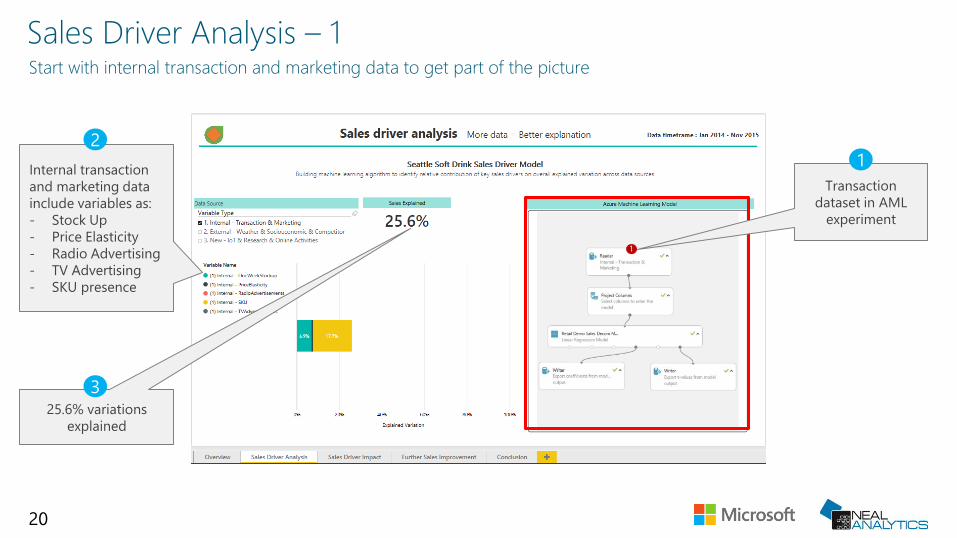
20
25.6% variations
explained
Internal transaction
and marketing data
include variables as:
- Stock Up
- Price Elasticity
- Radio Advertising
- TV Advertising
- SKU presence
Transaction
dataset in AML
experiment
12
3
21
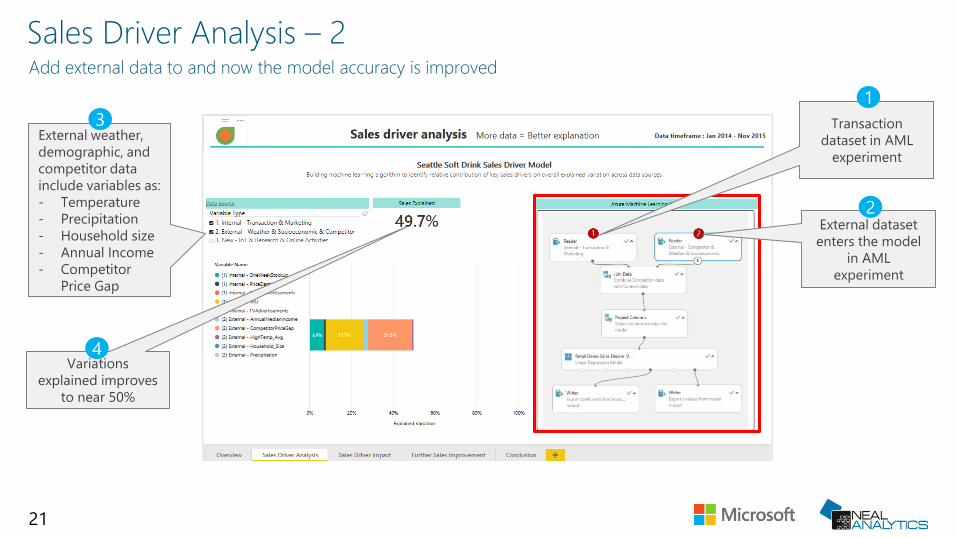
Variations
explained improves
to near 50%
External weather,
demographic, and
competitor data
include variables as:
- Temperature
- Precipitation
- Household size
- Annual Income
- Competitor
Price Gap
Transaction
dataset in AML
experiment
External dataset
enters the model
in AML
experiment
2
1
3
4

22
IoT dataset enters
the model in AML
experiment
Variations
explained improves
to 89%
New IoT, research
and online activity
data include
variables as:
- Survey research
- Web traffic
- Social media
traffic
- Mobile traffic
- Store traffic
- Shelf traffic
Transaction
dataset in AML
experiment
External dataset
enters the model
in AML
experiment
2
4
1
35
23
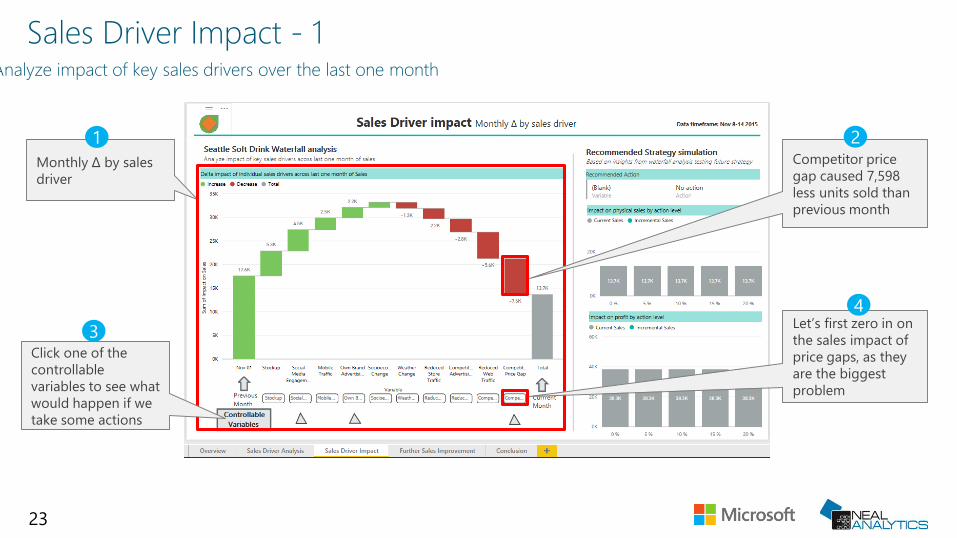
Monthly ∆ by sales
driver
Let’s first zero in on
the sales impact of
price gaps, as they
are the biggest
problem
Competitor price
gap caused 7,598
less units sold than
previous month
Click one of the
controllable
variables to see what
would happen if we
take some actions
21
3
4
24
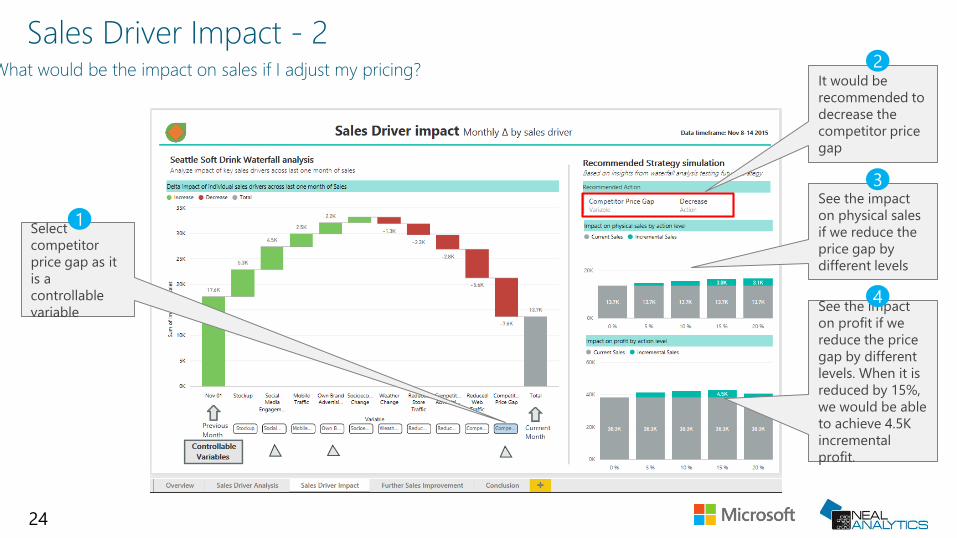
See the impact
on physical sales
if we reduce the
price gap by
different levels
See the impact
on profit if we
reduce the price
gap by different
levels. When it is
reduced by 15%,
we would be able
to achieve 4.5K
incremental
profit.
Select
competitor
price gap as it
is a
controllable
variable
It would be
recommended to
decrease the
competitor price
gap
2
1
3
4

25
See the impact on
physical sales if we
increase social
media
engagement by
different levels
See the impact on
profit if we
increase social
media
engagement by
different levels.
When it is
increased by 20%,
we would be able
to achieve 12.6K
incremental profit.
Select Social Media
Engagement as it is
a controllable
variable
It would be
recommended to
increase social
media
engagement
2
1
3
4

26
See the impact on
physical sales if we
increase
advertising by
different levels
See the impact on
profit if we
increase
advertising by
different levels.
When it is
increased by 20%,
we would be able
to achieve 7.1K
incremental profit.
Select Own Brand
Advertising as it is a
controllable variable
It would be
recommended to
increase our own
brand advertising
2
1
3
4
27
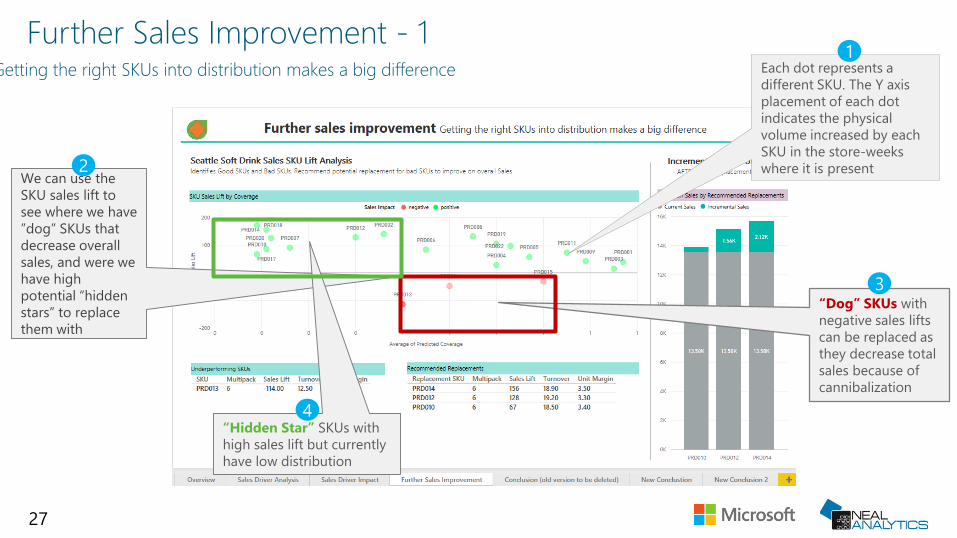
We can use the
SKU sales lift to
see where we have
”dog” SKUs that
decrease overall
sales, and were we
have high
potential “hidden
stars” to replace
them with
“Dog” SKUs with
negative sales lifts
can be replaced as
they decrease total
sales because of
cannibalization
“Hidden Star” SKUs with
high sales lift but currently
have low distribution
Each dot represents a
different SKU. The Y axis
placement of each dot
indicates the physical
volume increased by each
SKU in the store-weeks
where it is present2
1
3
4
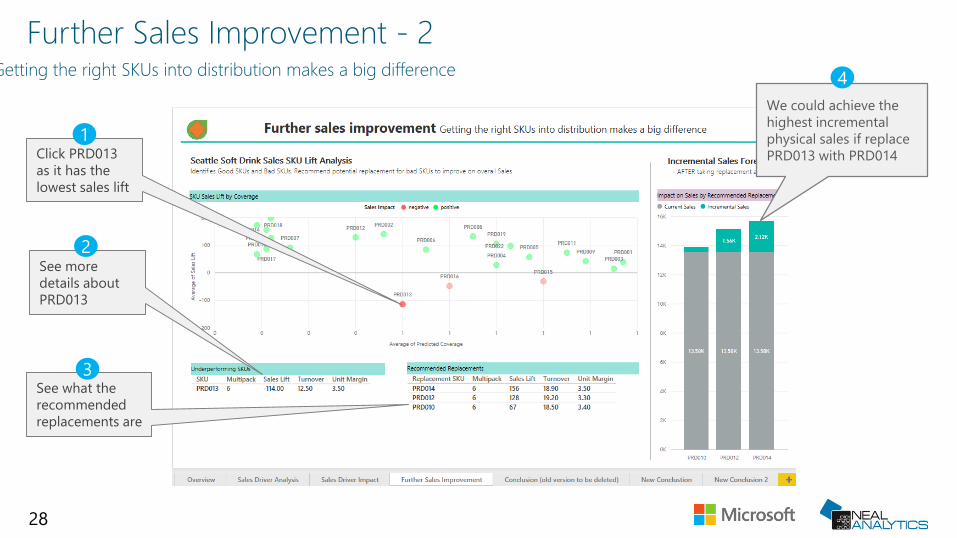
28
Click PRD013
as it has the
lowest sales lift
We could achieve the
highest incremental
physical sales if replace
PRD013 with PRD014
See more
details about
PRD013
See what the
recommended
replacements are
2
1
3
4
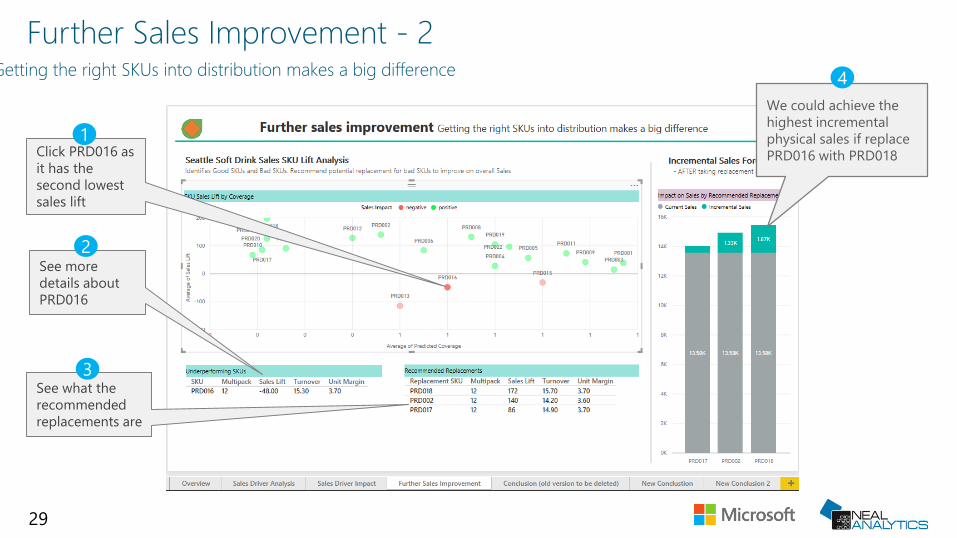
29
Click PRD016 as
it has the
second lowest
sales lift
We could achieve the
highest incremental
physical sales if replace
PRD016 with PRD018
See more
details about
PRD016
See what the
recommended
replacements are
2
1
3
4

30
Click PRD015 as
it is another
“dog” SKU
We could achieve the
highest incremental
physical sales if replace
PRD015 with PRD021
See more
details about
PRD015
See what the
recommended
replacements are
2
1
3
4

31
See the overall impact
on physical sales if we
take the
recommended actions
The sales will
continue sliding
down if no actions
are taken
1
3
Within the budget
constraints, select
the recommended
actions
2
How Can You Make This Real
Learn Machine Learning http://bit.ly/1OwTYO6
Experiment with Machine Learning http://bit.ly/236rODf
What are some of the questions you wish you could answer about your operations/customer ?