task analysis reviewed mlb - abcte.org
TRANSCRIPT

Mid-Atlantic Psychometric Services, Inc 212 Ashton Dr., SW • Leesburg, VA 20175 Phone: 703.771.4686 • Fax: 703.771.1415
E-mail: [email protected]
Testing Consultants
MAPS, INC.
Final Report
Task Analysis and Validation Study for the Teacher Certification Tests of the
American Board for Certification of Teacher Excellence
Mary Lyn Bourque, Ed.D. Lynn Webb, Ed.D.
Principal Investigators
May 2008


Final Report
Task Analysis and Validation Study for the Teacher Certification Tests of the American Board for Certification of Teacher Excellence Mary Lyn Bourque, Ed.D. Lynn Webb, Ed.D. Principal Investigators May 2008
The work described in this report was conducted by MAPS, Inc. under contract to the American Board for Certification of Teacher Excellence. Copyright © 2008 by MAPS Inc. All rights reserved.

ii
Acknowledgments The co-authors would like to thank all those who contributed to the making of this report. To the hundreds of principals and teachers who responded to the call and agreed to participate in this national research study we are especially grateful. We appreciate the staff and students at Shimer College, Waukegan IL, who assisted us in the pilot testing of some of the initial surveys and their helpful comments. Finally, our special thanks go to Tessa Regis, Project Assistant, who metamorphosed the content standards of 17 subject areas into 50 surveys, and Claudia Creaven Project Data Manager, who directed the scanning and data conversion to Excel files, scoured files for possible errors, and tracked thousands of bits of data from start to finish.

iii
Table of Contents Introduction . . . . . . . . . 1 Sampling . . . . . . . . . 5
Response Rates . . . . . . . 7
Characteristics of Survey Respondents . . . . 9 Task Analysis Surveys
Survey Development . . . . . . . 11
Pilot Testing Surveys. . . . . . . 16
Response Scale . . . . . . . 16 Data Collection Design . . . . . . . 17 Survey Windows and Shipments . . . . . . 17 Data Analysis . . . . . . . . . 18 Results. . . . . . . . . . 18 Elementary Education (MST) . . . . . 20 Reading Endorsement . . . . . . 20 Special Education (Elem) . . . . . . 21 ELL Endorsement (Elem) . . . . . . 21 PTK . . . . . . . . . 22 E/LA . . . . . . . . . 22 Mathematics . . . . . . . . 23 General Science . . . . . . . 24 Biology . . . . . . . . 25 Chemistry . . . . . . . 26 Earth Science . . . . . . . . 27 Physics . . . . . . . . 28 CORE Science . . . . . . . 29 U.S. History . . . . . . . . 30 World History . . . . . . . 31 Civics and Government . . . . . . 31 World Geography . . . . . . . 32 Special Education (Sec) . . . . . . 33 ELL Endorsement (Sec) . . . . . . 33

iv

v
Discussion . . . . . . . . . 36 Caveats . . . . . . . . . 36 Recommendations . . . . . . . . 38

vi

vii
Appendices A Westat Sampling . . . . . . . A1
B Samples of Invitations/Participation Forms . . . A9
C Materials Mailed to Schools . . . . . . A17
D Selected Comments from Surveys . . . . . A27
E Elementary Education . . . . . A31
F Reading Endorsement . . . . . . A69
G Special Education/Elementary . . . . . A77
H ELL/Elementary . . . . . . . A89
I PTK . . . . . . . . . A101
J E/LA . . . . . . . . . A111
K Mathematics . . . . . . . . A121
L General Science . . . . . . . A135
M Biology. . . . . . . . . A157
N Chemistry . . . . . . . . A171
O Earth Science . . . . . . . . A185
P Physics . . . . . . . . A201
Q CORE Science . . . . . . . A213
R U.S. History . . . . . . . . A221
S World History . . . . . . A233
T Civics/Government . . . . . . . A243
U World Geography . . . . . . . A253
V Special Education/Secondary . . . . . A261
W ELL/Secondary . . . . . . . A273

viii

ix
Tables
1 Subject Area Standards and Date of Development . . . 4
2 Number of Surveys by Subject Area, Survey Length and Content . 6
3 Invitation Letters and Participation Mailings . . . . 7
4 Initial Response Rates . . . . . . . 8
5 Final Response Counts by Level and Survey Content . . . 9
6 Demographic Characteristics of Responding Schools . . . 10
7 Demographic Characteristics of Responding Sample . . . 12
8 Tracking Codes Used to Identify Subject Area Objectives . . . 13 9 Distribution of EEd/MST Low Importance (2) Objectiv es . . 20 10 Distribution of Secondary Mathematics Low Importance (2)
Objectives. . . . . . . . . 23
11 Distribution of General Science Very Low (1) and Low Importance (2) Objectives . . . . . . 24
12 Distribution of Earth Science Low Importance (2) Objectives . 27 13 Distribution of Physics Low Importance (2) Objectives . . 28 14 Distribution of World History Low Import ance (2) Objectives . 31 15 Distribution of Secondary ELL Low Importance (2) Objectives . 33 16 Validation Defined as Percent of Objectives Confirmed . . 36

x

xi
Figures 1. Examples of Editing Rules . . . . . . . 15 2. Reading Endorsement Objectives with Low Importance (2) Average Ratings 21 3. Special Education Objectives with Low Importance (2) Average Ratings . 21 4. ELL/Elem Objectives with Low Importance (2) Average Ratings . . 22 5. E/LA Objectives with Low Importance (2) Average Ratings . . . 23 6. General Science Objectives with Very Low Importance (1) Average Ratings . 24 7. Biology Objectives with Low Importance (2) Average Ratings . . . 25 8. Chemistry Objectives with Low Importance (2) Average Ratings . . 26 9. Earth Science Objectives with Very Low Importance (1) Average Ratings . 27 10. CORE Science Objectives with Low Importance (2) Average Ratings . . 29 11. U.S. History Objectives with Low Importance (2) Average Ratings . . 30 12. Civics/Government Objectives with Low Importance (2) Average Ratings . 32 13. World Geography Objectives with Low Importance (2) Average Ratings . 32 14. ELL Secondary Objectives with Very Low Importance (1) Average Ratings . 33 15. ELL Secondary Objectives with Low Importance (2) Average Ratings . 35

xii

xiii
Supplementary Materials (electronic format only) CD Coded Versions of ABCTE Content Standards: Original, Edited, and Survey Versions CD Task Analysis Surveys, 12/11/06 CD Raw Data File (Excel format) CD Task Analysis Final Report

xiv

xv
Task Analysis and Validation Study for the Teacher Certification Tests of the American Board for Certification of Teacher Excellence: Final Report
Executive Summary
Introduction
The American Board for Certification of Teacher Excellence (ABCTE or American
Board) contracted with Mid Atlantic Psychometric Services (MAPS) in May 2005 to conduct a task analysis study to serve as the foundation for its certification testing programs and to validate the standards developed through a logical analysis and content expert review. The American Board’s Technical Advisory Committee (TAC) has indicated a need for this study. The validation study included the following content areas:
• Professional Teaching Knowledge [K-12] • Elementary Education: Reading/LA, Mathematics, Science, and History/Social Science1
[K-6] • Secondary English/Language Arts [6-12] • Secondary Mathematics [6-12] • CORE Science [6-12] • Secondary General Science [6-12] • Earth Science [6-12] • Biology [6-12] • Chemistry [6-12] • Physics [6-12] • Special Education [K-12] • Elementary Reading Endorsement [K-6] • English Language Learners Endorsement [K-12] • U.S. History [6-12] • World History [6-12] • Civics and Government [6-12] • World Geography [6-12]
MAPS worked with Westat, a national sampling contractor, to draw a nationally
representative sample of public, private, and charter schools whose teachers would be asked to participate in the research study. Approximately 140 schools accepted the invitation to participate, and nearly 2500 teachers returned surveys in various subject areas.
1 Initially, the Elementary Education assessment was called just that using the acronym EEd. At some point after the development of the content standards, and after the setting of standards for certification, the name was changed by the American Board to the Multi-Subject Test with the acronym MST. However, all the documents from this contractor referred to EEd. We continue to use that label throughout this report with MST in parentheses.

xvi
Survey development employed a matrix approach. The construction of surveys from the final set of content standards was a multi-step, iterative procedure: (1) assigning content codes to each content objective; (2) editing each objective for clarity and use in a survey; (3) estimating the final number of forms in each content area given the number of objectives; and (4) distributing objectives and randomly assigning them to various forms. During March and April 2006 some of the initial draft surveys were pilot tested with staff and students at Shimer College in Waukegan, IL. At least one survey form from each content area was completed and discussed with the investigator. The setting was informal, so that faculty and students could participate at their own convenience. The sliding schedule also permitted interviewing each pilot respondent after s/he completed a survey. Interviews with about a dozen Shimer participants led to a number of critical changes in the surveys.
A four-point Likert scale was used to report the degree of importance to the respondent (1 = very low importance, 2 = low importance, 3 = high importance, 4 = very high importance). The mid-point normally used in a 5-point scale was eliminated to force a positive or negative response on each statement. In order to ensure ease of complying for the schools, eight windows of opportunity were offered to the school to administer the surveys: four weeks in January and February, 2007. These eight windows were available to the first 1300 schools sent letters of invitation. The final 1300 were offered only four to six windows, since their letters did not go out until close to the end of December, 2006. Results
In this section of the report, we focus on the degree to which the objectives that serve as the foundation for the American Board’s testing programs were validated through the surveys of actual teachers in the field. The survey ratings were based on means of individual responses using a four-point Likert scale: 1 = very low importance, 2 = low importance, 3 = high importance, 4 = very high importance.
The results of the validation study vary considerably by content area. The preliminary development work in some content areas was confirmed by the survey ratings of Importance, but was not well-supported in other content areas. The table below shows a rough indicator of validation as defined by the percentage of objectives that received average ratings that would round to ratings of Important or Very Important. The table presents the content areas in order of validation.
The American Board might reflect on these findings to prioritize updating any testing content based on the validation study results. There are content areas with excellent support for the preliminary development work, as seen in Professional Teaching Knowledge, Elementary Special Education, English Language Learners, and Reading; and Secondary Special Education, Biology, English Language Arts, World Geography, U.S. History, Civics and Government.

xvii
Validation Defined as Percent of Objectives Confirmed Important or Percent of Very Important Objectives Subject Area Objectives/Total Confirmed Professional Teaching Knowledge 99/99 100% ELEMENTARY LEVEL Special Education 137/138 99 English Language Learners 142/145 98 Reading Endorsement 71/74 96 Elementary Education (MST) 350/510 68 SECONDARY LEVEL Special Education 137/138 99 Biology 168/177 95 English/Language Arts 110/116 95 World Geography 82/87 94 U.S.History 126/136 93 Civics and Government 79/85 93 CORE 78/87 90
Chemistry 131/156 84 English Language Learners 120/145 83 Physics 116/156 74 Earth Science 143/196 73 General Science 190/271 70 World History 65/104 63 Mathematics 77/156 49
Findings are clearly supportive, but may warrant a second look in the Secondary areas of Chemistry and English Language Learners. The science areas in general were not among the highly confirmed content areas – and this appears to be true whether one is looking at specific content or CORE. Finally, there is a surprising lack of confirmation in the areas of World History, Mathematics, and Elementary Education. Recommendations
An initial step in digesting these results could be to examine documentation from the development of the test specifications for the content areas that did not receive high percentages of confirmation, to see whether all the objectives were indicated for testing. As this report mentioned earlier, there were cases of test development committees eliminating objectives from consideration based on their unsuitability for testing within a multiple-choice framework.
The findings suggest a prioritization of content areas that might benefit from revision, but the American Board will want to balance the data priorities with test usage. It may be that some content areas are testing many candidates, and the updates will have most influence in the high

xviii
usage areas. Once an area is selected to study for revision, the content standards committee might consider where the low-rated objectives fit within the test specifications. Do the validation results suggest the elimination or reduction in emphasis of any content subdomains from the standards and the test specifications? For example, in mathematics we see an unequal distribution of objectives that was not supported through importance ratings across domains of content. Calculus, trigonometry, and linear algebra show numerous objectives that were not supported, while measurement and mathematical reasoning have only one or two. A review of the content subdomains associated with objectives that were not supported through importance ratings in Appendices E through W will provide guidance in prioritizing the subdomains within a content area. A trickle-down effect would be in place if any objectives were removed from the compiled content standards and test specifications; there are likely corresponding test items that would also be removed from the item pool. Similarly, any candidate information materials would need to reflect the modified content domains.
At a minimum, the following specific recommendations are offered as a guide for prioritizing future revisions based on these data. For the elementary level assessments:
1. Elementary Education (MST) should be reevaluated in the light of NCLB. With the heavy emphasis in classrooms on reading and mathematics those areas should receive the highest priority for being fully comprehensive and rigorous. The social sciences and science should be reviewed placing more emphasis on critical and essential knowledge and skills in these areas.
For the secondary level assessments:
2. Secondary Mathematics. As mentioned above, this content area has three subdomains that should be re-evaluated, namely, linear algebra, trigonometry, and calculus. Since this assessment covers 6 through12, the advisability of having these three subdomains account for 39% of assessment is questionable. One approach might be to limit coverage in these three areas to no more than 20% of the assessment. A second approach might be to create a new assessment specifically for teachers of middle school (usually some combination of grades 5 – 9). Content specialists in the target grade levels could assist in limiting and re-prioritizing all subdomain content that would be customized for teachers in those specific grades.
3. World History. Again, two subdomains covering the earliest periods (about 40% of the
assessment) are the least validated components of the assessment. A more even distribution of content across all subdomains would alleviate if not eliminate this problem.2
2 An independent observation while conducting the standard setting in this area is that in an effort to maintain neutrality with respect to a Eurocentric approach to world history, the pendulum seems to have swung quite far in the other direction with a heavy emphasis on Asia in general, and China in particular. The item pool has a plethora of items in this category.

xix
4. General Science. This is a content area with a lot of ground covered. However, in
attempting to do so, the assessment developed a serious flaw, namely, heavy emphasis in three subdomains, physics, biology, and chemistry. While this content indeed should be covered in a General Science classroom, the real question is at what level of rigor. The assessment appears balanced in the earth science area, and even in the CORE area, but not in the three named subdomains. Again re-prioritizing the content and repairing the table of specifications is highly recommended.
5. Earth Science. One-third of the content in the subdomain Magnetic Fields should be
reviewed. Similarly, a number of CORE objectives were not highly rated. ABCTE should re-examine at least the primary offending subdomain. There were some initial discussions of eliminating the CORE as a subset of any of the science areas. Therefore, this report will not focus on suggested repairs in this area.
6. Physics. This content area resulted in being less well validated than some others
primarily due to the inclusion of CORE science as part of the assessment. If the CORE is not counted, then less than 20% of the assessment is problematic. However, the offending subdomain areas should be reviewed to see if there are any objectives that could be eliminated without doing a disservice to the overall quality and rigor of the assessment.
7. English Language Learners (Secondary). Why the ELL results are much better at the
elementary than secondary level is not known. Experience would suggest that ELL teachers in 6-12 are engaged in different teaching behaviors and therefore require a different skill set than ELL teachers in K-6. The obvious fix is to separate the two levels and create two separate assessments. However, in a low-density subject area this may require more resources than the agency would want to devote to this activity. In lieu of this approach, perhaps simply reviewing the two offending subdomains, language structure and use, and culture and cultural diversity, would allow a modest and less resource-intensive repair.
8. Chemistry. Two subdomains, electrochemistry and organic chemistry should be
reviewed to see if the breadth and depth of content being required is appropriate.
In summary, 11 content areas have confirmation rates at the 90% or higher. These areas could be reviewed as they cycle through the long-range plan for revising the ABCTE assessments.
The remaining eight content areas need more immediate attention. The recommendations above suggest each area in need, and are listed in priority order.

xx

21
Task Analysis and Validation Study for the Teacher Certification Tests of the American Board for Certification of Teacher Excellence: Final Report
Introduction
The American Board for Certification of Teacher Excellence (ABCTE or
American Board) contracted with Mid Atlantic Psychometric Services in May 2005 to conduct a task analysis study to serve as the foundation for its certification testing programs and to validate the standards developed through a logical analysis and content expert review. The American Board’s Technical Advisory Committee (TAC) has indicated a need for this study.
The Standard3 developed by the American Educational Research Association (AERA), American Psychological Association (APA), and National Council on Measurement in Education (NCME), includes a chapter on “Testing in Employment and Credentialing.” Several standards and commentaries in that chapter address the importance of task analysis studies for certification programs, including:
14.14 The content domain to be covered by a credentialing test should be defined clearly and justified in terms of the importance of the content for credential-worthy performance in an occupation or profession. A rationale should be provided to support a claim that the knowledge or skills being assessed are required for credential-worthy performance in an occupation and are consistent with the purpose for which the licensing or certification program was instituted.
Similarly, the National Commission for Certifying Agencies’ (NCCA) Standards4
describes the reason for conducting task analysis studies in Standard 10: The certification program must analyze, define, and publish performance domains and tasks related to the purpose of the credential, and the knowledge and/or skill associated with the performance domains and tasks, and use them to develop specifications for the assessment instruments.
A complete report summarizing the results of the task analysis study suggesting evidence that the Standard (10) has been met may include:
• A description of the background and experience of subject-matter experts and professionals who participated in various phases of the task/practice analysis
3 AERA, APA, NCME, (1999). Standards for educational and psychological testing. Washington DC: AERA. 4 National Commission for Certifying Agencies. (2003). Standards for the Accreditation of Certification Programs, Washington DC: NCCA.

22
• Identification of the psychometric consultants or organization used to conduct the task/practice analysis or important phases of it
• A description of methods used to delineate performance domains, tasks, and associated knowledge and/or skills
• A description of the survey’s sampling plan and its rationale • A copy of the task analysis survey, including all instructions, rating scales,
open-ended questions, and background demographic information collected from participants
• Documentation of survey results, including return rate, analysis of ratings data, algorithms or other psychometric methods used to analyze or combine ratings data, and a rationale supporting representativeness of survey findings.
• A table of specifications for each assessment instrument specifying weighting of the performance domains, tasks, and associated knowledge and/or skill, along with any decision rules used to eliminate any of these elements from the table of specifications
• Date of the study and description of a plan to update periodically the task/practice analysis. (Commentary F, page 10)
The project plan was developed to efficiently proceed through the important steps
of a validation/task analysis. Task analysis studies serve as the foundation of testing programs for certification and licensure, and typically consist of a logical analysis combined with a survey of incumbents.
The logical analysis step is typically done through reviews of literature, and frequently includes review by a panel of experts. The American Board has already done the foundational work for the logical analysis, developing standards for the following content areas:
• Professional Teaching Knowledge [K-12] • Elementary Education: Reading/LA, Mathematics, Science, and History/Social
Science5 [K-6] • Secondary English/Language Arts [6-12] • Secondary Mathematics [6-12] • CORE Science [6-12] • Secondary General Science [6-12] • Earth Science [6-12] • Biology [6-12] • Chemistry [6-12] • Physics [6-12]
5 Initially, the Elementary Education assessment was called just that using the acronym EEd. At some point after the development of the content standards, and after the setting of standards for certification, the name was changed by the American Board to the Multi-Subject Test with the acronym MST. However, all the documents from this contractor referred to EEd. We continue to use that label throughout this report with MST in parentheses.

23
• Special Education [K-12] • Elementary Reading Endorsement [K-6] • English Language Learners Endorsement [K-12] • U.S. History [6-12] • World History [6-12] • Civics and Government [6-12] • World Geography [6-12]
According to the ABCTE documentation on certification standards development,
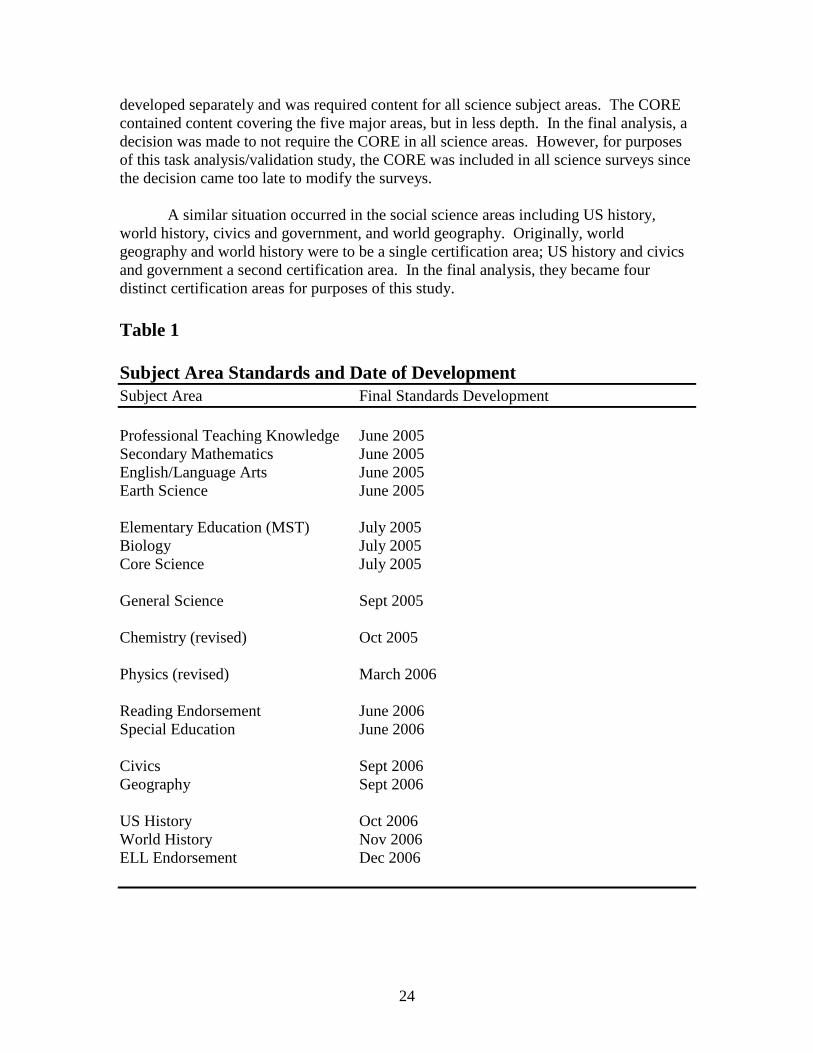
the content standards represent a consensus of a broadly representative group of experts across the country, including content experts, teachers, principals, and other school administrators, academicians, and policymakers. The development used a seven-step process: (1) review of state and national teacher certification standards; (2) analysis of selected state K-12 student standards; (3) literature review of scientifically-based research linking effective teaching and student gains; (4) review of findings by panels; (5) development of draft ABCTE content standards; (6) on-going review of draft documents by panels; and (7) and revisions of standards and prioritization resulting in the test specifications. Standards committees were impaneled for each subject area under consideration.6 ABCTE was assisted in this work by several outside contractors. This validation/task analysis study was based on the assumption that the content standards were the basis for each of the item pools developed in that content area and are the primary focus of this study. In some instances, however, specific standards that had been developed very early in the test development process and were earmarked for exclusion for one or more reasons by the outside contractor were included and tracked so that ABCTE could develop a data base on the importance of those standards in the workplace.7 The standards were formatted for a national survey of incumbents, and allowed teachers to rate the importance of the standards within their teaching fields. Table 1 provides a listing of the various subject areas and the approximate date when the standards were developed. Most of the subject areas were delivered to MAPS shortly after the completion of the standards. In some cases standards were revised after delivery, which resulted in surveys being revised or re-developed to reflect the changes. There were some significant changes in the content of the full set of standards in the sciences. Initially, all five science areas (general science, biology, chemistry, earth science, and physics) each contained a section called CORE science which was
6 For a detailed description of the various content area committees and the subject areas that were considered by each, the reader should consult with other ABCTE documentation. This report cannot provide details of what the committees recommended, what was accepted or rejected by the American Board, or a description of the decision process by which actual content became part of the test specifications. 7 The specific standard recommended for exclusion was encompassed within other more broadly worded standards; or addressed such basic knowledge that it did not require assessment; or the standard was difficult to measure within an objectively-scored, multiple-choice format.
24
developed separately and was required content for all science subject areas. The CORE contained content covering the five major areas, but in less depth. In the final analysis, a decision was made to not require the CORE in all science areas. However, for purposes of this task analysis/validation study, the CORE was included in all science surveys since the decision came too late to modify the surveys. A similar situation occurred in the social science areas including US history, world history, civics and government, and world geography. Originally, world geography and world history were to be a single certification area; US history and civics and government a second certification area. In the final analysis, they became four distinct certification areas for purposes of this study. Table 1 Subject Area Standards and Date of Development Subject Area Final Standards Development Professional Teaching Knowledge June 2005 Secondary Mathematics June 2005 English/Language Arts June 2005 Earth Science June 2005 Elementary Education (MST) July 2005 Biology July 2005 Core Science July 2005 General Science Sept 2005 Chemistry (revised) Oct 2005 Physics (revised) March 2006 Reading Endorsement June 2006 Special Education June 2006 Civics Sept 2006 Geography Sept 2006 US History Oct 2006 World History Nov 2006 ELL Endorsement Dec 2006

25
A common criticism regarding task analysis studies conducted by or for certification agencies is a low response rate to a survey, which causes suspicions about how well the responding sample represents the target population. The plan to sample at a school level, rather than at the teacher level (described in the sampling section below) was strategically intended to maximize the response rate to the survey.
Demographic items included at the end of the survey provided the basis for special analyses. The surveys gathered data on respondents’ background including, gender, race/ethnicity, current teaching grade assignment, years of teaching, primary content teaching assignment, college major, advanced degree, and current certification.

26
Sampling A critical task was that of obtaining a proper sample for the study. MAPS worked with WESTAT, a national sampling contractor, to fine tune the overall sampling plan. WESTAT’s description of the sampling process, the frame used, how schools were selected, and file layout are all included in Appendix A.
WESTAT provided the sample in mid-October 2006. There were 1200 (K-6) elementary schools in the sample (600 original and 600 substitute schools), and 1400 (6-12) secondary schools (700 original and 700 substitutes). The schools selected were intended to be broadly representative of US schools, including public, private, and charter schools. In addition to school type, sampling took into account geographic location, and school enrollments. Because of the aftermath of Hurricane Katrina, schools from Louisiana and Mississippi were excluded from the sample.
In developing this sampling plan several assumptions were made:
• The primary sampling unit (PSU) are schools, not individuals; • Maximize the number of surveys/subject area sent to schools to minimize bias or
school effects; • Include PTK (Professional Teaching Knowledge) in a variety of elementary and
secondary subject surveys where candidates are required to take the PTK assessment;
• Randomize standards statements on each survey to minimize response-set bias;
The thinking behind the first assumption was that it would be more efficient to motivate schools to respond to achieve a higher response rate than to motivate individuals. ABCTE agreed to offer an honorarium to schools ($200/school) for their participation, provided they met the participation criteria. This placed the burden of motivation on the school administration to ensure that the faculty responded. A commitment of cooperation from the school was elicited before shipping the surveys. Schools with less than 400 school enrollment were asked to “volunteer” all their teachers to the study, up to 20 teachers. Schools with more than 400 school enrollment were asked to “volunteer” at least 20 teachers to the study. An 80% response rate (minimum of 16 teachers per school) in either case was required to be eligible for the school honorarium.
The second assumption was prompted by a concern for respondent burden. In some cases, there were nearly 700 standards to be covered and no single respondent could or would evaluate that number. Therefore, a standard-respondent matrix design was used, where several forms of the survey would be developed with 50 to 75 standards per form. There was no attempt to limit exposure to the content standards since they were (at the point where we were conducting the survey) already publicly available. Further, many of the standards were edited for suitability in survey use, and exposure to test content did not seem to be much of a risk. Table 2 lists the survey subject areas, the

27
number of surveys in each area, and the number of questions per survey in each content area.

28
Table 2 Number of Surveys by Subject Area, Survey Length and Content Total Number of Questions/ Number of Questions/ Content Subject Area Surveys Survey Included Elementary Level Elementary Education (MST) 10 61 51/EED, 10/PTK Reading Endorsement 2 62 37/READ, 25/PTK Special Education 3 62 46/SPED, 16/PTK ELL Endorsement 3 53 53/ELL Professional Teaching Knowledge8 0 Secondary Level English/Language Arts 4 54 29/ELA, 25/PTK Mathematics 4 64 39/MATH, 25/PTK Professional Teaching Knowledge 0 General Science 4 68 14/CORE, 54/GS Biology 3 59 17/CORE, 42/BIO Earth Science 3 66 17/CORE/39/ES Chemistry 3 52 17/CORE/35/CHEM Physics 3 52 17/CORE, 35/PHYS CORE Science9 0 Civics and Government 2 43 43/CIVICS World Geography 2 44 44/W GEOG World History 2 52 52/WH US History 2 68 68/USH Special Education 3 62 46/SPED, 16/PTK ELL Endorsement 3 53 53/ELL
The third assumption resulted in adding PTK to five content areas as part of the
overall surveys in each area: Elementary Education (MST), Reading Endorsement, Special Education, English/Language Arts and mathematics.
Finally, the fourth assumption was important, since the content standards are
grouped by sub areas to aid in understanding. However, for the purposes of the study, this grouping could lead to response set bias. For example, in the chemistry standards
8 Standards from PTK were included in the elementary and secondary subject matter surveys as indicated. 9 Standards from the CORE science were included in the secondary subject matter science surveys as indicated.

29
there is a substantial list of standards falling under the general category of “Thermodynamics and Equilibrium.” Subsets such as this were randomized to appear on various forms, so that a single respondent would not rate the complete set of standards in the subset.
The headings in the standards (e.g., Thermodynamics and Equilibrium, Solution Chemistry, etc.) were also removed to provide a more neutral view of the content. The one exception to this rule was in the elementary education (MST) surveys. The elementary education domain consists of standards in four sub areas, i.e., reading, mathematics, science, and social sciences. There were about 12 standards appearing on a survey in each sub area. In order to achieve clarity for the respondent, the sub area headings were included on the surveys.
Each of these assumptions played into the final decisions about sample size. The
original plan was to use a sample of about 300 to 350 schools at each level. However, as more became known about the number of surveys (a total of 50), and the length of each one, a sample of four times that size was selected in order to ensure a useful responding sample. Although the schools were selected to be broadly representative, the responding sample of schools was clearly a “volunteer” sample of PSUs, and the teachers actually responding to the surveys a secondary “volunteer” sample.
Response Rates
All 2600 schools were sent an announcement letter inviting them to participate in this national survey. The letters were customized to whether the school was a K-6 or 6 - 12 school, and whether the school was a “small school” (enrollment less than 400), or a large school (enrollment greater than 400). The letters included a self-addressed, stamped return envelope for the school to indicate its willingness to participate. Sample letters and Participation Forms appear in Appendix B. Table 3 displays the sequence of mailings, due dates for response, and other relevant information. Table 3 Invitation Letters and Participation Mailings Item Mailing Response Primary Secondary Date Date <400 >400 <400 >400 Totals
Letter 11-01 12-01 80 220 62 288 650 Letter 11-20 12-15 12 13 20 55 100 Pstcrd 12-02 ASAP 70 207 56 259 592 Letter 12-04 12-27 25 25 25 125 200 Letter 12-05 12-22 43 182 17 108 350 Letter 12-29 01-15 160 440 124 576 1300
Of the 2600 letters sent, 138 responded with a YES, 123 checked NO, and 2,334 did not respond at all. About ¼ in the “did not respond” category were sent a follow-up

30
post-card to see if that would spur a better response. There is no evidence that it did. If the school checked YES, they also indicated how many surveys and in which subject areas they would want the teachers to respond. Table 4 summarizes the counts by level and school size. The number of surveys requested plus a few extras (in the event that the counts changed) were added to each school’s shipment. Table 4 Initial Response Rates Total Number YES NO Undeliverable No Response K – 6 1200 <400 27 18 1 274 >400 42 31 2 805 6 – 12 1400 <400 22 17 2 207
>400 47 37 0 1048 TOTALS 13810 123 5 2334
The final response counts are based on the number of schools responding YES to the initial invitation. These counts are summarized in Table 5 and are sorted by elementary and secondary levels. Virtually all of the schools agreeing to participate and returning their surveys made the 80% response rate criterion initially set as the requirement for earning the $200/school honorarium offered by the American Board.
Some exceptions to the rule. It should be noted, however, that at least some respondents whose surveys consisted of two parts (a subject area and either PTK or CORE science) chose not to answer questions in the additional section. Similarly, some respondents did not answer all sub domains in the Elementary Education survey (e.g., some omitted math, or science, etc.) Also, there were some respondents who failed to report on their background information. In this case we entered the correct school zip code, but left the remainder blank. Finally, some very early returns were scanned into the data file without the linked background sheet. These respondents are included in the overall counts, but cannot be included in any breakdowns that depend on background data (e.g., males/females, white/minority, etc.).
10 Of the 138 schools that indicated YES on the initial invitation, only 115 actually completed and returned the surveys. Of the 22 schools that did not return the materials, 7 were K-6 school (2 <400, 5 > 400), and 15 were 6 – 12 schools (6 < 400, 9 >400). The one remaining school returned the box of surveys unanswered with a note stating that the “surveys did not meet the needs of their school and the specific teachers necessary to complete them.”

31
Table 5 Final Response Counts by Level and Survey Content Surveys Surveys Level/Area Shipped Returned Elementary Level (N=1427) Elementary Education (MST) 1501 1109 Special Education 270 165 Reading Endorsement 186 87 ELL Endorsement 143 66 Secondary Level (N= 989) English/Language Arts 415 240 Mathematics 369 190 Special Education 221 120 General Science 185 75 US History 163 79 World History 128 67 Biology 97 44 World Geography 91 48 Chemistry 68 33 ELL Endorsement 68 18 Earth Science 65 32 Physics 53 24 Civics and Government 52 19 Combined K-12 Levels11 Special Education 491 285 ELL Endorsement 211 84 Characteristics of Survey Respondents In order to understand the background of the respondents in the data set the following information is provided both about the schools responding and the individuals who completed the surveys. Based on the data in the Westat sampling file the schools responding were a mix of large and small, public private, and charter schools. Table 6 displays the salient characteristics of the schools in the final volunteer sample.
11 These are duplicate counts combined from the elementary and secondary counts above.

32
Table 6 Demographic Characteristics of the Responding Schools (N = 115) Characteristic N Percent State/region represented Nationally 36/50 72% Northeast 9/12 75 Southeast 10/12 83 Central 10/12 83 West 8/15 53 Schools by region Nationally 115 100
Northeast 22/115 19 Southeast 32/115 28 Central 30/115 26 West 31/115 27 School type Public, non-charter 97 84 Private 16 14 Public, charter 2 2 School Grade span (n =119)12 Primary (K-8) 75 65 Secondary (6-12) 44 38 School Enrollment Primary < 400 25 22 Primary > 400 37 32 Secondary < 400 16 14 Secondary > 400 37 32 School Urbanicity13 Urban(1,2) 22 19 Urban fringe (3,4) 42 37 Town (5,6) 16 14 Rural (7,8) 35 30 NOTE: State and region are the same as the NAEP designators. Northeast includes CT, DE, DC, ME, MD, MA, NH, NJ, NY, PA, RI, VT, VA (metro area around DC only); Southeast includes AL, AR, Fl, GA, KY, LA, MS, NC, SC, TN, VA (excluding the metro around DC), WV; Central includes IL, IN, IA, KS, MI, MN, MO, NE, ND, OH, SD, WI; West includes AK, AZ, CA, CO, HI, ID, MT, NV, NM, OK, OR, TX, UT, WA, WY.
12 N count includes 4 schools with a grade span K-12, and were counted in both the elementary and secondary levels. 13 Census Bureau categories: 1 = Large city; 2 = Mid-size city; 3 = Urban fringe of large city’ 4 = Urban fringe of mid-size city; 5 = Large town; 6 = Small town; 7 = Rural, outside Metropolitan Statistical Area (MSA); 8 = Rural inside MSA.

33
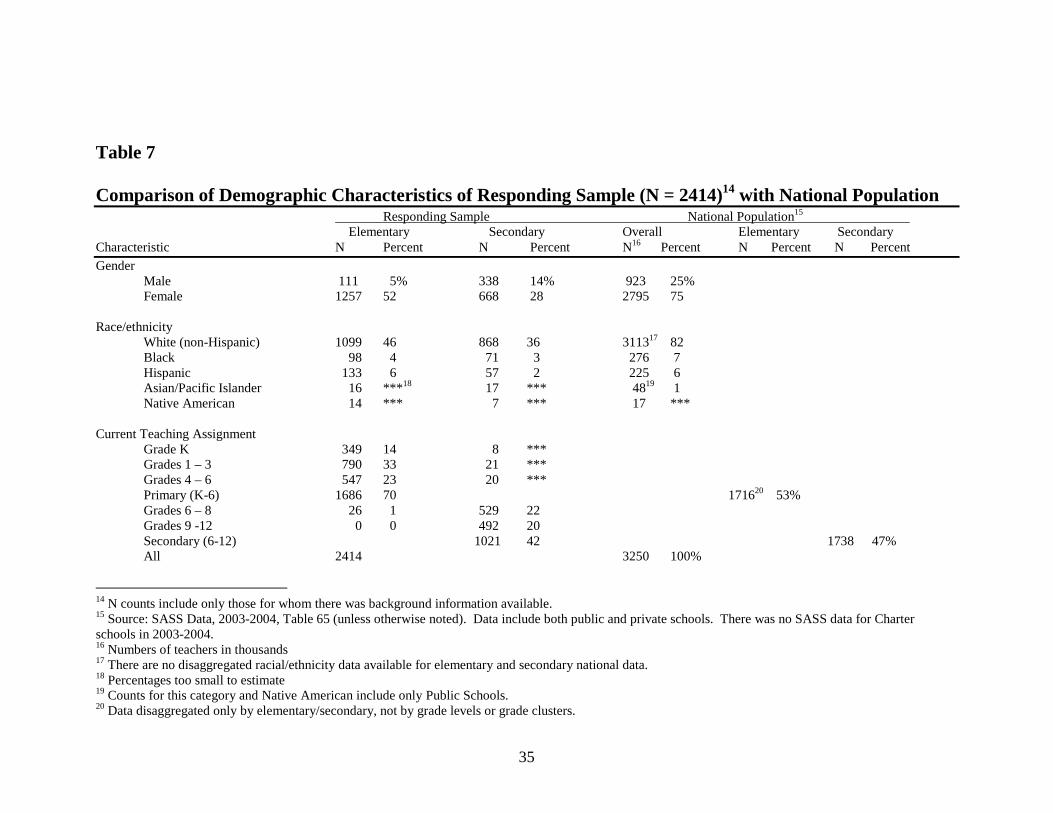
Nationally, about three-fourths of the states participated in the survey, with approximately equal participation in each of the four regions, except for the West, which was somewhat lower. In terms of the participating schools from each region, the lowest region was the Northeast, with the remaining three regions being about equal. Public schools represented the largest percentage of schools at 84%. Private and charter schools comprised the remaining 16%. Urbancity of the responding schools was split about 60/40, with the larger percentage representing urban or urban fringe areas, and the remaining 40 percent coming from large or small towns and rural areas. Table 7 provides the demographic background of the responding sample and compares it to that of the national teaching population. The individuals responding were broadly representative of teachers in general. In terms of gender, there was a fairly uneven split between male and female; as one might expect given that the largest number of responding teachers came from the primary (K-6) level. However, that same distribution holds true in the national population; there seems to be little notable difference between the sample and the population for males and females in the teaching arena.
Overall, 82% of the respondents represented the non-minority population, while about 18% represented the various minority groups. While the survey background questionnaire offered all the census bureau minority categories, some groups were too small to estimate the percentages. For the three major groups, i.e., whites, blacks, and Hispanics, the percentages are very close if not identical. The last two categories, i.e., Asian/Pacific Islander and Native American, have very few members in the teaching force that makes estimating percentages impossible. Further, these last two categories had no national data available for the private school category.
In terms of teaching experience, there are some minor differences between the
sample and the population data. Even though the data were collected from the sample and the population using different classification schemes, it appears that the sample slightly overestimates the percentages of novice teachers with less than 3 years teaching experience. However, over 80 % of the sample had more than four years of teaching experience. The remaining categories seem to have relatively minor differences.
The survey asked the participants to report on their highest advanced degree.
Slightly more than 50 percent at both the elementary and secondary levels reported having an advanced degree. This is quite comparable to the population as a whole where almost 50 percent have an advanced degree at both the elementary and secondary levels.
A comparison between the sample and the population in terms of certification in
the field in which the individuals are teaching is quite comparable; about 80 % had permanent certification in their teaching field.
These data would seem to indicate that the assumptions made in identifying and
selecting the sample outlined earlier in this report produced a group of respondents that were by and large representative of the national teaching population, with only minor and

34
35
Table 7 Comparison of Demographic Characteristics of Responding Sample (N = 2414)14 with National Population Responding Sample National Population15 Elementary Secondary Overall Elementary Secondary Characteristic N Percent N Percent N16 Percent N Percent N Percent
Gender Male 111 5% 338 14% 923 25% Female 1257 52 668 28 2795 75 Race/ethnicity White (non-Hispanic) 1099 46 868 36 311317 82 Black 98 4 71 3 276 7 Hispanic 133 6 57 2 225 6 Asian/Pacific Islander 16 ***18 17 *** 4819 1 Native American 14 *** 7 *** 17 *** Current Teaching Assignment Grade K 349 14 8 *** Grades 1 – 3 790 33 21 *** Grades 4 – 6 547 23 20 *** Primary (K-6) 1686 70 171620 53%
Grades 6 – 8 26 1 529 22 Grades 9 -12 0 0 492 20
Secondary (6-12) 1021 42 1738 47% All 2414 3250 100%
14 N counts include only those for whom there was background information available. 15 Source: SASS Data, 2003-2004, Table 65 (unless otherwise noted). Data include both public and private schools. There was no SASS data for Charter schools in 2003-2004. 16 Numbers of teachers in thousands 17 There are no disaggregated racial/ethnicity data available for elementary and secondary national data. 18 Percentages too small to estimate 19 Counts for this category and Native American include only Public Schools. 20 Data disaggregated only by elementary/secondary, not by grade levels or grade clusters.

36
Table 7R (cont’d.) Comparison of Demographic Characteristics of Responding Sample (N = 2414) with National Population Responding Sample National Population Elementary Secondary Overall Elementary Secondary Characteristic N Percent N Percent N Percent N Percent N Percent
Number years teaching21 Less than 3 years 233 17% 177 17% 264 13% 148 10%
4 – 10 years 349 26 325 32 3 – 9 years 662 33 562 32
11 – 15 years 242 18 144 14 16 years or more 535 39 374 37 10 – 20 years 571 29 466 27 Over 20 years 484 24 461 27 College major in teaching field22 Yes 1107 46 745 31 No 262 11 277 11 Highest advanced degree Bachelor’s (48)23 (45) 1051 53 858 49 Master’s 716 50 521 53 758 38 710 41 Doctorate 3 *** 6 *** 16 *** 34 2 Other24 32 2 24 2 114 6 98 6
21 Categories for survey data and national data were slightly different. National data in italics. 22 National data available only by specific subject matter (English, science, etc.). 23 Estimated as the difference between the percentage with advanced degrees and the total 24 The ‘other’ category was defined in the national data set as an ‘education specialist’ including a certificate of advanced graduate studies

37
Table 7R (cont’d.) Comparison of Demographic Characteristics of Responding Sample (N = 2414) with National Population Responding Sample National Population Elementary Secondary Overall Elementary Secondary Characteristic N Percent N Percent N Percent N Percent N Percent
Certification in teaching field Permanent 1177 49 723 30 80% Provisional 180 7 212 9 825 Emergency 3 *** 7 *** 1 Certification in
non-teaching field 10 *** 44 2 1 No certification 15 *** 30 1 7
25 Source: SASS Data, 1999-2000, Table 3. Includes Probationary (4%), Alternative (3%), and Temporary (1%).

38
non-substantive differences. The national population data were taken from the results published in the 2003-2004 School and Staffing Survey26 conducted in both public and private schools across the nation. Survey Development
The construction of surveys from the final set of content standards was a multi-step, iterative procedure: (1) assigning content codes to each content objective; (2) editing each objective for clarity and use in a survey; (3) estimating the final number of forms in each content area given the number of objectives; and (4) distributing objectives and randomly assigning them to various forms.
Assigning Content Codes. In the overall process it was necessary to de-construct the standards into “chunks” of content, and then in the final analysis re-construct the content so that it could be analyzed in a way that allows the reader to make sense of the data in terms of making decisions about content strands, or clusters of objectives. In order to do this, codes were assigned to virtually each unit in the standards (called for purposes of this report “objectives”). An objective was defined for the purposes of this study as the unit reflecting the level of specificity just below the major sub domains found in the content standards. If there were additional breakdowns, they were subsumed under the sub domain and not assigned a code. For example, in secondary mathematics, the following objective appears, with finer distinctions beneath it: d. know, whether as axioms or as deduced from other axioms, [2367]
• sufficient conditions for the congruence of triangles • properties of angles formed by transversals to parallels • that the angles of a triangle sum to 180 degrees
Only the major objective was coded, but not the more specific material following it. The following statement appeared in the final version of the surveys: d. Know sufficient conditions for the congruence of triangles, the properties of angles formed by
transversals to parallels, and that angles of a triangle sum to 180 [2367]
Table 8 lists the coding structure that was used. In subject areas where the content was used at both the K-6 and 6 – 12 levels, the same codes were used at each level. Since the responses can be sorted by K-6 and/or 6 – 12 respondents, there was no need to separately code these subjects as if they were different standards at each level. There are three sets of files that are linked together by the codes: (1) the original set of standards (coded); (2) the edited sets of standards (coded); and (3) the survey questions (coded). A separate CD is included with this report that includes all three sets of files. 26 U.S. Department of Education. National Center for Education Statistics (NCES). (2005). The Condition of education, 2005 (NCES 2005-094). Special Analysis.

39
Table 8 Tracking Codes Used to Identify Subject Area Objectives Standards Tracking Codes Standards Tracking Codes PTK 101-300 Elem Ed (MST) 301-1100 Read Endorsement 1101-1300 EED/Read 301-500 Spec Ed 1301-1500 EED/History 501-700 ELL 1501-1700 EED/Science 701-900 EED/Math 901-1100 Eng/LA 2001-2300 Secondary Science 2501-3800 Mathematics 2301-2500 CORE 2501-2700 US History 4001-4300 Gen Science 2701-3000 W History 4301-4600 Biology 3001-3200 Civics/Gov’t 4601-4800 Earth Science 3201-3400 Geography 4801-5000 Chemistry 3401-3600 Physics 3601-3800
Editing Objectives for Survey Use. Editing the objectives of the standards was a difficult task due to the unevenness of the level of specificity of the statements from subject to subject. Some statements included long lists of ideas (mostly for item writers), some included lists to ensure coverage of content thought to be necessary by the standards developers. Some lists were simply ideas to be used as examples of the standards that the developers had in mind. Because these standards documents were developed by different groups of individuals, and seemingly there was no attempt to constrain the developers in terms of following a template or writing scheme, the results were varied and creative in the final products. This necessitated substantial editing before using the information in the surveys.
Several editing rules were applied (at least initially) to minimize the arbitrary and capricious editing of standards. For example, when several examples were offered (more than 3), the rule stated “include no more than three examples.” This rule was later refined so that the objective could be repeated on a different survey form, and cover more than the limiting three examples if the editors thought it dealt with materially different content. In addition, some objectives contained more than one concept or idea (many times articulated in two or more sentences) that respondents could find confusing (possibly resulting in a bipolar answer from the respondent). In that case the editing rule stated that the “ideas could be combined where possible, or one concept could be selected for inclusion.” Figure 1 provides three examples of the applications of these editing rules.

40
Editing of objectives was conducted after coding the original set, but before random assignment. There was also a second-level editing completed after the surveys were constructed to ensure that the language was appropriate for a free-standing survey, and statements of objectives did not relate back to any earlier objectives that were now in a different survey. There were a few cases where pronouns referenced earlier content that was no longer there for the reader. A final editing was done just before creation of print forms of the surveys, including spell-checks, numbering, capitalization, and other mechanical issues. Any final edits supplied by ABCTE were incorporated at this point as well (formula changes, etc.). There were six subject area Content Standards that were revised mid-stream, including, chemistry, physics, world history, US history, civics and government, and world geography. Special attention had to be paid to editing in these cases.
Estimating the Number of Survey Forms. The final number of forms was largely a measure of how many final objectives were available for distribution among the surveys. It also depended on whether or not the subject area surveys would contain objectives from PTK and/or CORE science. For example, Elementary Education (MST) contained over 500 objectives covering the four sub areas of elementary reading, history, science, and mathematics. To that would be added the 100 or so objectives from PTK. With over 600 objectives, that resulted in 10 different Elementary Education (MST) surveys, of about 60 objectives each.
Random Assignment of Objectives to Survey Forms. Once the objectives had been coded, edited and the number of forms determined, it was possible to randomly assign objectives to forms. If there were 10 forms, every 10th objective was assigned to Form 1, Form 2, etc. If there were four forms, every 4th objective would be assigned. In the case of 3 forms, every 3rd objective was assigned. Except for Elementary Education (MST), all headings that appeared in the original content objectives were removed. In those cases where PTK was included, Part 1 focused on the main content area, while Part 2 was assigned to PTK. Parts 1 and 2 were labeled to alert the respondent to the fact that the survey statements were in different areas. In the

41
Figure 1
Examples of Editing Rules Rule: Include no more than 3 examples E/LA Original Objective: Understand and explain foreign language phrases commonly used in English (e.g., caveat emptor, carpe diem, coup de grace, coup d’état, carte blanche, c’est la vie, fait accompli, savoir faire). [2010] E/LA Edited Objective Understand and explain foreign language phrases commonly used in English, e.g., caveat emptor, carpe diem, coup de grace. [2010] Modified Rule: Include objective on more than one survey using different examples on each. US History Original Objective Analyze the differences between the Soviet and American ideology. Describe the events and factors that contributed to the beginning of the Cold War and the policy of containment that emerged as a result. [4093] US History Edited Objective (used on two survey forms) Analyze the differences between the Soviet and American ideology. [4093] Describe the factors that contributed to the beginning of the Cold War and the policy of containment. [4093] Rule: If more than one idea in an objective, combine ideas where possible, or select one for inclusion. CORE Original Objective Understand the arrangement of electrons in electron shells and the importance of valence electrons. Describe common chemical bonds and interactions (polar and nonpolar covalent bonds, ionic bonds, hydrogen bonds, van der Waals interactions, and hydrophobic effects). [2517] CORE Edited Objective Describe common chemical bonds and interactions such as polar and nonpolar covalent bonds, ionic bonds, hydrogen bonds. [2517]

42
science area, the CORE was assigned to Part 1, and Part 2 was focused on the primary science area, e.g., biology, chemistry, etc. The distinction between Parts 1 and 2 were described in the directions to the respondent. Pilot Testing Surveys During March and April 2006 some of the initial draft surveys were pilot tested with staff and students at Shimer College in Waukegan IL. At least one survey form from each content area was completed and discussed with the investigator. The setting was informal, so that faculty and students could participate at their own convenience. The sliding schedule also permitted interviewing each pilot respondent after s/he completed a survey. Interviews with about a dozen Shimer participants led to the following critical changes in the surveys: 1. Decision to use one scale (described below)
2. Decision to continue editing the objectives (described above) 3. Modify directions
Response Scale Initially, each survey would ask two questions of respondents:
• How important is this task in teaching? • How frequently do you use this content in teaching?
During the pilot testing it became clear that the second question was not clear, and
probably could not be clarified sufficiently to cover every situation.27 Frequency was particularly problematic for content that is usually taught once in the course of instruction and not spiraled. A good example of this is the “contributions of Niels Bohr to the field of atomic theory”, excerpted from the chemistry standards. Once that knowledge is taught, it is usually not returned to again, at least not in that course.
A second problem noted with the frequency question, is whether or not the
respondent is answering in terms of the types of classes he/she teaches, e.g., standard chemistry, nursing chemistry, AP chemistry, etc. In an advanced course, one might use certain objectives one or more times, while in a standard course one might use that same objective not at all.
Third, the frequency notion seemed to apply more often to skills that generalize
across objectives and/or content, but not to specific knowledge. Further, a check of the research literature on “Frequency” has seen a re-thinking of this notion, and is being employed far less in task analysis research now than in the past.
27 The Technical Advisory Committee (TAC) had first raised concerns about this scale during the planning phases of the project. Therefore, the authors decided to pilot test the scale in order to make a final determination.

43
Finally, the level of specificity of the objectives in the surveys varied from one statement to another and from one content area to another. The more general statements might be used more frequently, whereas the more specific statements might be employed less frequently. For these reasons, the second scale was dropped and only the “Importance” scale was retained. A four-point Likert scale was used to report the degree of importance to the respondent (1 = very low importance, 2 = low importance, 3 = high importance, 4 = very high importance). The mid-point normally used in a 5-point scale was eliminated to force a positive or negative response on each statement. Data Collection Design The original plan for this study was to collect the data in more than one phase or time period, with the elementary level data collection first, followed by the secondary data, and finally a mix of both elementary and secondary (for certain subjects). This approach seemed to accommodate the standards development process that was also being completed in phases over an 18-month period, and with a number of different outside contractors and groups of content experts. The original validation plan was first developed in the late spring of 2005. Before the study was initiated, hurricane Katrina happened, placing in jeopardy the response and support we anticipated from schools in certain parts of the United States. There were also some unanticipated delays in standards development. In the final analysis, it was decided to draw the sample by the fall of 2006, with all data collection simultaneously occurring after January 2007. The physical design of the surveys themselves was focused on minimizing the amount of paper respondents needed to handle. Each survey was kept to a maximum of four pages, printed on 11” x 17” sheets and folded in half like a booklet. The first page was a full set of directions explaining what the survey was about and how to answer the question being asked. Pages 2, 3, and 4 displayed the statement of objectives. In addition there was a separate scannable form with the responses numbered as in the survey itself. Finally, there was a one-sided Background sheet that contained a small set of demographic questions. The Background sheet, response sheet, and survey were packaged in a manila envelope, marked on the outside with the subject area covered on the survey. The principal or survey administrator at the school level needed only to distribute the manila envelopes to the appropriate subject-area teachers and collect them for the return shipment. Survey Windows and Shipments In order to ensure ease of complying for the schools, eight windows of opportunity were offered to the school to administer the surveys: four weeks in January and February, 2007. These eight windows were available to the first 1300 schools sent letters of invitation. The final 1300 were offered only four to six windows, since their letters did not go out until close to the end of December, 2006.
The materials the school requested were packaged and shipped to arrive one week before the window they selected. For example, if a school selected the fourth week of

44
January, then their package was shipped on Thursday of the second week in January, to arrive no later than Monday of the third week in January, one week in advance of the selected window. This gave the survey administrator time to see that the correct surveys had been shipped, alert and distribute to staff, etc. Quality controls were established so that each shipment was independently checked for accuracy against the requested materials from the school, and for completeness. Samples of all mailing materials appear in Appendix C. Data Analysis Data Entry. Data entry was completed using high-speed scanners. Once the data files were constructed these were converted to Excel files so that computational analysis could be completed. The principal investigators reviewed comments by respondents when they occurred. A sampling of the most salient comment is included in Appendix D. Statistical Analysis. The four-point Likert scale data was analyzed by means and standard deviations, as is typical in task analysis studies. Although the data are technically ordinal rather than interval, it is common to use the mean as a measure of central tendency because it is familiar to so many people and works well with these types of data.
The ranking of one objective over another in terms of survey ratings is not as important as providing a general feel for whether or not the objectives were confirmed through the survey. There were cases of individual objectives appearing in more than one survey (across subject areas), and the data are reported in those few cases as if they were different objectives. If the same objective appeared on more than one survey in the same subject area, the data are combined. In general, all duplicates were reviewed and generally if an objective scored highly on one subject area survey form it scored similarly on the other. There were no cases of the same objective scoring above AND below the 2.5 cutoff which was selected as a general confirmation of importance.
If the American Board is interested in further data analyses of specific objectives or content areas, it would be quite easy to pursue. It may be that certain content areas would score higher or lower by gender or ethnicity, by region of the country, or by type of school, or by the years of experience of the respondent. We did not pursue these comparisons in this report, knowing that validation of the earlier work was the main goal. Of course, we would be happy to conduct additional analyses. However, we have provided the data for the American Board’s pursuit of further analyses. Results
In this section of the report, we focus on the degree to which the objectives that serve as the foundation for the American Board’s testing programs were validated through the surveys of actual teachers in the field. The survey ratings were based on

45
means of individual responses using a four-point Likert scale: 1 = very low importance, 2 = low importance, 3 = high importance, 4 = very high importance.
Testing is always a sampling of knowledge rather than an exhaustive, comprehensive exercise. For this reason, it is especially important that the testing programs are based on objectives that are important. There are a limited number of test questions that can be asked of each candidate, so it follows that the questions should be based on the most important objectives.
The following sections of results summarize for each content area the number of objectives that were addressed in the surveys, and the range of average ratings from the four choices (1,2,3, or 4). Because this study is a validation of the logical analysis used to develop the various tests, an emphasis is placed on changes that the data may suggest, rather than confirmations. Although this approach might seem like looking at the glass as half-empty, it is meant to provide an efficient way of prioritizing content that might need to be revised. In that spirit, the first analysis presented identifies whether any objectives received average ratings of the lowest importance, or 1. Objectives that received average ratings of 2, or low importance, are delineated next. In cases of limited delineations (typically fewer than 25), the specific objectives are listed in the text of the report. In this way, users of the report can quickly view content objectives that were not supported as important by the teachers in the field who responded to the survey.
Appendices E through W to this report provide a complete listing of all the ABCTE content standards that were used as the basis for the surveys. The specific content objectives for EED/MST, Math, General Science, Physics, Chemistry, Earth Science, and World History are listed in decreasing order of importance based on the survey responses for those objectives that received ratings of 2.50 or higher; the remaining objectives are clustered by subdomain for ease in identifying areas of content areas needing attention. The remaining content objectives, including CORE Science, PTK, E/LA, US History, World Geography, Civics and Government, Biology, Special Education, ELL Endorsement, and Reading Endorsement are simply listed in order of decreasing order of importance based on the survey responses, since there were so few content objectives identified as needing attention. It should be noted that the great majority of objectives were confirmed through average survey ratings of high importance (3) or very high importance (4). When objectives were not confirmed through the survey results, the Appendices E through W identify the associated content subdomains. The discussion of these results has been divided into two broad sections, the elementary level and the secondary level, covering in each section those tests that are focused at that level. In the case of English Language Learners (ELL) and Special Education, these tests are discussed at both levels. Professional Teaching Knowledge is discussed at the end of the elementary level, and the CORE Science is discussed at the end of the science subjects in the secondary level.

46
ELEMENTARY LEVEL ASSESSMENTS (K-6) Elementary Education
The Elementary Education surveys measured 510 unduplicated objectives and all (100) of the Professional Teaching Knowledge objectives. As shown in Appendix E, mean ratings ranged from 3.78 to 1.61. None of the Elementary Education objectives received an average rating of the lowest importance (1), but 160 objectives received average ratings that would round to low importance (2). The reader is referred to Appendix E for the full listing of the objectives and their validation ratings. The distribution of the 160 low importance objectives is shown in Table 9. Table 9 Distribution of EEd/MST Low Importance (2) Objectiv es Low Importance Objectives Total Validated Total Percent of Percent Content Subdomain Obj Objectives Number Subdomain Total Reading 143 140 3 2% 0.6% History and Social Science 106 40 66 63 13 Science 113 61 52 46 10 Mathematics 148 109 39 27 8 Total test 510 350 160 ---- 31
Clearly, the history and social science subdomain should be reexamined since almost two-thirds of the objectives were given a ‘low importance’ rating by teachers in the field. Similarly, almost one-half of the science objectives are viewed by teachers the same way. There are also a fair number of objectives with low ratings (about one-fourth of the objectives) in the mathematics subdomain as well.
These discrepancies between what the test measures and what the teachers view
as important could signal a difference of opinion on the definition of an elementary teacher: as primarily a reading teacher versus elementary teacher as a generalist. On the other hand, there may well be some objectives in the subdomains that need attention in the next content standards revision. As the American Board updates the testing program based on this validation, it may consider whether these 160 objectives and the associated subdomains should be re-prioritized, modified, replaced, or eliminated.

47
Reading Endorsement
The Reading Endorsement surveys measured 74 unduplicated objectives and about half of the Professional Teaching Knowledge content standards. As shown in Appendix F, mean ratings ranged from 3.76 to 2.00. None of the Reading Endorsement objectives received an average rating of the lowest importance and only 3 objectives received average ratings that would round to low importance (2). As the American Board updates the testing program based on this validation, it may consider whether these 3 objectives in Figure 2 should be retained. It should be noted that this content area shows excellent confirmation of the previous development work, through average ratings of nearly all the objectives as Important or Very Important.
Figure 2
Reading Endorsement Objectives with Low Importance (2) Average Ratings
Reading Endorsement Identify methods for teaching the meaning of allusions to literary and biblical names and places. [1143] Identify methods for teaching common foreign words and abbreviations. [1142] Compare the entry for a word in a children’s dictionary and in an adult dictionary.
[1144] Special Education (Elementary)
The Special Education Elementary surveys measured 138 unduplicated objectives and about half of the Professional Teaching Knowledge content standards. As shown in Appendix G, mean ratings ranged from 3.79 to 2.49. None of the Special Education objectives received an average rating of the lowest importance and only 1 objective had an average rating that would round to low importance (2). As the American Board updates the testing program based on this validation, it may consider whether this objective in Figure 3 should be retained. It should be noted that this content area shows excellent confirmation of the previous development work, through average ratings of the objectives as Important or Very Important.
Figure 3
Special Education Objective with Low Importance (2) Average Ratings
Special Education – Elementary Discuss the theories and research that form the basis of curriculum development. [1385]

48
ELL Endorsement (Elementary)
The elementary English Language Learners Endorsement surveys measured 145 unduplicated objectives. As shown in Appendix H, mean ratings ranged from 3.88 to 2.13. None of the English Language Learners objectives received an average rating of the lowest importance and only 3 objectives received average ratings that would round to low importance (2). As the American Board updates the testing program based on this validation, it may consider whether the objectives listed in Figure 4 should be retained. It should be noted that this content area shows excellent confirmation of the previous development work, through average ratings of the objectives as Important or Very Important.
Figure 4
ELL/Elementary Objectives with Low Importance (2) Average Ratings
ELL – Elementary Understand the demographic trends related to the cultural and linguistic diversity of the United States. [1620] Understand the processes test developers use to eliminate test bias. [1557] Understand why dialectical, historical, and social language variations evolve. [1520] Professional Teaching Knowledge
The Professional Teaching Knowledge content standards were measured on three elementary content area surveys, Elementary Education (MST), Reading Endorsement, and Special Education, and three secondary content area surveys, English/Language Art, Mathematics, and Special Education. The intention was to measure as many PTK objectives as possible in tandem with some elementary and/or secondary content areas. All PTK objectives were included in the EED (MST), E/LA, and Math surveys, approximately half on the Reading Endorsement surveys, and the remaining half of the Special Education surveys.28
There are 99 unduplicated PTK objectives. As shown in Appendix I, the mean
ratings ranged from 3.89 to 2.71. None of the Professional Teaching Knowledge objectives received an average rating of the lowest importance (1), nor did any objectives have average ratings that would round to low importance (2). This validation process virtually confirmed all 99 content standards in the area of Professional Teaching Knowledge. It should be noted that this content area shows excellent confirmation of the previous development work, through average ratings of the objectives as Important or Very Important.
28 It should be noted that some PTK responses were omitted by respondents on the content area surveys. The most egregious omission was in the Special Education area. It is hypothesized that teachers in this area do not see the relevance of the PTK objectives to special populations.

49
SECONDARY LEVEL ASSESSMENTS (6-12) English/Language Arts
The English/Language Arts surveys measured 116 unduplicated objectives and all (99) of the Professional Teaching Knowledge content standards. As shown in Appendix J, mean ratings ranged from 3.83 to 2.21. None of the English/Language Arts objectives received an average rating of the lowest importance (1) and only 6 objectives had average ratings that would round to low importance (2). As the American Board updates the testing program based on this validation, it may consider whether these 6 objectives listed in Figure 5 should be retained. It should be noted that this content area shows excellent confirmation of the previous work, through average ratings of the objectives as Important or Very Important.
Figure 5
English/Language Arts Objectives with Low Importance (2) Average Ratings
English/Language Arts Recognize arguments that are usually identified as logical fallacies, such as ad hominem.
[2027] Identify sources of logical fallacies present in oral addresses, e.g., straw man argument. [2075] Know the meaning of common abbreviations such as “i.e.” and “e.g.” [2066] Explain foreign language phrases commonly used in English, e.g., coup de grace. [2010] Use knowledge of Greek and Roman mythology, the Bible, and other works to understand the meaning of words. [2002] Recognize traditional rules and formats of debate. [2077] Mathematics
The Mathematics surveys measured 156 unduplicated objectives, and all (99) Professional Teaching Knowledge content standards. As shown in Appendix K, the mean ratings ranged from 3.89 to 1.58. None of the mathematics objectives received an average rating of the lowest importance (1), but there were 79 objectives that had average ratings that would round to low importance (2). The reader is referred to Appendix K for the full listing of the objectives and their validation ratings.
Table 10 Distribution of Secondary Mathematics Low Importance (2) Objectives

50
Low Importance Objectives Total Validated Total Percent of Percent Content Subdomain Obj Objectives Number Subdomain Total Mathematical Reasoning 7 5 2 29% 1 % Probability & Statistics 12 9 3 25 2 Number Sense 25 21 4 16 3 Geometry & Measurement 22 17 5 23 3 Algebra & Functions 31 22 9 29 6 Linear Algebra 14 2 12 86 8 Trigonometry 15 1 14 93 9 Calculus 30 0 30 100 19 Total test 156 77 79 --- 51 Three of the eight subdomains, linear algebra, trigonometry, and calculus, have large numbers of objectives that were rated of “low importance” and probably need attention. The objectives in these three subdomains constitute 39% of the assessment objectives. The remaining five subdomains have few objectives that were rated “low” in importance by survey respondents. As the American Board updates the testing program based on this validation, it may consider whether these low importance objectives should be re-prioritized, modified, replaced, or eliminated. General Science
The General Science surveys measured 215 unduplicated objectives from General Science and about half of the CORE Science objectives. As shown in Appendix L, mean ratings ranged from 3.75 to 1.38. Four of the general science objectives shown in Figure 6 received an average rating of the lowest importance (1).
Figure 6
General Science Objective with Very Low Importance (1) Average Rating
General Science Objectives

51
Describe Oersted’s experiment. [2901] State the essential qualitative nature of Faraday’s law. [2902] Add forces vectorially in two dimensions, using trigonometric relations to calculate components. [2861] Describe the use of the free-body diagram in analyzing the net force acting on a body. [2862]
In addition, there were 75 General Science objectives and 2 CORE objectives that
had average ratings that would round to low importance (2). The reader is referred to Appendix L for the full listing of the objectives, the subdomain areas, and their validation ratings. Table 11 shows the distribution of the 81 objectives by subdomain rated low and very low in importance by survey respondents. Table 11 Distribution of General Science Very Low (1) and Low Importance (2) Objectives Low/Very Low Imp Objectives Total Validated Total Percent of Percent Content Subdomain Obj Objectives Number Subdomain Total CORE 56 54 2 xxx xxx29 Chemistry 20 10 10 50 4% Earth Science 72 59 13 18 5 Biology 64 43 21 33 8 Physics30 59 24 35 59 13 Total test 271 190 81 --- 30 Fifty-six out of 81 (70%) low or very low importance objectives were in two subdomains, namely, biology and physics. There is also an imbalance in the number of objectives in each subdomain, with a heavy emphasis on earth science, and fairly light coverage of chemistry. As the American Board updates the testing program based on this validation, it may consider whether these low/very low importance objectives should be re-prioritized, modified, replaced, or eliminated.
29 Percent of subdomain and total are not estimated since not all CORE objectives were measured 30 The four general science objectives given the lowest rating were also in the subdomain of physics.

52
Biology
The Biology surveys measured 126 unduplicated Biology objectives, and about half of the CORE Science. As shown in Appendix M, mean ratings ranged from 3.87 to 2.06. None of the Biology objectives received an average rating of the lowest importance (1) and only 2 CORE and 7 Biology objectives had average ratings that would round to low importance (2). As the American Board updates the testing program based on this validation, it may consider whether these low importance objectives should be re-prioritized, modified, replaced, or eliminated. It should be noted that, overall, this content area shows excellent confirmation of the previous development work, through average ratings of the objectives as Important or Very Important.
Figure 7
Biology Objectives with Low Importance (2) Average Ratings
Biology and Core Objectives CORE - Know how rocks are classified according to their origins. [2573] CORE - Relate wavelength, frequency, propagation speed, and energy of waves. [2591] Classify molecules, for example as alcohols, ketones, or organic acids. [3003] Understand the function of bacterial operons and how they are regulated. [3045] Understand pH effects on the ionization of carboxylic acids and amines. [3005] Describe alpha, beta, and gamma radioactive decay. [2567] Explain competitive and allosteric enzyme kinetics and Michaelis-Menten graphs. [3014] Describe prezygotic and postzygotic isolating mechanisms and how they affect speciation [3060] Describe the classical experiments carried out by researchers such as Hammerling. [3039] Chemistry
The Chemistry surveys measured 105 unduplicated Chemistry objectives and about half of the CORE Science. As shown in Appendix N, the mean ratings ranged from 3.86 to 1.6. None of the biology objectives received an average rating of the lowest importance (1), but there were 25 objectives with average ratings that would round to low importance (2), listed in Figure 8.

53
Figure 8
Chemistry Objectives with Low Importance (2) Average Ratings
Chemistry and Core Objectives CORE - Understand latent heat. [2562] Use Henry's law to predict concentrations of gases in solution. [3450] Use the Clausius-Clapeyron equation to calculate vapor pressure or heat of vaporization. [3467] Identify and describe the general properties of the hydrides. [3502] Use Graham's law to calculate the molecular mass and/or relative rates of effusion of two different gases. [3458] Understand the use of sp hybridizations for molecular geometry of organic and inorganic compounds. [3507] Use the Nernst equation to calculate the emf of a cell. [3439] Explain the Coulomb repulsion of the protons in an atomic nucleus. [3485] Use a table of standard reduction potentials to set up a voltaic cell and calculate its emf. [3438] Compare the factors involved in electrolysis of molten salts and diluted solutions. [3524] Use mass and charge to balance nuclear reaction equations. [3544] Using a standard hydrogen electrode, explain the measurements of standard reduction potentials to produce electrochemical series. [3521] Outline the formation and mechanism of the production of dipeptides and esters. [3542] State the properties of the mass spectrometer and the main stages in its operation. [3404] Understand the structures of polymers, such as polysaccharides, and how they are built by condensation of monomers and degraded through a process of hydrolysis. [3479] Given a reaction mechanism and an experimental rate law, identify the reaction intermediates and determine if the mechanism is consistent with the experimental rate law. [3517] Use Raoult's law to calculate the vapor pressure over a solution containing a nonvolatile solute and one containing two volatile liquids. [3451] Perform calculations based on the line spectrum of hydrogen. [3504] Write condensed line structures of organic molecules. [3473]
Understand the use of the Arrhenius equationaE
RTk Ae−
= andln( ) ln( )aE
k ART
−= +
. [3514] Understand the relationship between cell potential, electric work, and free energy in terms of the equations w = -qE and ∆G = -nFEθ. [3519]
Use to find the equilibrium constant (KC or KP) for solutions or gases. [3536] Predict the products and write balanced chemical equations for the dehydrogenation and cracking (splitting) of alkanes. [3476] Understand the Daniell cell. [3518]

54
Chemistry and Core Objectives Predict the products and write balanced chemical equations for electrophilic substitution reactions of benzene. [3541]

55
Two subdomains stand out, namely, electrochemistry (6 low importance objectives), and organic chemistry (5 low importance objectives). The remaining 10 subdomains had only one or two objectives in each subdomain with low ratings. As the American Board updates the testing program based on this validation, it may consider whether these 25 objectives should be re-prioritized, modified, replaced, or eliminated. Preliminary development work in this content area does not appear to be well-supported by the survey results. Earth Science
The Earth Science surveys measured 146 unduplicated Earth Science objectives and about half of the CORE. As shown in Appendix O, the mean ratings ranged from 3.88 to 1.45. Only one of the earth science objectives received an average rating of the lowest importance (1) shown in Figure 9, but there were 42 Earth Science objectives and 11 CORE objectives that had average ratings that would round to low importance (2).
Figure 9
Earth Science Objective with Very Low Importance (1) Average Rating
Earth Science Objective
Calculate relativistic Doppler shifts using the formula
( )( )
2
2
'/ 1,
'/ 1V c
λ λλ λ
−=
+. [3206]
Table 12 Distribution of Earth Science Low Importance (2) Objectives Low Importance Objectives Total Validated Total Percent of Percent Content Subdomain Obj Objectives Number Subdomain Total CORE 50 39 11 xxx xxx31 Astronomy & Cosmology 15 7 8 53 4 Structure & Composition 25 18 7 28 4
31 Percent of subdomain and total are not estimated since not all CORE objectives were measured.

56
Magnetic Field 36 24 12 33 6 History of Earth 13 8 5 38 3 Earth’s Atmosphere 28 22 6 21 3 Earth’s Water 21 17 4 19 2 Earth Resources & Hazards 8 8 0 0 0 Total test 196 143 53 --- 27
The distribution of the 53 low importance objectives is shown in Table 12. The largest low importance percentages fall into two areas, namely CORE and magnetic fields.
As the American Board updates the testing program based on this validation, it
may consider whether these low importance objectives should be re-prioritized, modified, replaced, or eliminated. Preliminary development work in this content area does not appear to be well-supported by the survey results. Physics
The Physics surveys measured 105 unduplicated Physics objectives and about half of the CORE Science. As shown in Appendix P, mean ratings ranged from 3.80 to 1.58. None of the physics objectives received an average rating of the lowest importance (1), but there were 29 Physics objectives and 11 CORE objectives that had average ratings that would round to low importance (2). The distribution of the low importance objectives are listed in Table 13 by subdomain. Table 13 Distribution of Physics Low Importance (2) Objectives Low Importance Objectives Total Validated Total Percent of Percent Content Subdomain Obj Objectives Number Subdomain Total CORE 51 40 11 22% 7% Kinematics & Dynamics 8 8 0 0 0

57
Work/Energy/Power/Momentum 10 10 0 0 0 Rotational Motion 5 2 3 60 2 Universal Gravitation 3 2 1 33 <1 Mechanics of Fluids 6 2 4 67 3 Thermodynamics 11 8 3 27 2 Waves 7 6 1 14 <1 Electrostatics 7 4 3 45 2 Electric Currents 8 6 2 25 1 Magnetism 6 4 2 33 1 Laws & Equations 7 3 4 57 3 Geometrical Optics 9 9 0 0 0 Physical Optics 5 2 3 60 2 Modern Physics 13 10 3 23 2 Total test 156 116 40 --- 26 Although the subdomains appear scattered, a number of them could be clustered together. For example, electrostatics, electric currents, magnetism, and laws and equations have 11 low importance objectives. The CORE also has 11 low importance objectives. These areas should be examined carefully in any revisions of the assessment frameworks. As the American Board updates the testing program based on this validation, it may consider whether these low importance objectives should be re-prioritized, modified, replaced, or eliminated. Preliminary development work in this content area does not appear to be well-supported by the survey results. CORE Science
The ABCTE CORE Science standards include 98 unduplicated CORE Science objectives, although only 87 were measured on the five science subject area surveys. As shown in Appendix Q, average mean ratings ranged from 3.85 to 2.00 None of the CORE Science objectives received an average rating of the lowest importance (1), and

58
only eight objectives had average ratings that would round to low importance (2).32 As the American Board updates the testing program based on this validation, it may consider whether these low importance objectives should be eliminated.
Figure 10
CORE Science Objectives with Low Importance (2) Average Ratings
CORE Science Objectives Basic Biology Know how Mendel pioneered the use of quantitative methods in genetics. [2524] Basic Chemistry Understand the mole concept and the significance of Avogadro’s number. [2550] Understand latent heat. [2562] Describe alpha, beta, and gamma radioactive decay. [2567] Know that naturally occurring isotopes can be stable or unstable. [2566]
Basic Earth Science Know the principles, uses and limitations of radiometric dating. [2578]
Basic Physics
Explain how electromagnetic radiation of various wavelength ranges interacts with living tissue. [2590]
Explain the electrostatic charge on the macroscopic scale. [2589]
32 In this section we are treating the CORE science as if it were an independent content area. The ratings listed above and in Appendix Q represent the mean of all ratings received by each CORE objective taken from as many as five different science surveys, or as few as one. The ratings received by any one CORE objective in any single science content area can be viewed in the Appendix associated with that content area. For example, see Appendix P for the CORE objectives that appeared in the Physics surveys, and the ratings that Physics respondents gave those CORE objectives.

59
U.S. History
The U.S. History surveys measured 136 unduplicated objectives33. As shown in Appendix R, mean ratings ranged from 3.85 to 1.67. None of the U.S. History objectives received an average rating of the lowest importance (1) and only 10 objectives had average ratings that would round to low importance (2). As the American Board updates the testing program based on this validation, it may consider whether these 10 objectives should be eliminated.
Figure 11
U.S. History Objectives with Low Importance (2) Average Ratings
U.S. History Objectives Describe the effect of the First Great Awakening and its significance in the development of the colonies. [4020] Describe Clay’s “American System” and its effects on the national market economy. [4046] Describe the major policies of the Bill Clinton presidency. [4108] Analyze the scientific advances that prompted exploration to the New World in the late 15th century. [4003] Analyze the economic trade system between the Far East and the New World. [4003] Describe the major policies of the Ronald Regan presidency. [[4106] 34 Describe the candidates, issues, and significance of the presidential election of 1896. [4071]35 Describe the major policies of the Jimmy Carter presidency. [4105] 36 Assess the significance of the Turner Thesis. [4068] Describe the early explorations of the New World by the Vikings. [4002]
33 There are 92 ABCTE US History content standards. However, in coding the standards for inclusion in the surveys, some standards were judged to contain materially different content within a single standard. Therefore, for purposes of the survey, 22 ABCTE standards were subdivided into 44 unique standards, resulting in a total count of 136 objectives. Objective [4003] listed in Figure 11 is an example of this situation. 34 [4106] was one of the 22 standards that were subdivided. In the surveys, one was rated > 2.50. 35 Ibid. for [4071] 36 Ibid. for [4105]

60
World History
The World History surveys measured 104 unduplicated objectives37. As shown in Appendix S, mean ratings ranged from 3.67 to 1.90. None of the World History objectives received an average rating of the lowest importance (1), but there were 39 objectives that had average ratings that would round to low importance (2).
Table 14 shows the distribution of the 39 objectives by subdomain rated of low importance by survey respondents. The largest number of objectives falls into two subdomains covering the earliest historical periods. These 39 low importance objectives should be examined carefully in any reviews of this subject area. As the American Board updates the testing program based on this validation, it may consider whether these 39 objectives should be re-prioritized, modified, replaced, or eliminated. Survey results for this content area did not confirm the findings of earlier work. Table 14 Distribution of World History Low Importance (2) Ob jectives Low Importance Objectives Total Validated Total Percent of Percent Content Subdomain Obj Objectives Number Subdomain Total Prehistory to Ancient 16 4 12 75% 12% Classical Civilizations 24 13 11 46 11 Postclassical Era 15 8 7 47 7 Early Modern Times 14 9 5 36 5 Long 19th Century 16 12 4 26 4 Global 20th Century 19 19 0 0 0 Total test 104 65 39 --- 38
37 There are 93 ABCTE World History content standards. However, in coding the standards for inclusion in the surveys, some standards were judged to contain materially different content within a single standard. Therefore, for purposes of the survey, 11 ABCTE standards were subdivided into 22 unique standards, resulting in a total count of 104 objectives.

61
Civics and Government
The Civics and Government surveys measured 85 unduplicated objectives. As shown in Appendix T, mean ratings ranged from 3.92 to 2.29. None of the Civics and Government objectives received an average rating of the lowest importance (1) and only 6 objectives had average ratings that would round to low importance (2), listed in Figure 12. As the American Board updates the testing program based on this validation, it may consider whether these low importance objectives should be re-prioritized, modified, replaced, or eliminated.
Figure 12
Civics and Government Objectives with Low Importance (2) Average Ratings
Civics and Government Objectives Distinguish between ideological dispositions, such as conservatism, socialism, totalitarianism. [4610] Describe the tools used to carry out U.S. foreign policy. [4672] Describe the Idealist vs. Realist schools of foreign policy. [4673] Explain the operation of “sub governments” or “iron triangles” in influencing public policy. [4649] Describe key special interest groups that have organized around economic or social issues. [4648] Explain the competing views of major economic thinkers and how they have affected U.S. economic policy. [4664] World Geography
The World Geography surveys measured 87 unduplicated objectives. As shown in Appendix U, mean ratings ranged from 3.54 to 2.27. None of the world geography objectives received an average rating of the lowest importance (1) and only 5 objectives had average ratings that would round to low importance (2), listed in Figure 13. As the American Board updates the testing program based on this validation, it may consider whether these 5 objectives should be re-prioritized, modified, replaced, or eliminated. It should be noted that this content area shows excellent confirmation of the previous development work, through average ratings of the objectives as Important or Very Important.
Figure 13
World Geography Objectives with Low Importance (2) Average Ratings

62
World Geography Objectives Explain the factors contributing to the major spatial variations in Earth’s biosphere.
[4816] Know the characteristics of the Sub-Saharan Africa’s settlement patterns and population.
[4830] Explain the key historical geographical elements of Australia and Oceania. [4838] Know the characteristics of Australia and Oceania’s settlement patterns and population.
[4836] Trace the history of geography, including developments in cartography. [4803]

63
Special Education (Secondary)
The Special Education surveys measured 138 unduplicated objectives and about half of the Professional Teaching Knowledge content standards. As shown in Appendix V, mean ratings ranged from 3.81 to 2.54. None of the Special Education objectives received an average rating of either lowest importance (1), or low importance (2). It is worth noting that all of the Secondary Special Education objectives received ratings that averaged to Important or Very Important – confirming the earlier development work. ELL Endorsement (Secondary)
The secondary English Language Learners Endorsement surveys measured the same 145 unduplicated objectives as at the elementary level. As shown in Appendix W, mean ratings ranged from 4.00 to 1.25. Only one of the English Language Learners objectives received an average rating of the lowest importance (1) listed in Figure 14.
Figure 14
ELL Secondary Objective with Very Low Importance Average Rating
English Language Learners - Secondary Understand why dialectical, historical, and social language variation evolve. [1520]
There were 24 objectives that had average ratings that would round to low importance (2). This is substantially more than the 3 at the elementary level. Table 15 displays the distribution of the low importance objectives by subdomain. Table 15 Distribution of Secondary ELL Low Importance (2) Objectives Low Importance Objectives Total Validated Total Percent of Percent Content Subdomain Obj Objectives Number Subdomain Total Language Structure & Use38 37 27 11 27% 7% Language Development 12 10 2 17 1
38 The one secondary ELL objective given the lowest rating was in the subdomain of language structure and use.

64
Assessment of ELL 17 15 2 12 1 EL Literacy Development 29 27 2 7 1 Approaches & Methods 13 13 0 0 0 Culture/Cultural Diversity 20 14 6 30 4 Culturally Inclusive Instruction 17 15 2 12 1 Total test 145 120 25 --- 17
It should be noted that the largest percentages of low importance objectives fall into two subdomains, namely, language structure and use and culture and cultural diversity. It is hypothesized that teachers of older ELL students do not emphasize beginning language structure and use and cultural diversity. Therefore, they do not judge these as important to their repertoire of teaching knowledge and skills.
Figure 15 lists the 25 low importance objectives. As the American Board updates
the testing program based on this validation, it may consider whether these objectives should be re-prioritized, modified, replaced, or eliminated. It appears as though there are substantial differences in some areas between elementary and secondary teachers of ELL and those differences should be considered in any revisions. Preliminary development work in this content area at the secondary level does not appear to be well-supported in some subdomains by the survey results.

65
Figure 15
ELL Secondary Objectives with Low Importance (2) Average Ratings English Language Learners Objectives – Secondary Identify factors that influence an author’s choice of language variation. [1521] Address difficulties learners may encounter with regional dialects or other varieties of English. [1522] Demonstrate knowledge of federal requirements for program implementation (e.g., NCLB, Title III; IDEA). [1568] Address learners' difficulties related to phonology and morphology. [1508]
Analyze text structures of different genres with respect to their language function. [1529] Understand sociocultural and political factors affecting second-language development. [1548] Acquire in-depth knowledge of English language learners' home cultures and experiences. [1632] Identify pragmatic features of various discourse settings in English. [1533]
Identify and address cultural and linguistic bias in student assessment. [1556]
Use a variety of multicultural materials for language and content-area learning. [1593]
Understand the stages and associated features of acculturation. [1617]
Use knowledge of cultural diversity to provide effective instruction and equitable access to English learners. [1623] Identify dialectical, historical, and social variations that occur in a language. [1519]
Identify factors that affect a speaker's or writer's choice of pragmatic features. [1534]
Understand features of English morphology and word formation. [1505]
Analyze the significance of contemporary theories of language acquisition for teaching and learning. [1538] Understand the differences among various processes of cultural contact. [1615] Understand current trends and features of migration and immigration in the United States. [1621] Demonstrate understanding of features, goals, and outcomes of multicultural curriculum reform. [1641] Understand the processes test developers use to eliminate test bias. [1557]
Analyze how English aural comprehension and pronunciation are affected by the primary language. [1502] Understand the demographic trends related to the cultural and linguistic diversity of the United States. [1620] Understand historical and contemporary perspectives on multicultural education. [1612]

66
Discussion
The results of the validation study vary considerably by content area. The preliminary development work in some content areas was confirmed by the survey ratings of Importance, but was not well-supported in other content areas. The table below shows a rough indicator of validation as defined by the percentage of objectives that received average ratings that would round to ratings of Important or Very Important. The table presents the content areas in order of validation. Table 16 Validation Defined as Percent of Objectives Confirmed Important or Percent of Very Important Objectives Subject Area Objectives/Total Confirmed Professional Teaching Knowledge 99/99 100% ELEMENTARY LEVEL Special Education 137/138 99 English Language Learners 142/145 98 Reading Endorsement 71/74 96 Elementary Education (MST) 350/510 68 SECONDARY LEVEL Special Education 137/138 99 Biology 168/177 95 English/Language Arts 110/116 95 World Geography 82/87 94 U. S. History 126/136 93 Civics and Government 79/85 93 CORE 78/87 90
Chemistry 131/156 84 English Language Learners 120/145 83 Physics 116/156 74 Earth Science 143/196 73 General Science 190/271 70 World History 65/104 63 Mathematics 77/156 49
The American Board might reflect on these findings to prioritize updating any
testing content based on the validation study results. There are content areas with excellent support for the preliminary development work, as seen in Professional Teaching Knowledge, Elementary Special Education, English Language Learners, and Reading; and Secondary Special Education, Biology, English Language Arts, World Geography, U.S. History, Civics and Government.

67
Findings are clearly supportive, but may warrant a second look in the Secondary
areas of Chemistry and English Language Learners. The science areas in general were not among the highly confirmed content areas – and this appears to be true whether one is looking at specific content or core. Finally, there is a surprising lack of confirmation in the areas of World History, Mathematics, and Elementary Education. Caveats As in any piece of research, but especially field-based research, there are caveats that need to be explicitly stated. First, among the 15 content areas there are few that have large populations of teachers in any one school, the exception being elementary education, secondary English/Language Arts and mathematics. This obviously impacted the numbers of respondents in those content areas. In some cases, for example, the secondary sciences (except general science), had few respondents. Sparse data should be interpreted very cautiously. Second, this was essentially a “volunteer” sample. Even though the schools were randomly selected to be representative of the nation, whether or not a principal did allow, or could allow, teachers to respond to the surveys, largely depended on district policies regarding such requests, goodwill, altruism, and the school’s need of the honorarium. Third, the data may have been improved by targeting teachers who have training, experience, and/or certification in the content area being surveyed. There is no guarantee that the respondents to the chemistry surveys were trained, experienced, and certified teachers in the field of chemistry. Fourth, the responses of teachers is influenced by the kinds of students they teach, or have taught, the kind of curriculum in place in their respective schools, or state, the high school graduation requirements in their district, state, and other perhaps unknown influences. Larger responding sample, of course, capture all of this on average. However, in smaller samples there could be anomalies that bias the responses in one way or the other.

68
Recommendations
An initial step in digesting these results could be to examine documentation from the development of the test specifications for the content areas that did not receive high percentages of confirmation, to see whether all the objectives were indicated for testing. As this report mentioned earlier, there were cases of test development committees eliminating objectives from consideration based on their unsuitability for testing within a multiple-choice framework.
The findings suggest a prioritization of content areas that might benefit from revision, but the American Board will want to balance the data priorities with test usage. It may be that some content areas are testing many candidates, and the updates will have most influence in the high usage areas. Once an area is selected to study for revision, the content standards committee might consider where the low-rated objectives fit within the test specifications. Do the validation results suggest the elimination or reduction in emphasis of any content subdomains from the standards and the test specifications? For example, in mathematics we see an unequal distribution of objectives that were not supported through importance ratings across domains of content. Calculus, trigonometry, and linear algebra show numerous objectives that were not supported, while measurement and mathematical reasoning have only one or two. A review of the content subdomains associated with objectives that were not supported through importance ratings in Appendices E through W will provide guidance in prioritizing the subdomains within a content area. A trickle-down effect would be in place if any objectives were removed from the compiled content standards and test specifications; there are likely corresponding test items that would also be removed from the item pool. Similarly, any candidate information materials would need to reflect the modified content domains.
At a minimum, the following specific recommendations are offered as a guide for prioritizing future revisions based on these data. For the elementary level assessments:
9. Elementary Education (MST) should be reevaluated in the light of NCLB. With the heavy emphasis in classrooms on reading and mathematics those areas should receive the highest priority for being fully comprehensive and rigorous. The social sciences and science should be reviewed placing more emphasis on critical and essential knowledge and skills in these areas.
For the secondary level assessments:
10. Secondary Mathematics. As mentioned above, this content area has three subdomains that should be re-evaluated, namely, linear algebra, trigonometry, and calculus. Since this assessment covers 6 through 12, the advisability of having these three subdomains account for 39% of assessment is questionable. One approach might be to limit coverage in these three areas to no more than 20% of the assessment. A second approach might be to create a new assessment

69
specifically for teachers of middle school (usually some combination of grades 5 – 9). Content specialists in the target grade levels could assist in limiting and re-prioritizing all subdomain content that would be customized for teachers in those specific grades.
11. World History. Again, two subdomains covering the earliest periods (about 40%
of the assessment) are the least validated components of the assessment. A more even distribution of content across all subdomains would alleviate if not eliminate this problem.39
12. General Science. This is a content area with a lot of ground covered. However,
in attempting to do so, the assessment developed a serious flaw, namely, heavy emphasis in three subdomains, physics, biology, and chemistry. While this content indeed should be covered in a General Science classroom, the real question is at what level of rigor. The assessment appears balanced in the earth science area, and even in the CORE area, but not in the three named subdomains. Again re-prioritizing the content and repairing the table of specifications is highly recommended.
13. Earth Science. One-third of the content in the subdomain Magnetic Fields
should be reviewed. Similarly, a number of CORE objectives were not highly rated. ABCTE should re-examine at least the primary offending subdomain. There were some initial discussions of eliminating the CORE as a subset of any of the science areas. Therefore, this report will not focus on suggested repairs in this area.
14. Physics. This content area resulted in being less well validated than some others
primarily due to the inclusion of CORE science as part of the assessment. If the CORE is not counted, then less than 20% of the assessment is problematic. However, the offending subdomain areas should be reviewed to see if there are any objectives that could be eliminated without doing a disservice to the overall quality and rigor of the assessment.
15. English Language Learners (Secondary). Why the ELL results are much
better at the elementary than secondary level is not known. Experience would suggest that ELL teachers in 6-12 are engaged in different teaching behaviors and therefore require a different skill set than ELL teachers in K-6. The obvious fix is to separate the two levels and create two separate assessments. However, in a low-density subject area this may require more resources than the agency would want to devote to this activity. In lieu of this approach, perhaps simply reviewing
39 An independent observation while conducting the standard setting in this area is that in an effort to maintain neutrality with respect to a Eurocentric approach to world history, the pendulum seems to have swung quite far in the other direction with a heavy emphasis on Asia in general, and China in particular. The item pool has a plethora of items in this category.

70
the two offending subdomains, language structure and use, and culture and cultural diversity, would allow a modest and less resource-intensive repair.
16. Chemistry. Two subdomains, electrochemistry and organic chemistry should be
reviewed to see if the breadth and depth of content being required is appropriate.
In summary, 11 content areas have confirmation rates at the 90% or higher. These areas could be reviewed as they cycle through the long-range plan for revising the ABCTE assessments.
The remaining eight content areas need more immediate attention. The recommendations above suggest each area in need, and are listed in priority order.