task 4a: full-scale laboratory tests of repaired...
TRANSCRIPT

TxDOT Project 0-6731
Repair Systems for Deteriorated Bridge Piles
Technical Memorandum #4a
Task 4a: Full-scale laboratory tests of repaired piles
Prepared By:
Mina Dawood – Research Supervisor, UH
Hossein Karagah– Research Assistant, UH
Cheng Shi – Research Assistant, UH
Reviewed By:
Abdeldjelil Belarbi – Researcher, UH
Cumaraswamy Vipulanandan – Research, UH
May 2015
1 OBJECTIVE AND OVERVIEW The objective of this task was to evaluate three different repair systems, one steel-based and two FRP-based systems, to restore the axial capacity of corroded steel bridge piles to the initially designed capacity. To this end, three groups of seven 15-ft. long HP12×53 steel piles were tested under axial compression. The piles in each group had the same simulated corrosion patterns to the corroded control piles that were tested in Task #4 (Dawood et al., 2014). The effect of corrosion was simulated by milling the flanges and webs to reduce their thicknesses. The following sections of this report describe the design considerations and fabrication process of the test specimens, test results, comparison, and conclusions.
2 TEST SPECIMENS
2.1 Design Approach Figure 1 illustrates the design approach that was adopted to design the steel piles that were tested in the current study. The figure represents the nominal axial load, normalized relative to the nominal capacity of the uncorroded pile, P/Pn,u, for different degrees of flange corrosion for a 15 ft. long, HP12×53. The degree of web corrosion is constant and equal to 20%. This pile configuration and corrosion pattern were selected for illustrative purposes. However, the design approach is broadly applicable to different pile geometries and corrosion patterns. The solid horizontal line indicates the calculated nominal capacity of the uncorroded pile, Pn,u, based on flexural buckling which was calculated using the American Association of State Highway and Transportation Officials (AASHTO) Load and Resistance Factor Design (LRFD) Bridge Design Specifications (2012). The target of the retrofit is to restore this capacity. The solid curve at the bottom of the figure is the nominal capacity of the corroded pile, Pn,c, calculated using the American Iron and Steel Institute (AISI effective width method (AISI-EWM). The dotted diagonal line shows the yield capacity of the corroded section, Py,c. This represents the theoretical maximum capacity that can be achieved by restraining local and flexural buckling of the corroded pile.
The vertical dashed line in the figure indicates that for piles with 20% corrosion of the web and less than 30% corrosion of the flanges, the retrofitting target can be achieved by restraining local and flexural buckling of the corroded pile. Restraining local buckling of the flanges and the web can be practically achieved using FRP and steel based repair systems. However, flexural buckling cannot be practically prevented using these systems. Therefore, to achieve the retrofitting target, the flexural buckling capacity of the repaired pile should be restored to a level at least equal to that of the uncorroded pile, Pn,u. This can be achieved by restoring the flexural stiffness of the repaired pile to the same level as that of the uncorroded pile. That is the flexural rigidity, EI, of the repaired pile should be at least equal to that of the original uncorroded pile.
In contrast, in the region to the right of the vertical line in Figure 1, that is, for piles with 20% corrosion of the web and more than 30% corrosion of the flanges, the yield capacity of the corroded section is less than the retrofitting target. Therefore, load must be transferred from the corroded pile to the repair system above the corroded region and back into the pile below the corroded region. This load transfer can be achieved by chemical bond, mechanical anchorage, or friction. Additionally, the flexural rigidity of the pile should be restored to that of the uncorroded pile to ensure that the global flexural buckling capacity of the repaired pile is adequate.
This design approach was adopted to design the repair systems for the piles that were tested in the current study. The details of the implementation of this approach depend on the type of system being installed (either steel-based or FRP-based). The design of the repair systems is described in detail in the following sections.
Page 1 of 41

Figure 1: Design Philosophy That Was Adopted to Design the Retrofitting Systems
2.1.1 Steel-Based Repair System The steel-based repair system consisted of six steel plates, two main plates and four clamping plates. Three plates were installed on each flange as illustrated in Figure 2. The plates were coated with two coatings: one layer of a solvent-based, inorganic ethyl silicate, zinc-rich coating; and one layer of a non-zinc containing, Class B-rated, polyamide epoxy coating. These coatings provide corrosion protection and slip resistance as summarized in Technical Memorandum #2. The main plates were placed on the outer surfaces of the flanges while the clamping plates were installed on the inner faces of the flanges as shown. Clamping forces were achieved using high strength A325 bolts. Load is transferred to the main plates of the repair system through friction over a development length, Ld, on either end of the corroded region. The load that is required to be transferred to the repair system, Pn,r, is:
Pn,r = Pn,u – Pn,c
Figure 2: Friction-type Bolted Plates Repair System
0.0
0.2
0.4
0.6
0.8
1.0
1.2
0 20 40 60 80 100
Nor
mal
ized
Axi
al C
apac
ity
(P/P
n,u)
Loss of Flange Thickness (%)
Py,c/Pn,u
Pn,c/Pn,u
20% web loss
Retrofitting target (nominal strength of uncorroded pile)
Yield capacity of corroded section
Nominal strength of corroded pile
Lc Ld Ld
Clamping plates
Main plate
Pretensioned high-strength bolts
Page 2 of 41

• Size, Number, and Spacing of Bolts Based on the calculated friction force needed to transmit the excess load to the repair system, Pn,r, and the coefficient of friction or surface condition factor, Κs, between the new coated steel plates and the corroded pile flanges, the size and number of bolts was calculated (AASHTO, 2012). The surface condition factor was determined to be 0.34 from the coefficient of friction tests described in Technical Memorandum #2. Therefore, the required number of bolts within each development length is:
Nb = Pn,r / Rn
Rn = Kh Ks Ns Pt
where Κh is the hole size factor, Κs is the surface condition factor (also called the coefficient of friction), Ns is the number of slip planes per bolt, and Pt is the minimum required bolt tension. According to the minimum spacing and clear distances specified in AASHTO (2012), to ensure sufficient space for installation the bolt spacing, s, is limited to:
s ≥ 3D, for standard holes;
s ≥ 2D+d, for oversize or slotted holes.
where D is the bolt diameter and d is the hole diameter. For built-up members connected by tightened bolts, the pitch of stitch bolts should not exceed 12t to ensure that the parts act as a unit and prevent buckling in compression members:
s ≤ 12t
where t is the thickness of the thinner of the connected parts. To accommodate the non-uniform shear stress distribution in the bolts near the ends of the connection the spacing of the bolts at the ends of the repair system should be:
s ≤ 4D within a length of 1.5 bpl
where bpl is the width of the repair plates. The minimum edge distance a should satisfy Table 6.13.2.6.6-1 in AASHTO (2012) and to prevent excessive tension forces in the bolts due to rust jacking the maximum edge distance should satisfy
a ≤ min{8t,5in}
• Width and Thickness of Plates The width and thickness of the plates should ensure that the weak axis flexural rigidity of the repaired pile is no less than that of the uncorroded piles.
uyplycy EIEIEI )()()( ≥+
where E is the Elastic modulus of steel.
[ ]3,,
3, )2(2
121)( cwcfwcwfcy tthtbI −+= ,
[ ]33 )2(2121)( wfwwfuy tthtbI −+= ,
3
61)( plplply btI =
Page 3 of 41

The minimum width of the main plates, bpl,min, is:
dabb fpl ++= 2min,
where, bf is the flange width, a is the minimum edge distance for bolts as shown in Figure 3, and d is the diameter of the holes in the repair plates.
The thickness of the plates, plt , was designed to ensure that the plate satisfied the non-slender element requirements in (AASHTO, 2012), namely
EF
abt yplpl )2(714.0 −≥ ,
Further, to ensure that the plate does not yield in flexure due to tightening of the bolts, the minimum plate thickness is:
3min,
)2(442.1
sFdabbP
ty
fpltpl
−−−×= ,
Figure 3: Determination of the Width of The Main Plates
• Length of Plates The development length of the plates, Ld, at one end of the corroded region was calculated based on the required number and spacing of the bolts to achieve the desired friction force at the interface between the pile and the main repair plates. The total length of the plates is:
Lpl = 2 Ld + Lc
Ld = (Pn,r / Rn -1)× s+a
Table 1 presents the measured dimensions and details of the repair system for the piles that were repaired using the friction-type bolted steel plate repair system. Each pile was assigned a unique three-part identifier. The first part indicates the reduction percentage of flange thickness, the second part refers to the reduction percentage of web thickness, and the third part means a 2in void on web (“V”) or a 3ft extent of reduced region (“3”). The table
bpl
bf
a d
Page 4 of 41

also gives the calculated nominal capacity of the corroded piles, Pn,c. The capacity of the corroded piles was calculated both using the AISI-EWM and a detailed finite element analysis (FEA) (discussed below). The table presents both results. It should be noted that in all cases, the AISI-EWM under-predicted the pile capacity compared to the FEA results. Therefore, use of the AISI-EWM would give a conservative design for the repair system while also being more easily implemented by hand or using a spreadsheet. For testing purposes, to minimize the possibility of overloading the test frame, the less conservative FEA results were used to design the repair system. The bolts used were ¾-in diameter A325 structural bolts with a bolt pretension of 28kips per bolt. The main steel plates were 16in×0.5in, and the steel clamping plates were 4in×0.5in.
Table 1: Test Matrix of Steel-based Repaired Piles
Pile Designation
Corroded Section Calculated Nominal Strength Pn,c Length of
Plates Lpl
Total Number of Bolts
Nb Flange
Thickness tf,c
Web Thickness tw,c
AISI-EWMa AISI-EWMb FEA
[in] [in] [kips] [kips] [kips] [ft] 0/20-S 0.431 0.362 532 546 587 2 28
40/20-S 0.289 0.318 376 383 475 2 28 40/60-S 0.289 0.207 342 349 418 3.5 52
80/60-S(1) 0.133 0.199 141 144 181 6.5 100 80/60-S(2)d 0.142 0.181 141 145 176 6.5 100 80/60/V-S 0.140 0.213 138 142 100 7.5 116 80/60/3-S 0.134 0.196 141 144 153 7.5 116
ausing measured geometry and nominal material strength; busing measured geometry and measured material strength; dDuplicate test.
• Installation of Steel-Based Repair System Figure 4(a) shows one of the piles that were repaired using the steel-based system. The new steel plates were coated with two layers of coatings (Technical memorandum #2) to be protected against corrosion and provide adequate coefficient of friction between the repair plates and the existing pile. The first layer, a solvent-based, inorganic ethyl silicate, zinc-rich coating, was directly applied onto the freshly sandblasted surfaces of the steel plates,; the second layer, a non-zinc containing, Class B-rated, polyamide epoxy coating, provides the necessary coefficient of friction. Before assembling the plates, water was spread on the surfaces of the flanges, as shown in Figure 4(b) to simulate the coefficient of friction in an underwater application. The bolts were tightened to 28kips using a calibrated torque wrench following the TxDOT bolting specification (TxDOT Metric Special Provisions to Item 447-Structural bolting, 2004). Bevel washers were used, as shown in Figure 4(c) to minimize the bending of the bolts for all specimens except 40/60-S.
Page 5 of 41

Figure 4: Fabrication of Steel-based Repair System
2.1.2 FRP-Based Repair System The FRP-based repair systems, illustrated in Figure 5, consist of a cylindrical FRP jacket that is filled with grout or concrete. The grout may or may not include longitudinal steel reinforcement. Anchorage to the pile can be achieved by chemical bonding and mechanical interlock between the grout and the pile or by headed anchors. For minor repairs, the yield strength of the corroded section is sufficient to transmit the required load if buckling of the corroded elements can be prevented. In FRP-based repair systems, the expansive grout restrains the slender flange and web elements to prevent local buckling. For minor repairs, the bending stiffness provided by the grout and the FRP jacket are assumed to be sufficient to compensate for the minor loss of weak-axis bending stiffness due to corrosion. As the level of corrosion increases, it may be necessary to provide additional longitudinal reinforcing bars to compensate for the loss of the weak axis bending stiffness. Therefore, for moderate repairs additional steel reinforcing bars are provided. Due to the added loss of the cross section in these cases, restraining the slender elements may not be adequate to support the required axial load. So, a portion of the axial load is transferred from the steel pile to the repair system through the chemical bond between the steel and the grout. As the level of corrosion increases, the amount of load that must be transferred across the steel-to-grout interface also increases and may exceed the bond strength of the interface. In these cases headed-stud anchors can be attached to the web to transfer the excess load. The anchors are installed in the development length above and below the corroded region. The following sections summarize the design considerations for each component of the repair system.
Bevel washer
Water
Coated plates
(a) Pile before and after repair
(b) Water spread on pile surface
(c) Bevel washers
Page 6 of 41

Figure 5: Classification of the FRP-Based Repair System
• Configuration of the FRP Jacket The FRP jackets in these repairs primarily serve three functions: (i) act as a stay-in-place form to simplify casting of the grout core, (ii) provide confinement to prevent premature splitting of the grout core, and (iii) prevent moisture ingress which could lead to further damage in the repaired region. Two commercially available FRP-based repair systems, referred to herein as F1 and F2, were considered. Table 2 describes the primary differences between the FRP jackets of the two systems. While the FRP jackets do provide some structural benefit to the overall system, this was not explicitly considered in the basic design. The diameter of the jacket is governed by the geometry of the pile cross section which led to the nominal value of 17 in. Using this diameter and the compressive strength of the grout, taken to be 5 ksi, the axial capacity of the grout was calculated as 1057 kips. This strength is more than the amount of load which is required to be transferred from the pile to the grout and indicates that crushing of the grout core is note a primary design concern.
Minor Repair Moderate Repair Major Repair
Expansive Grout
FRP jacket Longitudinal Rebar
Headed-Stud Anchor
FRP jacket
Corroded Region
Longitudinal Rebar
Headed-Stud Anchor
web web
Page 7 of 41

Table 2: Specifications of FRP jackets (PileMedic LLC., Fyfe Co. LLC)
FRP jacket Description
Hoop Direction Axial Direction
Nominal Thickness
Nominal Elastic
Stiffness in Hoop
Direction ( E
Installation Technique Configuration Ultimate
Tensile Strength
Tensile Modulus
Ultimate Tensile Strength
Tensile Modulus
[ksi] [ksi] [ksi] [ksi] [in] [kips/in]
F1
2-ply bi directional
CFRP
101 7150 64 2940 0.026 372
Prefabricated laminate
wrapped and bonded using
underwater adhesive
F2
uni-directional GFRP (1st
layer)
67 3030 N/A* N/A* 0.050 152
Prefabricated GFRP jacket
installed using
adhesive and screws
uni-
directional CFRP (2nd
layer)
142 12350 N/A* N/A* 0.040 494
CFRP installed
using wet-layup
technique using
underwater resin
*Values not reported
Figure 6 compares the thickness of F1 and F2 FRP jackets after installation. As shown in this figure, the average thickness of the F2 jacket is more than 3 times that of the F1 jacket. In addition, the nominal elastic stiffness of the F2 jacket in hoop direction is 70% greater than F1 jacket as presented in Table 2.
Figure 6: Comparison Between the Thicknesses of F1 and F2 FRP Jackets
F2 FRP jacket average thickness=0.282 in.
F1 FRP jacket average thickness=0.087 in.
Page 8 of 41

• Length of the FRP Jacket For minor repairs, the jacket system is installed to stabilize the corroded region so that the corroded section can achieve its yield capacity. As such, the system is not designed to provide transfer of stress to the repair. However, for practical purposes the repair system was extended 18 in. beyond each end of the corroded region.
For the moderate and major repairs, the yield load of the remaining cross section is insufficient to carry the required axial load even if the whole cross section achieves the yield stress. As a result, a portion of the axial load must be transferred to the repair system through bond or anchorage between the FRP-confined grout and the steel pile. The load should be transferred through two load development regions, one above and one below the corroded region as illustrated in Figure 7. The total length of the FRP jacket is:
LFRP = Lc + 2Ld
Figure 7: Length of the FRP Jacket
The load that is required to be transferred to the repair system is:
Pn,r = Pn,u - Pn,c
Previous research (Liu et al., 2005) indicates that the peak shear strength at the interface between steel and confined expansive concrete, τmax, is 520 psi. Conservatively a maximum bond strength of 300 psi was used in the preliminary design. The required development length, Ld, assuming a uniform bond shear stress distribution in each of the development regions, is:
Pn,r = τmaxLdLp
Ld = Pn,r / (τmaxLp)
where Pn,u and Pn,c are the nominal capacities of the uncorroded and corroded piles, respectively, Ld is the development length, and Lp is the perimeter of the steel pile.
Lp (perimeter)
Ld Ld Lc
corroded region FRP jacket Load development region
Page 9 of 41

• Anchors For major repairs, when the corrosion is severe, the steel-to-grout bond may not be adequate to transfer the required load to the repair system within a reasonable development length. Therefore, mechanical anchors may be provided to transfer the load from the corroded pile to the repair system. Anchors were designed as headed stud anchors according to the provisions for composite construction in (AISC, 2011). Figure 8 illustrates the configuration of anchors on both sides of the corroded region. The nominal strength of a single steel headed stud anchor is:
Qnv = Fu Asa
where Fu is the specified minimum tensile strength of the steel stud anchor and Asa is the cross-sectional area of the steel headed stud anchor which, in case of threaded rod can be calculated as (ACI318, 2014):
29743.0
4
−=
tasa n
dA π
where da is the diameter of the anchor and nt is the number of threads per inch. In addition, the detailing should comply with the following, as illustrated in Figure 8:
h/da ≥ 5for normal weight concrete
4da ≤ s1
s2 ≤ 32da
where h is the shank length of the steel headed stud anchor to the top of the stud head, da is the diameter of the shank or threaded rod, and s1 and s2 are the center-to-center spacings of the stud anchors in the longitudinal and transverse directions, respectively. Also steel anchors shall have at least 1 in. of lateral clear concrete cover.
Figure 8: Anchors Configuration
• Longitudinal rebars To restore the weak-axis bending stiffness, four longitudinal rebars were provided within the FRP jackets as shown in Figure 9 for piles with moderate and major repairs. The diameter and location of the longitudinal rebars was calculated such that the weak-axis flexural rigidity of the repaired cross section (considering only the corroded steel pile and the steel rebars) was equal to that of the original un-corroded steel pile. The flexural rigidity of the repaired cross section was calculated as:
(EIy)u ≤ (EIy)c + (EIy)rebar
corroded region FRP jacket anchors anchors
s2 s1 h
Page 10 of 41

( )
22224
3,
33,
4644)(
612122
sdsddI
bttdbtI
rebary
cffcwcccffccy
πππ≅
+=
≅+=
where E is the elastic modulus of steel (29,000 ksi), (Iy)u is the weak-axis moment of inertia of the uncorroded pile (AISC, 2011), and the other geometric properties of the corroded pile and the repair system are illustrated in Figure 9.
Figure 9: Configuration of the Longitudinal Rebars in the Repaired Pile
Figure 10(a) shows the correlation between the normalized axial capacities of the tested control piles with respect to nominal design strength and loss of the flange and web thicknesses. The hollow data points represent the measured capacities of the tested corroded control piles, and are based on the actual geometry and material properties of the tested piles. However, in load rating and repair applications the actual material properties of the corroded pile may not be known. In these cases, it is relatively straight forward to measure the actual geometry of the deteriorated member while it may be more difficult to determine the in-situ materials properties. Therefore, the capacity of the corroded control piles was recalculated using the AISI-EWM with the measured geometry and the nominal material properties of the control piles. The solid data points in the figure indicate the calculated normalized axial capacities of these piles. The results calculated according to AISI-EWM were used to design the repair systems for each of the deteriorated piles.
Figure 10(b) summarizes the repair requirements for the test piles that were repaired using the FRP-based systems. Specifically, it highlights the regions where stabilization of the cross-section is a sufficient repair (yield capacityis adequate) or where additional rebar is needed (yield capacity is not adequate). Also, the figure illustrates the critical capacity below which anchors are required to transmit the load to the repair system.
Figure 11 illustrates the repair requirements for the test piles with 20%, 60%, and 100% loss of the web thickness. The detailing requirements are based on the design approach described previously and based on the calculated capacity of the piles using the AISI-EWM with measured dimensions and nominal material properties. Based on the required additional strength to reach the retrofitting target, the figure indicates which piles will require only stabilization of the section (prevention of local buckling), which piles require additional steel rebar, and which piles require steel anchors.
original un-corroded cross section
repaired cross section in corroded region
y y
tf,c
bf,c
dc tw,c d
s
Page 11 of 41

Figure 10: Classification of the Repair System for the Tested Control Piles (continued)
0.0
0.2
0.4
0.6
0.8
1.0
1.2
0 20 40 60 80 100
Nor
mal
ized
Axi
al C
apac
ity
(P/P
n,u)
Loss of Flange Thickness (%)
/ 20% / 60% / 100% loss of web thickness
test results
AISI-EWM *
* using measured geometry and nominal material properties of control piles
** Py,c = AcFy = yield capacity of corroded pile; Pn,u = nominal capacity of uncorroded pile
(a)
18-in bond is not adequate (anchors required)
18-in bond is adequate (no anchors needed)
yield capacity is not adequate
estimated bond strength
yield capacity is adequate
(b)
0.0
0.2
0.4
0.6
0.8
1.0
1.2
0 50 100
Nor
mal
ized
Axi
al C
apac
ity
(P/P
n,u)
Loss of Flange Thickness (%)
Page 12 of 41

Figure 11: Classification of the Repair System for the Tested Control Piles
0.0
0.2
0.4
0.6
0.8
1.0
1.2
0 20 40 60 80 100
Nor
mal
ized
Axi
al C
apac
ity
(P/P
n,u)
Loss of Flange Thickness (%)
0.0
0.2
0.4
0.6
0.8
1.0
1.2
0 20 40 60 80 100
Nor
mal
ized
Axi
al C
apac
ity
(P/P
n,u)
Loss of Flange Thickness (%)
0.0
0.2
0.4
0.6
0.8
1.0
1.2
0 20 40 60 80 100
Nor
mal
ized
Axi
al C
apac
ity
(P/P
n,u)
Loss of Flange Thickness (%)
0/20
Stabilization sufficient
Rebar needed
Rebar & anchors needed
(a)
Rebar needed
Rebar & anchors needed
(c)
40/20
40/60
80/60 80/60/3
80/60/V
bond is adequate (no anchors needed) bond is not adequate (anchors required)
bond is adequate (no anchors needed) bond is not adequate (anchors required)
bond is adequate (no anchors needed) bond is not adequate (anchors required)
(b )
Page 13 of 41

Table 3 and Table 4 give the test matrices for the piles that were repaired with the F1 and F2 FRP jackets, respectively. Each pile was assigned a unique identifier. The first two parts indicate the percent reduction of the flange and web thicknesses, followed in some cases by a ‘V’ indicating the presence of a 2 in. void in the web. The notation F1 and F2 indicates the type of the FRP jacket used. The presence of longitudinal rebars and headed anchors are noted by the suffixes ‘R’ and ‘A’ respectively. The tables also present the measured thicknesses of the flanges and webs in the corroded region, and the measured length and diameter of the FRP jackets. The length of the longitudinal rebars was the equal to the length of the FRP jackets. The total length of the headed-stud anchors was 12 in.
Table 3: Test Matrix of F1 Repair System
Pile Designation
corroded Length of the FRP
Jacket
Average Diameter of
the FRP Jacket
Rebar Size
Anchor Diameter
Calculated nominal strength
Flange Thickness
Web Thickness AISI-EWMa AISI-EWMb FEA
[in] [in] [in] [in] [in] [kips] [kips] [kips] 0/20-F1 0.441 0.330 49 17.1 N/A N/A 552 567 576
40/20-F1/R 0.294 0.345 49 17.9 #6 N/A 407 414 477 40/60-F1/R 0.292 0.189 49 17.6 #6 N/A 350 355 382 80/60-F1/R 0.117 0.204 49 17.1 #8 N/A 135 137 177
80/60-F1/RA 0.122 0.179 49 17.6 #8 1.00 128 129 159 80/60/V-F1/RA 0.122 0.182 49 16.9 #8 1.00 117 120 75 80/60/3-F1/RA 0.127 0.167 77 17.3 #8 1.00 126 127 132
a using measured geometry and nominal material properties, b using measured geometry and measured material properties
Table 4: Test Matrix of F2 Repair System
Pile Designation
corroded Length of the FRP
Jacket
Average Diameter of
the FRP Jacket
Rebar Size
Anchor Diameter
Calculated nominal strength
Flange Thickness
Web Thickness AISI-EWMa AISI-EWMb FEA
[in] [in] [in] [in] [in] [kips] [kips] [kips] 0/20-F2 0.443 0.347 48 17.8 N/A N/A 557 572 577
40/20-F2/R 0.290 0.352 48 17.8 #6 N/A 400 410 462 40/60-F2/R 0.294 0.216 48 17.8 #6 N/A 363 371 423 80/60-F2/R 0.134 0.197 48 17.8 #8 N/A 147 151 186
80/60-F2/RA 0.124 0.179 48 17.8 #8 1.00 129 131 161 80/60/V-F2/RA 0.124 0.213 48 17.7 #8 1.00 120 123 78 80/60/3-F2/RAc 0.141 0.221 80 18.0/19.9 #8 1.00 162 168 177 a using measured geometry and nominal material properties, b using measured geometry and measured material properties, c due to the fabrication process, the diameter of FRP jacket at one end was 1.9 in. larger than the diameter at the other end. The larger diameter end was installed bellow the corroded region while the smaller diameter end was installed above the corroded region (closer to the mid-height of the pile).
Page 14 of 41

• Fabrication of the FRP-based Repair System Figure 12 shows the details of the underwater repair process for the FRP-based repair systems. The repairs were conducted in a 5-1/2 ft. deep steel tank to simulate as closely as possibly an on-site repair application. The repairs were conducted in five steps as illustrated in Figure 12 and summarized below:
1. Preparation and installation of the end-caps 2. Preparation and installation of the rebars and anchors 3. Submerging the corroded piles in water 4. Installation of the FRP jackets 5. Casting grout
Page 15 of 41

Figure 12: Implementation of the FRP-based Repair System
• Placing the corroded piles in the repair tank and submerging them To simulate the underwater repair process, all 7 piles in each group were placed into a 22’x8’x5.5’ tank. The piles rested on the edge of the tank in an inclined configuration to ensure that the milled region was submerged in water after filling the tanks as shown in Figure 12(a) and (e). The tanks were filled with potable municipal water after installing the end caps, rebars, and anchors but before the jacket installation. This was done to simplify the
¾ “ plywood
C-clamp
2H nuts bonded to the rods
1”-8 treaded rod 1 ft.
Pump hose
(b) end-cap detail
(c) headed-stud anchors (d) rebars and anchors installation
(f) casting grout (e) submerging the piles in water
(a) Placing the piles in the repair tank
Page 16 of 41

installation in the lab. In a field repair these activities could be achieved underwater and installing this part of the repair system ‘in-the-dry’ is not expected to influence the structural performance.
• Preparation and installation of end-caps The end-caps were made of 20”x10” plywood boards. The thickness of the plywood boards were ¾” and 1 ½” for 4 ft. and 6.5 ft. long repair systems respectively. The shape of the H-pile cross section was cut out of the end caps to ensure a tight fit between the piles and the end caps. The plywood end caps were reinforced with galvanized, cold formed steel angles that were screwed to one side of the boards. The boards were subsequently mounted to the piles and care was taken to ensure that the end caps were installed perpendicular to the pile’s longitudinal axis. Finally, the end-caps were clamped to the piles using four heavy-duty C-clamps as shown in Figure 12(b). All of the voids between the end-cap and steel pile were filled with silicone rubber sealant, but any rapid set, underwater curing sealant could be used.
• Preparation and installation of rebars and anchors Figure 12 (d) shows the installed rebars and anchors. Longitudinal rebars were installed for the 40/20-F1/R, 40/20-F2/R, 40/60-F1/R, 40/60-F2/R, 80/60-F1/R, 80/60-F2/R, 80/60-F1/RA, 80/60-F2/RA, 80/60/V-F1/RA, 80/60/V-F2/RA, 80/60/3-F1/RA, and 80/60/3-F2/RA piles. The #6 and #8 rebars were held in place using tie wires that were wrapped around the rebars, piles, and anchors. The anchors consisted of 12” long, 1” diameter threaded rods (UNC thread) with double heavy nuts that were used to snug tighten the anchors to the web of the piles and to provide a head similar to that of a headed anchor. Figure 12(c) shows the partially assembled anchors. Anchors were installed on the six piles with the most severe loss of section, i.e.80/60-F1/RA, 80/60-F2/RA, 80/60/V-F1/RA, 08/60/V-F2/RA, 80/60/3-F1/RA, and 80/60/3-F2/RA. Eight holes, four above and four below the milled region, were drilled in the web of each pile using a magnetic drill. In an underwater application this can be achieved using a pneumatic drill.
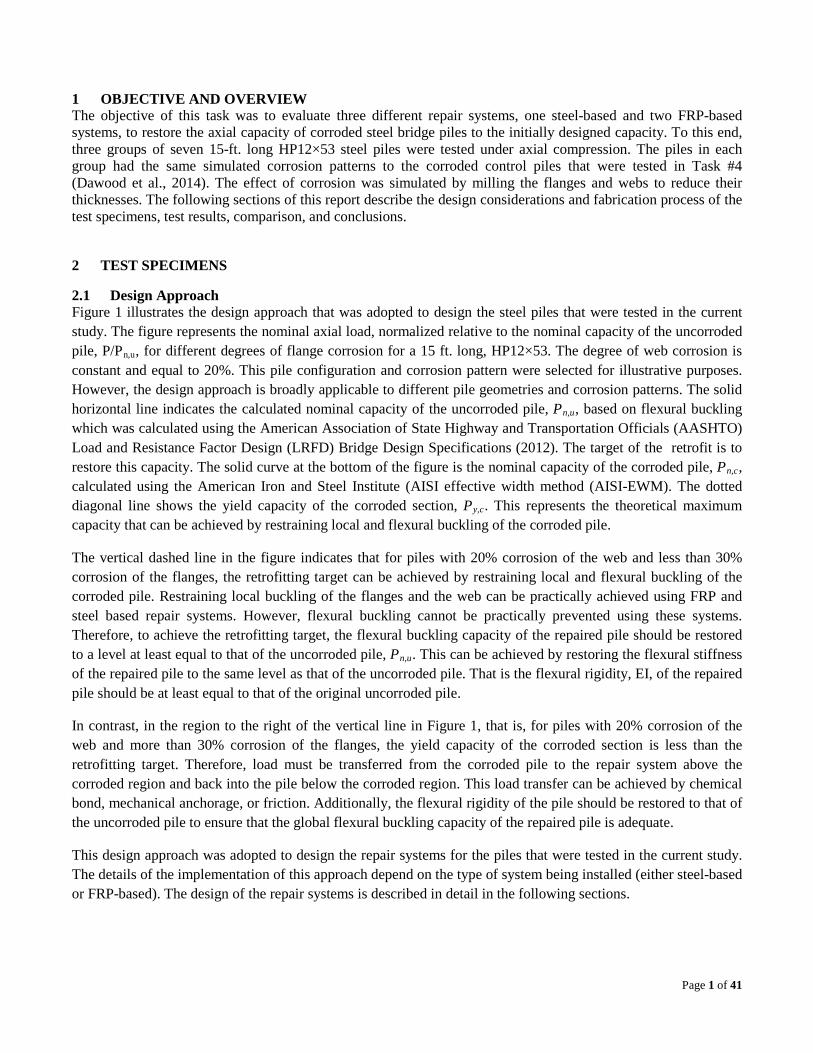
• Installation of FRP jackets Before installing the FRP jackets, the repair tank was filled with water to submerge the milled region of the piles. Figure 13 shows the process of installing the F1 type FRP jackets. The FRP laminate for the F1 repair system was pre-cut to the desired length and shipped to the laboratory by the manufacturer. The laminate was hand sanded with 60 grit sand paper to roughen the surface and wiped clean with a piece cotton cloth. As shown in Figure 13, after applying the underwater-curing epoxy to the surface of the laminate, the laminate was wrapped around the pile and pressed against the end-cap. A 10 ft. long laminate was wrapped completely around each pile twice (providing a jacket with two layers of CFRP) with a minimum of 8-in of overlap length at the end of the wrap. For the piles with a 1 ft. long corroded region a 4-ft. long repair was implemented resulting in load development lengths of 1.5 ft. above and below the corroded regions. For the pile with a 3 ft. long corroded region, two 4-ft. wide laminae were provided with an 18-in overlap located at the center of the milled region resulting in a total repair length of 6.5 ft. This resulted in load development lengths of 1.75 ft. above and below the corroded regions. The installation of the jackets on seven piles was completed in one day by one trained representative from the manufacturer and two untrained graduate student assistants. The jacket installations were achieved using hand tools and minimal power tools and did not require any heavy equipment.
Page 17 of 41
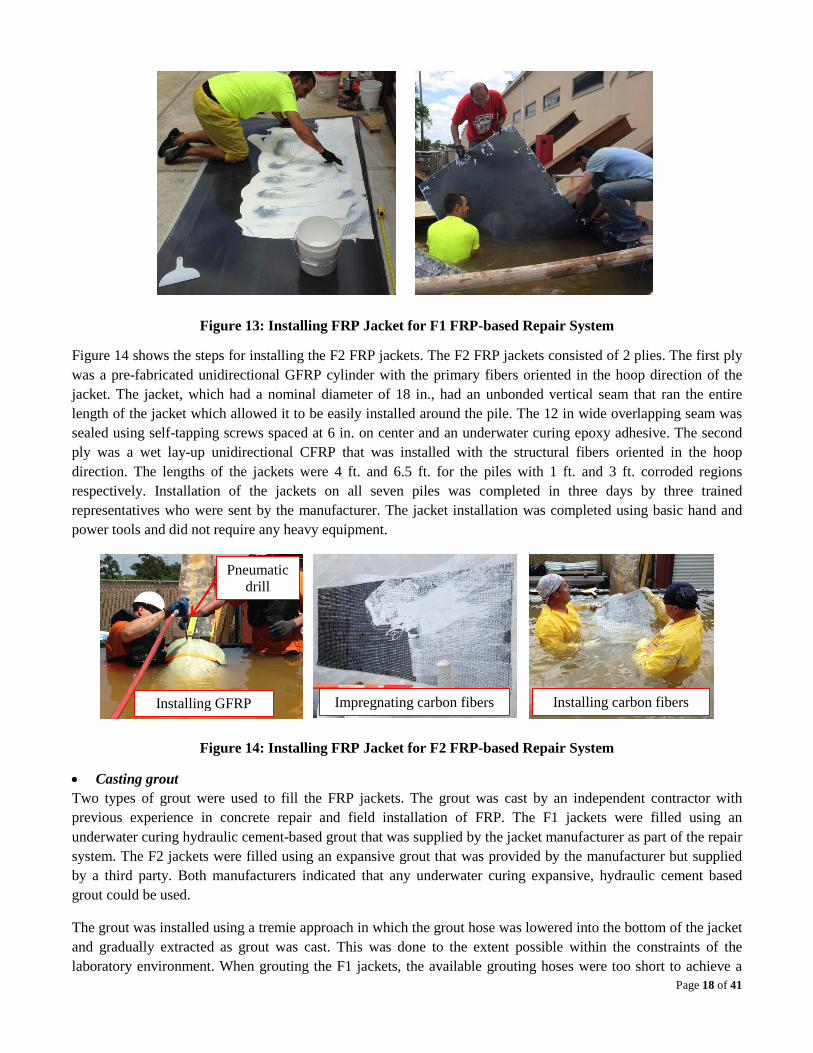
Figure 13: Installing FRP Jacket for F1 FRP-based Repair System
Figure 14 shows the steps for installing the F2 FRP jackets. The F2 FRP jackets consisted of 2 plies. The first ply was a pre-fabricated unidirectional GFRP cylinder with the primary fibers oriented in the hoop direction of the jacket. The jacket, which had a nominal diameter of 18 in., had an unbonded vertical seam that ran the entire length of the jacket which allowed it to be easily installed around the pile. The 12 in wide overlapping seam was sealed using self-tapping screws spaced at 6 in. on center and an underwater curing epoxy adhesive. The second ply was a wet lay-up unidirectional CFRP that was installed with the structural fibers oriented in the hoop direction. The lengths of the jackets were 4 ft. and 6.5 ft. for the piles with 1 ft. and 3 ft. corroded regions respectively. Installation of the jackets on all seven piles was completed in three days by three trained representatives who were sent by the manufacturer. The jacket installation was completed using basic hand and power tools and did not require any heavy equipment.
Figure 14: Installing FRP Jacket for F2 FRP-based Repair System
• Casting grout Two types of grout were used to fill the FRP jackets. The grout was cast by an independent contractor with previous experience in concrete repair and field installation of FRP. The F1 jackets were filled using an underwater curing hydraulic cement-based grout that was supplied by the jacket manufacturer as part of the repair system. The F2 jackets were filled using an expansive grout that was provided by the manufacturer but supplied by a third party. Both manufacturers indicated that any underwater curing expansive, hydraulic cement based grout could be used.
The grout was installed using a tremie approach in which the grout hose was lowered into the bottom of the jacket and gradually extracted as grout was cast. This was done to the extent possible within the constraints of the laboratory environment. When grouting the F1 jackets, the available grouting hoses were too short to achieve a
Installing GFRP
Pneumatic drill
Impregnating carbon fibers Installing carbon fibers
Page 18 of 41

complete tremie installation for all of the piles. Thus, voids were observed after opening the end-caps of piles 0/20-F1 and 40/20-F1/R. The voids were subsequently filled with the same type of grout after removing the piles from the water tanks as shown in Figure 15. Longer pump hoses were used to cast the grout for the piles with the F2 jackets to ensure that the nozzle could be fully inserted into the jackets.
Figure 15: Voids in the Grout of Two Piles Before and After Repairs
The grouting operation of the piles that were repaired using the F2 jackets required an excessive amount of grout. The process was halted after filling 5 of the 7 jackets to inspect the seal at the bottom of the jackets. The cause of the excessive use of grout was attributed to an incomplete seal at the bottom of two of the jackets. Figure 16 shows the end cap of two of the piles that were repaired with F2 jackets. The photos were taken after draining the repair tank for the inspection. The inspection indicated that the jacket at the base of the 80/60/3-F2/RA pile was larger than the plywood seal allowing grout to leak out of the base as shown in Figure 16(a). This was due to a taper of the jacket in the as installed condition which resulted in the diameter of the jacket at the base being 1.9 in. larger than the diameter of the jacket at the top. The pile was sealed using tape and shrink wrap before re-filling the tank and casting as shown in Figure 16 (b). Figure 16 (c) shows the bottom of pile 80/60-F2/RA which also exhibited an incomplete seal between the jacket and the end-cap. Careful inspection of the seals at the base of the piles prior to grouting is recommended.
Figure 16: Incomplete Sealing at the Base of the Piles for the F2 Repair System
0/20-F1 40/20-F1/R
0/20-F1 40/20-F1/R
(a) Tapered jacket (c) Incomplete sealing (b) Sealing of the jacket with shrink wrap and tape
Page 19 of 41
3 TEST SETUP AND INSTRUMENTATIONS A 600-kip self -reacting test frame was used to test the repaired piles. Three 200-kip load cells were used to measure the applied axial load. The axial shortening of the piles was measured by four string-type rotary potentiometers, that were mounted at the four corners of the end-plates of the test setup. The details of the test frame and instrumentations were described in Technical Memorandum #4.
4 TEST RESULTS AND DISCUSSION The following sections summarize the experimental observations and test results for the repaired piles. The results for each set of piles are presented on the following pages using a similar format. Each page shows the failure mode of the corresponding corroded control pile (reported previously in Technical Memorandum #4) and the failure mode of three similar piles repaired with each of the three repair systems, steel (S), FRP jacket 1 (F1), and FRP jacket 2 (F2). Each page also shows a comparison of the axial load vs. shortening response of the corresponding corroded control pile and the three repaired piles. The axial load vs. shortening response of the uncorroded control pile (0/0) is also plotted for comparison purposes. Finally, each page includes a table showing the measured peak load, calculated elastic stiffness, and observed failure mode for each of the tested piles in the set (uncorroded control pile, corresponding corroded control pile, and three repaired piles).
4.1 Experimental Observations
4.1.1 0/20 Pile Group Figure 17 illustrates the deformed specimens and axial load-deformation relationships of the 0/20 group of piles. The behavior is compared to that of the corroded and uncorroded control piles. Table 5 summarizes the measured axial peak loads, elastic stiffnesses, and failure modes of all of the tested piles.
• 0/20-S The pile was loaded up to 629 kips and failed by flexural buckling. The maximum lateral deformation was observed at mid-height of the column, which was the same as the damaged control pile. After testing the repair plates were removed and the pile was inspected. No flange or web local buckling was observed after removing the plates.
• 0/20-F1 and 0/20-F2 The piles were loaded up to the peak load monotonically. No visible signs of lateral deformation were observed during the test. The load-axial shortening response of the piles, shown in Figure 17, remained linear up to the maximum load levels of 655kips and 663 kips respectively. The tests were terminated when the capacity of the hydraulic loading system was reached before any significant damage of the repaired piles was observed.
Page 20 of 41

Figure 17: Tested Specimens and Load-deformation Response of the Piles 0/20 Repaired with Three Different Systems
Table 5: Comparison of the Test Results of the Piles 0/20 Repaired with Three Different Systems
Pile Axial Peak Load Stiffness Failure Mode [kips] [kips/in]
0/0 623 2776 FBa
0/20 604 2816 FBa
0/20-S 629 2647 FBa
0/20-F1 655 2610 No Failureb
0/20-F2 663 2627 No Failureb
a Flexual Buckling; b The test was terminated when the capacity of the hydraulic loading system was reached before any significant damage of the repaired pile was observed.
0/20 0/20-S 0/20-F1 0/20-F2
0
100
200
300
400
500
600
700
0 0.2 0.4 0.6 0.8 1
App
lied
Load
(kip
s)
Avg. Axial Deformation (in)
0/0 0/20 0/20-S 0/20-F1 0/20-F2
nominal design loadyield load
Page 21 of 41

4.1.2 40/20 Pile Group Figure 18 illustrates the deformed shape and axial load-deformation relationships of the 40/20 group of piles. The behavior is compared to that of the corroded and uncorroded control piles.
Table 6 summarizes the measured axial peak loads, elastic stiffnesses, and failure modes of all of the tested piles.
Figure 18: Tested Specimens and Load-deformation Response of the Piles 40/20 Repaired with Three Different Systems
40/20 40/20-S 40/20-F1/R 40/20-F2/R
0
100
200
300
400
500
600
700
0 0.2 0.4 0.6 0.8 1
App
lied
Load
(kip
s)
Avg. Axial Deformation (in)
0/0 40/20 40/20-S 40/20-F1/R 40/20-F2/R
nominal design load
yield load
Page 22 of 41

Table 6: Comparison of the Test Results of the Piles 40/20 Repaired with Three Different Systems
Pile Axial Peak Load Stiffness Failure Mode [kips] [kips/in]
0/0 623 2776 FBa
40/20 435 2448 FB/FLBb
40/20-S 665 2650 FB/FLB/WLBc
40/20-F1/R 663 2537 No Failured
40/20-F2/R 662 2587 No Failured
a Flexual Buckling; b Flange Local Buckling; c Web Local Buckling; d The test was terminated when the capacity of the hydraulic loading system was reached before any significant damage of the repaired pile was observed.
• 40/20-S The pile was loaded monotonically up to a peak load of 665kips. Failure occurred due to flexural buckling of the pile. Inspection of the pile after failure further indicated the presence of a localized buckle in the web as shown in Figure 19(a). After completion of the test, the strengthening plates were removed to observe the flanges. The inspection indicated a minor local buckle in the flange as shown in Figure 19(b). The inspection also revealed localized damage and flaking of the protective coating on the main steel repair plate as shown in Figure 19(c).
Figure 19: Flange and Web Local Buckling of 40/20-S
• 40/20-F1/R and 40/20-F2/R The piles were loaded up to the peak load monotonically. No visible signs of lateral deformation were observed during the test as shown in Figure 18. The test was terminated when the capacity of the hydraulic loading system was reached at 663 kips and 662 kips for the piles 40/20-F1/R and 40/20-F2/R, respectively. The axial load-displacement relationship showed the onset of non-linear behavior which suggests that the piles reached their peak loads and that the onset of the failure process was imminent.
4.1.3 40/60 Pile Group Figure 20 illustrates the failure mode and axial load-deformation relationships of the 40/60 group of piles. The behavior is compared to that of the corroded and uncorroded control piles. Table 7 summarizes the measured axial peak loads, elastic stiffnesses, and failure modes of all of the tested piles.
(a)Web local buckling (c)Coating damage (b)Flange local buckling
Page 23 of 41

Figure 20: Tested Specimens and Load-deformation Response of the Piles 40/60 Repaired with Three Different Systems
Table 7: Comparison of the Test Results of the Piles 40/60 Repaired with Three Different Systems
Pile Axial Peak Load Stiffness Failure Mode [kips] [kips/in]
0/0 623 2776 FBa 40/60 333 2520 FLBb/WLBc
40/60-S 618 2750 FB/FLB/WLB 40/60-F1/R 584 2502 FB 40/60-F2/R 644 2543 No Failured
a Flexual Buckling; b Flange Local Buckling; c Web Local Buckling; d The test was
40/60 40/60-S 40/60-F1/R 40/60-F2/R
0
100
200
300
400
500
600
700
0 0.2 0.4 0.6 0.8 1
App
lied
Load
(kip
s)
Avg. Axial Deformation (in)
0/0 40/60 40/60-S 40/60-F1/R 40/60-F2/R
nominal design load
yield load
Page 24 of 41

terminated when the capacity of the hydraulic loading system was reached before any significant damage of the repaired pile was observed.
• 40/60-S The pile was loaded up to 618kips and failed by web local buckling as shown in Figure 21(a). Lateral deformation was observed after the peak load. After the test, the plates were removed for further inspection. Observation indicated a higher order plate buckling on the flange as shown in Figure 21(b). Additionally, all of the bolts bolts were bent and one of them had ruptured as shown in Figure 21(c). This was because bevel washers were not used for this pile. Bevel washers were used in all of the other tests and no bolt bending was observed.
Figure 21: Failure Observed from 40/60-S
• 40/60-F1/R The pile exhibited a linear response up to a load of 584 kips with no visible sign of lateral deformation. As testing continued the applied load remained constant and began to decrease while the pile continued to deform as shown in Figure 20. The test was terminated when the load decreased to 504 kips. After the test, the FRP jacket was removed to inspect the condition of the grout core and the damaged region of the pile as shown in Figure 22(a). Removal of the jacket indicated the presence of significant air voids in the grout on top of one of the flanges. However, no localized deformation was observed in the flanges within the corroded region as shown in Figure 22(b) and (c).
Figure 22: Pile 40/60-F1/R
(b)Flange local buckling (c)Ruptured and bent bolts (a)Web local buckling
(b)Top flange (c)Bottom flange (a)Air voids
Page 25 of 41

• 40/60-F2/R The pile was loaded up to 644 kips monotonically. No visible sign of lateral deformation was observed during the test as shown in Figure 20. However, the pile exhibited a slightly non-linear response which initiated at an applied load level of 595 kips. The test was terminated when the capacity of the hydraulic loading system was reached.
4.1.4 80/60 Pile Group Figure 23 and Figure 24 illustrate the failure mode and axial load-deformation relationships, respectively, of the 80/60 group of piles. The behavior is compared to that of the corroded and uncorroded control piles. Table 8 summarizes the measured axial peak loads, elastic stiffnesses, and failure modes of all of the tested piles.
Page 26 of 41

Figure 23: Tested Specimens of the Piles 80/60 Repaired with Three Different Systems
80/60 80/60-S
80/60-Sd
80/60-F2/R 80/60-F1/R
80/60-F1/RA 80/60-F2/RA
Page 27 of 41

Figure 24: Load-deformation Response of the Piles 80/60 Repaired with Three Different Systems
Table 8: Comparison of the Test Results of the Piles 80/60 Repaired with Three Different Systems
Pile Axial Peak Load Stiffness Failure Mode [kips] [kips/in]
0/0 623 2776 FBa 80/60 182 2001 FLBb/WLBc
80/60-S(1) 632 3271 FLB/WLB 80/60-S(2)d 615 2798 FLB/WLB 80/60-F1/R 556 2286 FRP Rupture 80/60-F2/R 617 2294 FRP Rupture
80/60-F1/RA 653 2182 No Failured
80/60-F2/RA 646 2408 No Failured
a Flexual Buckling; b Flange Local Buckling; c Web Local Buckling; d The test was terminated when the capacity of the hydraulic loading system was reached before any significant damage of the repaired pile was observed..
• 80/60-S(1) and 80/60-S(2) Two similar piles were milled and repaired to evaluate the repeatability of the results. The piles were loaded monotonically to failure. The onset of non-linearity was observed at a load level of 600kips and 580kips, respectively. At this stage, web local buckling was observed along with sounds of the coating cracking. Flange local deformation was also observed outside of the repair region. The piles failed due to flange and web local buckling when the applied load reached 632kips and 615kips, for 80/60-S(1) and 80/60-S(2), respectively. After testing the repair systems were removed to investigate the condition of the deteriorated regions. Inspection indicated a crumpling deformation in the repaired region as shown in Figure 25(a). Furthermore, the outer layer of the coatings cracked and peeled near the edges of the flange tips while both layers of coatings exhibited damage at the most deformed region of flanges, as shown in Figure 25(b).
0
100
200
300
400
500
600
700
0 0.5 1 1.5
App
lied
Load
(kip
s)
Avg. Axial Deformation (in)0/0 80/60 80/60-S(1) 80/60-S(2)80/60-F1/R 80/60-F1/RA 80/60-F2/R 80/60-F2/RA
nominal design load
yield load
Page 28 of 41

Figure 25: Observed Damage of 80/60-S and 80/60-Sd
• 80/60-F1/R The pile was loaded monotonically to failure. The axial load shortening response became non-linear at a load level of 410 kips. Failure was observed when the applied load reached 556 kips. Subsequently, the load dropped to 396 kips. This sudden drop of load was accompanied by a loud sound and partial delamination of the FRP jacket as shown in Figure 26(a). Although no sign of lateral deformation was observed. The test was terminated at this stage. Removal of the jacket after testing indicated that the rupture initiated where the steel rubbed against the FRP jacket during construction as shown in Figure 26(b). This highlights the importance of proper placement of protective spacers between the FRP jacket and the corroded pile during construction. Removal of the jacket also indicated the presence of air voids in the grout above the top flange as shown in Figure 26(c). The grout was removed using a jack hammer to observe the web and flanges in the corroded regions. Both the flanges and web exhibited localized crumpling in the corroded region as shown in Figure 26(d) – (f).
Figure 26: Pile 80/60-F1/R
(a)Flange and web local buckling (b)Coating damage
(c)Air voids
(b)Rupture of the internal layerof the FRP jacket
(d)Top flange (e)Bottom flange
(a)FRP delamination
(f)Web
Page 29 of 41

• 80/60-F2/R The axial load-shortening response of the pile remained linear up to a load of 455 kips. Subsequently the stiffness of the pile decreased but load continued to increase up to a load of 620 kips. At that stage part of the FRP jacket on the top flange partially ruptured as shown in Figure 27(a), and the load reduced to 575 kips. Afterwards the load increased up to 610 kips at which stage the FRP jacket ruptured at the bottom bottom flange. The load suddenly dropped to 470 kips which was accompanied by a loud sound, complete rupture of the FRP jacket at the bottom flange, as shown in Figure 27(b), and crushing of the confined grout. Loading was stopped when the applied load decreased to 235 kips. This was accompanied by excessive lateral deformation of the pile as can be seen in Figure 23. Figure 27(c) shows separation of the grout from the pile after rupture of the jacket. After testing the repair system was removed from the pile. It was observed that the flanges and web crumpled locally at the corroded region as shown in Figure 27(d) – (f).
Figure 27: Pile 80/60-F2/R
• 80/60-F1/RA and 80/60-F2/RA The axial load-shortening responses of the piles remained linear up to loads of 465 kips and 515 kips, respectively. At this stage the stiffnesses of the piles decreased, but the loads continued to increase up to the peak loads. The test was terminated when the capacity of the hydraulic loading system was reached before any significant damage of the repaired piles was observed. After the test, the repair systems were removed for further investigation of the failure.
As shown in Figure 28(a), air voids were observed in the grout of the pile repaired with the F1 system, but they were not located within the corroded region. Both flanges demonstrated crumpling flange deformation as shown in Figure 28(b) and (c).
(a)FRP rupture over the top flange (b)FRP rupture along the bottom flange
(d)Top flange (e)Bottom flange (f)Web (c)Grout separation
Page 30 of 41

Figure 28: Pile 80/60-F1/RA
As shown in Figure 29(a), air voids were observed in the grout of the pile repaired with F2 system adjacent to the top flange near the corroded region. The top flange demonstrated premature localized deformation at the section adjacent to the void. However, no localized deformation was observed in the bottom flange or the web as shown in Figure 29(b) and (c). Figure 29(d) shows the headed-stud anchors after removing the grout using a jack hammer. No visible sign of damage was observed in the anchors.
Figure 29: Pile 80/60-F2/RA
4.1.5 80/60/V Pile Group Figure 30 illustrates the deformed specimens and axial load-deformation relationships of the 80/60/V group of piles. The behavior is compared to that of the corroded and uncorroded control piles. Table 9 summarizes the measured axial peak loads, elastic stiffnesses, and failure modes of all of the tested piles.
(b)Top flange (c)Bottom flange (a)Air voids
(a)Top flange (b)Bottom flange (c)Web (d)Anchors
Page 31 of 41

Figure 30: Tested Specimens and Load-deformation Response of the Piles 80/60/V Repaired with Three Different Systems
Table 9: Comparison of the Test Results of the Piles 80/60/V Repaired with Three Different Systems
Pile Axial Peak Load[kips] Stiffness[k/in] Failure Mode 0/0 623 2776 FBa
80/60/V 124 1930 FLBb 80/60/V-S 630 2907 FLBb
80/60/V-F1/RA 591 2557 FBa/FLBb
80/60/V-F2/RA 655 2346 No Failurec
a Flexual Buckling; b Flange Local Buckling; c The test was terminated when the capacity of the hydraulic loading system was reached before any significant damage of the repaired pile was observed.
80/60/V 80/60/V-S 80/60/V-F1/RA 80/60/V-F2/RA
0
100
200
300
400
500
600
700
0 0.2 0.4 0.6 0.8 1
App
lied
Load
(kip
s)
Avg. Axial Deformation (in)
0/0 80/60/V 80/60/V-S 80/60/V-F1/RA 80/60/V-F2/RA
nominal design load
yield load
Page 32 of 41

• 80/60/V-S The pile was loaded up to 630kips and failed in a similar pattern as the damaged control specimen (Figure 31(a)). no web buckling or lateral deformation were observed. The string potentiometer installed on the pile flange indicated slip between top flange of the pile and the main plate of the repair system at a load level of 620kips. After the test, the steel plates were removed. Flange crumpling in the corroded region and next to the void in the web were observed as shown in Figure 31(b) and attributed to lack of support from the severely corroded web.
Figure 31: Observed Damage of 80/60/V-S
• 80/60/V-F1/RA The pile was loaded up to 375 kips monotonically. Afterwards the axial stiffness of the piles decreased, however, the load continued to increase up to a peak load of 591 kips. Subsequently the load gradually decreased to 485 kips with increasing lateral deformation. At this point the flanges suddenly buckled just outside of the repaired region as shown in Figure 32(a), and the load dropped to 207 kips. Figure 32(b) shows air voids adjacent to the top flange that were observed after removing the FRP jacket after testing. These voids caused the top flange to exhibit a different local deformation pattern from the bottom flange as shown in Figure 32(c) and (d).
Figure 32: Pile 80/60/V-F1/RA
• 80/60/V-F2/RA After the pile was loaded up to 370 kips, the axial stiffness decreased. The load continued to increase to a peak of 655 kips with no visible sign of lateral deformation as shown in Figure 30. The test was terminated when the capacity of the hydraulic loading system was reached. After removing the FRP jacket, air voids were observed in the grout as shown in Figure 33(a), but they were not adjacent to the corroded region. The top flange
(a) Pile failure (b) Flange local buckling
(c)Top flange (d)Bottom flange (b)Air void at the top (a)Flange local buckling
Page 33 of 41

demonstrated crumpling like deformation with slightly higher amplitude than the bottom flange as shown in Figure 33(b) and (c).
Figure 33: Pile 80/60/V-F2/RA
4.1.6 80/60/3 Pile Group Figure 34 illustrates the deformed specimens and axial load-deformation relationships of the 80/60/3 group of piles. The behavior is compared to that of the corroded and uncorroded control piles. Table 10 summarizes the measured axial peak loads, elastic stiffnesses, and failure modes of all of the tested piles.
(b)Top flange (c)Bottom flange (a)Air voids
Page 34 of 41

Figure 34: Tested Specimens and Load-deformation Response of the Piles 80/60/3 Repaired with Three
Different Systems
Table 10: Comparison of the Test Results of the Piles 80/60/3 Repaired with Three Different Systems
Pile Axial Peak Load Stiffness Failure Mode [kips] [kips/in]
0/0 623 2776 FB 80/60/3 159 1645 FLB/WLB
80/60/3-S 532 3180 FLB/WLB 80/60/3-F1/RA 633 2631 No Failurea
80/60/3-F2/RA 637 2864 No Failurea
a The test was terminated when the capacity of the hydraulic loading system was reached before any significant damage of the repaired pile was observed.
80/60/3-S 80/60/3-F1/RA 80/60/3 80/60/3-F2/RA
0
100
200
300
400
500
600
700
0 0.2 0.4 0.6 0.8 1
App
lied
Load
(kip
s)
Avg. Axial Deformation (in)0/0 80/60/3 80/60/3-S80/60/3-F1/RA 80/60/3-F2/RA
nominal design load
yield load
Page 35 of 41

• 80/60/3-S The pile was loaded monotonically up to a load of 532kips at which point the load began to decrease. Removal of the repair plates and inspection of the pile indicated localized crumpling of the pile in the corroded region as shown in Figure 35(a). The capacity of this pile was lower than the retrofitting target, because the location of the rollers of the test frame limited the length of the repair system, as shown in Figure 35(b). Due to this physical constraint, the length of the repair system was less than required by the proposed design procedure to fully restore the capacity of the pile. The predicted capacity of the pile using the applied repair configuration was 496 kips which is 7% less than the measured capacity.
Figure 35: Specimen 80/60/3-S
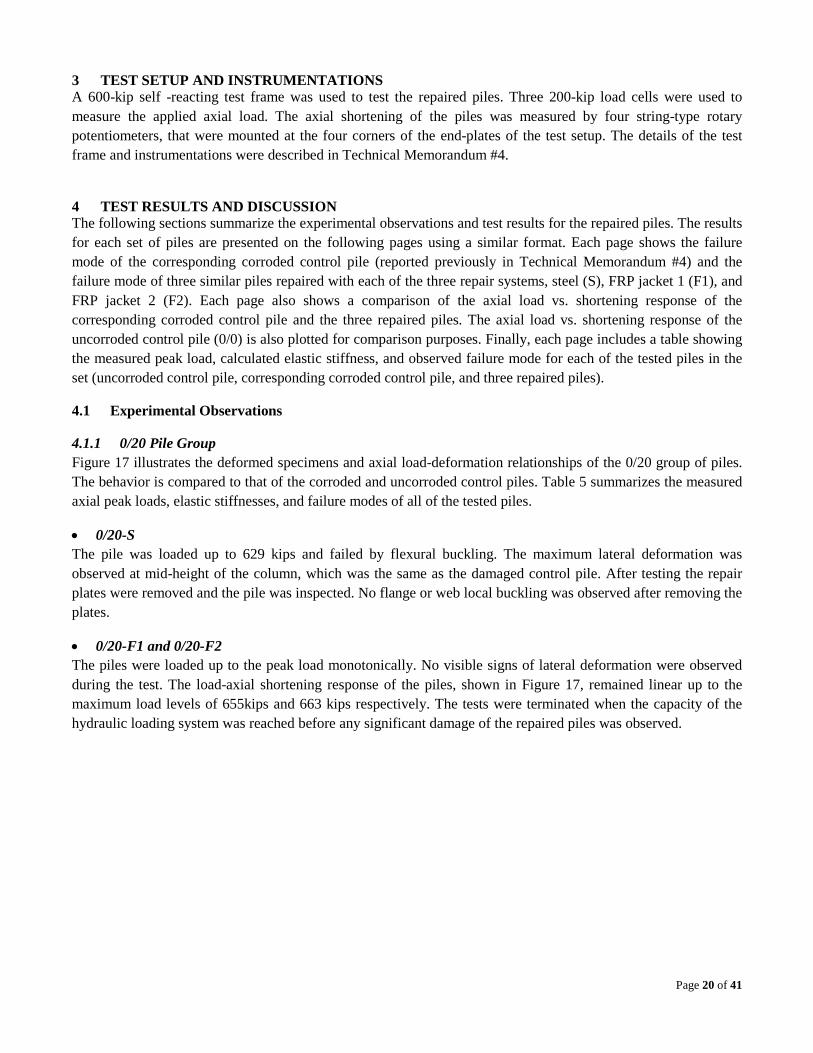
• 80/60/3-F1/RA The pile was loaded up to 435 kips beyond which the axial load-deformation response showed a reduction in axial stiffness. The test was terminated when the capacity of the hydraulic loading system was reached at 633 kips before any significant damage of the repaired pile was observed. After removing the FRP jacket, air voids were observed in the grout which caused localized deformation in the adjacent slender flange as shown in Figure 36(a) and (b). The bottom flange and headed-stud anchors demonstrated no visible deformation as shown in Figure 36(c) and (d). Figure 36(e) shows localized deformation in the web which happened adjacent to the air voids in the grout. Figure 36(f) shows a longitudinal cut mark on the internal layer of the FRP jacket. This local scoring of the FRP is expected to have occurred due to friction between the FRP and the steel flange during installation and emphasizes the need for spacers between the steel pile and the FRP jacket.
(a)Flange and web deformation (b)The roller in test frame limited the length of repair system
Page 36 of 41
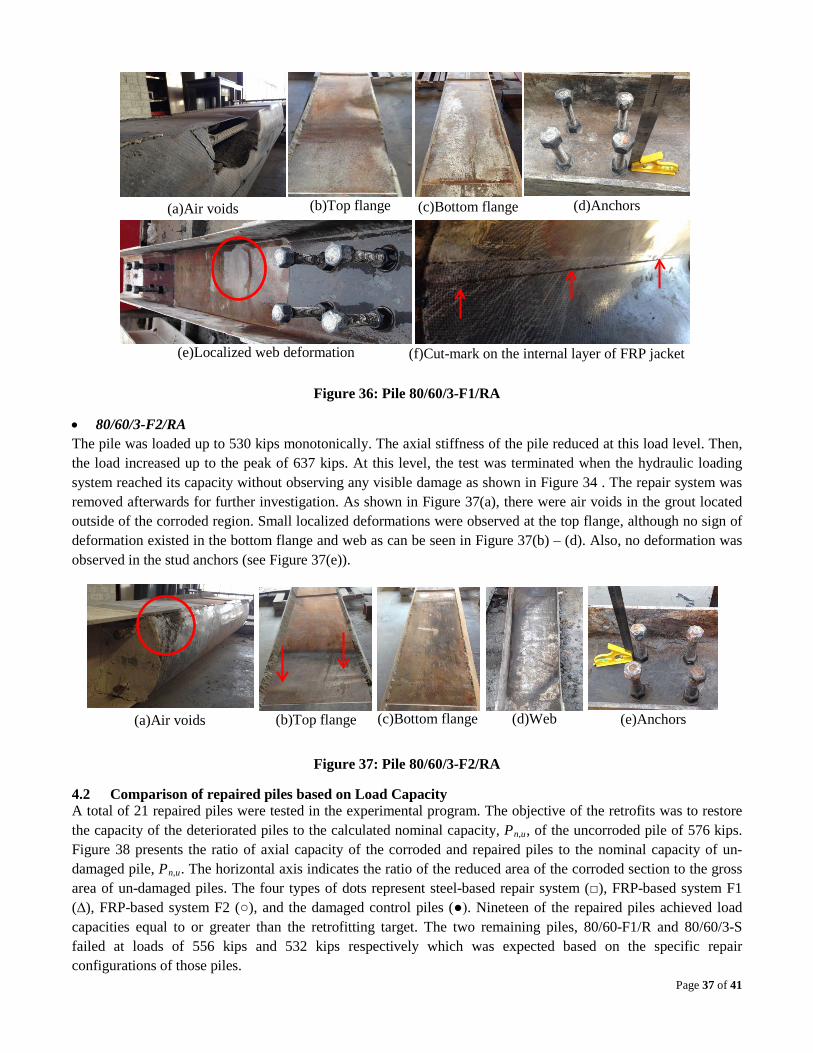
Figure 36: Pile 80/60/3-F1/RA
• 80/60/3-F2/RA The pile was loaded up to 530 kips monotonically. The axial stiffness of the pile reduced at this load level. Then, the load increased up to the peak of 637 kips. At this level, the test was terminated when the hydraulic loading system reached its capacity without observing any visible damage as shown in Figure 34 . The repair system was removed afterwards for further investigation. As shown in Figure 37(a), there were air voids in the grout located outside of the corroded region. Small localized deformations were observed at the top flange, although no sign of deformation existed in the bottom flange and web as can be seen in Figure 37(b) – (d). Also, no deformation was observed in the stud anchors (see Figure 37(e)).
Figure 37: Pile 80/60/3-F2/RA
4.2 Comparison of repaired piles based on Load Capacity A total of 21 repaired piles were tested in the experimental program. The objective of the retrofits was to restore the capacity of the deteriorated piles to the calculated nominal capacity, Pn,u, of the uncorroded pile of 576 kips. Figure 38 presents the ratio of axial capacity of the corroded and repaired piles to the nominal capacity of un-damaged pile, Pn,u. The horizontal axis indicates the ratio of the reduced area of the corroded section to the gross area of un-damaged piles. The four types of dots represent steel-based repair system (□), FRP-based system F1 (∆), FRP-based system F2 (○), and the damaged control piles (●). Nineteen of the repaired piles achieved load capacities equal to or greater than the retrofitting target. The two remaining piles, 80/60-F1/R and 80/60/3-S failed at loads of 556 kips and 532 kips respectively which was expected based on the specific repair configurations of those piles.
(b)Top flange (c)Bottom flange (a)Air voids
(f)Cut-mark on the internal layer of FRP jacket
(d)Anchors
(e)Localized web deformation
(b)Top flange (c)Bottom flange (a)Air voids
(e)Anchors (d)Web
Page 37 of 41
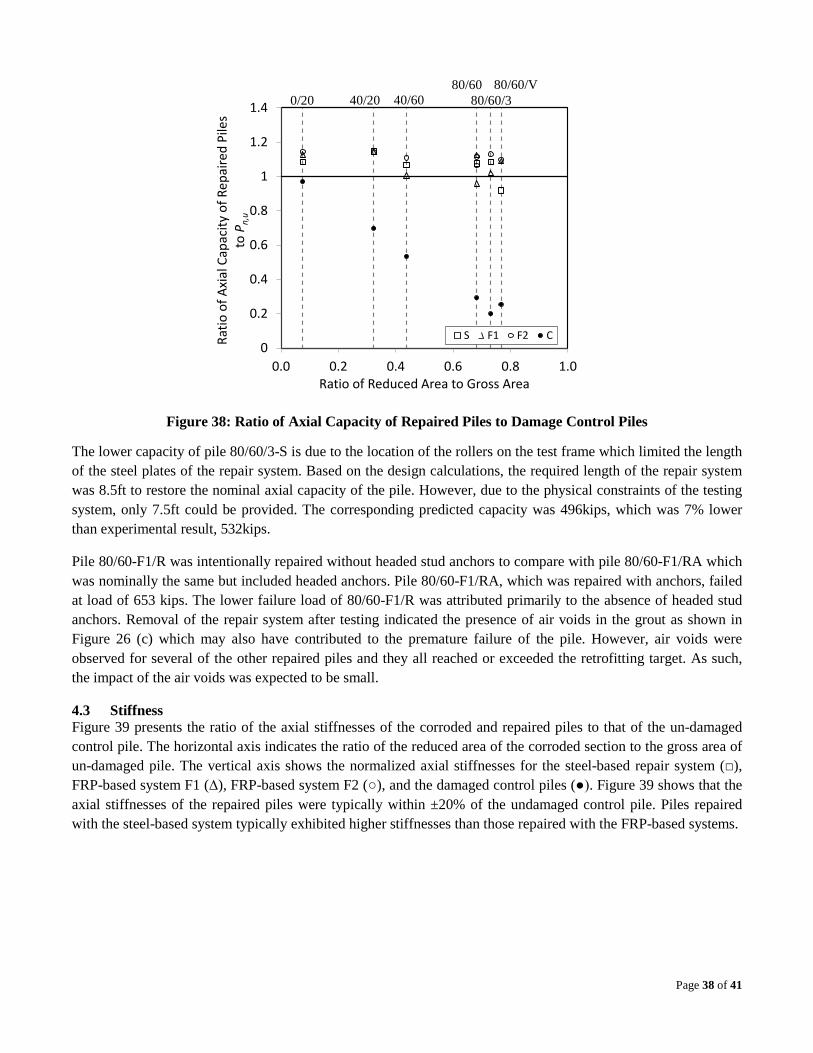
Figure 38: Ratio of Axial Capacity of Repaired Piles to Damage Control Piles
The lower capacity of pile 80/60/3-S is due to the location of the rollers on the test frame which limited the length of the steel plates of the repair system. Based on the design calculations, the required length of the repair system was 8.5ft to restore the nominal axial capacity of the pile. However, due to the physical constraints of the testing system, only 7.5ft could be provided. The corresponding predicted capacity was 496kips, which was 7% lower than experimental result, 532kips.
Pile 80/60-F1/R was intentionally repaired without headed stud anchors to compare with pile 80/60-F1/RA which was nominally the same but included headed anchors. Pile 80/60-F1/RA, which was repaired with anchors, failed at load of 653 kips. The lower failure load of 80/60-F1/R was attributed primarily to the absence of headed stud anchors. Removal of the repair system after testing indicated the presence of air voids in the grout as shown in Figure 26 (c) which may also have contributed to the premature failure of the pile. However, air voids were observed for several of the other repaired piles and they all reached or exceeded the retrofitting target. As such, the impact of the air voids was expected to be small.
4.3 Stiffness Figure 39 presents the ratio of the axial stiffnesses of the corroded and repaired piles to that of the un-damaged control pile. The horizontal axis indicates the ratio of the reduced area of the corroded section to the gross area of un-damaged pile. The vertical axis shows the normalized axial stiffnesses for the steel-based repair system (□), FRP-based system F1 (∆), FRP-based system F2 (○), and the damaged control piles (●). Figure 39 shows that the axial stiffnesses of the repaired piles were typically within ±20% of the undamaged control pile. Piles repaired with the steel-based system typically exhibited higher stiffnesses than those repaired with the FRP-based systems.
0
0.2
0.4
0.6
0.8
1
1.2
1.4
0.0 0.2 0.4 0.6 0.8 1.0
Ratio
of A
xial
Cap
acity
of R
epai
red
Pile
s to
Pn,
u
Ratio of Reduced Area to Gross Area
S F1 F2 C
80/60/V 80/60/3
80/60 40/60 40/20 0/20
Page 38 of 41

Figure 39: Ratio of Stiffness of the Repaired Piles to Damage Control Piles
According to the results presented in Figure 38, the reduction in the axial stiffness of the tested un-repaired piles was up to 40% for piles with 2-in void in the web. The axial stiffness of the piles with no degradation in flange thickness,0/20, that were repaired using the three different methods was 7% less than the stiffness of the corresponding damaged control pile. This was attributed to the slightly higher un-intentional eccentricity of the axial load during testing of the repaired piles and the differences of the cross-sectional dimensions for each pile. Considering the piles with 40% flange loss, namely 40/20 and 40/60, there were increases of 9% and 6% in the axial stiffness of the piles repaired with steel-based and FRP-based system respectively. The loss of the axial stiffness of the tested un-repaired control piles with 40% loss of flange thickness was 12% compared to the un-corroded control pile. The piles with 80% degradation of flange thickness that were repaired with steel-based and FRP-based systems demonstrated increases of 93% and 74% in the axial stiffness respectively compared to the corroded control piles.
5 SUMMARY AND CONCLUSION Three different systems for repairing corroded steel piles, one steel-based and two FRP-based, were evaluated. The axial load vs. shortening responses of the piles was compared to those of control piles with simulated corrosion patterns. The research findings lead to the following conclusions:
• Comparing the test results of the repaired piles to those of the corroded control piles indicates that all three repair systems were able to successfully restore the axial capacity of the corroded piles to the nominal design strength for all except two of the tested piles. The premature failure of the two piles that did not reach the retrofitting target was expected based on the proposed design approach. For both the pile that was repaired with the steel-based system and the pile that was repaired with the FRP-based system, the premature failure was essentially due to inadequate anchorage of the pile. For the pile repaired with the steel-based system, this was due to physical constraints of the test setup that required the use of a shorter repair plate than recommended by the proposed design procedure. For the pile repaired with the FRP-based system this was due to elimination of headed stud anchors for comparison purposes although the recommended design procedure required the use of stud anchors.
0
0.2
0.4
0.6
0.8
1
1.2
1.4
0.0 0.2 0.4 0.6 0.8 1.0
Ratio
of S
tiffn
ess o
f Rep
aire
d Pi
les t
o U
n -da
mag
ed C
ontr
ol P
iles
Ratio of Reduced Area to Gross Area
S F1 F2 C
0/20 40/20 40/60 80/60 80/60/V
80/60/3
Page 39 of 41

• All three repair systems increased the axial stiffness of the corroded piles compared to the un-repaired corroded piles. The steel-based system provided a greater stiffness increase than the FRP-based systems due to the higher elastic modulus of steel compared to grout and FRP. The increase in the stiffness was up to 90% for the pile with a 3-ft. long corroded region that was repaired with the steel-based system.
• For the piles repaired with the steel-based system, as the flange reduction increased from 0% to 40%, the failure mode varied from flexual buckling of the pile to flange local buckling and localized deformation of the web followed by flexual buckling. For the piles with 80% flange loss that were repaired with the steel-based system, failure was governed by localized crumpling of the corroded region which was characterized by severe local distortion of the flange and web after significant inelastic deformation. The case with a 2-in void in the web exhibited only flange deformation in the corroded region.
• Cracking and flaking of the coating of the steel repair plates was observed on approximately 4% to 10% of the surface of the main plates of the steel-based repair system. While this did not appear to have an effect on the strength of the piles, it may affect the long-term durability of the system.
• The piles repaired with the FRP-based systems demonstrated no visible global or local deformation for the cases with 0% and 40% reduction of the flange thickness. The piles with 80% loss of the flange thickness, all demonstrated localized crumpling of the corroded region, which was observed after removing the FRP jacket and the grout. The two piles 80/60-F2/R and 80/60/V-F1/RA also exhibited flexural buckling after achieving their peak loads.
• Two of the 80/60 piles were repaired with FRP-based systems without headed-stud anchors to investigate the effect of anchorage. The FRP jacket for piles 80/60-F1/R and 80/60-F2/R ruptured after attaining the peak load. The pile repaired with the F2 jacket was able to attain the retrofitting target. In contrast, the similar pile that was repaired with the F1 jacket failed at a load level that was slightly below the retrofitting target due to the presence of air voids in the grout. Testing of similar piles that included headed stud anchors indicated that the presence of the anchors increased the capacities of the piles by 17% and 5% compared to the counterpart piles that did not include anchors for the F1 and F1 systems, respectively.
• The results indicate that minor voids in the grout may only have a secondary effect on the capacities of the repaired piles. However, care should be taken to ensure proper filling of the jackets with grout. Experience in the grouting operation is essential particularly when repairing inclined or battered piles. To facilitate complete grouting, tremie installation with a sufficiently long hose and gradual extraction or grouting from an injection port at the bottom of the jacket are recommended.
• To avoid cutting the internal layer of FRP jacket, sharp edges of the flanges should be covered or spacers should be installed to prevent direct contact between the FRP jacket and the pile.
6 ACKNOWLEDGEMENT The authors gratefully acknowledge the contribution of Sherwin-Williams, Quakewrap Inc., Fyfe Co., LLC., and Epoxy Design Systems who provided contributions in kind (including labor and materials) in support of this research.
7 REFERENCES AASHTO. (2012). Bridge Design Specifications (LRFD), Washington, DC: AASHTO.
ACI318. (2014). Building Code Requirement for Structural Concrete. American Concrete Institute.
AISC. (2010). Steel Construction Manual (14th ed.). American Institute of Steel Construction (AISC).
Page 40 of 41

AISI. (2007). North American Specification for the Design of Cold-Formed Steel Structural Members. Washington, DC: American Iron and Steel Institute.
Dawood, M., & Karagah, H. (2012). Technical Memorandum for Task 1: Survey Results. Texas Department of Transportation Project 0-6731: Repair Systems for Detriorated Bridge Piles.
Dawood, M., Karagah, H., & Shi, C. (2013). Technical Memorandum for Task 2: Evaluation of Repair Alternatives. Texas Department of Transportation Project 0-6731: Repair Systems for Detriorated Bridge Piles.
Dawood, M., Karagah, H., & Shi, C. (2014). Technical Memorandum for Task 4: Full-scale laboratory tests of corroded control piles. Texas Department of Transportation Project 0-6731: Repair Systems for Detriorated Bridge Piles.
Fyfe Co. LLC. (n.d.). Product data sheet, Tyfo PR System using Tyfo SEH-51A and Tyfo S Epoxy. Retrieved from http://www.fyfeco.com/Products/Composite-Systems.aspx
Fyfe Co. LLC. (n.d.). Product data sheet, Tyfo SCH-41 Composite using Tyfo SW-1(S) Underwater Epoxy. Retrieved from http://www.fyfeco.com/Products/Composite-Systems.aspx
PileMedic LLC. (n.d.). Product data sheet, PileMedic PLC100.60 for Structural Strengthening of Columns and Submerged Piles. Retrieved from http://www.pilemedic.com/product_data_sheets.php
Page 41 of 41