tasc futures group northrop grumman d e f i n i n g t h e f u t u r e
Post on 18-Dec-2015
216 views
TRANSCRIPT
TASC FUTURES GROUP
NORTHROP GRUMMAN
D E F I N I N G T H E F U T U R E
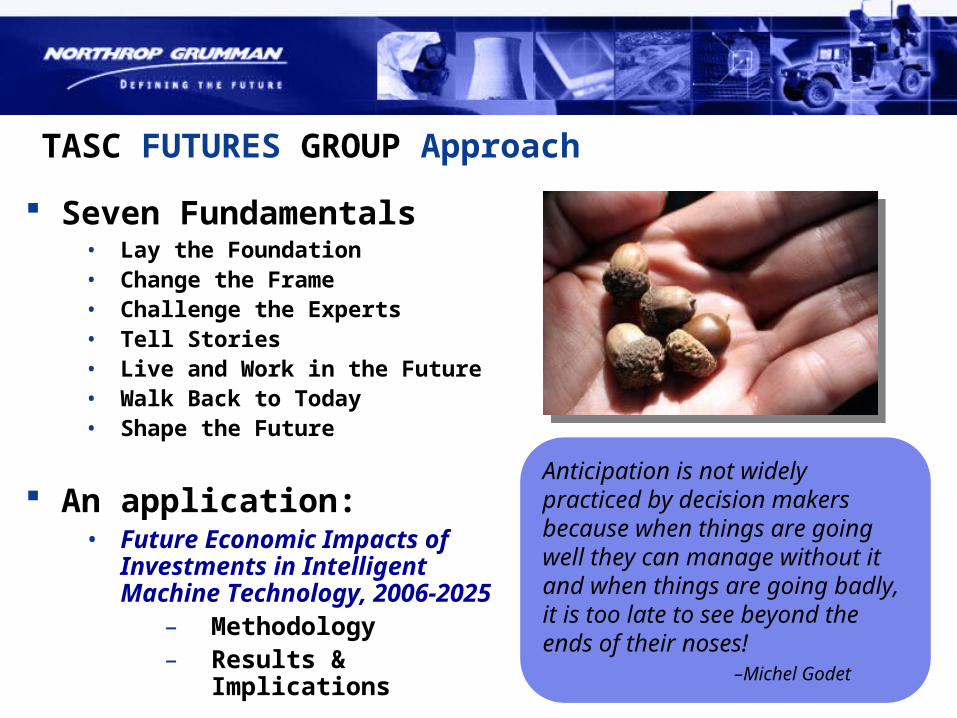
TASC FUTURES GROUP Approach
Seven Fundamentals• Lay the Foundation• Change the Frame• Challenge the Experts• Tell Stories• Live and Work in the Future• Walk Back to Today• Shape the Future
An application:• Future Economic Impacts of
Investments in Intelligent Machine Technology, 2006-2025
– Methodology– Results & Implications
Anticipation is not widely practiced by decision makers because when things are going well they can manage without it and when things are going badly, it is too late to see beyond the ends of their noses! –Michel Godet
Technology Scouting:Lessons from Future Impact Studies
David Leech
Senior Analyst for
Technology & Industry Evaluation
Futures, Forecasting, & Change Management
Northrop Grumman Information Technology
Intelligence Group (TASC)
Outline
Overarching “Lessons Learned”
Future Economic Impacts of IMT, 2006-2025
Analytical Approaches to Technology Scouting• Building bridges from lab concerns to industry
concerns
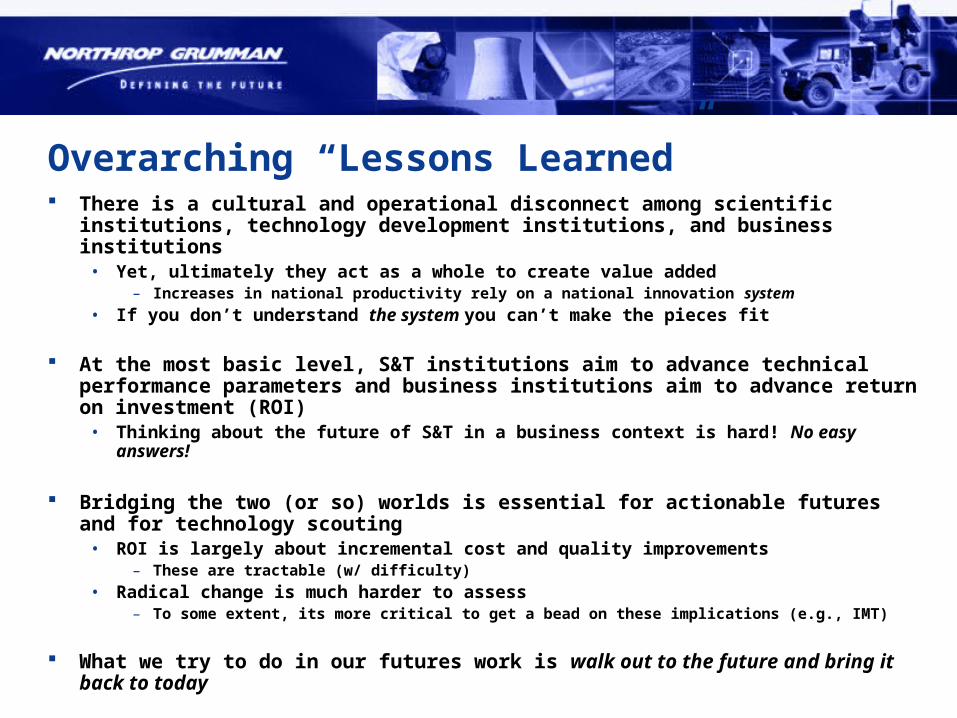
Overarching “Lessons Learned” There is a cultural and operational disconnect among scientific institutions,
technology development institutions, and business institutions • Yet, ultimately they act as a whole to create value added
– Increases in national productivity rely on a national innovation system
• If you don’t understand the system you can’t make the pieces fit
At the most basic level, S&T institutions aim to advance technical performance parameters and business institutions aim to advance return on investment (ROI)
• Thinking about the future of S&T in a business context is hard! No easy answers!
Bridging the two (or so) worlds is essential for actionable futures and for technology scouting
• ROI is largely about incremental cost and quality improvements– These are tractable (w/ difficulty)
• Radical change is much harder to assess– To some extent, its more critical to get a bead on these implications (e.g., IMT)
What we try to do in our futures work is walk out to the future and bring it back to today

Sophisticated Understanding of the Private/Public National Innovation SystemSophisticated Understanding of the Private/Public National Innovation System
A important part of our proposed
approach to IMT
A important A important part of our part of our proposed proposed approach to approach to “scouting”“scouting”
Future Economic Impacts of Investments in Intelligent Machine Technology, 2006-2025
Challenge and Methodology
Results
Implications

The Challenge
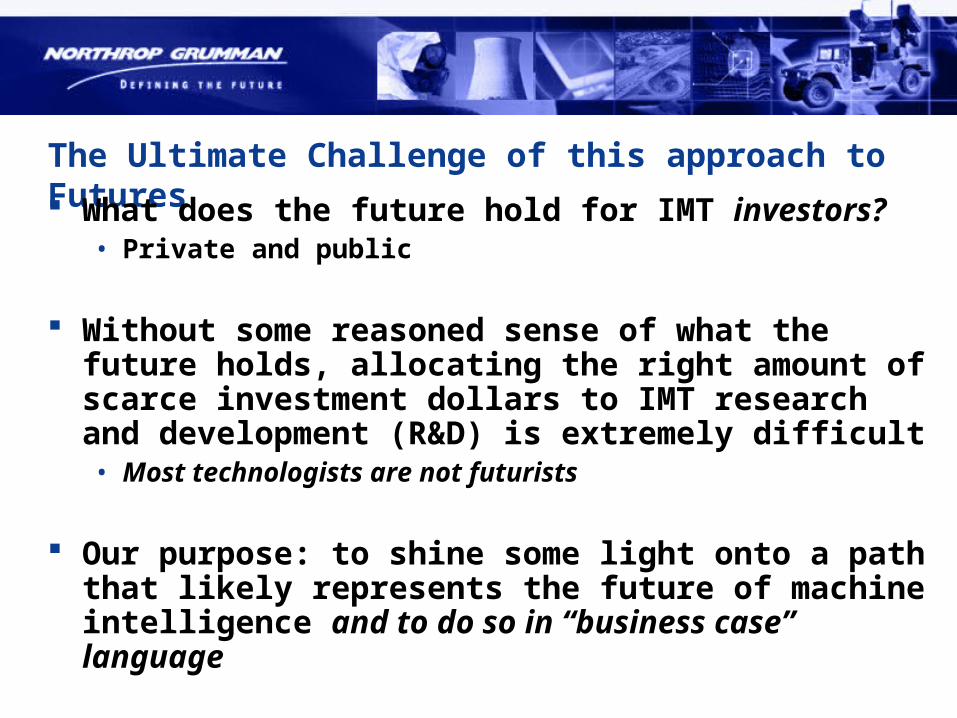
The Ultimate Challenge of this approach to Futures
What does the future hold for IMT investors?• Private and public
Without some reasoned sense of what the future holds, allocating the right amount of scarce investment dollars to IMT research and development (R&D) is extremely difficult • Most technologists are not futurists
Our purpose: to shine some light onto a path that likely represents the future of machine intelligence and to do so in “business case” language
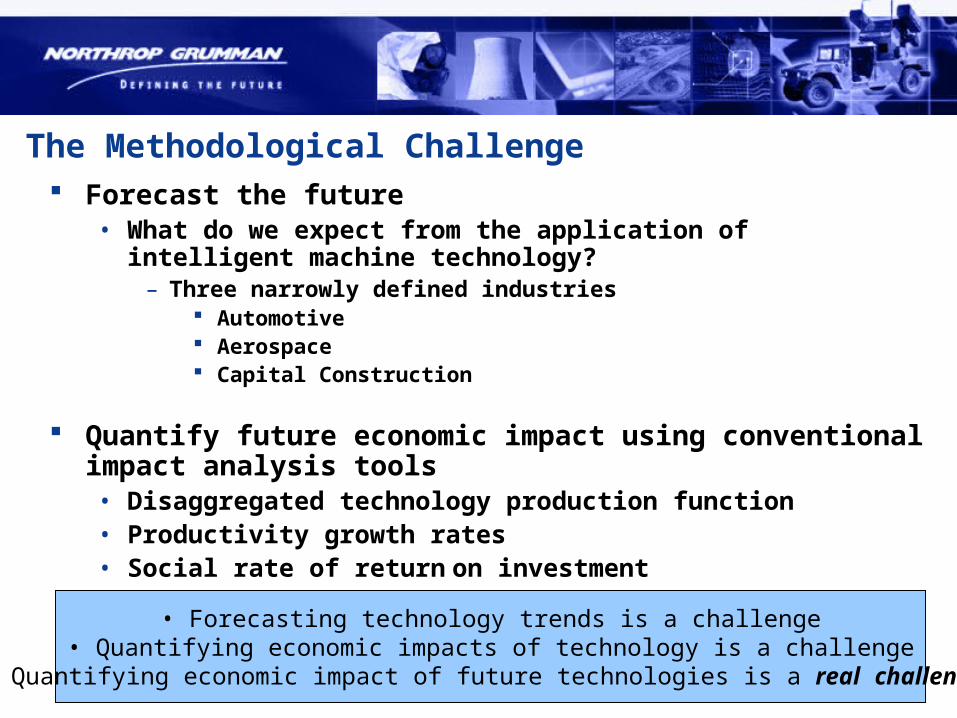
The Methodological Challenge Forecast the future
• What do we expect from the application of intelligent machine technology?
– Three narrowly defined industries Automotive Aerospace Capital Construction
Quantify future economic impact using conventional impact analysis tools• Disaggregated technology production function• Productivity growth rates• Social rate of return on investment
• Forecasting technology trends is a challenge• Quantifying economic impacts of technology is a challenge
• Quantifying economic impact of future technologies is a real challenge!
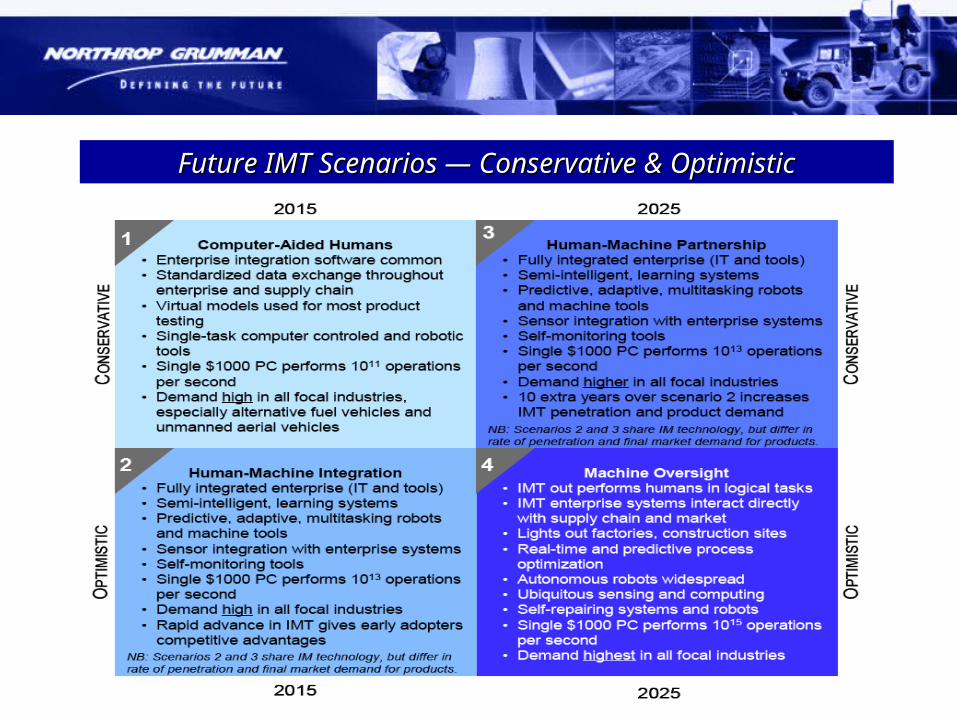
Future IMT Scenarios — Conservative & OptimisticFuture IMT Scenarios — Conservative & Optimistic
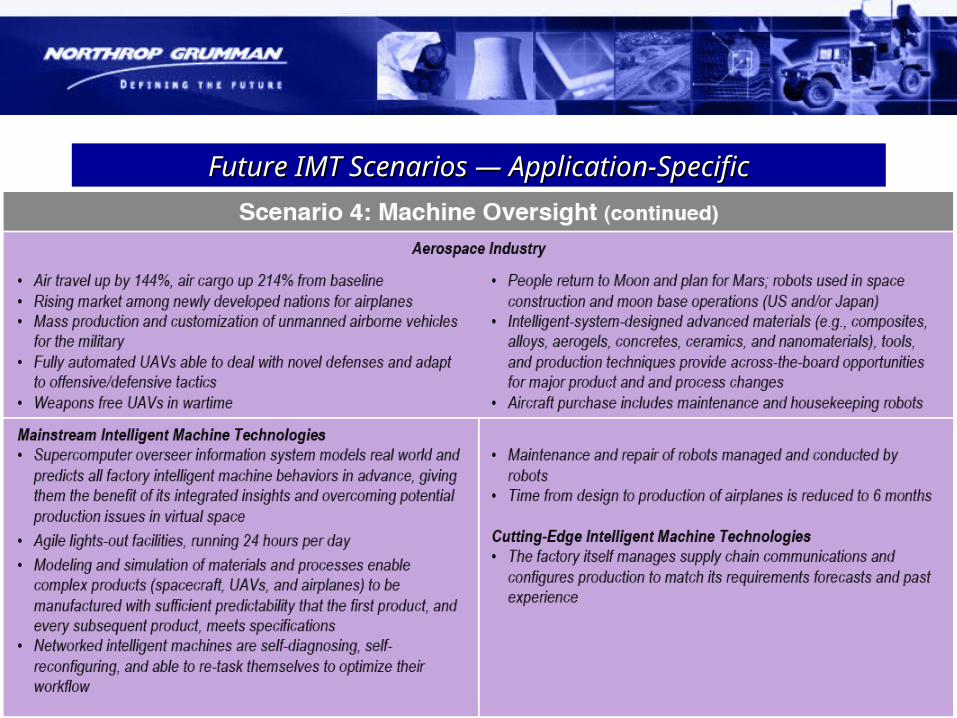
Future IMT Scenarios — Application-SpecificFuture IMT Scenarios — Application-Specific
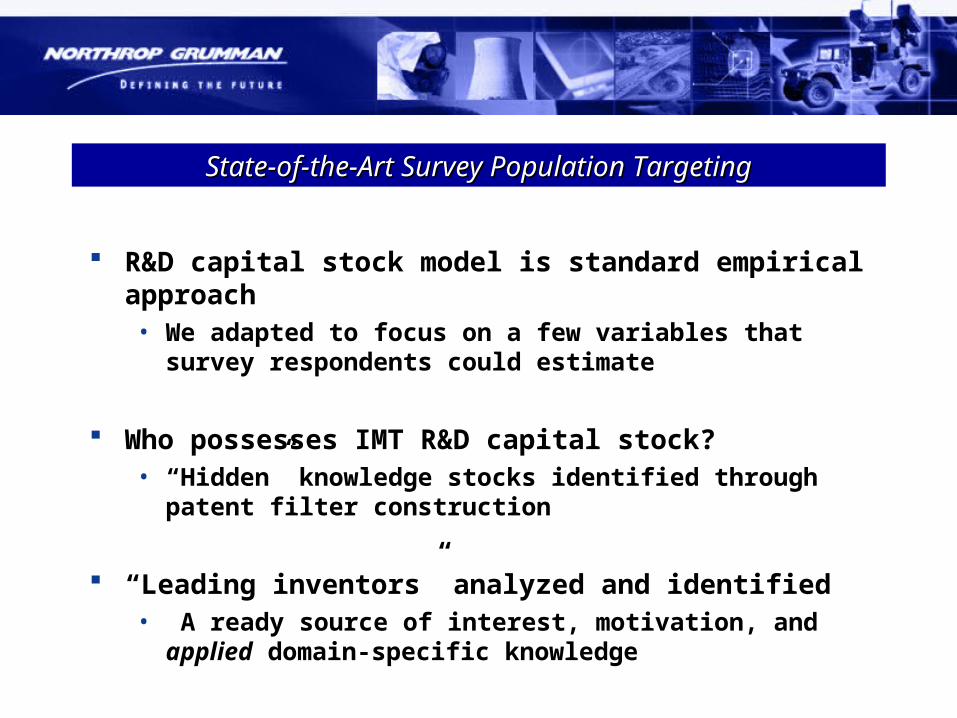
State-of-the-Art Survey Population TargetingState-of-the-Art Survey Population Targeting
R&D capital stock model is standard empirical approach• We adapted to focus on a few variables that survey
respondents could estimate
Who possesses IMT R&D capital stock?• “Hidden” knowledge stocks identified through patent filter
construction
“Leading inventors” analyzed and identified• A ready source of interest, motivation, and applied
domain-specific knowledge
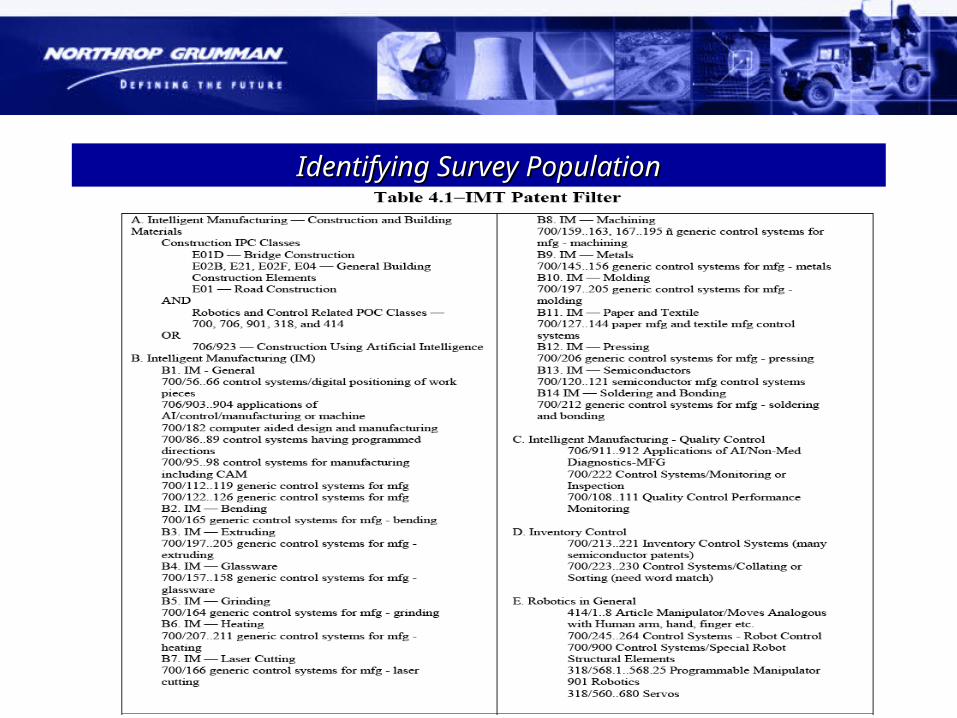
Identifying Survey PopulationIdentifying Survey Population
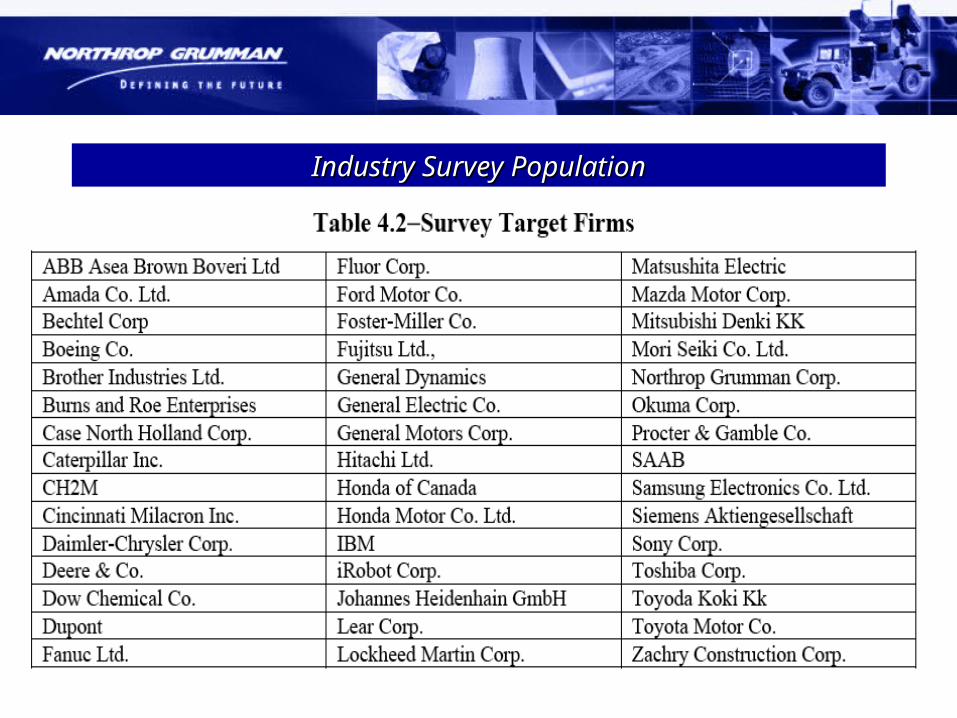
Industry Survey PopulationIndustry Survey Population
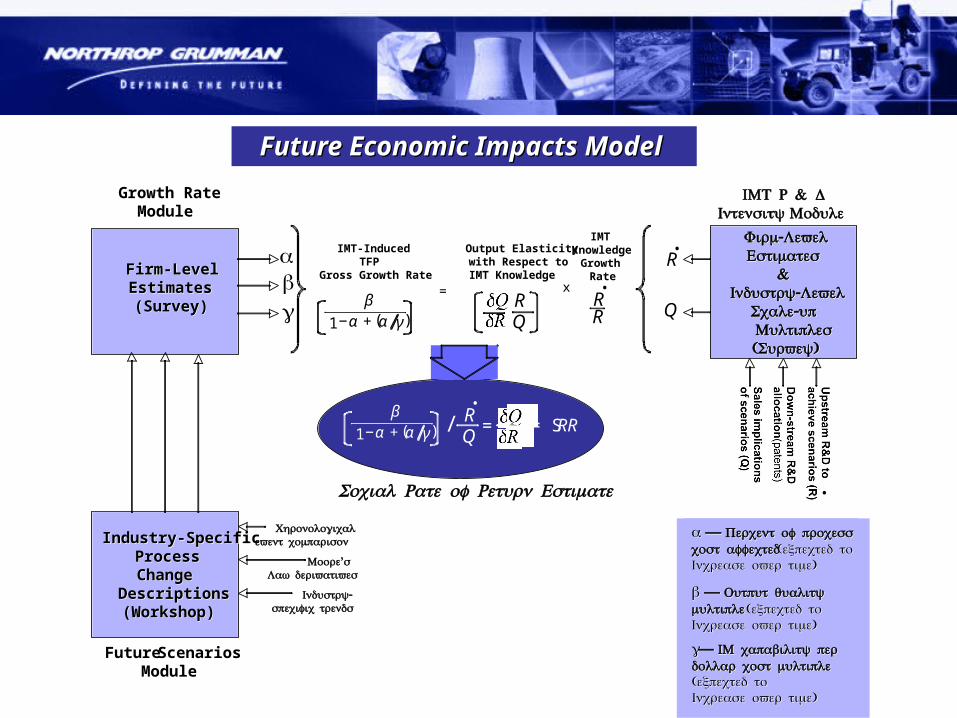
Firm-LevelFirm-LevelEstimatesEstimates(Survey)(Survey)
Growth RateModule
Industry-SpecificIndustry-SpecificProcessProcessChangeChange
DescriptionsDescriptions(Workshop)(Workshop)
Future ScenariosModule
αβγ
αα —— Percent of process Percent of process cost affected cost affected( expected to( expected to
)Increase over time )Increase over time
ββ —— Output quality Output quality multiple multiple( expected to( expected to )Increase over time )Increase over time
γγ—— IM capability per IM capability per dollar cost multiple dollar cost multiple
( expected to( expected to )Increase over time )Increase over time
Chronological event comparison
Moore’s Law derivatives
-Industry specific trends
-Firm Level-Firm LevelEstimatesEstimates
&&-Industry Level-Industry Level-Scale up-Scale up
Multiples Multiples( )Survey( )Survey
& IMT R DIntensity Module
Social Rate of Return Estimate
= S RR/ =QR
Future Economic Impacts ModelFuture Economic Impacts Model
Q
RIMT-Induced
TFPGross Growth Rate
Output Elasticitywith Respect toIMT Knowledge
RR
IMT Knowledge
Growth Rate
x=
.
+− )(1 γααβ
+− )(1 γααβ
QR
.
.
.

The Results

IMT R&D Productivity Growth Rates and ROIIMT R&D Productivity Growth Rates and ROI

The Implications

“It Takes a Village” — Disaggregated Production Function
Surveyed firms report that they would invest much more in IMT R&D if they could appropriate all of those social returns
• We asked how much they would invest if they could appropriate all of the returns generated by their IMT R&D investments
– IMT R&D intensities roughly double
• This underlines the importance of government supported IMT-R&D investments to counteract spillovers
Surveyed firms believe that government funding of IMT R&D will be important if the anticipated developments in IMT are to be achieved by 2025
• Respondents believe compliance with industry technical standards is increasingly important for the success of the next generations of IMT-based products
• Some concern about whether the government and industry will fulfill their roles with regard to the level and composition of funding to achieve the 2025 level of advancement
These findings are consistent with the New Innovation Economics thrustNew Innovation Economics thrust being promoted by the Information Technology & Innovation Foundation (ITIF)

Disaggregated Production FunctionDisaggregated Production Function
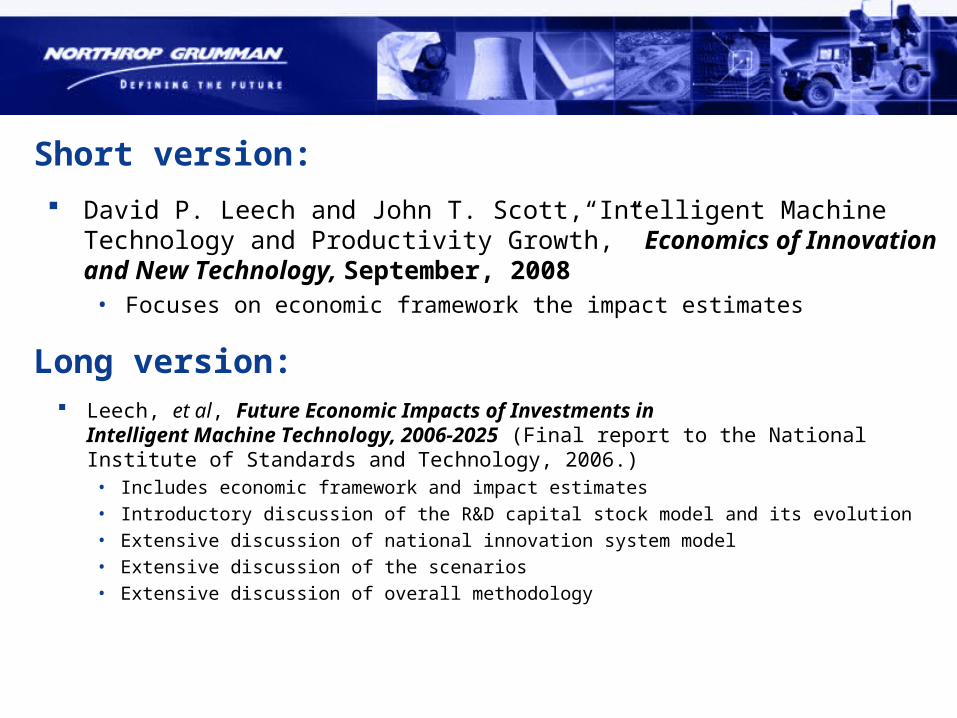
Short version:
David P. Leech and John T. Scott,“Intelligent Machine Technology and Productivity Growth,” Economics of Innovation and New Technology, September, 2008
• Focuses on economic framework the impact estimates
Long version: Leech, et al, Future Economic Impacts of Investments in
Intelligent Machine Technology, 2006-2025 (Final report to the National Institute of Standards and Technology, 2006.)
• Includes economic framework and impact estimates
• Introductory discussion of the R&D capital stock model and its evolution
• Extensive discussion of national innovation system model
• Extensive discussion of the scenarios
• Extensive discussion of overall methodology
Analytical Approaches to Technology Scouting
— “Bridge Building” —
Technology-to-Product KPP Mapping• A framework for determining where your
technology gets the greatest bang for the buck
Automated Technology Frontiers • Automated (low-cost), quantitative technology
frontiers generator
Innovation Communication Protocols (ICPs)• An infrastructure tool for improving the
effectiveness of technology transfer in general
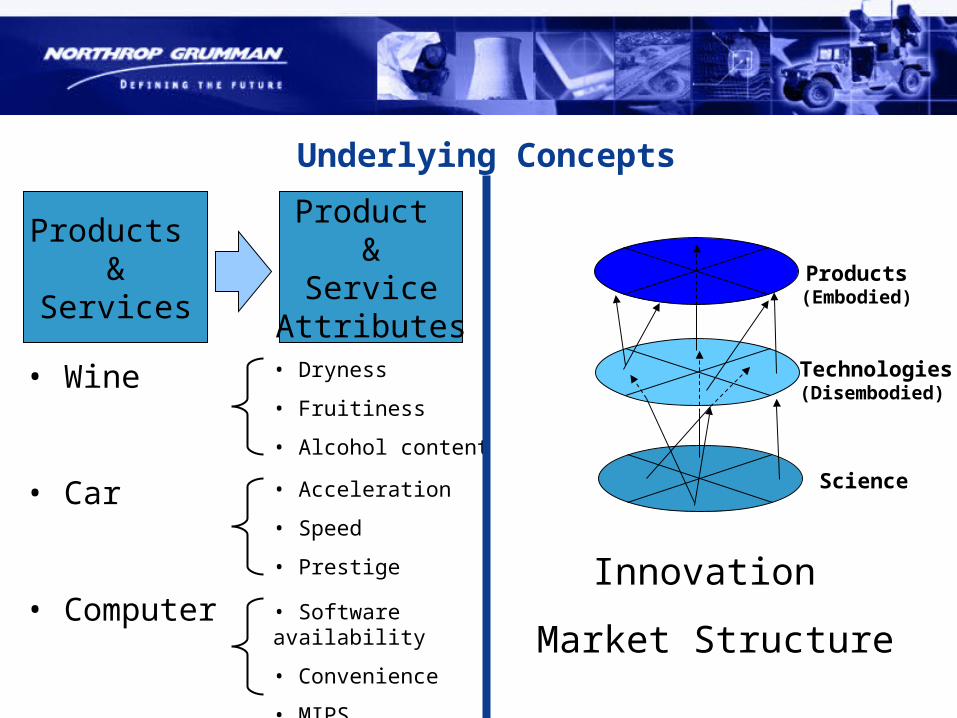
Underlying Concepts
Products &
Services
Product &
ServiceAttributes
• Wine
• Car
• Computer • Software availability
• Convenience
• MIPS
• Acceleration
• Speed
• Prestige
• Dryness
• Fruitiness
• Alcohol content
Technologies(Disembodied)
Products(Embodied)
Science
Innovation
Market Structure

Technology-to-Product KPP Mapping — Tying Laboratory Advances to Commercially Relevant Market-Drivers
TechnologyUsers
(Manufacturers)
TechnologySuppliers
(Corporate, Government,& University Labs)
Describe Innovation Market Structure1
2
Identify Key Invention Advances
TASCAnalyst
LaboratoryScientist
3Identify Cost- & Quality-
Driving PerformanceAttributes
X
Z
Y
Performance
Cost&Qual
$4X
$2Z
$10Y
Y
4
Y =Cost -Driving Attribute• Pull Cost ?• Future ROI ?
Assess 2 w/Respect to 3
SelectedInterviews
E-mailSurvey
Either
Or
5
Develop& Test
AssessmentMethodology
Y =
Similar to Similar to TFP Model TFP Model used in IMTused in IMT
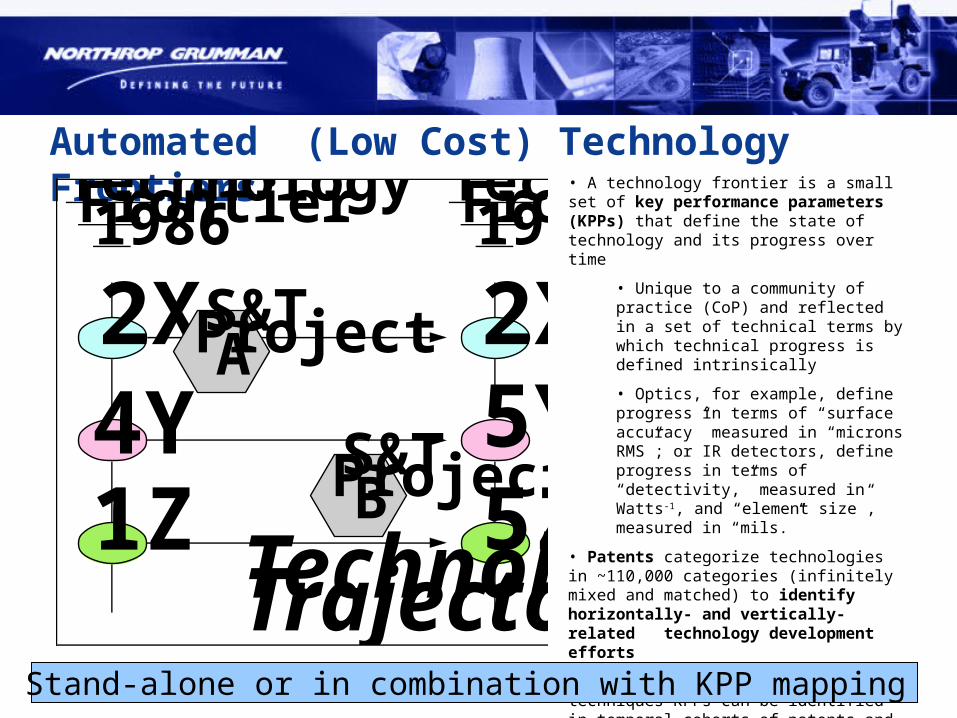
Automated (Low Cost) Technology FrontiersTechnologyFrontier1996
TechnologyFrontier1986
2X4Y1Z
5Y2X
5ZTechnologyTrajectory
S&TProjectA
S&TProjectB
• A technology frontier is a small set of key performance parameters (KPPs) that define the state of technology and its progress over time
• Unique to a community of practice (CoP) and reflected in a set of technical terms by which technical progress is defined intrinsically
• Optics, for example, define progress in terms of “surface accuracy” measured in “microns RMS”; or IR detectors, define progress in terms of “detectivity,” measured in Watts-1, and “element size”, measured in “mils.”
• Patents categorize technologies in ~110,000 categories (infinitely mixed and matched) to identify horizontally- and vertically-related technology development efforts
• With sophisticated search techniques KPPs can be identified in temporal cohorts of patents and rates of progress modeled
• A low-cost approach to identifying KPPS over time!
Stand-alone or in combination with KPP mapping

Innovation Communication Protocols Science and Technology Estates
• Organizations and individuals have different drivers– Sources place a high value of novelty– Brokers place a high value on profitability– Users place a high value on utility
Members of one estate, type of organization, or subfield do not have an effective and efficient means to communicate the readiness of a scientific or technological innovation to transfer to other estates, organizations, or fields*
Organizations talk and think differently about S&T innovation because they have different goals and incentive structures
Ineffective communication increases technical and commercial risk, while slowing the flow innovation from one estate to another
Solution: “Innovation Communication Protocols” or ICPs

Innovation Communication Protocols (Continued)
Standard tool for effectively and efficiently communicating information among innovation estates• Think in terms of inter-estate TRLs
ICPs are multi-tiered, qualitative heuristic algorithms that grade innovation characteristics along a continuum from theory to product in a format that is readily comprehensible across estates
Initial ICPs • will focus on innovation maturity and innovation scope• will be field or subfield specific • will be developed in close collaboration with all innovation estates
Post-project work will extend ICPs to organizational maturity and financial maturity and look for commonality among field ICPs
Summary
The recognition that the National Innovation System is comprised of multiple estates is essential to effective business and government policy
Bridging the real differences between estates is essential for actionable futures and for technology scouting
Actually building the analytical bridges — KPP Mapping or ICP — is interesting, useful, and hard
Progress depends on it!
Contact Information
David P. LeechDavid P. LeechSenior Analyst for Industry & Technology Senior Analyst for Industry & Technology EvaluationEvaluationIntelligence Group (TASC)Intelligence Group (TASC)Northrop Grumman Corporation Northrop Grumman Corporation 703-907-4075 (Rosslyn office)703-907-4075 (Rosslyn office)410-346-6338 (home office)410-346-6338 (home office)[email protected]@ngc.com
Thank You!

Backup
Intelligent Machine TechnologyIntelligent Machine Technology
IMT refers to any computational technology or system that senses its environment and adjusts its behavior based on sophisticated world modeling and value judgment to achieve its goals• Encapsulated in a computer program, intelligent sensor, or a robot
IMT embraces• Computer–aided design technologies• Computer numerically controlled (CNC) machine tools• Computer-controlled inspection systems• Enterprise integration information systems• Just-in-time production scheduling and inventory control technologies • Internet technologies that enable out-sourcing to the most efficient
suppliers• Multi-spectral measurement systems for construction site metrology
What is a “Social Rate of Return (SRR)”? The social rate of return (SRR) is a form of a standard financial metric known as
the internal rate of return (IRR)
The IRR is derived from the calculation of Net Present Value (NPV)
IRR is the discount rate that makes the NPV of an investment equal to zero
NPV=0 is the breakeven condition for an investment• Accept the project if IRR > the discount rate • Reject the project if the IRR < the discount rate
When the IRR is calculated to evaluate the impact of an R&D investment by a single organization it is called the private rate of return (PRR)
When the IRR is calculated to evaluate the impact of R&D across a number of firms, it is called the social rate of return (SRR)
Compared to what? Past econometric studies of R&D impacts employing a total
factor productivity (TFP) approach report industry-level annual social rates of return between 61percent and 162 percent • Annual social rates of return of 72%-77% look modest by comparison
However, past studies plagued with measurement difficulties • Overestimation due to difficulties with holding constant forces
other than R&D spending • Inability to account for launch costs (would tend to reduce RoR)
Our approach• Focuses on R&D productivity impact alone• Directly accounts for launch costs (which are quite substantial)• Reports relatively high productivity increases and social rates of
return that represent a very impressive indicator of future economic impact
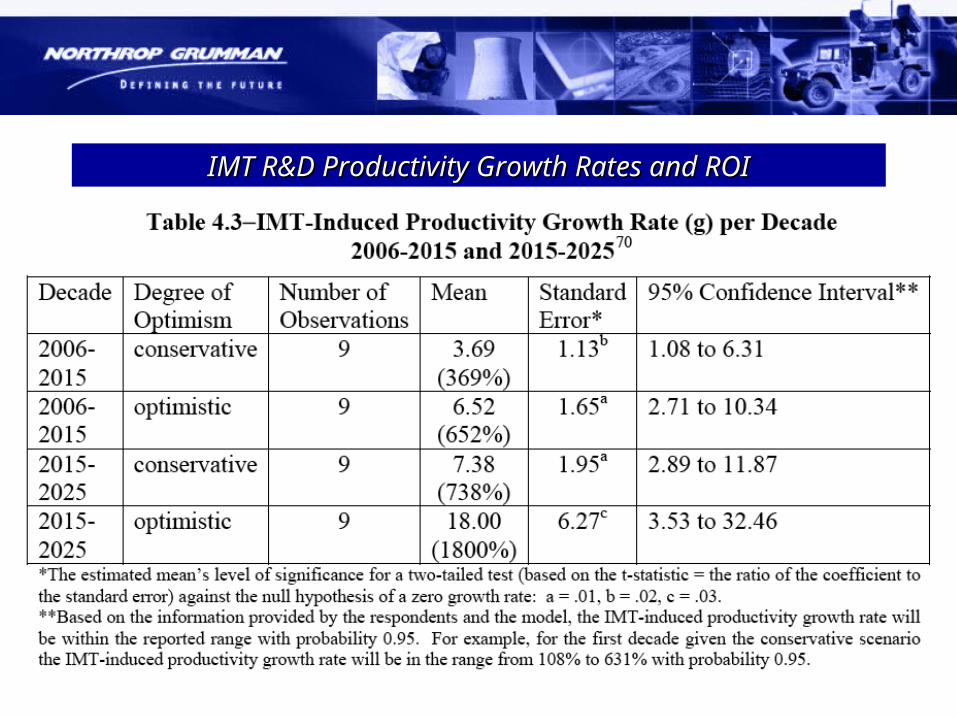
IMT R&D Productivity Growth Rates and ROIIMT R&D Productivity Growth Rates and ROI
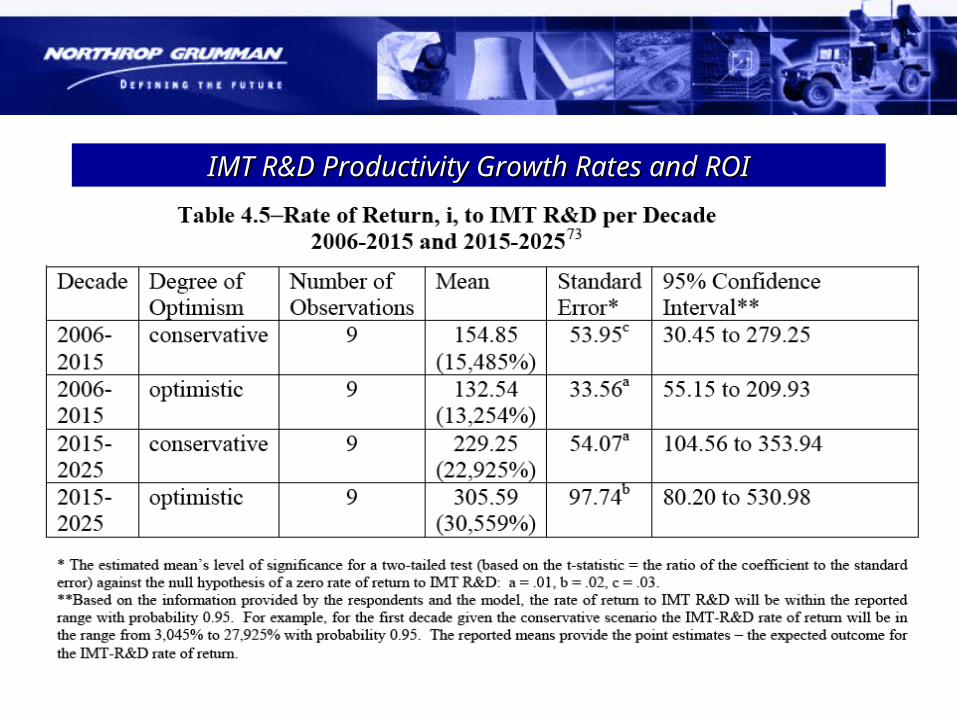
IMT R&D Productivity Growth Rates and ROIIMT R&D Productivity Growth Rates and ROI