targeted surveys to improve leadbeater's possum … · leadbeater’s possum targeted surveys...
TRANSCRIPT
Targeted surveys to improve Leadbeater's Possum conservation
J.L. Nelson, L.K. Durkin, J.K. Cripps, M.P. Scroggie, D.B. Bryant, P.V. Macak and L.F. Lumsden
November 2017
Arthur Rylah Institute for Environmental Research Technical Report Series No. 278

Photo credit Leadbeater’s Possums photographed during targeted surveys (DELWP, ARI).
© The State of Victoria Department of Environment, Land, Water and Planning 2017
This work is licensed under a Creative Commons Attribution 4.0 International licence. You are free to re-use the work under that licence, on the condition that you credit the State of Victoria as author. The licence does not apply to any images, photographs or branding, including the Victorian Coat of Arms, the Victorian Government logo and the
Department of Environment, Land, Water and Planning (DELWP) logo. To view a copy of this licence, visit http://creativecommons.org/licenses/by/4.0/
Printed by Melbourne Polytechnic–Preston
ISSN 1835-3827 (print)
ISSN 1835-3835 (pdf)
ISBN 978-1-76047-941-1 (Print)
ISBN 978-1-76047-942-8 (pdf/online)
Disclaimer This publication may be of assistance to you but the State of Victoria and its employees do not guarantee that the publication is without flaw of any kind or is wholly appropriate for your particular purposes and therefore disclaims all liability for any error, loss or other consequence which may arise from you relying on any information in this publication.
Accessibility If you would like to receive this publication in an alternative format, please telephone the DELWP Customer Service Centre on 136186, email [email protected], or contact the National Relay Service on 133 677 or at www.relayservice.com.au. This document is also available on the internet at www.delwp.vic.gov.au.
Targeted surveys to improve Leadbeater's Possum conservation J.L. Nelson, L.K. Durkin, J.K. Cripps, M.P. Scroggie, D.B. Bryant, P.V. Macak and L.F. Lumsden
Jenny L. Nelson, Louise K. Durkin, Jemma K. Cripps, Michael P. Scroggie, David B. Bryant, Phoebe V. Macak and Lindy F. Lumsden Arthur Rylah Institute for Environmental Research
Department of Environment, Land, Water and Planning
Heidelberg, Victoria
November 2017
Leadbeater’s Possum Targeted Surveys (Project 1b)
Technical Report Series No. 278

Acknowledgements This project was funded by the Victorian Government’s Department of Environment, Land, Water and Planning (DELWP) through the implementation of the Leadbeater's Possum Advisory Group recommendations.
We thank James Todd, Beverley Smith and Kim Lowe (DELWP) for their support and facilitation of the project. This project could not have been done without the expertise of tree canopy specialists from Treetec, led by Mark Cashmore and including Harry Cole, Dave Coleman, Matt Lee, Kyle McLoughlin, Lucas Pearce, Ben Richards, Philipp Robeck, Russell Scott and Hayden Watt.
Dan Purdey (ARI), Dave Caldwell, Claire McCall, Rena Gaborov, Aileen Collyer (all Wildlife Unlimited), Bronwyn Hradsky (Treetec) and Lisa Beilharz (DELWP) assisted with field work. Lisa Beilharz assisted with examination of photographs.
We thank the following people for assistance with logistics and site information: Wally Notman and Nigel Brennan (DELWP, Powelltown), Kerrie Bayne (DELWP, Noojee), Geoff Kennedy (DELWP, Erica/Parkers Corner), John Towt (DELWP Toolangi), Craig Rutherford (VicForests, Noojee) and Chela Powell and Krystina Kny (VicForests, Melbourne). This project was conducted under the Victorian Wildlife Act 1975 and the Victorian National Parks Act 1975 Research Permit Numbers 10006167 and 10007449, and Animal Ethics Committee approval number AEC 15/07.
Authors Jenny L. Nelson, Louise K. Durkin, Jemma K. Cripps, Michael P. Scroggie, David B. Bryant, Phoebe V. Macak and Lindy F. Lumsden Arthur Rylah Institute for Environmental Research Department of Environment, Land, Water and Planning
123 Brown Street Heidelberg, Victoria 3084
Editor Organic Editing
Report produced by: Arthur Rylah Institute for Environmental Research Department of Environment, Land, Water and Planning PO Box 137 Heidelberg, Victoria 3084 Phone (03) 9450 8600 Website: www.delwp.vic.gov.au
Citation Nelson, J.L., Durkin, L.K., Cripps, J.K., Scroggie, M.P., Bryant, D.B., Macak, P.V. and Lumsden, L.F. (2017). Targeted surveys to improve Leadbeater's Possum conservation. Arthur Rylah Institute for Environmental Research Technical Report Series No. 278. Department of Environment, Land, Water and Planning, Heidelberg, Victoria.

Targeted surveys to improve Leadbeater's Possum con servationArthur Rylah Institute for Environmental Research Technical Report Series No. 278
i
Contents
Summary ........................................... ................................................................................ 1
1. Introduction ................................... ................................................................................ 3
2. Methods ........................................ ................................................................................. 5
2.1 Study area .................................... .............................................................................................................. 5
2.2 Site selection ................................ .............................................................................................................. 5 2.2.1 Site selection based on the occupancy model . ................................................................................ 5 2.2.2 Site selection to develop clusters of exclusi on zones .......................................... ........................... 6
2.3 Survey method ................................. .......................................................................................................... 6
2.4 Habitat assessments ........................... ...................................................................................................... 7 2.4.1 Measurement of habitat attributes ........... .......................................................................................... 7
2.5 Data analysis ................................. ............................................................................................................. 9 2.5.1 Analysis of habitat attributes .............. ................................................................................................ 9 2.5.2 Assessing the probability of detection using camera traps ...................................... ..................... 9 2.5.3 Testing predictive performance of existing oc cupancy models for Leadbeater’s Possum ............................................ ............................................................................................................ 10
3. Results ........................................ ................................................................................. 12
3.1 Survey results ................................ .......................................................................................................... 12
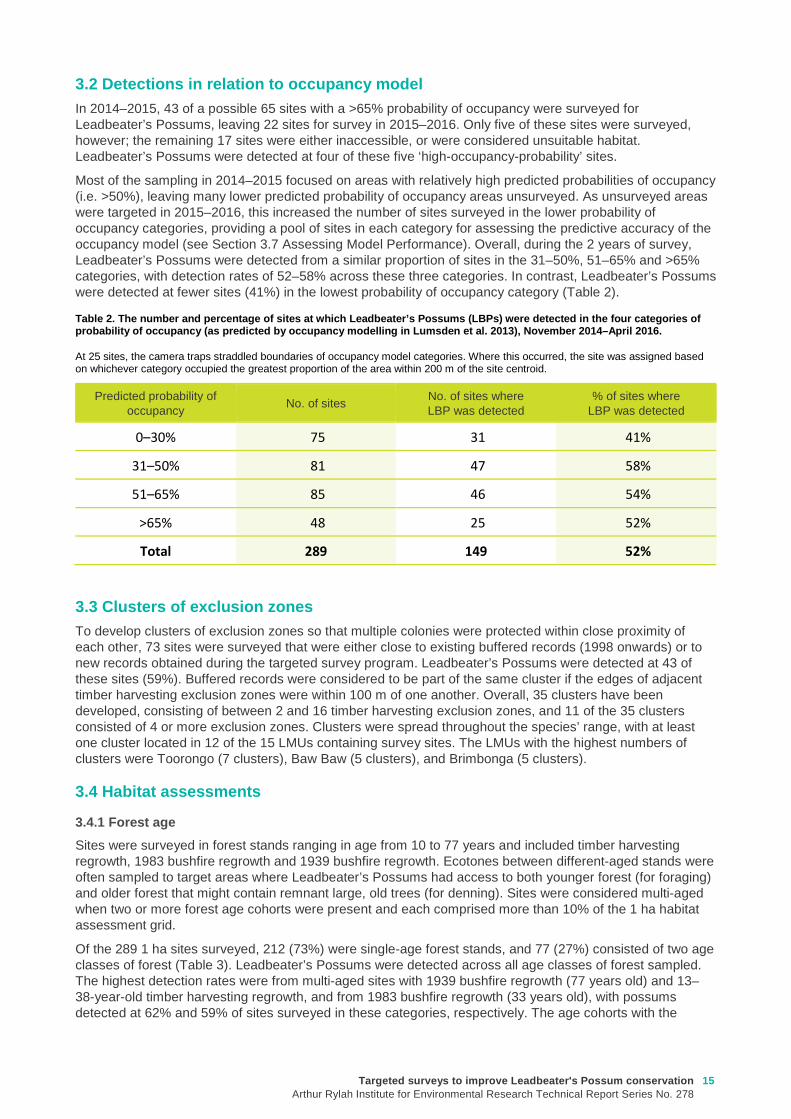
3.2 Detections in relation to occupancy model ..... ..................................................................................... 15
3.3 Clusters of exclusion zones ................... ................................................................................................ 15
3.4 Habitat assessments ........................... .................................................................................................... 15 3.4.1 Forest age .................................. ......................................................................................................... 15 3.4.2 Habitat attributes .......................... ...................................................................................................... 16
3.5 Probability of detection using arboreal camera traps ............................................. ............................ 20
3.6 Assessment of model performance ............... ........................................................................................ 21
4. Discussion ..................................... .............................................................................. 23
4.1 Survey results ................................ .......................................................................................................... 23
4.2 Influence of forest age on Leadbeater's Possum occurrence ........................................ .................... 23
4.3 Influence of habitat variables on Leadbeater’s Possum occurrence ................................. ................ 24
4.4 Probability of detection using arboreal camera traps ............................................. ............................ 25
4.5 Assessment of the performance of the existing o ccupancy model .................................... ............... 25
4.6 Future directions ............................. ........................................................................................................ 26
References ........................................ .............................................................................. 28
ii Targeted surveys to improve Leadbeater's Possum con servation
Arthur Rylah Institute for Environmental Research Technical Report Series No. 278
List of tables Table 1. The number of sites surveyed for Leadbeater’s Possums (LBPs) using camera traps, and the percentage of sites with LBP detections in Leadbeater’s Possum Management Units across the species’ Central Highlands range, September 2015–April 2016. .................................................................... 14 Table 2. The number and percentage of sites at which Leadbeater’s Possums (LBPs) were detected in the four categories of probability of occupancy (as predicted by occupancy modelling in Lumsden et al. 2013), November 2014–April 2016. ........................................................................................ 15 Table 3. The forest age cohorts and most recent stand-replacing disturbance events within the 1 ha survey sites, and the number and percentage of sites with Leadbeater’s Possum detections in the Central Highlands, November 2014–April 2016. ............................................................................................. 16
List of figures Figure 1. Tree canopy specialist setting a camera trap consisting of a Reconyx survey camera (circled left) set 2–3 m from a bait holder containing creamed honey (circled right). ........................................ 7 Figure 2. A 1 ha habitat sampling grid used to assess habitat variables at the Leadbeater’s Possum survey sites. ....................................................................................................................................................... 8 Figure 3. Leadbeater’s Possum (LBP) survey sites in Leadbeater’s Possum Management Units, showing where the species was detected over 2 years of surveys in the Central Highlands, November 2014–April 2016. ............................................................................................................................ 13 Figure 4. Two Leadbeater's Possums detected during camera-trap surveys, Toolangi State Forest, October 2015. .................................................................................................................................................. 14 Figure 5. Boxplot of the number of hollow-bearing trees (HBTs) counted on 1 ha plots at sites where Leadbeater’s Possums (LBPs) were and were not detected. .............................................................. 17 Figure 6. Boxplot of the numbers of live and dead hollow-bearing trees (HBTs) counted on 1 ha plots at sites where Leadbeater’s Possums (LBPs) were (light grey) and were not (dark grey) detected. .......................................................................................................................................................... 18 Figure 7. Boxplot of the basal area (mean m2 ha-1) of live and dead wattles (Acacia spp.) collected from survey sites with (light grey) and without (dark grey) Leadbeater’s Possum (LBP) detections. ............. 19 Figure 8. Mean connectivity scores (red triangles) for the canopy, midstorey (Mid) and shrub layers, collected from survey sites with and without Leadbeater’s Possum (LBP) detections. .................................. 20 Figure 9. Estimates of the probability of detecting Leadbeater’s Possums using one, two or three camera traps with three different models of Reconyx survey cameras after 21 and 30 days of sampling. ......................................................................................................................................................... 21 Figure 10. Receiver Operating Characteristic (ROC) curves showing the estimated predictive performance of the two occupancy models for Leadbeater’s Possums, fitted to the 2012 survey data (Lumsden et al. 2013) at the sites surveyed during the current camera-trapping surveys. (A) The occupancy model based only on available GIS data. (B) The model that also included on-site habitat assessment data. ................................................................................................................................. 22
Targeted surveys to improve Leadbeater's Possum con servationArthur Rylah Institute for Environmental Research Technical Report Series No. 278
1
Summary
In 2014, the Leadbeater’s Possum Advisory Group made 13 recommendations to support the recovery of the Critically Endangered Leadbeater’s Possum (Gymnobelideus leadbeateri) in the Central Highlands. One of these recommendations was to protect colonies by establishing timber harvesting exclusion zones, or buffers, around records from 1998 onwards and around all new verified records, with individual records assumed to indicate the presence of a colony at that location. To support the implementation of this recommendation, the Arthur Rylah Institute for Environmental Research commenced a 3-year program of targeted camera-trapping surveys to generate new records of Leadbeater’s Possum. In the first year (2014–2015), the surveys targeted the areas of State forest available for timber harvesting that were predicted (by modelling) to have a high probability of occupancy by Leadbeater’s Possums. The surveys also targeted areas close to existing records or close to any new records obtained during the surveys, with a view to forming ‘clusters’ of buffered colonies (i.e. multiple contiguous or near contiguous exclusion zones). Surveys in the second year of the targeted surveys (2015–2016) followed the same approach and also targeted areas of the species’ range that had not been surveyed in 2014–2015. Field assessments of critical habitat elements for the possum were undertaken at all sites surveyed since the commencement of the project in 2014. These data were analysed to improve understanding of the habitat requirements of Leadbeater’s Possum. This report summarises the results of the second year of the targeted surveys, and the results of the habitat assessments and analyses from both years of surveying. The results of the targeted surveys of the first year are summarised in Nelson et al. (2015).
A total of 176 sites were surveyed for the presence of Leadbeater’s Possum between September 2015 and April 2016, using three camera traps deployed for 3–4 weeks at each site, totalling 13,196 camera-trap nights. Overall, 289 sites were sampled during the 2 years of targeted surveys. Site selection generally targeted forest stands containing habitat features known to be important to Leadbeater’s Possum (particularly, well-connected midstorey vegetation). Sites were surveyed in forest stands ranging in age from 10 to 77 years and included timber harvesting regrowth, 1983 bushfire regrowth and 1939 bushfire regrowth. Habitat assessments were undertaken on 1 ha sampling plots at sites surveyed over the 2 years of the targeted survey program. Attributes assessed included age class, dominant eucalypt species, density and form of hollow-bearing trees, basal area of wattle (Acacia spp.) and extent of vegetation connectivity. Data were analysed to investigate whether habitat attributes differed between sites where Leadbeater’s Possums were detected and sites where they were not detected. The survey data were also analysed to assess the efficacy of the camera-trap survey method for detecting the species, and to evaluate the predictive performance of existing occupancy models.
In the second year of the targeted surveys, Leadbeater’s Possums were detected at 99 sites (56% of the 176 surveyed sites) across all age classes, with the highest proportion of records being from multi-aged sites containing both 1939 bushfire regrowth (77 years old) and 13–29-year-old timber harvesting regrowth. Since targeted surveys commenced in November 2014, Leadbeater’s Possums have been detected at 149 (52%) of the 289 sites sampled. Timber harvesting exclusion zones have been established around these 149 sites, including 38 sites identified in the 2015–2016 surveys that lay within areas designated for timber harvesting under the 2013–2016 Timber Release Plan. Thirty-five of the sites at which possums were recorded formed part of a cluster of exclusion zones (each comprising between 2 and 16 buffered records). The clustering has provided protection for multiple colonies (and their habitat) within close proximity, increasing the prospect of long-term persistence in these areas by protecting contiguous colonies or ‘neighbourhoods’ rather than just individual colonies.
A total of 717 hollow-bearing trees were located at the study sites over the 2 years of surveying. Numbers of hollow-bearing trees per site varied from zero to 21 (average 2.5/ha). Fifty-five percent of the sites sampled had no or very few hollow-bearing trees (0 or 1). Of the sites at which Leadbeater’s Possums were recorded, 25% contained no hollow-bearing trees within the 1 ha sampling plot. As camera traps detect the possums while they are moving through the forest and foraging, the locations of these individuals’ den sites remain unknown, but they are likely to be in hollow-bearing trees in parts of their home ranges outside the 1 ha sampling plots. Only 28% of the trees we identified as hollow bearing met the criteria for hollow-bearing trees as defined in the Leadbeater’s Possum Survey Standards. Although habitat assessments were limited to 1 ha, if it can be assumed that similar densities of hollow-bearing trees occur in the 3 ha areas around each site to those we observed on the 1 ha plots, only 2.8% of sites would meet the criteria for high-quality habitat for Leadbeater’s Possum (Zone 1A habitat) as defined by the Survey Standards. Similarly, only 3.4% of the 149 sites where Leadbeater’s Possums were detected over the 2 years of the surveys would meet the criteria for Zone 1A habitat. Sites at which Leadbeater’s Possums were detected had significantly higher

2 Targeted surveys to improve Leadbeater's Possum con servation
Arthur Rylah Institute for Environmental Research Technical Report Series No. 278
basal areas of live wattle, and midstorey connectivity scores, than sites at which the species was not detected.
Camera trapping was found to be an effective method for detecting Leadbeater’s Possums. The method we used in 2015–2016, in which three cameras were set for 3–4 weeks, resulted in a high probability of detecting possums on occupied sites (i.e. >0.80). The detection probability analysis showed that deploying more camera traps at each site and increasing the length of deployment increased the probability of detection. Other covariates (including the Reconyx camera model, camera height, season and camera placement) had little impact on Leadbeater’s Possum detectability. Detection probabilities in 2015–2016 were around 10% higher than when two camera traps were deployed in the surveys in 2014–2015, reducing the possibility of failing to detect possums at occupied sites.
Analysis of the predictive performance of the GIS-based occupancy model, which was developed from survey data collected at randomly selected sites in 2012, found that this model performed poorly at predicting the presence or absence of Leadbeater’s Possums at sites that were surveyed in 2014–2016. The version of the model that incorporated on-site structural and habitat data improved the model’s predictive accuracy, highlighting the importance of these variables as predictors of habitat quality for this species. Spatial data layers of some of these critical habitat features are currently being developed from remotely sensed LiDAR and infra-red imagery data. These spatial data layers have the potential to contribute greatly to the development of improved models for predicting the presence of Leadbeater’s Possum for management purposes.
Our results indicate that hollow-bearing trees are in low numbers across the areas of State forest we surveyed. The remaining hollow-bearing trees will be critical for providing denning habitat for Leadbeater’s Possum in coming years. There remains, however, a predicted future shortage of hollows, and it may be necessary to supplement these natural hollows, using alternative approaches for providing den sites while natural hollows develop over the coming decades. Stands of multi-age forest are likely to be providing a mixture of older forest containing den sites in remnant large, old hollow-bearing trees, and younger forest with the dense structure required by the possums for movement, and wattles for foraging. This is consistent with the foraging requirements of Leadbeater’s Possum: gum produced by wattles is an important component of the possum’s diet, while dense vegetation provides a structurally well-connected layer for these small non-gliding possums to move through. These attributes have also proved to be important as predictors of habitat quality for Leadbeater’s Possum.
The 2 years of targeted surveys have been effective in locating colonies of Leadbeater’s Possum, which have now been protected from timber harvesting. The surveys have also provided information on the species’ current distribution in State forest throughout their range, the critical habitat elements present in areas occupied by the possums, and insights into the range of forest age classes used. However, due to the very targeted nature of the sampling design, these data have limited use for improving predictive models. Therefore, in the final year of the surveys (2016–2017), the sampling design will be changed, with sampling carried out in all land tenures, including areas burnt in the 2009 bushfires, using a randomised sampling design. To provide a high level of confidence that the possums will be detected at sites where they occur (i.e. to minimise the chance of false negatives), three camera traps will be deployed at each survey site for 4 weeks. Once available, spatial data layers of critical habitat features for the possum, together with the 2016–2017 randomised survey data, will be incorporated into an updated occupancy model, with the aim of improving capacity to accurately predict where Leadbeater’s Possum occurs throughout its geographic range.

Targeted surveys to improve Leadbeater's Possum con servationArthur Rylah Institute for Environmental Research Technical Report Series No. 278
3
1. Introduction
Victoria’s state faunal emblem, the Leadbeater's Possum (Gymnobelideus leadbeateri), is listed as Critically Endangered under the Commonwealth Environment Protection and Biodiversity Conservation Act 1999, and Threatened under Victoria’s Flora and Fauna Guarantee Act 1988. Leadbeater’s Possum has a highly restricted distribution, only occurring in an area of approximately 70 × 80 km in the Central Highlands of Victoria, north-east of Melbourne. Most of the Leadbeater’s Possum population occurs in montane ash forests, dominated by Mountain Ash (Eucalyptus regnans), Alpine Ash (E. delegatensis) or Shining Gum (E. nitens) (Lindenmayer et al. 1989, Harley 2004). There is approximately 196,000 ha of montane ash forest in the Central Highlands, which accounts for 96% of the potentially suitable habitat within the species’ range (Leadbeater’s Possum Advisory Group 2014a).
Extensive bushfires in 2009 burnt 34% of the potentially suitable habitat for Leadbeater’s Possum throughout its Central Highlands range (Leadbeater’s Possum Advisory Group 2014a). Fire is both a direct and indirect threat to Leadbeater’s Possum, resulting in mortality, destruction of food resources, alteration of forest structure and loss of hollow-bearing trees, with the dead hollow-bearing trees that are typically used by the possums for denning being at particular risk from fire (Lindenmayer and Possingham 1995). Leadbeater's Possum was severely impacted by the 2009 bushfires, with subsequent surveys indicating the possums failed to survive in burnt areas, irrespective of fire intensity (Lindenmayer et al. 2013a, Lumsden et al. 2013, Harley 2016).
Loss of critical habitat resources as a result of timber harvesting is also a threat to Leadbeater’s Possum. About one-third of their potential habitat across the Central Highlands is available for timber harvesting (Leadbeater’s Possum Advisory Group 2014a). During clearfelling, the traditional method of timber harvesting in Victorian ash forest, all merchantable trees are removed in a single operation, resulting in an even-aged stand of regrowth forest with few or no hollow-bearing trees. Harvest rotations are typically 60–80 years, which is too short for hollows to form (hollow formation commences at approximately 120 years, although hollows typically used by Leadbeater’s Possum do not form until trees are older than 190 years: Smith and Lindenmayer 1988, Lindenmayer et al. 1991a). Hollow-bearing trees are therefore restricted to adjacent protected areas, parts of the coupe retained for biodiversity or operational reasons, or sites where retention regrowth harvesting has occurred. The dense midstorey vegetation required by Leadbeater's Possum for foraging and movement is also removed during harvesting; this regenerates relatively quickly compared with the time taken for hollows to develop, and it may become suitable for their use within 15 years of harvesting (Smith and Lindenmayer 1992).
In 2013, the Leadbeater’s Possum Advisory Group (LPAG) was established to provide recommendations that support the recovery of Leadbeater’s Possum, while maintaining a sustainable timber industry. A key recommendation from LPAG was to protect known Leadbeater’s Possum colonies by establishing 200 m-radius timber harvesting exclusion zones around the sites of all records from 1998 onwards and of all new verified records (Leadbeater’s Possum Advisory Group 2014b). All 13 LPAG recommendations were accepted by the Victorian government and are currently being implemented.
As the locations of only a proportion of all extant colonies were known, a key LPAG action was to undertake targeted surveys to locate additional colonies for protection. The targeted surveys were initially planned to be undertaken over 5 years, but were accelerated for completion within 3 years to ensure that new colonies were identified and protected more quickly. The Arthur Rylah Institute for Environmental Research (ARI) was engaged to conduct the survey program, which commenced in 2014 (Nelson et al. 2015).
Another LPAG recommendation was to delay harvesting for 2 years in areas predicted to have a high probability of occupancy by Leadbeater’s Possums, to enable surveys to be undertaken and colonies protected where found (Leadbeater’s Possum Advisory Group 2014b). The areas to be placed under the moratorium were determined by where it was predicted there would be a >65% likelihood of occupation by the species [using an occupancy model developed from survey data collected throughout the Central Highlands in 2012 (Lumsden et al. 2013)].
In the first year of the targeted surveys (2014–2015), 113 sites were surveyed across the range of Leadbeater’s Possum; new colonies were located at 50 (44%) of these sites (Nelson et al. 2015). Timber harvesting exclusion zones were immediately implemented to protect these colonies and their habitat. These surveys were very targeted, focusing on areas of the species’ range where the possum was predicted by the occupancy model to be most likely (>65% likely) to occur, together with the surrounding areas. The surveys also focused on areas with Leadbeater’s Possum records from the past 15 years (from 1998 onwards) and

4 Targeted surveys to improve Leadbeater's Possum con servation
Arthur Rylah Institute for Environmental Research Technical Report Series No. 278
those close to newly located colonies. This strategy of developing clusters of exclusion zones (i.e. a number of contiguous or near contiguous exclusion zones) provides protection for multiple colonies in close proximity, increasing the prospect for long-term persistence of the species in these areas. This is because larger, near contiguous areas of occupied habitat can support more colonies of possums, and are demographically more stable and less prone to loss of genetic diversity and extinction than a series of smaller, isolated occupied patches of the same total area (Lande 1988, Lindenmayer and Lacy 1995, Lindenmayer 2000).
A key aim of the second year of targeted surveys (2015–2016) was to survey additional sites predicted to have a high probability of possums being present, and to continue to build clusters of exclusion zones by surveying habitat in close proximity to previous records. In addition, surveys in 2015–2016 targeted areas of State forest that were not surveyed in 2014–2015, in order to increase protection from timber harvesting for colonies across the species’ range. A secondary aim was to complete field assessments of critical habitat elements for the possum across all sites surveyed since targeted surveys commenced in 2014. These data have now been analysed, together with the survey data from both years of sampling, to build on existing habitat models that contribute to our understanding of the habitat requirements of Leadbeater’s Possum. These analyses have included an assessment of the efficacy of the camera-trap survey method for detecting Leadbeater’s Possum, and an evaluation of the predictive performance of the existing occupancy models (Lumsden et al. 2013) when predicting the presence of Leadbeater’s Possum throughout the range.
This report summarises the results of the second year of the targeted surveys, and reports on the results of the habitat assessments and analyses from both years of surveying. Nelson et al. (2015) summarises the results from the first year of targeted surveys.

Targeted surveys to improve Leadbeater's Possum con servationArthur Rylah Institute for Environmental Research Technical Report Series No. 278
5
2. Methods
2.1 Study area This study was conducted within the Central Highlands of Victoria, south-eastern Australia (37° 20' – 37° 56' S; 145° 26' – 146° 23' E), in the Central Highlands Regional Forest Agreement Area. Leadbeater's Possum habitat within the montane ash forest of this area ranges from 500 to 1300 m in altitude. The climate is characterised by mild summers and cool, humid winters. Mean annual rainfall varies from 914 to 1480 mm, with periodic snow occurring on the higher peaks (Bureau of Meteorology Online Climate Statistics, www.bom.com.au).
Twenty-one Leadbeater’s Possum Management Units (LMUs) have been delineated across the known range of Leadbeater’s Possum within the Central Highlands to assist with management (Smith and Morey 2001, Leadbeater’s Possum Advisory Group 2014b). These are based on forest blocks, and factor in the extent and spatial distribution of montane ash forest in the region. Each LMU generally contains 6000–10,000 ha of ash forest, in contiguous patches. LMUs have been used in this report to make geographic comparisons within the species’ range.
2.2 Site selection As the primary aim of the targeted surveys was to maximise the location of new Leadbeater’s Possum colonies for protection, all sites were positioned within State forest in areas available for timber harvesting, i.e. in General Management Zones (GMZs) or Special Management Zones (SMZs), and in vegetation types known to be used by Leadbeater’s Possum, i.e. in montane ash forest (Nelson et al. 2015). The targeted sampling approach used in the surveys in 2014–2015 was again adopted in 2015–2016, focusing on areas identified as most likely to be occupied by the species. This included targeting:
• unsurveyed areas modelled as ‘high probability of occupancy’ from ARI’s spatial occupancy model (Lumsden et al. 2013), focusing on the >65% probability areas, plus adjacent areas with lower probability of occupancy;
• locations near Leadbeater’s Possum records from within the past 15 years or close to newly located colonies (to develop clusters of protected colonies); and
• known hotspot areas with a high density of records (e.g. 1983 fire regrowth in the Yarra State Forest between Warburton and Powelltown).
As in 2014–2015, a wide range of forest age classes (10–77 years) and disturbance histories were surveyed (timber harvesting regrowth, 1983 bushfire regrowth and 1939 bushfire regrowth), although timber harvesting regrowth from the last 10 years and areas burnt in 2009 were avoided because these had a lower probability of colonies being present (Lindenmayer et al. 2013a, Lumsden et al. 2013). Sites were spread throughout the species’ geographic range to increase the likelihood of new protection zones in a number of different areas to spread the risk to the species from future large bushfires. In the second year of surveys, areas that were not surveyed in 2014–2015 were targeted. These new areas included: State forest north-east of Marysville (Rubicon State Forest, Snobs Creek LMU); north and east of the Upper Yarra Catchment (Big River and Tanjil State Forests, Big River and Thomson LMUs, respectively); north-west of Noojee (LaTrobe and Noojee State Forests, Brimbonga LMU); and south of the Powelltown–Noojee Road (LaTrobe and Yarra State Forests, Tarago LMU) (see Figure 3 in the Results section for a map of these areas). These areas generally had either little or no habitat predicted to have a high probability of occupancy; hence, they were not surveyed in 2014–2015. However, some recent records of Leadbeater’s Possum, together with a visual assessment of potential survey sites in these areas, indicated suitable habitat was present.
The camera-trapping method used in these surveys (see Section 2.3 below) relies on detecting animals while they are moving through the forest and foraging. Well-connected layers of midstorey and shrub-layer vegetation, and the presence of wattle, i.e. Acacia spp., are known to be important habitat features used by the possums for movement and foraging (Smith 1984a, Lindenmayer et al. 1991b, Smith and Lindenmayer 1992). As a result, site selection was targeted towards forest stands containing these attributes.
2.2.1 Site selection based on the occupancy model
In 2014–2015, 65 potential survey sites were delineated in areas predicted by occupancy modelling to have a >65% probability of occupancy by Leadbeater’s Possum. Forty-three of these sites were surveyed in that year (Nelson et al. 2015). In 2015–2016, we aimed to survey the remaining 22 sites. Pre-survey site
6 Targeted surveys to improve Leadbeater's Possum con servation
Arthur Rylah Institute for Environmental Research Technical Report Series No. 278
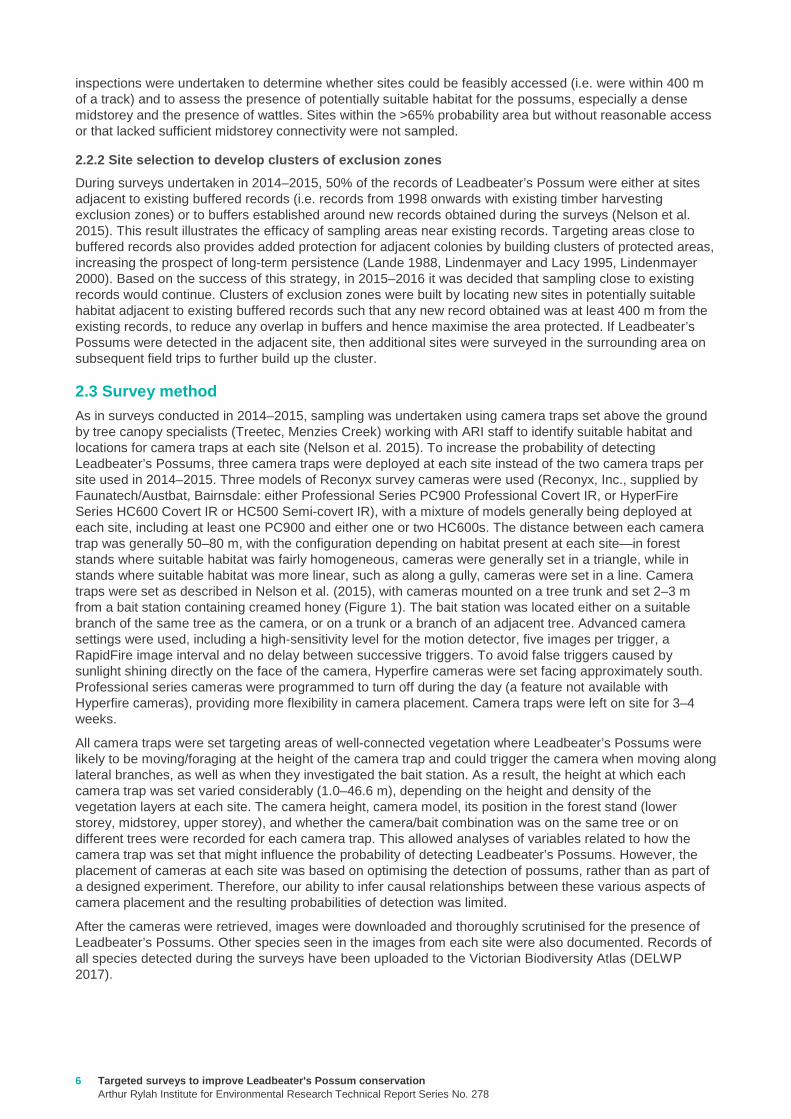
inspections were undertaken to determine whether sites could be feasibly accessed (i.e. were within 400 m of a track) and to assess the presence of potentially suitable habitat for the possums, especially a dense midstorey and the presence of wattles. Sites within the >65% probability area but without reasonable access or that lacked sufficient midstorey connectivity were not sampled.
2.2.2 Site selection to develop clusters of exclusi on zones
During surveys undertaken in 2014–2015, 50% of the records of Leadbeater’s Possum were either at sites adjacent to existing buffered records (i.e. records from 1998 onwards with existing timber harvesting exclusion zones) or to buffers established around new records obtained during the surveys (Nelson et al. 2015). This result illustrates the efficacy of sampling areas near existing records. Targeting areas close to buffered records also provides added protection for adjacent colonies by building clusters of protected areas, increasing the prospect of long-term persistence (Lande 1988, Lindenmayer and Lacy 1995, Lindenmayer 2000). Based on the success of this strategy, in 2015–2016 it was decided that sampling close to existing records would continue. Clusters of exclusion zones were built by locating new sites in potentially suitable habitat adjacent to existing buffered records such that any new record obtained was at least 400 m from the existing records, to reduce any overlap in buffers and hence maximise the area protected. If Leadbeater’s Possums were detected in the adjacent site, then additional sites were surveyed in the surrounding area on subsequent field trips to further build up the cluster.
2.3 Survey method As in surveys conducted in 2014–2015, sampling was undertaken using camera traps set above the ground by tree canopy specialists (Treetec, Menzies Creek) working with ARI staff to identify suitable habitat and locations for camera traps at each site (Nelson et al. 2015). To increase the probability of detecting Leadbeater’s Possums, three camera traps were deployed at each site instead of the two camera traps per site used in 2014–2015. Three models of Reconyx survey cameras were used (Reconyx, Inc., supplied by Faunatech/Austbat, Bairnsdale: either Professional Series PC900 Professional Covert IR, or HyperFire Series HC600 Covert IR or HC500 Semi-covert IR), with a mixture of models generally being deployed at each site, including at least one PC900 and either one or two HC600s. The distance between each camera trap was generally 50–80 m, with the configuration depending on habitat present at each site—in forest stands where suitable habitat was fairly homogeneous, cameras were generally set in a triangle, while in stands where suitable habitat was more linear, such as along a gully, cameras were set in a line. Camera traps were set as described in Nelson et al. (2015), with cameras mounted on a tree trunk and set 2–3 m from a bait station containing creamed honey (Figure 1). The bait station was located either on a suitable branch of the same tree as the camera, or on a trunk or a branch of an adjacent tree. Advanced camera settings were used, including a high-sensitivity level for the motion detector, five images per trigger, a RapidFire image interval and no delay between successive triggers. To avoid false triggers caused by sunlight shining directly on the face of the camera, Hyperfire cameras were set facing approximately south. Professional series cameras were programmed to turn off during the day (a feature not available with Hyperfire cameras), providing more flexibility in camera placement. Camera traps were left on site for 3–4 weeks.
All camera traps were set targeting areas of well-connected vegetation where Leadbeater’s Possums were likely to be moving/foraging at the height of the camera trap and could trigger the camera when moving along lateral branches, as well as when they investigated the bait station. As a result, the height at which each camera trap was set varied considerably (1.0–46.6 m), depending on the height and density of the vegetation layers at each site. The camera height, camera model, its position in the forest stand (lower storey, midstorey, upper storey), and whether the camera/bait combination was on the same tree or on different trees were recorded for each camera trap. This allowed analyses of variables related to how the camera trap was set that might influence the probability of detecting Leadbeater’s Possums. However, the placement of cameras at each site was based on optimising the detection of possums, rather than as part of a designed experiment. Therefore, our ability to infer causal relationships between these various aspects of camera placement and the resulting probabilities of detection was limited.
After the cameras were retrieved, images were downloaded and thoroughly scrutinised for the presence of Leadbeater’s Possums. Other species seen in the images from each site were also documented. Records of all species detected during the surveys have been uploaded to the Victorian Biodiversity Atlas (DELWP 2017).

Targeted surveys to improve Leadbeater's Possum con servationArthur Rylah Institute for Environmental Research Technical Report Series No. 278
7
Figure 1. Tree canopy specialist setting a camera t rap consisting of a Reconyx survey camera (circled left) set 2–3 m from a bait holder containing creamed honey (circled right ).
2.4 Habitat assessments A key component of the targeted surveys was to improve the understanding of Leadbeater’s Possum’s habitat requirements. To achieve this, measurements of habitat attributes known to be strongly correlated with the presence and abundance of Leadbeater’s Possums were undertaken at each site. These included age class, dominant eucalypt species, density and form of hollow-bearing trees, basal area of wattle, and extent of vegetation connectivity (Smith and Lindenmayer 1988, Lindenmayer et al. 1991b, Lumsden et al. 2013). Hollow-bearing trees were identified as such based on the definition used in the criteria for Zone 1A or 1B habitat identification (Section 2.4.1) in the Leadbeater’s Possum Survey Standards (DELWP 2015). Hollow-bearing trees based on a broader definition (any trees containing hollows that fell outside the survey standards definition) were also identified, because they might also be able to provide den sites for Leadbeater’s Possum, irrespective of the age or species of the tree. This meant that non-eucalypts, such as Myrtle Beech (Nothofagus cunninghammii), were potentially included, although the extent of the use of such non-ash tree hollows by Leadbeater’s Possums is unknown. These data allowed an evaluation of the availability of potential denning resources for Leadbeater’s Possum at each site.
2.4.1 Measurement of habitat attributes
At each site sampled by two (in 2014–2015) or three (in 2015–2016) cameras, a site centroid was determined at the point equidistant between the cameras, and a 1 ha (100 x 100 m) square habitat sampling grid was generated, centred over the site centroid, with grid margins running north–south and east–west. A central transect through each grid had sampling points at 20 m, 40 m, 60 m and 80 m (S1–S4, Figure 2).

8 Targeted surveys to improve Leadbeater's Possum con servation
Arthur Rylah Institute for Environmental Research Technical Report Series No. 278
Figure 2. A 1 ha habitat sampling grid used to asse ss habitat variables at the Leadbeater’s Possum sur vey sites.
Sampling grids were oriented over the centroid of each site, with the grid margins running north–south and east–west. Four sampling points S1–S4 were aligned along a central transect. The edge of the grid was delineated by points at the corners and at the midpoint of each boundary (E1–E8).
The age of the forest stand within each 1 ha sampling grid was determined using a combination of mapped fire and timber-harvesting history, and ground-truthing while conducting habitat assessments. Forest age is reported as the number of years since the last stand-replacing disturbance event, whether that be fire or timber harvesting. Salvage logging after the 1939 and 1983 bushfires occurred to varying degrees on some sites. However, as the stand-replacing event was the fire, sites were classified as fire regrowth. Sites affected by disturbance events that did not kill the dominant cohort of trees (e.g. 1939-cohort trees with a very low severity fire in 2009) were assigned to the most recent stand-replacing disturbance event (in this case 1939 bushfire regrowth, or stand age of 77 years). Sites were considered multi-aged when two or more age cohorts were present within the 1 ha sampling grid and each cohort comprised >10% of the grid.
The dominant eucalypt species within each grid was recorded, and all trees that were >40 cm diameter at breast height (DBH) were examined with binoculars for the presence of fissures and hollows. Data were collected on every hollow-bearing tree, including tree species, DBH, tree height (using a rangefinder, Nikon Forestry Pro), hollow type (i.e. trunk hollow, spout, fissure, broken top), height above ground of the most prominent hollow, UTM coordinates, and such information as any typical Leadbeater’s Possum keyhole entrances or visible nesting material. The form of the hollow-bearing tree was also recorded using a 1–8 scale (based on Lindenmayer et al. 1991a: 1, mature, living tree; 2, mature, living tree with a dead or broken top; 3, dead tree with most branches still intact; 4, dead tree with 0–25% of the top broken off, branches remaining as stubs only; 5, dead tree 25–50% of the top broken away; 6, dead tree with 50–75% of the top broken away; 7, solid, dead tree with ≥75% of the top broken away; 8, hollow stump). A category of ‘0.5’ was added to record hollow-bearing trees that were not yet ‘mature’, using the definition of ‘mature’ in the Leadbeater’s Possum Survey Standard (DELWP 2015). Each measured tree was also classified into one of two categories: either a ‘survey standard’ hollow-bearing tree or an ‘ecological’ hollow-bearing tree. Live survey standard trees were defined as mature or senescent Mountain Ash, Alpine Ash or Shining Gum, with hollows having >3 cm entrance size; dead survey standard trees were defined as dead eucalypt trees >6 m in height and >1.5 m DBH (DELWP 2015). Any hollow-bearing tree that fell outside those definitions was termed an ecological hollow-bearing tree.

Targeted surveys to improve Leadbeater's Possum con servation
Arthur Rylah Institute for Environmental Research Technical Report Series No. 2789
At points S1–S4 along the central transect of each grid (Figure 2), the basal area of live and dead wattles and eucalypts were measured with a basal area wedge prism (Department of Environment, Climate Change and Water 2010) and the contributing species recorded for each. At points S1–S4, the vegetation connectivity in a 10 m-radius plot was scored on a 0–3 scale for the understorey, midstorey and canopy layers, and the contributing species for each layer were recorded. These scores were obtained in order to represent the ease with which a Leadbeater’s Possum could move through the vegetation. They were defined as: 0, connectivity absent; 1, connectivity present but minimal; 2, connectivity present but not continuous (Leadbeater’s Possums able to move around relatively easily but possibly needing to use multiple layers); and 3, connectivity continuous (Leadbeater’s Possums easily able to move through that layer). Each site assessment thus resulted in a mean basal area (m2 ha–1) of live and dead wattles, and of live and dead eucalypts, and a mean understorey, midstorey and canopy connectivity score.
2.5 Data analysis
2.5.1 Analysis of habitat attributes
To investigate whether habitat measurements differed between sites where Leadbeater’s Possums were detected and sites where they were not detected, we used a Wilcoxon rank sum test of the mean basal area of live and dead wattles, and live and dead eucalypts, and connectivity scores for each layer, at each site. We also used Wilcoxon rank sum tests to compare the total number of hollow-bearing trees and the numbers of live and dead hollow-bearing trees at sites where the possums were detected with the corresponding numbers at sites where they were not detected. All results were considered significant if P < 0.05.
2.5.2 Assessing the probability of detection using camera traps
Over the 2 years of the survey, data were available from 289 survey sites. At each site, either two (2014–2015 surveys) or three (2015–2016 surveys) camera traps were deployed for 3–4 weeks. Each group of two or three cameras deployed within a site was treated as a single site for the purpose of occupancy modelling. Daily detection histories (≥1 Leadbeater’s Possum(s) detected or not detected during each 24-hour period) for each individual camera were compiled (detection or not each night). Examination of the data, together with observations of images of possums collected from camera traps set opposite artificial hollows (ARI unpublished data), indicated it was highly likely that individual possums habitually and repeatedly used particular paths through the forest. Statistically, this would mean that nightly detection histories would be serially dependent, and that different cameras at the same site could have large and consistent differences in their probabilities of detecting a Leadbeater’s Possum, determined by the extent to which each camera’s detection zones coincided with locations regularly used by possums. Attempts to account for this between-camera variability using camera-level random effects terms in the detection model were unsuccessful (the statistical models consistently failed to converge), probably because of the limited replication associated with having only two or three cameras at each site, and the inherent uncertainty in the true occupancy states of sites where no detections were made.
Because of the apparent non-independence in nightly detection, for the purposes of analysis, the nightly detection histories for each camera were collapsed down to a single detection/non-detection. The detection data for each site was therefore simply condensed down to whether or not each of the cameras deployed at the site detected a Leadbeater’s Possum over the full period cameras were deployed. The length of each camera’s deployment (number of nights cameras were deployed) was used as a measure of survey effort.
Conditional on occupancy of a site by the Leadbeater’s Possum, the probability of detection at each camera per night was modelled as being dependent on the camera model used, to allow for possible variation in the detection characteristics of the three camera models:
logit(pij) ~ β0 +
β1*Cam600ij +
β2*Cam900ij,
where pij is the probability of detecting a possum during the course of the entire survey period at the ith site, using the jth camera, β0–β2 are regression parameters associated with the three camera models used (model numbers HC500, HC600 and PC900, respectively, and Cam600ij and Cam900ij are binary covariates, coding for the use of camera models 600 and 900 (use of camera model 500 was treated as the default level of the regression, so was encoded in the intercept term, β0).
A priori, occupancy of any site was considered equally likely for the purposes of assessing detectability using the camera-trapping methodology. In reality, sites varied in perceived habitat quality, but as the focus of this

10 Targeted surveys to improve Leadbeater's Possum con servation
Arthur Rylah Institute for Environmental Research Technical Report Series No. 278
part of the analysis was the assessment of detection probabilities using arboreal camera traps, we treated all sites as being equally likely to be occupied by Leadbeater’s Possum—this should have had little impact on the estimates of detection probability obtained from the analysis, as the variation attributable to differences in occupancy among sites is determined by the model’s occupancy parameter. As the sites surveyed were a highly biased and non-independent sample of locations within the range of Leadbeater’s Possum, we did not include covariates in the occupancy component of the model. In any case, the purpose of the model was to assess detection probabilities using the camera-trapping survey method, not to produce a model for explaining or predicting occupancy more broadly.
We used the Bayesian state–space formulation of the basic, single-season occupancy model (i.e. we assumed no difference between seasons), as described by Royle and Kery (2007). The detection model was fitted to the data using Bayesian methods, and implemented in the software ‘Just Another Gibbs Sampler’ (JAGS, Plummer 2003).
As camera traps are typically deployed for a period of 3–4 weeks, rather than a single night, the quantity of interest for assessing the performance of the survey method was the overall probability of detection within a 3 or 4–week deployment. For each single camera, this quantity can be computed from the nightly detection probability (p) using the equation:
Pcam = 1 – (1 – p)N,
where N is the number of nights surveyed, p is the nightly detection probability for the specified camera model (see equation above), and Pcam is the overall detection probability for a single camera after N nights.
In turn, the overall predicted probability of detection when using multiple cameras at the same site, can be calculated from Pcam using the equation:
���� = 1 − ∏ (1 − ���)������ ,
where PCAM is the predicted detection probability for a single camera, and k is the number of cameras deployed. The quantities PCAM and PTOT were calculated within JAGS, so that the uncertainty in the estimates of the parameters from which they were derived was propagated into the estimates of these parameters. This was done by generating a replicate value from the posterior of PCAM and P TOT at each update of the Markov Chain Monte Carlo (MCMC) algorithm that was used to fit the model to the data. Collectively, these repeated estimates of PCAM and PTOT can be considered as samples from the joint posterior probability distributions of these derived parameters—we are hence able to obtain both point estimates and estimates of uncertainty (such as standard errors and Bayesian credible intervals) for these parameters from the distribution of MCMC samples thus obtained.
Some additional, more complex models were also fitted to the data, allowing for camera-level covariates to influence the probabilities of detection for each camera deployment. Effects of the height at which cameras were placed, the height of the tree on which the camera was placed, placement of cameras relative to baits (on the same tree, or on an adjacent tree) and effect of a seasonal trend in detectability (using the midpoint date of deployment) were all examined as part of the model-fitting process.
2.5.3 Testing predictive performance of existing oc cupancy models for Leadbeater’s Possum
We used Receiver Operating Characteristic (ROC) analysis, a widely used, threshold-independent method for evaluating binary classification models (Vaughan and Ormerod 2005, Elith et al. 2006) to examine the performance of the occupancy models for Leadbeater’s Possum (from Lumsden et al. 2013) when predicting the presence of Leadbeater's Possum at the camera-trapping sites.
ROC curves are widely used in evaluation of the ability of probabilistic species distribution models to predict presence/absence of species. A ROC curve involves plotting the sensitivity of the model’s predictions (proportion of true presences correctly predicted as presences) against 1 minus the model’s specificity (proportion of true absences correctly classified as absences), for each of a range of threshold values of the predicted probabilities of presence at the test sites (which in this case were the 289 sites sampled during the 2014–2016 targeted surveys). The information in a ROC curve is typically summarised by computing the area under the curve (AUC) statistic. As the predictive performance of a model increases, the AUC statistic approaches a value of one, while a model with very poor predictive performance will have an AUC statistic close to 0.5 (Hanley and McNeil 1982). Approximate 95% confidence intervals on the AUC statistics were calculated using a non-parametric bootstrap with 1000 random resamples with replacement from the observed occupancy states, and the predicted probabilities of occupancy derived from the models in Lumsden et al. (2013).

Targeted surveys to improve Leadbeater's Possum con servation
Arthur Rylah Institute for Environmental Research Technical Report Series No. 27811
The occupancy models for Leadbeater’s Possum outlined in Lumsden et al. (2013) were constructed from presence/absence data collected at a stratified sample of 180 sites across the species’ geographic range in 2012. The survey method used was call playback, with detection often assisted by a thermal imaging camera (Lumsden et al. 2013). The occupancy models accounted for the imperfect detection probabilities inherent in the survey method by using repeated surveys at each of the sites to infer for, and correct for non-detection of the species at sites that were in fact occupied (MacKenzie et al. 2002).
The predictive performance of two existing occupancy models were evaluated. First, the model presented by Lumsden et al. (2013) which related occupancy of Leadbeater’s Possum to mapped (GIS) habitat variables only, including broad ecological, climatic and environmental variables. A second model was also developed, incorporating habitat data collected at each call playback site, which extended the spatial model to include habitat variables of known importance to Leadbeater’s Possum, including hollow-bearing tree abundance, midstorey connectivity, and abundance of wattle. The first model had the advantage that it was possible to generate spatial predictions of occupancy across the entire Leadbeater’s Possum range from the mapped habitat variables. However, this model was not able to use information on small-scale structural features of the habitat. The second model, which included habitat variables measured at the study sites, could not be used to generate spatial predictions of occupancy, because no GIS layers were available for these habitat variables. Comparison of these two models demonstrated the likely superiority of the model that included on-site habitat variables in terms of model parsimony (as assessed using Akaike’s Information Criterion) (ARI unpublished data). This led to a prediction that the model including on-site habitat variables would produce substantially more accurate predictions of occupancy at newly surveyed sites within the species’ range than the model based solely on GIS variables.
The availability of a large body of new survey data collected as part of the targeted surveys in 2014–2015 and 2015–2016 provided an opportunity to test the performance of the two models, and to test the prediction that the model with on-site habitat variables would provide more accurate predictions of species presence at the newly surveyed sites.
Predicted probabilities of occupancy at each of the camera-trapping sites of the surveys in 2014–2016 were generated using the equations of the two occupancy models fitted to the call-playback survey data collected in 2012, as outlined in Lumsden et al. (2013). Equivalent covariate values for the camera-trapping sites were obtained from the same GIS layers, and from the locally measured habitat variables at the camera trapping sites, using the same methodology as was used for collection of habitat data during the surveys in 2012. For each camera-trapping site, the centroid of the two or three camera-trap locations was determined from the GPS fixes of each camera location, and this location was used as the reference point for predicting probability of occupancy from the models (i.e. this was the point at which the GIS layers were queried).
The predicted probabilities for the two models, and the observed occupancy states (detected/not detected) for each camera-trapping site were tabulated. As the detection probability analysis indicated that there was a very high probability (typically >0.8, see Results) of detecting Leadbeater's Possums if they were present on a site (using the level of camera-trap surveying that was undertaken) (see Results Section 3.5), for the purpose of ROC analysis it was assumed that the detection or non-detection of a Leadbeater’s Possum at each site reflected the actual occupancy state of the site. It is possible, though, that some false negative assignments of sites to the unoccupied category may have occurred, especially at sites with lower levels of survey effort (i.e. those where only two cameras were deployed, or those with shorter camera deployments).
ROC curves were computed from the predicted probabilities and observed presences/absences using the R statistical package (R Core Team 2016), using the functions provided in the package ROCR (Sing et al. 2005). For each model, sensitivity (the proportion of true positives actually predicted) was plotted against specificity (proportion of true negatives actually predicted), and the AUC was calculated. Approximate 95% confidence limits of the AUC for each model were calculated using a non-parametric bootstrap approach.
12 Targeted surveys to improve Leadbeater's Possum con servation
Arthur Rylah Institute for Environmental Research Technical Report Series No. 278
3. Results
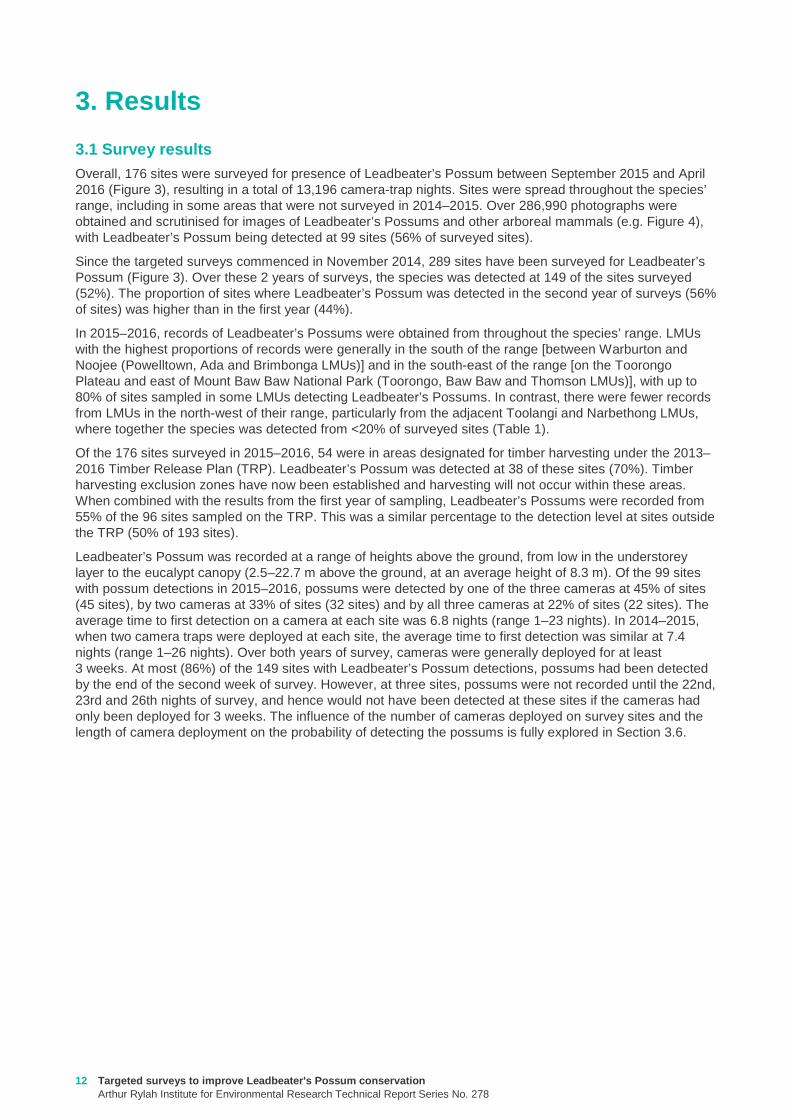
3.1 Survey results Overall, 176 sites were surveyed for presence of Leadbeater’s Possum between September 2015 and April 2016 (Figure 3), resulting in a total of 13,196 camera-trap nights. Sites were spread throughout the species’ range, including in some areas that were not surveyed in 2014–2015. Over 286,990 photographs were obtained and scrutinised for images of Leadbeater’s Possums and other arboreal mammals (e.g. Figure 4), with Leadbeater’s Possum being detected at 99 sites (56% of surveyed sites).
Since the targeted surveys commenced in November 2014, 289 sites have been surveyed for Leadbeater’s Possum (Figure 3). Over these 2 years of surveys, the species was detected at 149 of the sites surveyed (52%). The proportion of sites where Leadbeater’s Possum was detected in the second year of surveys (56% of sites) was higher than in the first year (44%).
In 2015–2016, records of Leadbeater’s Possums were obtained from throughout the species’ range. LMUs with the highest proportions of records were generally in the south of the range [between Warburton and Noojee (Powelltown, Ada and Brimbonga LMUs)] and in the south-east of the range [on the Toorongo Plateau and east of Mount Baw Baw National Park (Toorongo, Baw Baw and Thomson LMUs)], with up to 80% of sites sampled in some LMUs detecting Leadbeater’s Possums. In contrast, there were fewer records from LMUs in the north-west of their range, particularly from the adjacent Toolangi and Narbethong LMUs, where together the species was detected from <20% of surveyed sites (Table 1).
Of the 176 sites surveyed in 2015–2016, 54 were in areas designated for timber harvesting under the 2013–2016 Timber Release Plan (TRP). Leadbeater’s Possum was detected at 38 of these sites (70%). Timber harvesting exclusion zones have now been established and harvesting will not occur within these areas. When combined with the results from the first year of sampling, Leadbeater’s Possums were recorded from 55% of the 96 sites sampled on the TRP. This was a similar percentage to the detection level at sites outside the TRP (50% of 193 sites).
Leadbeater’s Possum was recorded at a range of heights above the ground, from low in the understorey layer to the eucalypt canopy (2.5–22.7 m above the ground, at an average height of 8.3 m). Of the 99 sites with possum detections in 2015–2016, possums were detected by one of the three cameras at 45% of sites (45 sites), by two cameras at 33% of sites (32 sites) and by all three cameras at 22% of sites (22 sites). The average time to first detection on a camera at each site was 6.8 nights (range 1–23 nights). In 2014–2015, when two camera traps were deployed at each site, the average time to first detection was similar at 7.4 nights (range 1–26 nights). Over both years of survey, cameras were generally deployed for at least 3 weeks. At most (86%) of the 149 sites with Leadbeater’s Possum detections, possums had been detected by the end of the second week of survey. However, at three sites, possums were not recorded until the 22nd, 23rd and 26th nights of survey, and hence would not have been detected at these sites if the cameras had only been deployed for 3 weeks. The influence of the number of cameras deployed on survey sites and the length of camera deployment on the probability of detecting the possums is fully explored in Section 3.6.
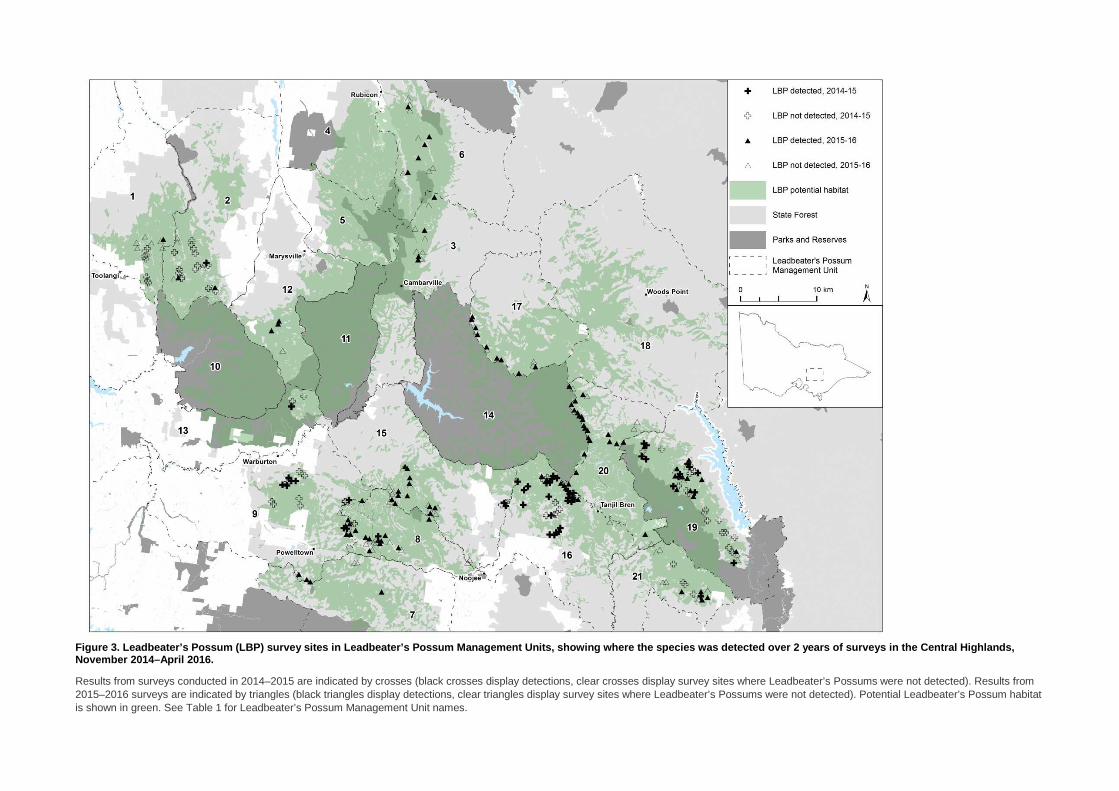
Figure 3. Leadbeater’s Possum (LBP) survey sites in Leadbeater’s Possum Management Units, showing wher e the species was detected over 2 years of surveys in the Central Highlands, November 2014–April 2016.
Results from surveys conducted in 2014–2015 are indicated by crosses (black crosses display detections, clear crosses display survey sites where Leadbeater’s Possums were not detected). Results from 2015–2016 surveys are indicated by triangles (black triangles display detections, clear triangles display survey sites where Leadbeater’s Possums were not detected). Potential Leadbeater’s Possum habitat is shown in green. See Table 1 for Leadbeater’s Possum Management Unit names.
14 Targeted surveys to improve Leadbeater's Possum con servation
Arthur Rylah Institute for Environmental Research Technical Report Series No. 278
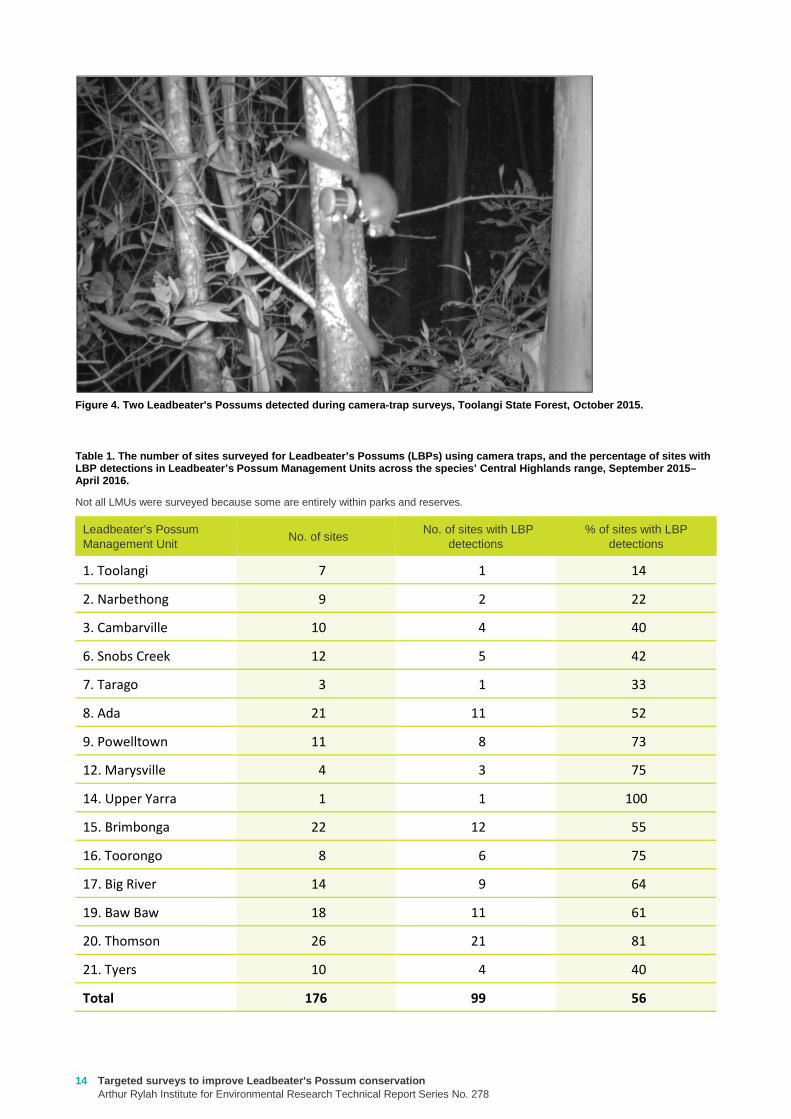
Figure 4. Two Leadbeater's Possums detected during camera-trap surveys, Toolangi State Forest, October 2015.
Table 1. The number of sites surveyed for Leadbeate r’s Possums (LBPs) using camera traps, and the perc entage of sites with LBP detections in Leadbeater’s Possum Management Un its across the species’ Central Highlands range, Se ptember 2015–April 2016.
Not all LMUs were surveyed because some are entirely within parks and reserves.
Leadbeater’s Possum Management Unit
No. of sites No. of sites with LBP detections
% of sites with LBP detections
1. Toolangi 7 1 14
2. Narbethong 9 2 22
3. Cambarville 10 4 40
6. Snobs Creek 12 5 42
7. Tarago 3 1 33
8. Ada 21 11 52
9. Powelltown 11 8 73
12. Marysville 4 3 75
14. Upper Yarra 1 1 100
15. Brimbonga 22 12 55
16. Toorongo 8 6 75
17. Big River 14 9 64
19. Baw Baw 18 11 61
20. Thomson 26 21 81
21. Tyers 10 4 40
Total 176 99 56
Targeted surveys to improve Leadbeater's Possum con servationArthur Rylah Institute for Environmental Research Technical Report Series No. 278
15
3.2 Detections in relation to occupancy model In 2014–2015, 43 of a possible 65 sites with a >65% probability of occupancy were surveyed for Leadbeater’s Possums, leaving 22 sites for survey in 2015–2016. Only five of these sites were surveyed, however; the remaining 17 sites were either inaccessible, or were considered unsuitable habitat. Leadbeater’s Possums were detected at four of these five ‘high-occupancy-probability’ sites.
Most of the sampling in 2014–2015 focused on areas with relatively high predicted probabilities of occupancy (i.e. >50%), leaving many lower predicted probability of occupancy areas unsurveyed. As unsurveyed areas were targeted in 2015–2016, this increased the number of sites surveyed in the lower probability of occupancy categories, providing a pool of sites in each category for assessing the predictive accuracy of the occupancy model (see Section 3.7 Assessing Model Performance). Overall, during the 2 years of survey, Leadbeater’s Possums were detected from a similar proportion of sites in the 31–50%, 51–65% and >65% categories, with detection rates of 52–58% across these three categories. In contrast, Leadbeater’s Possums were detected at fewer sites (41%) in the lowest probability of occupancy category (Table 2).
Table 2. The number and percentage of sites at whic h Leadbeater’s Possums (LBPs) were detected in the four categories of probability of occupancy (as predicted by occupancy modelling in Lumsden et al. 2013), November 2014–A pril 2016.
At 25 sites, the camera traps straddled boundaries of occupancy model categories. Where this occurred, the site was assigned based on whichever category occupied the greatest proportion of the area within 200 m of the site centroid.
Predicted probability of occupancy No. of sites No. of sites where
LBP was detected % of sites where
LBP was detected
0–30% 75 31 41%
31–50% 81 47 58%
51–65% 85 46 54%
>65% 48 25 52%
Total 289 149 52%
3.3 Clusters of exclusion zones To develop clusters of exclusion zones so that multiple colonies were protected within close proximity of each other, 73 sites were surveyed that were either close to existing buffered records (1998 onwards) or to new records obtained during the targeted survey program. Leadbeater’s Possums were detected at 43 of these sites (59%). Buffered records were considered to be part of the same cluster if the edges of adjacent timber harvesting exclusion zones were within 100 m of one another. Overall, 35 clusters have been developed, consisting of between 2 and 16 timber harvesting exclusion zones, and 11 of the 35 clusters consisted of 4 or more exclusion zones. Clusters were spread throughout the species’ range, with at least one cluster located in 12 of the 15 LMUs containing survey sites. The LMUs with the highest numbers of clusters were Toorongo (7 clusters), Baw Baw (5 clusters), and Brimbonga (5 clusters).
3.4 Habitat assessments
3.4.1 Forest age
Sites were surveyed in forest stands ranging in age from 10 to 77 years and included timber harvesting regrowth, 1983 bushfire regrowth and 1939 bushfire regrowth. Ecotones between different-aged stands were often sampled to target areas where Leadbeater’s Possums had access to both younger forest (for foraging) and older forest that might contain remnant large, old trees (for denning). Sites were considered multi-aged when two or more forest age cohorts were present and each comprised more than 10% of the 1 ha habitat assessment grid.
Of the 289 1 ha sites surveyed, 212 (73%) were single-age forest stands, and 77 (27%) consisted of two age classes of forest (Table 3). Leadbeater’s Possums were detected across all age classes of forest sampled. The highest detection rates were from multi-aged sites with 1939 bushfire regrowth (77 years old) and 13– 38-year-old timber harvesting regrowth, and from 1983 bushfire regrowth (33 years old), with possums detected at 62% and 59% of sites surveyed in these categories, respectively. The age cohorts with the

16 Targeted surveys to improve Leadbeater's Possum con servation
Arthur Rylah Institute for Environmental Research Technical Report Series No. 278
lowest detection rates were single-aged stands of logging regrowth (39–57 years old) and 1939 bushfire regrowth, with possum detections on 41% and 44% of sites surveyed, respectively (Table 3).
Table 3. The forest age cohorts and most recent sta nd-replacing disturbance events within the 1 ha sur vey sites, and the number and percentage of sites with Leadbeater’s Po ssum detections in the Central Highlands, November 2014–April 2016.
Last stand-replacing disturbance event
Stand age (years) No. of sites No. of sites where
LBP was detected % of sites where
LBP was detected
1939 bushfire 77 120 54 45%
1983 bushfire 33 39 23 59%
1959–1977
timber harvesting
39–57 17 7 41%
1978–2005
timber harvesting
11–38 36 18 50%
1939 bushfire +
younger timber
harvesting regrowth
77 and 13–38 63 39 62%
1939 bushfire +
older timber
harvesting regrowth
77 and 39–50 14 8 57%
Total 289 149 52%
3.4.2 Habitat attributes
Of the 289 sites surveyed for Leadbeater’s Possum during the 2 years of targeted surveys, habitat assessments were completed at 287 sites between April 2015 and May 2016. Habitat assessments were not undertaken at 2 sites due to access constraints.
The abundance of all hollow-bearing trees (both eucalypt and non-eucalypt) across the 287 sites varied from zero to 21 (mean per site 2.5 for the combined total of survey standard and ecological hollow-bearing trees). No hollow-bearing trees were recorded on the 1 ha sampling grids for 104 sites (36%), and only one hollow-bearing tree was recorded on 54 sites (19%). Only 28% of surveyed hollow-bearing trees met the criteria for designation as ‘survey standard’ hollow-bearing trees under the definition in the Leadbeater’s Possum Survey Standards (DELWP 2015). Eighty-seven sites (30%) contained survey standard trees. Ninety-six sites (33%) only had ecological hollow-bearing trees—i.e. trees with hollows that did not meet the definition of a relevant hollow-bearing tree in the survey standards (DELWP 2015). Only eight sites (2.8%) had four or more live survey standard hollow-bearing trees on the 1 ha sampling grid. Although habitat assessments were limited to 1 ha, if it was assumed that similar densities of hollow-bearing trees occurred in the 3 ha areas around each site to those observed on our 1 ha plots, then only 2.8% of sites would meet the criteria for high-quality habitat for Leadbeater’s Possum (Zone 1A habitat), as defined by the survey standards. In total, 717 hollow-bearing trees (both categories combined) were measured. The average DBH of live hollow-bearing trees was 143 cm (n = 303, SD = 67.4, range 44–407 cm) and of dead hollow-bearing trees was 132 cm (n = 414, SD = 66.5, range 41–350 cm). The average height of a hollow in a tree was 9.1 m (SD = 9.0, range 0–51 m).
The abundance of hollow-bearing trees (both eucalypt and non-eucalypt) on the 149 sites where Leadbeater’s Possums were detected ranged from 0–21. Forty-eight of these sites (32%) contained no hollow-bearing trees. Of the 101 sites where hollow-bearing trees were recorded, 48 contained survey standard hollow-bearing trees and 53 contained only ecological hollow-bearing trees. Only 3.4% of the 149 sites where Leadbeater’s Possums were detected would have met the criteria for Zone 1A habitat (extrapolating our 1 ha plots to 3 ha). On average, there were slightly more hollow-bearing trees on sites where Leadbeater’s Possums were detected (average per site 2.83, range 0–21), compared with sites where the possums were not detected (average per site 2.17, range 0–18), but this difference was not significant (W = 9061.5, P = 0.07; Figure 5).

Targeted surveys to improve Leadbeater's Possum con servationArthur Rylah Institute for Environmental Research Technical Report Series No. 278
17
Figure 5. Boxplot of the number of hollow-bearing t rees (HBTs) counted on 1 ha plots at sites where Le adbeater’s Possums (LBPs) were and were not detected.
The bottom and top of each ‘box’ indicates the 25th and 75th percentiles, respectively, with the black horizontal line indicating the median value. Black dots are outliers representing sites with large numbers of hollow-bearing trees, compared with the majority of other sites.
At sites where Leadbeater’s Possums were detected, there was a slightly higher density of dead hollow-bearing trees (eucalypt and non-eucalypt; 1.7/ha, range 0–11) compared with live hollow-bearing trees (eucalypt and non-eucalypt; 1.1/ha, range 0–13). Hollows were recorded in eucalypts, acacias and in Myrtle Beech. At some sites, several large hollow-bearing Myrtle Beech trees were measured (mean DBH = 74.7cm, range 0–13). The average density of dead hollow-bearing eucalypt trees was twice that of live hollow-bearing eucalypt trees (1.7/ha, range 0–11; and 0.8/ha, range 0–8, respectively) on sites containing Leadbeater's Possums.
There were similar numbers of live hollow-bearing trees on sites where possums were detected compared with on sites where the species was not detected (W = 9804.5, P = 0.45; Figure 6). There was no significant difference in the number of dead hollow-bearing trees on sites with or without possum detections (W = 9179, P = 0.08). However, the distribution of the dead hollow-bearing tree data at sites with and without Leadbeater’s Possum detections does appear to differ somewhat (Figure 6). Sixty-two per cent of hollow-bearing trees on occupied sites were dead, compared with 52% on unoccupied sites.

18 Targeted surveys to improve Leadbeater's Possum con servation
Arthur Rylah Institute for Environmental Research Technical Report Series No. 278
Figure 6. Boxplot of the numbers of live and dead h ollow-bearing trees (HBTs) counted on 1 ha plots at sites where Leadbeater’s Possums (LBPs) were (light grey) and w ere not (dark grey) detected.
The bottom and top of each ‘box’ indicates the 25th and 75th percentiles, respectively, with the black horizontal line indicating the median value. Black dots are outliers representing sites with large numbers of hollow-bearing trees, compared with the majority of other sites.
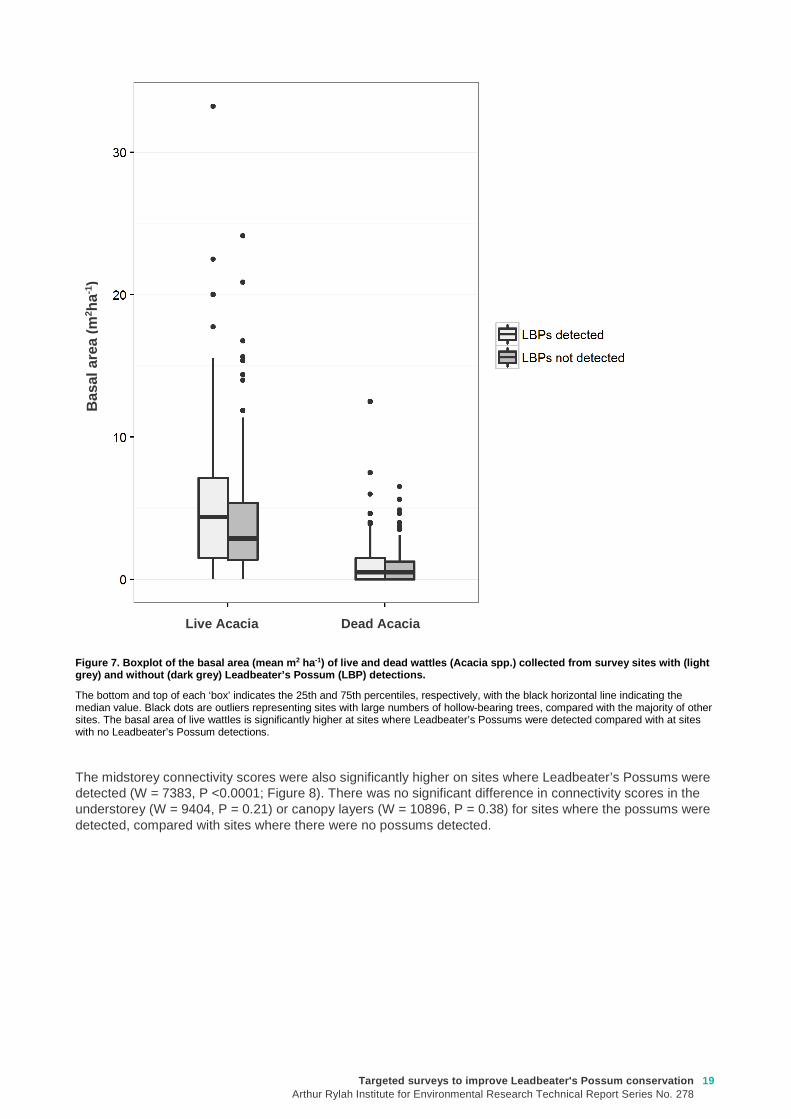
Comparison of other habitat variables measured at sites where Leadbeater’s Possums were and were not detected over the 2 years of the survey found that the basal area of live wattles was 30% higher on sites where the possums were detected, and this difference was significant (W = 8713, P = 0.03; Figure 7). However, there was no significant difference in the basal area of dead wattles (W = 1050, P = 0.76), live eucalypts (W = 1098, P = 0.32) or dead eucalypts (W = 1027, P = 0.98) on sites where Leadbeater’s Possums were or were not detected.
Targeted surveys to improve Leadbeater's Possum con servationArthur Rylah Institute for Environmental Research Technical Report Series No. 278
19
Figure 7. Boxplot of the basal area (mean m 2 ha-1) of live and dead wattles ( Acacia spp.) collected from survey sites with (light grey) and without (dark grey) Leadbeater’s Possum ( LBP) detections.
The bottom and top of each ‘box’ indicates the 25th and 75th percentiles, respectively, with the black horizontal line indicating the median value. Black dots are outliers representing sites with large numbers of hollow-bearing trees, compared with the majority of other sites. The basal area of live wattles is significantly higher at sites where Leadbeater’s Possums were detected compared with at sites with no Leadbeater’s Possum detections.
The midstorey connectivity scores were also significantly higher on sites where Leadbeater’s Possums were detected (W = 7383, P <0.0001; Figure 8). There was no significant difference in connectivity scores in the understorey (W = 9404, P = 0.21) or canopy layers (W = 10896, P = 0.38) for sites where the possums were detected, compared with sites where there were no possums detected.
Dead Acacia Live Acacia
Bas
al a
rea
(m2 h
a-1)

20 Targeted surveys to improve Leadbeater's Possum con servation
Arthur Rylah Institute for Environmental Research Technical Report Series No. 278
Figure 8. Mean connectivity scores (red triangles) for the canopy, midstorey (Mid) and shrub layers, c ollected from survey sites with and without Leadbeater’s Possum (LBP) de tections.
The raw data is displayed for sites with Leadbeater’s Possum detections (dark grey) and sites where Leadbeater’s Possums were not detected (light grey). The violin-plots give the estimated distribution of the data. Midstorey connectivity scores are significantly higher for sites where Leadbeater’s Possums were detected compared with those for sites with no Leadbeater’s Possum detections (indicated by an *).
3.5 Probability of detection using arboreal camera traps Exploratory fitting of the detection probability models revealed that the additional covariates associated with camera and tree height (whether the camera and bait were on the same tree or on different trees) and the date of deployment (seeking to detect any seasonal patterns) had a negligible influence on detectability. Accordingly, the quantitative results presented here are restricted to estimates of detection probability derived from the initial, simple model that only included the effect of camera-trap model on the probabilities of detection. Estimates of the probabilities of detection for deployments using one, two or three cameras at a single site, deployed for a period of 3 or 4 weeks are given in Figure 9. In general, the detection probabilities associated with the three camera-trap models were similar (Figure 9). There was some indication that the probability of detection for camera traps of model PC900 was slightly lower than those for models HC500 and HC600, although the credible intervals of the estimates overlapped somewhat, suggesting that any difference was quite small. After 21 days of sampling with a single camera trap, the expected probabilities of detection for the three models were in the range 0.37–0.54, while deployments of two or three cameras (the usual operational approach) resulted in overall probabilities of detection of 0.61–0.79 and 0.75–0.90,
*
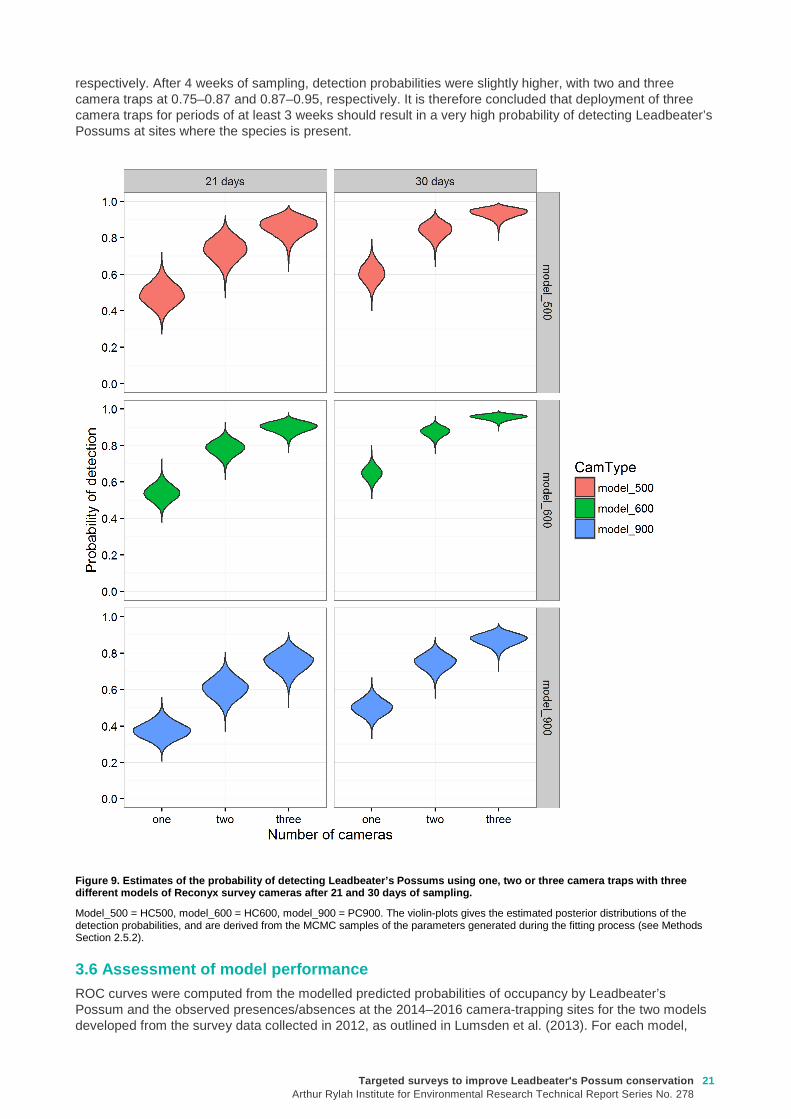
Targeted surveys to improve Leadbeater's Possum con servationArthur Rylah Institute for Environmental Research Technical Report Series No. 278
21
respectively. After 4 weeks of sampling, detection probabilities were slightly higher, with two and three camera traps at 0.75–0.87 and 0.87–0.95, respectively. It is therefore concluded that deployment of three camera traps for periods of at least 3 weeks should result in a very high probability of detecting Leadbeater’s Possums at sites where the species is present.
Figure 9. Estimates of the probability of detecting Leadbeater’s Possums using one, two or three camer a traps with three different models of Reconyx survey cameras after 21 and 30 days of sampling.
Model_500 = HC500, model_600 = HC600, model_900 = PC900. The violin-plots gives the estimated posterior distributions of the detection probabilities, and are derived from the MCMC samples of the parameters generated during the fitting process (see Methods Section 2.5.2).
3.6 Assessment of model performance ROC curves were computed from the modelled predicted probabilities of occupancy by Leadbeater’s Possum and the observed presences/absences at the 2014–2016 camera-trapping sites for the two models developed from the survey data collected in 2012, as outlined in Lumsden et al. (2013). For each model,

22 Targeted surveys to improve Leadbeater's Possum con servation
Arthur Rylah Institute for Environmental Research Technical Report Series No. 278
sensitivity (the proportion of true positives at the 2014–2016 camera-trapping sites that was actually predicted) was plotted against 1-specificity (the proportion of true negatives at the 2014–2016 camera-trapping sites that was actually predicted), and the area under the ROC curve (AUC) was calculated. For reference, a diagonal line, indicating an AUC of 0.5 (and thus a predictive performance no better than random) was superimposed. These curves are presented in Figure 10.
For the model based solely on mapped GIS variables fitted to data collected in 2012 (Lumsden et al. 2013), the ROC analysis revealed a very poor predictive capacity (AUC = 0.524) (an AUC of 0.5 implies a model with very poor predictive capacity). The bootstrap 95% confidence interval for the AUC included 0.5, meaning the GIS-based occupancy model was no better than random at predicting occupancy at the sites surveyed in 2014–2016 (Figure 10). Conversely, the model that incorporated habitat variables measured on-site had moderately good (but still imperfect) predictive ability (AUC = 0.656). The bootstrap 95% confidence interval on the AUC for this model did not include 0.5, indicating that the predictive ability of the model for the sites sampled in 2014–2016 was significantly better than random (Figure 10).
Figure 10. Receiver Operating Characteristic (ROC) curves showing the estimated predictive performance of the two occupancy models for Leadbeater’s Possums, fitted t o the 2012 survey data (Lumsden et al. 2013) at the sites surveyed during the current camera-trapping surveys. (A) The occupa ncy model based only on available GIS data. (B) The model that also included on-site habitat assessment data.
The area under the curve (AUC) statistic for each model is overlaid on each plot at bottom right. The larger the AUC, and the greater the deviation of the red line from the dotted line (indicating an AUC of 0.5), the greater the predictive performance of the model—models with an AUC of 0.5 have a very poor predictive performance.
A B
Targeted surveys to improve Leadbeater's Possum con servationArthur Rylah Institute for Environmental Research Technical Report Series No. 278
23
4. Discussion
4.1 Survey results In the second year of the Leadbeater’s Possum targeted surveys, the species was detected at 99 of the 176 sites surveyed (56%) between September 2015 and April 2016. Detections were spread throughout the species’ range, with the highest detection rates being in the south and south-east of the range. Timber harvesting exclusion zones have been established around these 99 records, protecting at least 1200 ha of forest habitat. Since the commencement of the targeted surveys in 2014, we have detected Leadbeater’s Possums at 149 of the 289 sites surveyed (52%), and approximately 1800 ha has been protected by timber harvesting exclusion zones. Forty-four percent of the newly buffered records from surveys in 2015–2016 formed part of a cluster of exclusion zones. Overall, 35 clusters have been developed over the 2 years of surveys. The multiple contiguous, or near contiguous, exclusion zones established around the colonies within these clusters increases the prospect of long-term persistence of the species by protecting ‘neighbourhoods’ rather than just individual colonies. These neighbourhoods support more colonies, so are less prone to loss of genetic diversity and extinction than a series of smaller, isolated buffered colonies of the same total area would be (Lande 1988, Lindenmayer and Lacy 1995, Lindenmayer 2000).
Timber harvesting exclusion zones were established around 38 colonies located in the 2015–2016 surveys within coupes designated for harvesting under the 2013–2016 TRP. Over the 2 years of the targeted surveys, the rate of detecting Leadbeater’s Possums at surveyed sites within coupes on the TRP (55%) was similar to that at sites in areas of State forest not currently designated for harvesting (50%). This result highlights the importance of pre-harvest surveys for Leadbeater’s Possums so that protective measures can be implemented prior to harvesting in areas where the species occurs.
4.2 Influence of forest age on Leadbeater's Possum occurrence While the majority of sites surveyed over the 2 years were single-age stands, 27% were multi-aged stands, consisting of two age classes of forest. Leadbeater’s Possums were detected across all age classes of forest surveyed, with the highest proportion of records being from multi-aged sites with 1939 bushfire regrowth (77 years old) and 13–38-year-old timber harvesting regrowth, and from 1983 fire regrowth (69% and 58% of surveyed sites, respectively). Ecotones between older and younger forest stands were often targeted during the surveys because these stands provided a mixture of older, unharvested forest (which might contain den sites in the form of remnant large, old trees) and younger forest (which likely provides the dense structure required by the possums for movement and wattle for foraging) (Smith 1984a, Smith and Lindenmayer 1992). These critical resources are also present in the stands regenerating after the 1983 fires, with fire-killed stags providing den sites and a dense midstorey including wattle providing movement pathways and foraging habitat.
In contrast, our lowest detection rates were in single-aged stands of 39–57-year-old timber harvesting regrowth and in 1939 bushfire regrowth. In some of the single-age stands regenerating after the 1939 bushfires, many fire-killed stags that remained standing after the fire have now collapsed (Lindenmayer et al. 1990, Lindenmayer et al. 2012) and the density of the wattle has declined (Adams and Attiwill 1984, Smith and Lindenmayer 1992). The decline of wattle opens the midstorey, reducing vegetation connectivity and the availability of wattle gum for food; this, together with the loss of the large stags, reduces the suitability of these stands for Leadbeater’s Possums (Smith and Lindenmayer 1992, Lindenmayer and Possingham 1995). In single-aged timber harvesting regrowth, the number of older hollow-bearing trees retained as wildlife habitat is also likely to have declined because these trees often have limited longevity, with accelerated rates of collapse due to exposure and the impact of the high-intensity regeneration burns applied after harvesting (Lindenmayer et al. 1990, Gibbons and Lindenmayer 1996). As in the 1939 regrowth areas, the wattle present in older timber harvesting regrowth areas may also have declined, further reducing the suitability of these stands for the possums. Despite this, we detected Leadbeater’s Possums at approximately 40% of the sites we surveyed in these single-aged stands, indicating that some still provide suitable habitat and are able to support colonies of the possums. However, it is important to note that we deliberately targeted forest stands containing what we assessed to be suitable habitat for the species, particularly dense midstorey vegetation. Our detection rates in different aged forest stands should therefore be interpreted with caution because they may not be indicative of the habitat suitability of these stands more generally.

24 Targeted surveys to improve Leadbeater's Possum con servation
Arthur Rylah Institute for Environmental Research Technical Report Series No. 278
4.3 Influence of habitat variables on Leadbeater’s Possum occurrence The abundance of hollow-bearing trees (using both the ecological and survey standard definitions) across all sites surveyed during the 2 years of targeted surveys varied from zero to 21, with an average of 2.5 per 1 ha site. No hollow-bearing trees were recorded for almost 40% of sites, and two or fewer hollow-bearing trees were recorded on 64% of sites. In comparison, Lindenmayer et al. (2016) reported two or fewer hollow-bearing trees on approximately 50% of their 166 1 ha long-term monitoring sites within the montane ash forests of the Central Highlands, with an average of five hollow-bearing trees per site. Hollow-bearing trees are a critical resource for Leadbeater’s Possum, providing shelter and breeding sites (Lindenmayer et al. 1991b, Smith and Lindenmayer 1988). While the sites surveyed by Lindenmayer et al. (2016) were spread across land tenures, all our survey sites were located in State forest available for timber harvesting, which may indicate a difference in hollow availability across tenures. However, as our sites were not randomly selected, it is not valid to extrapolate more broadly.
Most (72%) of the hollow-bearing trees we measured did not meet the criteria for a hollow-bearing tree as defined by the Leadbeater’s Possum Survey Standards (DELWP 2015). High-quality habitat for Leadbeater’s Possum (Zone 1A) is defined as areas where there are more than 10 live mature or senescent hollow-bearing ash trees per 3 ha, in patches >3 ha (DELWP 2015). Although our habitat measurements were only taken over 1 ha, extrapolating our results out to 3 ha revealed that only 2.8% of all surveyed sites would have met the criteria for Zone 1A habitat (probably less once the requirement for trees to be <100 m apart is incorporated). In addition, only 3.4% of the 149 sites at which Leadbeater’s Possums were detected would have qualified for protection as Zone 1A habitat. Together, these results suggest that there are now only very limited areas that qualify as Zone 1A habitat within the State forest General Management Zone and that the possums are occupying many areas that would not qualify for protection under this management prescription for reserving habitat for the species.
Sites where Leadbeater’s Possums were detected had a higher basal area of live wattles, and a higher midstorey connectivity score than sites at which the species was not detected. This is consistent with the known habitat requirements of Leadbeater’s Possum: gum produced by wattles is an important component of the possum’s diet, and dense vegetation provides a structurally well-connected layer for these small non-gliding possums to move through (Smith 1984a, Lindenmayer et al. 1991b, Smith and Lindenmayer 1992). Several other studies have similarly found a strong positive relationship between the basal area of wattles, the degree of connectivity in the understorey, and the presence and abundance of Leadbeater’s Possums (Smith and Lindenmayer 1988, Lindenmayer et al. 1991b, Smith and Lindenmayer 1992). There is also a well-established positive relationship between the presence and abundance of Leadbeater’s Possums and the number of hollow-bearing trees (Smith and Lindenmayer 1988, Lindenmayer et al. 1991b, Lindenmayer et al. 2013a). In contrast, while sites at which we detected Leadbeater’s Possums had higher numbers of hollow-bearing trees (particularly dead hollow-bearing trees) than sites at which there were no detections, this difference was not significant. Furthermore, 25% of sites with possum detections had no hollow-bearing trees. Leadbeater’s Possum colonies occupy home ranges of 1–3 ha (Smith 1984b), so it is likely that our 1 ha habitat sampling plots only sampled part of the resident possums’ home ranges and, because the camera-trapping survey technique detects animals while they are moving through the forest and foraging, were focused in foraging areas. As a result, the den trees of the possums we recorded were presumably outside our 1 ha sampling plots. Despite this, our results indicate that even in areas occupied by the possums, hollow-bearing trees are far from abundant. In addition, approximately 60% of the hollow-bearing trees on occupied sites were dead. These dead trees are more susceptible to collapse than live trees, further limiting the available denning resource in the future (Lindenmayer and Possingham 1995, Lindenmayer et al. 2012).
High rates of death and collapse of large, old hollow-bearing trees is currently occurring in the Central Highlands, with projections that the number of these trees will have declined from 5.1 per hectare in 1998 to ~0.6 per hectare by 2067 (Lindenmayer et al. 2013b). We recorded an average of 2.8 hollow-bearing trees on our 1 ha plots at sites where we detected possums, almost half of the number reported by Lindenmayer et al. (2013b) as being present across their sites in 1998. The remaining large, old trees in the Central Highlands will be critical for providing denning habitat for Leadbeater’s Possum into the future. Given that the predominant oldest age class of live trees is 77-year-old regrowth originating from bushfires in 1939, hollows will be in short supply until these trees begin to form natural hollows, which is predicted to occur in trees from 120 years of age (Lindenmayer et al. 1991a). This will lead to a bottleneck in hollow availability in the next 50 years and an associated higher extinction risk (Todd et al. 2016). Alternative approaches to providing den sites to supplement existing hollows, such as creating artificial hollows and the targeted use of nest boxes, are currently being trialled and implemented to support the persistence of Leadbeater’s Possum colonies in

Targeted surveys to improve Leadbeater's Possum con servationArthur Rylah Institute for Environmental Research Technical Report Series No. 278
25
the coming decades until more natural hollows become available (Leadbeater’s Possum Advisory Group 2014a, Commonwealth of Australia 2016, Harley 2016).
4.4 Probability of detection using arboreal camera traps The analysis showed that surveys for Leadbeater’s Possums using three camera traps deployed per site for 3–4 weeks should result in a high overall probability of detecting Leadbeater’s Possum, regardless of the model of Reconyx survey camera deployed (Figure 9). Although detection probabilities for surveys in 2014–2015 (when two camera traps were deployed at each site) were relatively high, the higher detection probabilities associated with using three cameras at each site (as in 2015–2016) further reduced the likelihood of failing to detect possums on occupied sites (i.e. false negative results). Longer deployments also increased the probability of detection. Although Leadbeater’s Possum was mostly detected by at least one of the cameras at a survey site, by the end of the second week of deployment, in a small number of cases, possums were not detected until the fourth week of deployment. At these sites, a 3 week deployment would have resulted in false negative errors. As a consequence, no timber harvesting exclusion zones would have been implemented and these sites would have remained available for timber harvesting.
The apparent lack of a seasonal effect on the probability of detection suggests that any seasonal variation in foraging behaviour of Leadbeater’s Possums does not translate into meaningful variation in the possums’ propensity to encounter and be detected by the camera traps. This result gives a measure of flexibility when planning camera-trapping surveys, as the seasonal timing of field work should have little impact on probabilities of detection. Nevertheless, it is recommended that as additional camera-trapping data for Leadbeater’s Possum are accumulated, further modelling of seasonal, weather and other possible survey-level causes of variation in detection probability be undertaken as a part of any analysis of survey results, in case there are some subtle effects that have not been not uncovered during the current analysis. It is also important to note that this lack of a seasonal effect only applies to those months during which the camera-trap data were actually collected (September–May). Extrapolation of these results to winter, when no sampling was undertaken during the current study, would not be appropriate.
The analysis also showed no meaningful effects of camera position on the probability of detection. Adding camera height, tree height and whether or not the camera was on the same or an adjacent tree to the bait led to no improvement in the model, suggesting that these factors had little influence on the detectability of Leadbeater’s Possums. However, as cameras were placed in locations judged to be the most likely to yield detections of possums, a more rigorous experimental design would be required to confirm these findings.
As the camera-trapping method used in this study was found to yield high probabilities of detection, we can have a high degree of confidence that future camera-trapping surveys conducted using the same approach should be able to detect the presence of Leadbeater’s Possums. The results therefore confirm the findings of a previous study that suggested that camera traps were potentially an effective tool for surveying Leadbeater’s Possum (Harley et al. 2014).
4.5 Assessment of the performance of the existing o ccupancy model The collection of new survey data on Leadbeater’s Possums enabled an examination of the predictive accuracy of the existing occupancy models developed in 2012 (Lumsden et al. 2013). The ROC analysis of the predictive performance of the GIS-based spatial occupancy model found that this model performed poorly at predicting the presence or absence of Leadbeater’s Possums at sites surveyed using camera trapping during the current study. The occupancy model that included site structural and habitat variables had a better predictive performance, indicating the importance of these variables as predictors of habitat quality for Leadbeater’s Possums.
The finding that the model based solely on GIS variables had poor predictive performance was perhaps not unexpected for a number of reasons. First, the sites that were surveyed during the current camera-trapping surveys were not a random sample of habitats within the geographic range of Leadbeater’s Possum, but a highly biased and clustered subset of sites chosen to maximise the likelihood of detecting the species. At the outset, all surveyed sites were considered potentially suitable for occupancy by Leadbeater’s Possums, with few if any sites being inherently unsuitable for the species. This included sites that the model predicted were of low habitat quality on the basis of mapped GIS variables, but that were judged by field staff to have attributes that predisposed them to occupancy by the species. In contrast, the sites selected for the 2012 study were randomly selected, and included a wide range of sites of varying suitability. As the sites surveyed during the present study were not drawn from a similar statistical population to the sites on which the model was built, the model might not have been expected to have strong predictive capability.

26 Targeted surveys to improve Leadbeater's Possum con servation
Arthur Rylah Institute for Environmental Research Technical Report Series No. 278
Second, some of the sites that were surveyed using camera traps were selected because they were in close proximity to sites that were already known to be occupied by Leadbeater’s Possums. Even if these sites were of low habitat quality, and/or were predicted to have low probabilities of occupancy by the GIS-based model, the presence of extant populations in close proximity would increase the chances that possums would be present, due to their ability to disperse from adjacent, known-to-be-occupied habitats.
Third, several sites that were surveyed during the current study were located within the mapped boundary of the 2009 fires, with mapping suggesting they had been burnt. However, when ground-truthed, these sites were found to be unburnt, or only partially burnt. Given that the existing occupancy models for Leadbeater’s Possum included a strong, negative effect of the 2009 bushfire on the probability of occupancy, and other studies confirm a strongly negative impact of this fire on occupancy by Leadbeater’s Possums (Lindenmayer et al. 2013a), it is unsurprising that the model would make inaccurate predictions about the probability of occupancy for sites that while mapped as burnt, were in reality unburnt or only partially burnt.
Finally, the model based solely on GIS variables did not include any useful information on several habitat attributes known a priori to be important in determining habitat quality for Leadbeater’s Possum. In particular, the GIS-only model did not include any direct information on the presence or abundance of hollow-bearing trees, important structural attributes of the forest such as mid- and shrub-layer connectivity, or the availability of important food resources such as wattles. That a model that lacked these important attributes performed poorly when used for prediction at new sites is therefore unsurprising.
The improved performance of the model that included site-level structural and habitat variables illustrates the importance of accurate spatial understanding of these components of habitat for accurately predicting the distribution of Leadbeater’s Possums. Further work to develop GIS layers from remote sensing data [LiDAR (Light Detection and Ranging) and infrared imagery technologies] has the potential to provide measurements of some of these critical aspects of habitat quality for Leadbeater’s Possums. Such GIS layers can hopefully lead to the development of improved distribution models with better predictive accuracy. LiDAR in particular is well suited to remotely identifying structural habitat features of importance to arboreal fauna, such as midstorey structure and the presence of large, old trees (Vogeler et al. 2013, Garabedian et al. 2014, Owers et al. 2015), so this is an area of research that promises to contribute greatly to the aim of developing better methods for predicting the presence of Leadbeater’s Possums, for management purposes. Current work to develop LiDAR-based structural habitat GIS layers for the Central Highlands is being undertaken at present (DELWP 2016).
Further Leadbeater’s Possum occupancy surveys using the camera-trapping methodology presented here could contribute to improved occupancy models by providing more data to which the models can be fitted. This would have the most benefit if sites were selected using stratified random sampling. This would ensure that the sites included had a wide variety of attributes, representative of the range of habitat within the species’ range. The possibility of sampling in habitat types and land tenures that are under-represented in the occupancy data collected to date would also improve the representativeness of the data.
4.6 Future directions The number and spread of sites at which we detected Leadbeater’s Possums over the 2 years of the targeted survey program indicate that the species is currently widespread across much of the State forest within the Central Highlands, particularly in the southern part of the range. Although we surveyed a wide range of forest age classes with different disturbance histories throughout the range, our site selection was largely targeted towards areas we assessed as being either suitable habitat for the possums or close to existing buffered records. In addition, all sites were located in State forest, with none in conservation reserves, or in areas burnt in the 2009 bushfires. As a result, while detecting possums at 52% of the sites we surveyed is encouraging, this result cannot be used to infer the likely proportion of occupied sites throughout the species’ entire range.
In the first 2 years of targeted surveys, the primary aim was to maximise the number of new Leadbeater’s Possum colonies located within State forest, in order to protect them from timber harvesting. In 2016–2017, the final year of the targeted survey program, the survey design will aim to provide information on the distribution, status and habitat requirements of the species across the full range of available habitat throughout the Central Highlands. To maximise improvements to the occupancy model, sampling will follow a stratified, randomised design (as per Lumsden et al. 2013), with an estimated 150 new sites to be surveyed. While the majority of sites will be in unburnt State forest in order to continue locating new colonies for protection, sites will also be surveyed in conservation reserves (i.e. parks and reserves, Special Protection Zones in State forest) and in areas burnt in the 2009 bushfires. Key outcomes will be improved capacity to accurately predict where Leadbeater’s Possums occur throughout their range in areas that have not been

Targeted surveys to improve Leadbeater's Possum con servationArthur Rylah Institute for Environmental Research Technical Report Series No. 278
27
surveyed, and increased understanding of habitat requirements and the current relationship between species presence and the presence and abundance of critical habitat elements.
Camera trapping was found to be an effective method for detecting Leadbeater’s Possums, and surveys in 2016–2017 will continue to use this method. To provide a high level of confidence that the possums will be detected at sites where they occur (i.e. to minimise the chance of false negatives), three camera traps will be deployed at each survey site for 4 weeks.
As outlined in the previous section, a key requirement for improving the predictive performance of occupancy models will be to incorporate spatialised habitat data that are currently unavailable. This would ideally include spatial data on the availability of hollow-bearing trees, abundance of wattles, and structural variables indicative of connectivity in various forest strata. If current research efforts to construct such layers from LiDAR and other remotely sensed data sources are successful, then it is anticipated that spatial predictive models with much higher predictive performance than is currently available will be able to be constructed. Once available, such spatial data layers will be incorporated into updated spatial occupancy models, together with the 2016–2017 randomised survey data.

28 Targeted surveys to improve Leadbeater's Possum con servation
Arthur Rylah Institute for Environmental Research Technical Report Series No. 278
References
Adams, M.H. and Attiwill, P.M. (1984). The role of Acacia spp. in nutrient balance and cycling in regenerating Eucalyptus regnans F. Muell forests I. Temporal changes in biomass and nutrient content. Australian Journal of Botany 32, 205–215.
Commonwealth of Australia. (2016). National Recovery Plan for Leadbeater’s possum (Gymnobelideus leadbeateri). Consultation Draft, Commonwealth of Australia, February 2016.
Department of Environment, Climate Change and Water. (2010). Techniques for measuring stand basal area. Private Native Forestry Code of Practice Guideline No. 5. Department of Environment, Climate Change and Water, Sydney, NSW.
DELWP. (2015). Threatened Species Survey Standard: Leadbeater’s Possum. Department of Environment, Land, Water and Planning, Melbourne. https://www.wildlife.vic.gov.au/__data/assets/pdf_file/0030/27894/LBP-Survey-Standard-2015-artwork.pdf
DELWP. (2016). Supporting the recovery of the Leadbeater's Possum. Progress Report, December 2016. Department of Environment, Land, Water and Planning, Melbourne. https://www.wildlife.vic.gov.au/__data/assets/pdf_file/0023/27914/Progress-Report-December-2016.pdf
DELWP. (2017). Victorian Biodiversity Atlas. Department of Environment, Land, Water and Planning. https://www.environment.vic.gov.au/biodiversity/victorian-biodiversity-atlas
Elith, J., Graham, C.H., Anderson, R.P., Dudı´k, M., Ferrier, S., Guisan, A., Hijmans, R.J., Huettmann, F., Leathwick, J.R., Lehmann, A., Li, J., Lohmann, L.G., Loiselle, B.A., Manion, G., Moritz, C., Nakamura, M., Nakazawa, Y., Overton, J.McC.M., Peterson, A.T., Phillips, S.J., Richardson, K.S., Scachetti-Pereira, R., Schapire, R.E., Sobero´n, J., Williams, S., Wisz, M.S. and Zimmermann, N.E. (2006). Novel methods improve prediction of species’ distributions from occurrence data. Ecography 29(2), 129–151.
Garabedian, J.E., McGaughey, R.J., Reutebuch, S.E., Parresol, B.R., Kilgo, J.C., Moorman, C.E. and Peterson, M.N. (2014). Quantitative analysis of woodpecker habitat using high-resolution airborne LiDAR estimates of forest structure and composition. Remote Sensing of Environment 145, 68–80.
Gibbons, P. and Lindenmayer, D.B. (1996). Issues associated with the retention of hollow-bearing trees within eucalypt forests managed for wood production. Forest Ecology and Management 83, 245–279.
Hanley, J.A. and McNeil, B.J. (1982). The meaning and use of the area under a receiver operating characteristic (ROC) curve. Radiology 143, 29–36.
Harley, D. (2016). An overview of actions to conserve Leadbeater's Possum (Gymnobelideus leadbeateri). Victorian Naturalist 133, 85–97.
Harley, D.K.P. (2004). A review of recent records of Leadbeater's Possum (Gymnobelideus leadbeateri). In: Goldingay, R. and Jackson, S. (Eds) The Biology of Australian Possums and Gliders, pp. 330–338. Surrey Beatty and Sons, Chipping Norton, UK.
Harley, D.K.P., Holland, G.J., Hradsky, B.A.K. and Antrobus, J.S. (2014). The use of camera traps to detect arboreal mammals: lessons from targeted surveys for the cryptic Leadbeater’s Possum Gymnobelideus leadbeateri, pp. 233–244. In: Meek, P. and Fleming, P. (Eds) Camera Trapping: Wildlife Management and Research. CSIRO Publishing, Collingwood.
Lande, R. (1988). Genetics and demography in biological conservation. Science 241, 1455–1460.
Leadbeater’s Possum Advisory Group. (2014a). Leadbeater’s Possum Technical Report. Report to the Minister for Environment and Climate Change and the Minister for Agriculture and Food Security, Victorian Government.
Leadbeater’s Possum Advisory Group. (2014b). Leadbeater’s Possum Recommendations. Report to the Minister for Environment and Climate Change and the Minister for Agriculture and Food Security, Victorian Government.
Targeted surveys to improve Leadbeater's Possum con servationArthur Rylah Institute for Environmental Research Technical Report Series No. 278
29
Lindenmayer, D.B. (2000). Factors at multiple scales affecting distribution patterns and their implications for animal conservation – Leadbeater's Possum as a case study. Biodiversity and Conservation 9, 15–35.
Lindenmayer, D.B., Blair, D., McBurney, L., Banks, S.C., Stein, J.A.R., Hobbs, R.J., Likens, G.E. and Franklin, J.F. (2013b). Principles and practices for biodiversity conservation and restoration forestry: a 30 year case study on the Victorian montane ash forests and the critically endangered Leadbeater’s Possum. Australian Zoologist 36, 441–460.
Lindenmayer, D.B., Blanchard, W., Blair, D., McBurney, L. and Banks, S.C. (2016). Environmental and human drivers of large old tree abundance in Australian wet forests. Forest Ecology and Management 372, 226–235.
Lindenmayer, D.B., Blanchard, W., McBurney, L., Blair, D., Banks, S., Likens, G.E., Franklin, J.F., Laurance, W.F., Stein, J.A.R. and Gibbons, P. (2012). Interacting factors driving a major loss of large trees with cavities in a forest ecosystem. PLoS ONE 7, e41864.
Lindenmayer, D.B., Blanchard, W., McBurney, L., Blair, D., Banks, S.C., Driscoll, D., Smith, A.L. and Gill, A.M. (2013a). Fire severity and landscape context effects on arboreal marsupials. Biological Conservation 167, 137–148.
Lindenmayer, D.B., Cunningham, R.B., Tanton, M.T. and Smith, A.P. (1990). The conservation of arboreal marsupials in the montane ash forests of the central highlands of Victoria, south-east Australia: II. The loss of trees with hollows and its implications for the conservation of Leadbeater's Possum, Gymnobelideus leadbeateri McCoy (Marsupialia: Petauridae). Biological Conservation 54, 133–145.
Lindenmayer, D.B., Cunningham, R.B., Tanton, M.T., Nix, H.A. and Smith, A.P. (1991b). The conservation of arboreal marsupials in the montane ash forests of the Central Highlands of Victoria, south-east Australia: III. The habitat requirements of Leadbeater's Possum Gymnobelideus leadbeateri and models of the diversity and abundance of arboreal marsupials. Biological Conservation 56, 295–315.
Lindenmayer, D.B., Cunningham, R.B., Tanton, M.T., Smith, A.P. and Nix, H.A. (1991a). Characteristics of hollow-bearing trees occupied by arboreal marsupials in the montane ash forests of the Central Highlands of Victoria, south-east Australia. Forest Ecology and Management 40, 289–308.
Lindenmayer, D.B. and Lacy, R.C. (1995). Metapopulation viability of Leadbeater’s Possum, Gymnobelideus leadbeateri, in fragmented old-growth forests. Ecological Applications 5(1), 164–182.
Lindenmayer, D.B. and Possingham, H.P. (1995). Modelling the impacts of wildfire on the viability of metapopulations of the endangered Australian species of arboreal marsupial, Leadbeater's Possum. Forest Ecology and Management 74, 197–222.
Lindenmayer, D.B., Smith, A.P., Craig, S.A. and Lumsden, L.F. (1989). A survey of the distribution of Leadbeater's possum, Gymnobelideus leadbeateri McCoy in the Central Highlands of Victoria. Victorian Naturalist 106, 174–178.
Lumsden, L.F., Nelson, J.L., Todd, C.R., Scroggie, M.P., McNabb, E.G., Raadik, T.A., Smith, S.J., Acevedo, S., Cheers, G., Jemison, M.L. and Nicol, M.D. (2013). A New Strategic Approach to Biodiversity Management – Research Component. Arthur Rylah Institute for Environmental Research Unpublished Client Report for the Department of Environment and Primary Industries, Heidelberg, Victoria.
MacKenzie, D.I., Nichols, J.D., Lachman, G.B., Droege, S., Royle, J.A. and Langtimm, C.A. (2002). Estimating site occupancy rates when detection probabilities are less than one. Ecology 83, 2248–2255.
Nelson, J.L., Lumsden, L.F., Durkin, L.K., Bryant, D.B., Macak, P.V., Cripps, J.K., Smith, S.J., Scroggie, M.P. and Cashmore, M.P. (2015). Targeted surveys for Leadbeater's Possum in 2014–15. Report for the Leadbeater's Possum Implementation Committee. Arthur Rylah Institute for Environmental Research. Department of Environment, Land, Water and Planning, Heidelberg, Victoria.
Owers, C.J., Kavanagh, R.P. and Bruce, E. (2015). Remote sensing can locate and assess the changing abundance of hollow-bearing trees for wildlife in Australian native forests. Wildlife Research 41, 703–716.
Plummer, M. (2003). JAGS: A program for analysis of Bayesian graphical models using Gibbs sampling. In: Proceedings of the 3rd International Workshop on Distributed Statistical Computing 124, 125.10 pp. http://www.R-project.org/conferences/DSC-2003/

30 Targeted surveys to improve Leadbeater's Possum con servation
Arthur Rylah Institute for Environmental Research Technical Report Series No. 278
R Core Team. (2016). R: A Language and Environment for Statistical Computing. R Foundation for Statistical Computing, Vienna, Austria. http://www.R-project.org/.
Royle, J.A. and Kery, M. (2007). A Bayesian state–space formulation of dynamic occupancy models. Ecology 88, 1813–1823.
Sing, T., Sander, O., Beerenwinkel, N. and Lengauer, T. (2005). ROCR: visualizing classifier performance in R. Bioinformatics 21, 3940–3941.
Smith, A.P. (1984a). Diet of Leadbeater’s Possum, Gymnobelideus leadbeateri (Marsupialia). Australian Wildlife Research 11, 265–273.
Smith, A.P. (1984b). Demographic consequences of reproduction, dispersal and social interaction in a population of Leadbeater’s Possum (Gymnobelideus leadbeateri). In: Smith, A.P. and Hume, I.D. (Eds) Possum and Gliders, pp. 359–373. Australian Mammal Society, Sydney.
Smith, A.P. and Lindenmayer, D.B. (1988). Tree hollow requirements of Leadbeater’s Possum and other possums and gliders in timber production ash forests of the Victorian Central Highlands. Australian Wildlife Research 15, 347–362.
Smith, A.P. and Lindenmayer, D.B. (1992). Forest succession and habitat management for Leadbeater’s possum in the state of Victoria, Australia. Forest Ecology and Management 49, 311–332.
Smith, S. and Morey, J. (2001). Options for a permanent reserve system for the conservation of Leadbeater’s Possum. Draft Report, Flora and Fauna Program, Department of Natural Resources and Environment, Melbourne.
Todd, C.R., Lindenmayer, D.B., Stamation, K., Acevedo–Cattaneo, S., Smith, S. and Lumsden, L.F. (2016). Assessing reserve effectiveness: application to a threatened species in a dynamic fire prone forest landscape. Ecological Modelling 338, 90–100.
Vaughan, I.P. and Ormerod, S.J. (2005). The continuing challenges of testing species distribution models. Journal of Applied Ecology 42(4), 720–730.
Vogeler, J.C., Hudak, A.T., Vierling, L.A. and Vierling, K.T. (2013). Lidar-derived canopy architecture predicts Brown Creeper occupancy of two western coniferous forests. Condor 115, 614–622.

Targeted surveys to improve Leadbeater's Possum con servationArthur Rylah Institute for Environmental Research Technical Report Series No. 278
31

32 Targeted surveys to improve Leadbeater's Possum con servation
Arthur Rylah Institute for Environmental Research Technical Report Series No. 278
delwp.vic.gov.au