target zero & safety data - how is it going? · target zero & safety data – how is it...
TRANSCRIPT
Target Zero & Safety Data –
How is it Going?
2012 Washington Tribal-State Transportation Conference
Airway Heights, WA
Mike Dornfeld (WSDOT) & Steve Lind (WTSC)
October 3, 2012
What will we talk about?
• Washington State’s Strategic Highway Safety Plan: Target Zero
• The Target Zero Teams – A
Demonstration Project • Traffic Safety Successes on the Colville
Reservation 2

The Target Zero Vision
Eliminate all traffic deaths and serious injuries on Washington roads by the
year 2030.
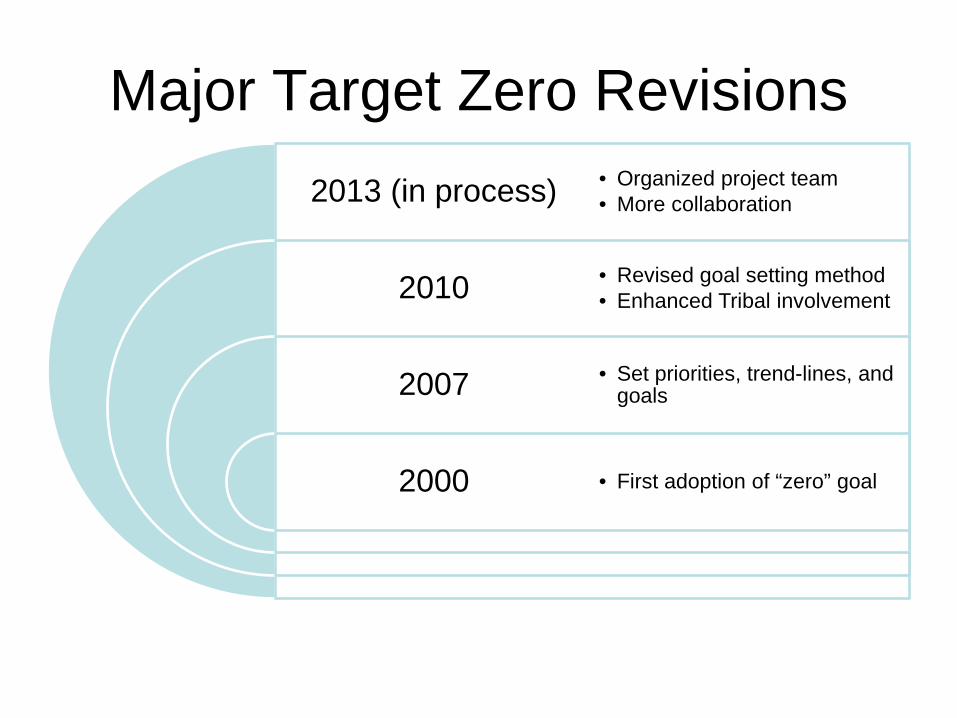
Major Target Zero Revisions 2013 (in process)
2010
2007
2000
• Organized project team • More collaboration
• Revised goal setting method • Enhanced Tribal involvement
• Set priorities, trend-lines, and goals
• First adoption of “zero” goal
Key Elements of Target Zero
• Many partners
• Data based
• State goals and priorities
• Proven strategies

Washington Traffic Fatalities, 1980-2009 Projected to 2030
0
200
400
600
800
1,000
1,200
1,400
1980 1985 1990 1995 2000 2005 2010 2015 2020 2025 2030
Year
Source: FARS
Current trend is a decrease of 10 traffic fatalities per year...
…But to reach the goal of zero traffic fatalities by 2030 will require a decrease of 26 fatalities per year!

We’re making a difference!
658
600 567
649 633
571 521
492 460 454 444
357
397
496 460
0
200
400
600
800
2002 2003 2004 2005 2006 2007 2008 2009 2010 2011 2012 2013 2014 2015 2016 2017
Washington Traffic Fatalities
Actual Fatalities Predicted Fatalities Upper CL
Lower CL 0 in 2030 2010 Goals
Source: FARS

Washington StateDepartment of Transportation
State Agencies
Local Agencies
Indian Nations
Implementation Required
Implementation Recommended

Determining Target Zero Priorities
• Analyze the data.
• Target areas where investments give the greatest safety benefits.
• Rank emphasis areas into different priority levels.

2010 TZ Priority Rankings
Priority One Areas for 2010
Percent of Total Deaths, 2006-2008
Impaired Driving 47.7%
Speeding 40.2%
Run off the Road Collisions* 41.8%
*Moved up from Priority Level Two in last edition of Target Zero
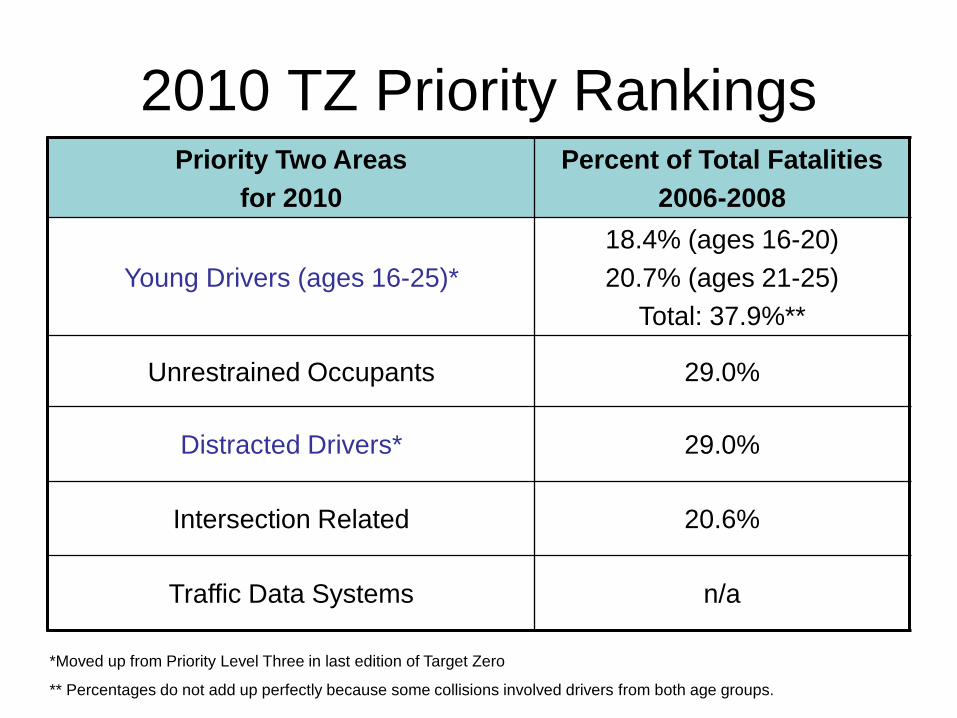
2010 TZ Priority Rankings Priority Two Areas
for 2010 Percent of Total Fatalities
2006-2008
Young Drivers (ages 16-25)* 18.4% (ages 16-20) 20.7% (ages 21-25)
Total: 37.9%**
Unrestrained Occupants 29.0%
Distracted Drivers* 29.0%
Intersection Related 20.6%
Traffic Data Systems n/a
*Moved up from Priority Level Three in last edition of Target Zero
** Percentages do not add up perfectly because some collisions involved drivers from both age groups.

2010 TZ Priority Rankings Priority Three Areas
for 2010
Percent of Total Deaths
2006-2008 Unlicensed Drivers 20.4%
Opposite Direction Multi-vehicle 18.7%
Motorcyclists 13.0% Pedestrians 11.5%
Heavy Trucks 11.5% Emergency Medical Services n/a
13

2010 TZ Priority Rankings Priority Four Areas
for 2010
Percent of Total Deaths
2006-2008 Older Drivers 7.0%
Drowsy Drivers* 4.5% Pedal cyclists 1.7% Workzones 1.7%
Wildlife Involved 0.5% Vehicle-Train Collisions 0.5%
School-Bus Involved 0.1% Aggressive Drivers n/a
Integrated Interoperability Communications n/a *Moved down from Priority Level Three in last edition of Target Zero
14
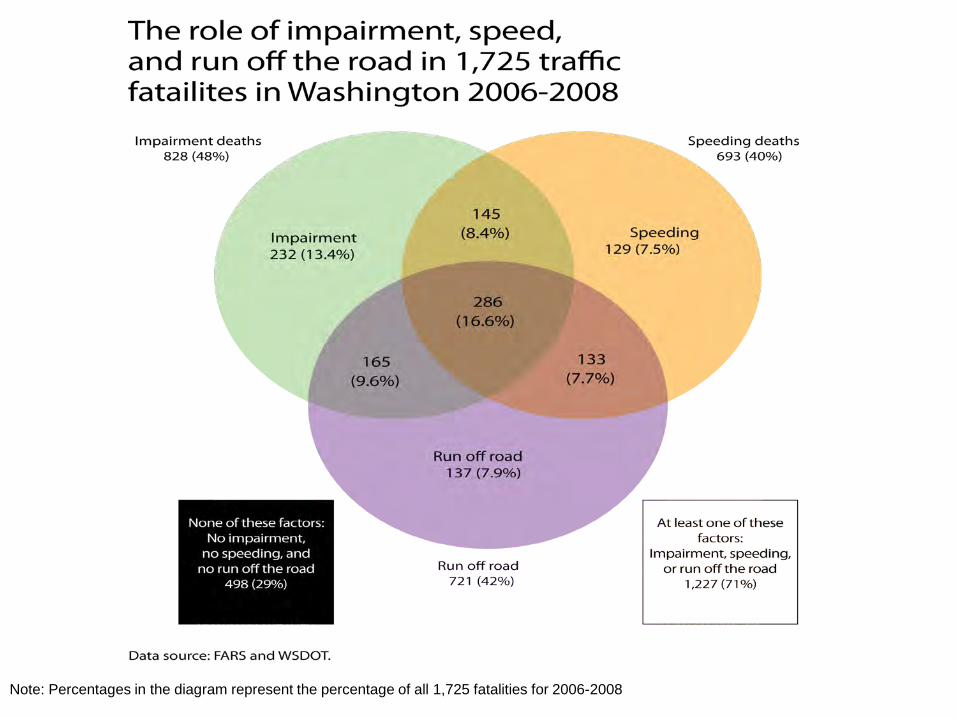
Note: Percentages in the diagram represent the percentage of all 1,725 fatalities for 2006-2008
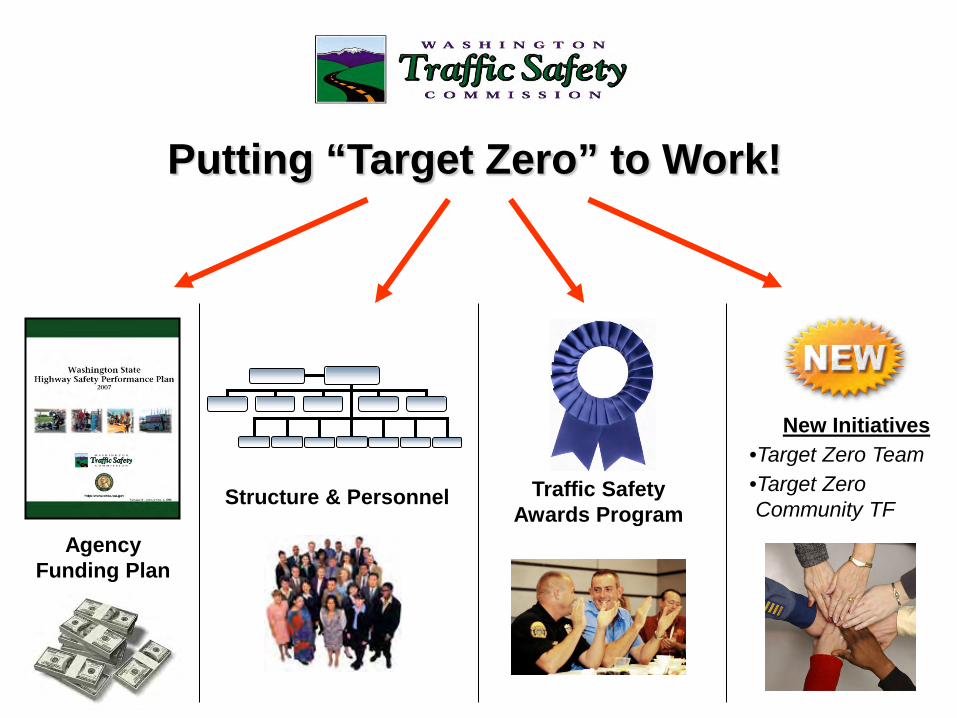
Putting “Target Zero” to Work!
Agency Funding Plan
Structure & Personnel Traffic Safety Awards Program
New Initiatives •Target Zero Team •Target Zero Community TF

• Top TZ Roadway Priorities – Run off Road Collisions – Intersection Related Collisions
• Using quantitative methods based on the
Highway Safety Manual to identify potential collision reduction locations and countermeasure selection.
17
Washington StateDepartment of Transportation
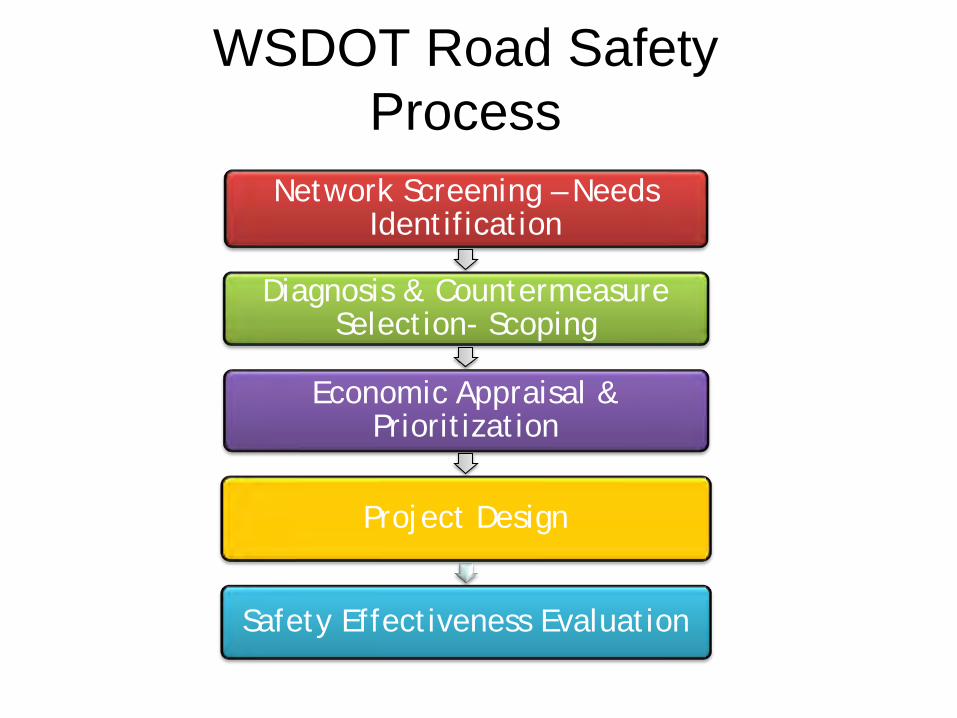
WSDOT Road Safety Process
Network Screening – Needs Identification
Diagnosis & Countermeasure Selection- Scoping
Economic Appraisal & Prioritization
Project Design
Safety Effectiveness Evaluation

TZ Proven Engineering Strategies to Reduce Fatal Run
off the Road Crashes • Install centerline and edge line rumble strips.
• Use of cable guard rail.
• Improve ditches/back slopes. • Remove or replace all non-standard guardrail.
19
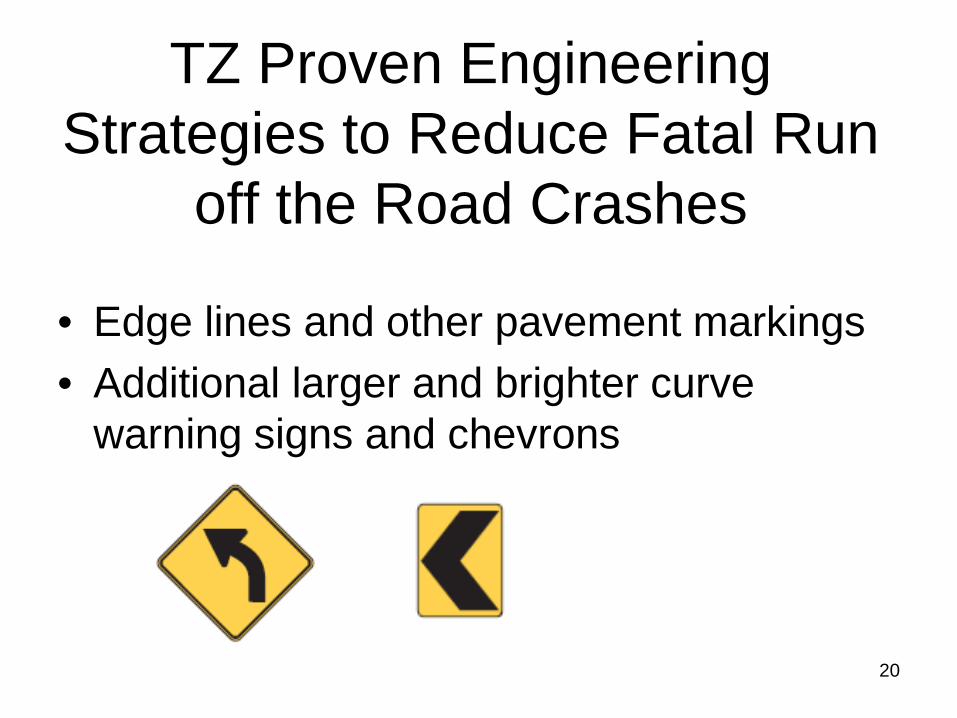
TZ Proven Engineering Strategies to Reduce Fatal Run
off the Road Crashes
• Edge lines and other pavement markings • Additional larger and brighter curve
warning signs and chevrons
20
Are There Any Non-engineering ROR Strategies?
All the proven strategies listed in the following Target Zero priority areas would
reduce ROR crashes: • Impaired Driving
• Drowsy or Distracted Driving
• Speeding 21

A High Tide Floats All Boats

Target Zero Teams

Clallam
Jefferson
Grays Harbor
Pacific
Wahkiakum Cowlitz
Clark
Lewis
Thurston
Pierce
King
Snohomish
Skagit
Whatcom
Kitsap
Island
San Juan
Okanogan
Chelan
Douglas
Kittitas
Yakima
Klickitat
Skamania Benton
Franklin
Walla Walla Asotin
Garfield
Columbia
Whitman Adams Grant
Lincoln Spokane
Ferry
Stevens
Pend Oreille
Mason
Washington
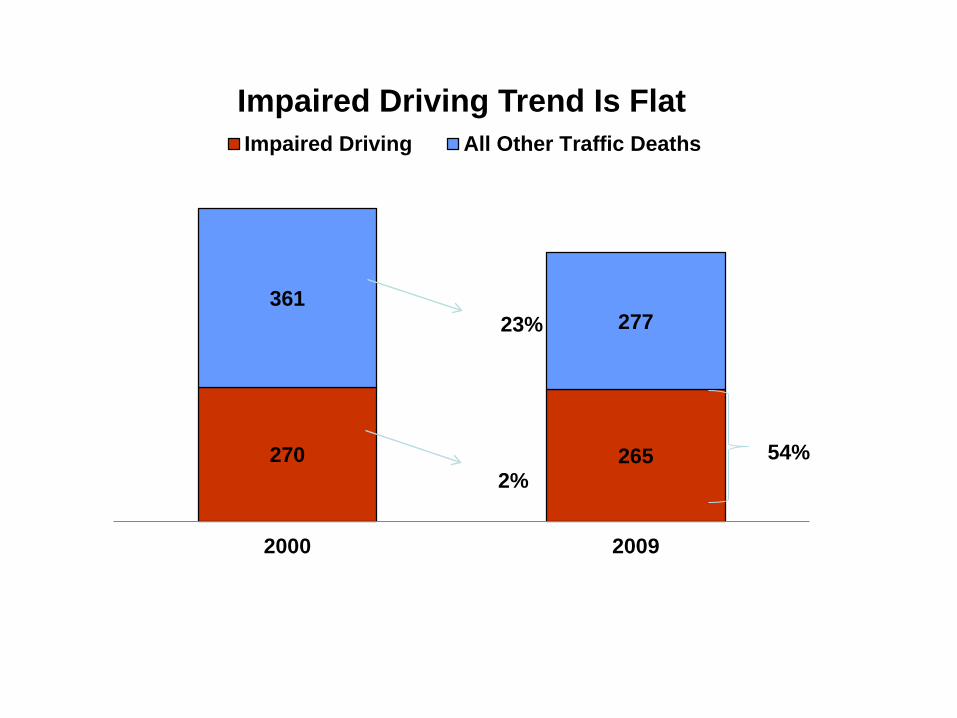
270 265
361 277
2000 2009
Impaired Driving Trend Is Flat Impaired Driving All Other Traffic Deaths
23%
2% 54%

Essentials
Target Zero Teams
• Highly-visible • Data-driven • Targeted • Nighttime • Full-time • DUI enforcement
partnership

Partners 21 Washington State Patrol Troopers
44 Local Law Enforcement Agencies
Four Target Zero Managers
Four Law Enforcement Liaisons
Target Zero Prosecutors
WSP Geographic Information System Analyst
Washington Traffic Safety Commission
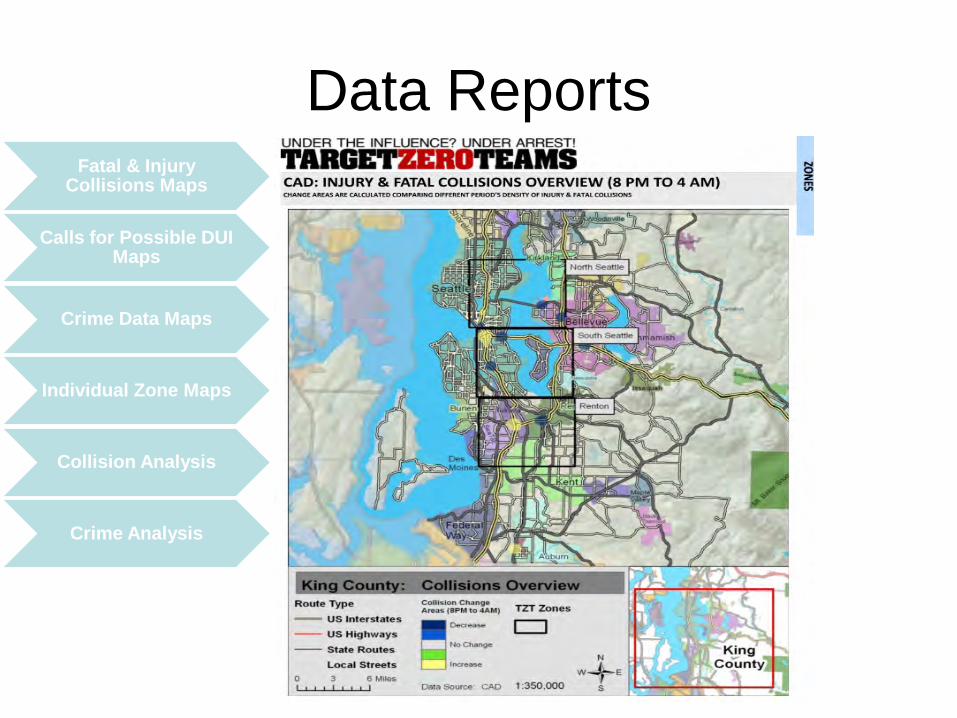
Data Reports Fatal & Injury
Collisions Maps
Calls for Possible DUI Maps
Crime Data Maps
Individual Zone Maps
Collision Analysis
Crime Analysis

We’re On The Team PSAs

We’re On the Team Radio

waTikileaks.com

Over 60,000 Contacts
24 Months Violations Contacts DUI Speed Restraints
WSP D1 1,932 1,496 875 17,811 WSP D2 2,052 1,686 517 13,319 WSP D7 1,789 4,435 614 17,497 WSP Totals 5,773 7,617 2,006 48,627
Pierce Local 349 668 32 5,201 King Local 375 767 127 8,148 Snohomish 196 542 77 5,879 Local Totals 920 1,977 236 16,321
Total 6,693 9,594 2,242 64,948

313.25
78.75
148.5
36
140.5
31
241
77 91
41
94
24
0
50
100
150
200
250
300
350
Target ZeroTeams Counties
Control Counties Target ZeroTeams Counties
Control Counties Target ZeroTeams Counties
Control Counties
All Traffic Deaths Impaired Driving-Involved Speeding-Related
Num
ber o
f Dea
ths
Change in Traffic Deaths: Target Zero Teams Counties vs. Control Counties
Average of 4 Previous 18-Month Segments (Jul 05-Dec 09) 18-Month Total (Jul 10-Dec 11)
-23.1%
-2.2% -38.7%
13.9%
-33.1%
-22.6%
Impaired Driver-Involved Speeding-Related All Traffic Deaths
Data source: Fatality Analysis Reporting System (FARS) MDE as of 5/11/2012. Data for 2011 is preliminary and may change as more information becomes available.
% change
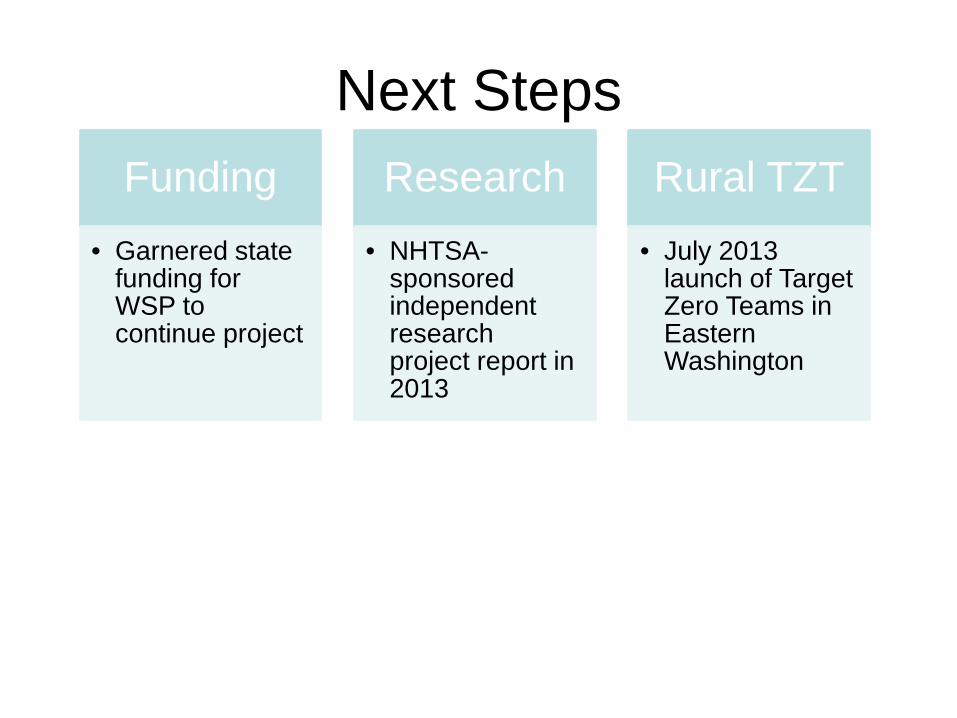
Next Steps Funding
• Garnered state funding for WSP to continue project
Research • NHTSA-
sponsored independent research project report in 2013
Rural TZT • July 2013
launch of Target Zero Teams in Eastern Washington

The Confederated Tribes of The
Colville Reservation
Traffic Safety Successes on The Colville Reservation
A 15 minute video
35

Questions, Suggestions?
Mike Dornfeld – WSDOT - (360)705-7288 [email protected]
Steve Lind – WTSC – (360)725-9897
Target Zero can be found at
www.targetzero.com