target missouri 3 - tm3 industry drivers of the economy · tm3 provides a well conceptualized and...
TRANSCRIPT

TARGET MISSOURI 3 - TM3 INDUSTRY DRIVERS OF THE ECONOMY
April 2004
Principal Investigator
David J. Peters
MISSOURI DEPARTMENT OF ECONOMIC DEVELOPMENT Making Missouri the best place to live, work, vacation and conduct business.
www.ded.mo.gov

Target Missouri 3 - TM3 1
Missouri Economic Research and Information Center Missouri Department of Economic Development
www.ded.mo.gov
KEY FINDINGS .
• A common practice in economic development is to craft public policies to support an economy’s “target industries”. It is assumed by policy makers that public investments in these target industries will create economic growth and wealth for the region. Although this development approach is supported by a segment of economic theory, oftentimes the methods used to identify target industries are simplistic and politically driven. When targeted industries are identified using political rather than empirical justifications, development agencies run the risk of investing scare resources into groups of industries that will produce little to no economic benefits.
• Target Missouri 3 - TM3 - was developed to assist economic development officials in
targeting industries based on sound economic theory and methods. TM3 provides a well conceptualized and empirically based definition of which industries are drivers of a region’s economy, so that economic development policies and resources can be directed to the most viable parts of the economy.
• Missouri’s 82 driver industries have a sizable impact on the state's economy, accounting
for 42.8% of total foreign exports, 17.7% of total output, 10.0% of total compensation and 8.3% of total employment. In addition, these driver industries paid an average annual wage per job of $34,653, which was moderately more that the state average wage per job.
• In manufacturing, Missouri had a competitive advantage in greeting card publishing,
automatic merchandising machines, lumber and wood products (i.e. sawmill products, hardwood floors, wood containers/pallets, and furniture), ammunition, paper products (i.e. paper bags, paper sanitary products, envelopes, and paper), and lastly in motor vehicles, which was substantially represented (i.e. motor vehicles, boats, motorcycles, aircraft, internal combustion engines, motors and generators, fans, and heating and cooling equipment).
• In the extractive industries, Missouri had a competitive advantage in lead mining, clay
cricks, lime and stone quarrying, paving and asphalt products, and cement.
• In agriculture and food products, Missouri had a competitive advantage in agricultural production products (i.e. agricultural chemicals, grass seeds, prepared feeds, feed grains, hay, cattle, hogs, and oil crops) and in manufactured food products (i.e. pet foods, malt beverages, pasta products, poultry processing, pickles and sauces, roasted coffee, cheese and condensed milk, and cereals).

Target Missouri 3 - TM3 2
Missouri Economic Research and Information Center Missouri Department of Economic Development
www.ded.mo.gov
TARGET MISSOURI 3 - TM3 INDUSTRY DRIVERS OF THE ECONOMY
Key Findings . . . . . 1 Overview . . . . . 3 Data and Methods . . . . . 4 Missouri's Target Industries . . . . . 7 Summary and Implications . . . . . 16 Statistical Appendix . . . . . 17 About MERIC At DED . . . . . 55
April 2004
Principal Investigator David J. Peters

Target Missouri 3 - TM3 3
Missouri Economic Research and Information Center Missouri Department of Economic Development
www.ded.mo.gov
OVERVIEW .
A common practice in economic development is to craft public policies to support an
economy’s “target industries”. It is assumed by policy makers that public investments in these
target industries will create economic growth and wealth for the region. Although this
development approach is supported by a segment of economic theory, oftentimes the methods
used to identify target industries are simplistic and politically driven. Therefore, it is critical that
economic development officials base target industry policies on sound economic theory and
rigorous methods.
Target Missouri 3 - TM3 - was developed to assist economic development officials in
targeting industries based on sound economic theory and methods. TM3 is a methodology for
identifying the industrial drivers of an economy, grounded in economic base theory. TM3 can
affect economic development policy by providing a well conceptualized and empirically based
definition of which industries are drivers of a region’s economy. When targeted industries are
identified using political rather than empirical justifications, development agencies run the risk
of investing scare resources into groups of industries that will produce little to no economic
benefits. When targeted industries are identified empirically, economic development policies
and resources can be directed to the most viable parts of the economy. TM3 is an extension of
previous Target Missouri initiatives, the first of which began in the mid-1990s. TM3
substantially improves upon previous initiatives by: (1) offering greater geographic detail and
flexibility using county-based data; (2) offering greater industry detail for over 500 specific
economic sectors; (3) offering more diverse and appropriate economic base indicators, such as
exports, output and productivity; and (4) offering a statistically sound method for classifying
industries.
Target industry development policies are grounded in economic base theory. The
essential idea is that some activities in a region are peculiarly basic in the sense that their
growth leads and determines the region’s overall development; while other non-basic activities
are simply consequences of the region’s overall development. Economic base theory identifies
basic activities as those that bring in money from the outside world, generally by producing
goods or services for export. The argument advanced for this approach is that a region, like a
household or a business firm, must earn its livelihood by producing something that others will
pay for. Activities that simply serve the regional market are there as a result of whatever level
of income and demand the region may have achieved - they are passive participants in growth
but not prime movers. A household, a neighborhood, a firm, or a region cannot get richer by

Target Missouri 3 - TM3 4
Missouri Economic Research and Information Center Missouri Department of Economic Development
www.ded.mo.gov
simply "taking in its own washing"; it must sell something to others in order to get more
income. Consequently, exports are viewed as providing the economic base of a region’s growth.
DATA AND METHODS .
To identify Missouri's driver industries, a mathematical cluster analysis was used to
group industries based on how economically competitive they are relative to the national
average. Once grouped, multivariate analysis of variance and discriminant function analysis
were used to identify unique characteristics of the clusters and to assess the internal validity of
the groupings.
Data in this analysis was taken from the Minnesota IMPLAN Group who compile cross-
sectional data at the national, state and county level to construct a comprehensive and accurate
database at the county-level that has a consistent structure (MIG, 1999). IMPLAN is used
widely by researchers in industry, government and academia. Since the data is disaggregated
by county, the analysis can be replicated for any combination of counties in Missouri to
approximate economic regions. Nine variables comparing the Missouri industry average to the
national industry average in terms of output, employment, compensation and foreign exports
were used to measure the economic competitiveness of a given industry between 1997 and
2000. Refer to Table 1.
Industry output represents the value of an industry's total production and was derived
from U.S. Bureau of Census (Economic Census), U.S. Bureau of Economic Analysis (output
estimates) and U.S. Bureau of Labor Statistics (projections) data. Industry employment
includes both full-time and part-time workers and is reported as full-time equivalent jobs.
Industry compensation represents total payroll costs, which include wages, salaries, benefits
and non-cash compensation. Industry employment and compensation was derived from U.S.
Bureau of Economic Analysis (REIS) and U.S. Bureau of Labor Statistics (ES-202) data.
Industry foreign exports are demands made for goods and services by consumers and
industries outside the U.S. and was derived from U.S. Bureau of Census (Economic Census) and
U.S. Bureau of Economic Analysis (export estimates) data.
To measure the economic competitiveness of a given industry in Missouri the data was
benchmarked to the national average for that industry. To measure Missouri's economic
competitiveness in a given industry relative to the national industry average in 2000,
specialization in output, employment, compensation and exports were measured using location
quotients. Scores greater than 1.0 indicate that Missouri is relatively more specialized in that
industry relative to the national average, which indicates a comparative advantage or potential

Target Missouri 3 - TM3 5
Missouri Economic Research and Information Center Missouri Department of Economic Development
www.ded.mo.gov
for growth. Scores less than 1.0 indicate that Missouri is relatively less specialized in that
industry relative to the national average, which indicates a comparative disadvantage. The
formula for a location quotient is given in equation (1), where X is the economic variable of
interest, i is the industry, r the region and n the nation.
(1) ( ) ( )ninririr XXXXLQX =
To measure Missouri's growth in a given industry relative to the national industry
average between 1997 and 2000, the difference in growth rates between Missouri and the
United States was calculated for output, employment, compensation and exports. Positive
scores indicate the percentage of regional industry growth above the national average, meaning
that the industry in Missouri is growing faster than the national industry average. Negative
scores indicate the percentage of regional industry growth below the national average, meaning
that the industry in Missouri is growing slower than the national industry average. The formula
used to calculate the difference in growth rates is given in equation (2), where X is the
economic variable of interest, i is the industry, r the region, n the nation and t is time period.
(2) ( )( )( ) ( )( )( )100*XXX100*XXXX 1tin
1tin
tin
1tir
1tir
tirir
−−−− −−−=∆
To measure Missouri's productivity in a given industry relative to the national industry
average in 2000, the ratio of output per worker between Missouri and the United States was
calculated. Scores greater than 1.0 indicate that the industry in Missouri is more productive
than the national average, which indicates a comparative advantage. Scores less than 1.0
indicate that the industry in Missouri is less productive than the national average, which may
indicate a comparative disadvantage. The formula used to calculate the productivity measure is
given in equation (3), where O is output, E is employment, i is the industry, r the region and n
the nation.
(3) ( ) ( )ininiririr EOEOPROD =

Target Missouri 3 - TM3 6
Missouri Economic Research and Information Center Missouri Department of Economic Development
www.ded.mo.gov
TABLE 1 Economic Competitiveness Variables for Missouri.
Variable Description
Output Specialization Output location quotient, 2000.
Output Growth Difference in output growth rates relative to the national average, 1997-2000.
Productivity Productivity per worker relative to the national average, 2000.
Employment Specialization Employment location quotient, 2000.
Employment Growth Difference in employment growth rates relative to the national average, 1997-2000.
Compensation Specialization Compensation location quotient, 2000.
Compensation Growth Difference in compensation growth rates relative to the national average, 1997-2000.
Export Specialization Foreign exports location quotient, 2000.
Export Growth Difference in foreign exports growth rates relative to the national average, 1997-2000.
NOTES: Data taken from IMPLAN.

Target Missouri 3 - TM3 7
Missouri Economic Research and Information Center Missouri Department of Economic Development
www.ded.mo.gov
MISSOURI'S TARGET INDUSTRIES .
Results of the cluster and discriminant function analyses grouped 509 industries into 13
clusters based on how economically competitive they were relative to the national average. Of
these 13 clusters, six were identified as drivers of Missouri's economy based on economic
specialization relative to the national average. Refer to Table 2. This resulted in 82 driver
industries where Missouri had a locational competitive advantage relative to other states.
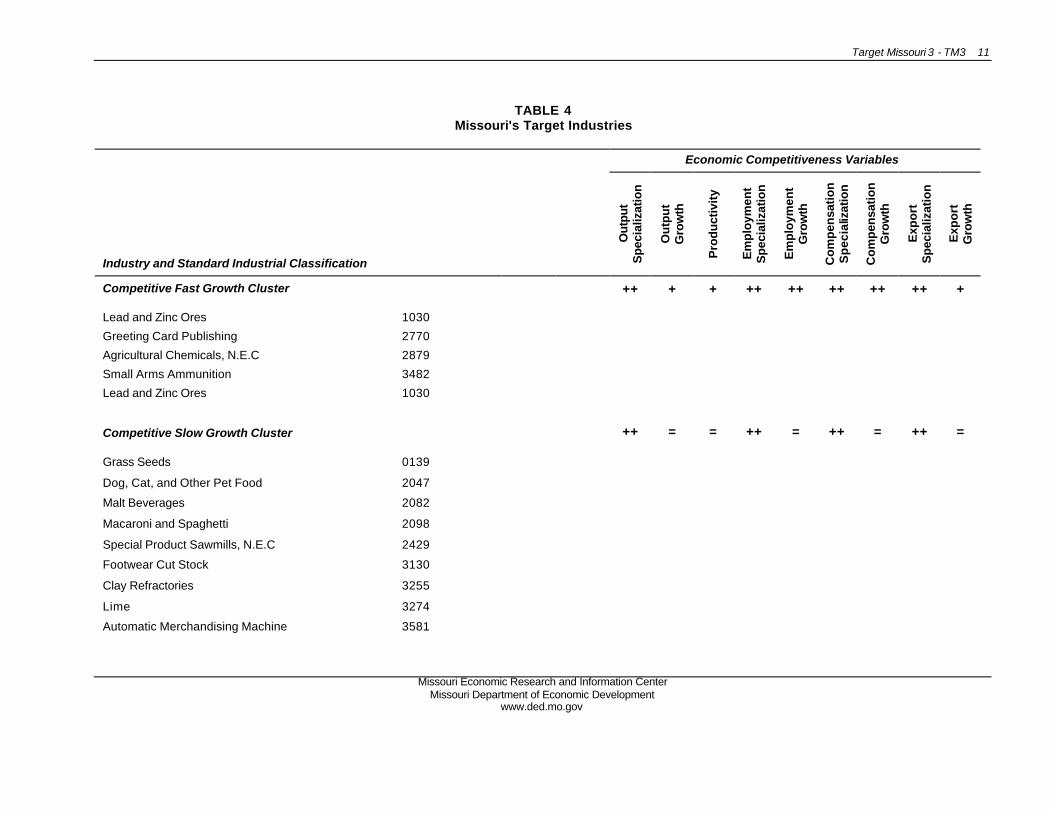
These Refer to Tables 3 and 4. This group represents Missouri's target industries.
The competitive core of Missouri's economy consisted of 13 industries where the state
had the best competitive advantage in the nation. Specialization in output, employment,
compensation and foreign exports were all extremely high. The competitive fast growth cluster
included four industries that were growing faster than the national industry average, especially
in compensation and employment. Also, productivity per worker was above the national
average for these industries. The competitive slow growth cluster included nine industries that
were growing close to the national industry average. Growth in compensation and foreign
exports slightly exceeded the national average. Also, productivity per worker was at the
national average for these industries.
The emerging core of Missouri's economy consisted of 69 industries where the state had
an above average competitive advantage in the nation. These industries are well positioned to
become part of Missouri's competitive core. The emerging hyper growth cluster included one
industry where specialization in output, employment, compensation and foreign exports were
slightly above the national industry average. However, growth across the board far outpaced
the national industry average, especially in foreign exports. Also, productivity per worker was
below the national average for this industry.
The emerging fast growth cluster included four industries where specialization in output,
employment, compensation and foreign exports were above the national industry average,
especially in compensation. These industries were growing faster than the national industry
average, especially in compensation, output and employment. Also, productivity per worker
was above the national average for these industries.
The emerging moderate growth cluster included 45 industries where specialization in
output, employment, compensation and foreign exports were above the national industry

Target Missouri 3 - TM3 8
Missouri Economic Research and Information Center Missouri Department of Economic Development
www.ded.mo.gov
average. These industries were growing above the national industry average, especially in
compensation. Also, productivity per worker was at the national average for these industries.
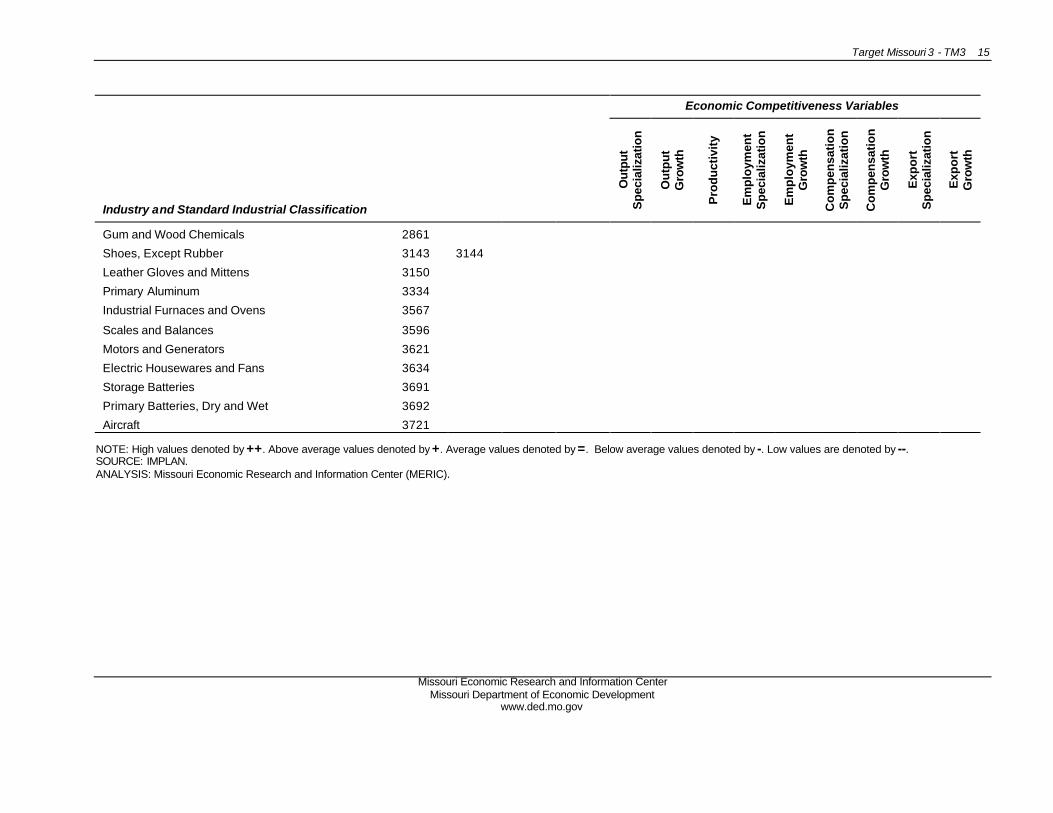
Lastly, the emerging slow growth cluster included 19 industries where specialization in
output, employment, compensation and foreign exports were well above the national industry
average. These industries were growing at or slightly above the national industry average.
However, productivity per worker was below the national average for these industries.
The 82 driver industries had a sizable impact on Missouri's economy, accounting for
42.8% of total foreign exports, 17.7% of total output, 10.0% of total compensation and 8.3%
of total employment. In addition, these driver industries paid an average annual wage per job
of $34,653, which was moderately more that the state average wage per job. In terms of
output per worker, productivity was highest in the emerging hyper growth cluster ($37,402 per
worker) and lowest in the emerging fast growth cluster ($14,349 per worker). In terms of
wages per job, the highest paying jobs were in the competitive fast growth cluster ($72,795 per
job) and lowest paying were in the emerging slow growth cluster ($30,086 per job). In terms
of foreign exports per worker, the hyper growth cluster was the most export intensive ($76,085
per worker) and the emerging fast growth cluster was the least intensive ($6,486 per worker).

Target Missouri 3 - TM3 9
Missouri Economic Research and Information Center Missouri Department of Economic Development
www.ded.mo.gov
TABLE 2
Cluster Means by Economic Competitiveness Variables.
Economic Competitiveness Variables
Industry Clusters Ou
tpu
t S
peci
aliz
atio
n
Ou
tpu
t G
row
th
Pro
du
ctiv
ity
Em
plo
ymen
t S
peci
aliz
atio
n
Em
plo
ymen
t G
row
th
Co
mp
ensa
tio
n
Spe
cial
izat
ion
Co
mp
ensa
tio
n
Gro
wth
Exp
ort
S
peci
aliz
atio
n
Exp
ort
G
row
th
Competitive Fast Growth 15.36 37.39 1.08 13.18 59.23 17.29 76.90 15.69 27.99
Competitive Slow Growth 8.70 -0.99 0.99 8.41 -0.21 9.15 4.62 8.89 2.79
Emerging Hyper Growth 1.62 385.95 0.86 1.73 381.79 1.48 378.84 1.65 11600.97
Emerging Fast Growth 2.81 170.17 1.12 2.32 163.00 3.24 196.18 1.99 90.46
Emerging Moderate Growth 2.25 10.31 0.97 2.15 11.22 2.30 14.72 2.30 8.03
Emerging Slow Growth 3.93 2.87 0.89 4.10 5.37 3.88 6.34 4.01 8.67
US Average Competitiveness 1.12 -0.85 0.93 1.11 0.64 1.12 -0.06 0.79 -0.93
Uncompetitive Hyper Growth 0.60 603.04 0.87 0.63 465.58 0.41 454.68 0.30 214.86
Uncompetitive Fast Growth 0.35 110.73 0.93 0.34 87.02 0.38 107.83 0.34 91.37
Uncompetitive Slow Growth 0.30 3.65 0.92 0.31 5.62 0.28 7.10 0.28 1.30
Uncompetitive Declining 0.23 -58.38 0.77 0.24 -59.69 0.22 -61.71 0.22 -85.15
Non-Competitive High Productivity 0.39 13.74 5.03 0.07 -20.60 0.05 29.04 0.00 0.00
Non-Competitive Low Productivity 0.04 -0.46 0.04 0.06 3.80 0.03 3.13 0.02 -0.57
SOURCE: IMPLAN. ANALYSIS: Missouri Economic Research and Information Center (MERIC).

Target Missouri 3 - TM3 10
Missouri Economic Research and Information Center Missouri Department of Economic Development
www.ded.mo.gov
TABLE 3
Economic Impacts of Missouri's Target Industries 2000.
Economic Variables
Target Industry Clusters Output
(Pct of MO Total) Employment
(Pct of MO Total) Compensation
(Pct of MO Total) Exports
(Pct of MO Total) Wage Per Job
(Pct of MO Avg)
Competitive Fast Growth
$5,043,085,000 (1.62%)
16,760 (0.48%)
$1,220,046,000 (1.23%)
$840,150,000 (4.46%)
$72,795 (254.58%)
Competitive Slow Growth
$5,469,782,000 (1.75%)
27,784 (0.80%)
$853,019,000 (0.86%)
$336,170,000 (1.79%)
$30,702 (107.37%)
Emerging Hyper Growth
$1,230,524,000 (0.39%)
3,290 (0.09%)
$201,968,000 (0.20%)
$250,320,000 (1.33%)
$61,388 (214.69%)
Emerging Fast Growth
$132,301,000 (0.04%)
922 (0.03%)
$34,815,000 (0.03%)
$5,980,000 (0.03%)
$37,760 (132.06%)
Emerging Moderate Growth
$29,593,546,000 (9.49%)
151,102
(4.34%)
$5,015,052,000 (5.04%)
$3,331,990,000 (17.69%)
$33,190 (116.07%)
Emerging Slow Growth
$13,874,813,000 (4.45%)
87,425 (2.51%)
$2,630,292,000 (2.64%)
$3,290,120,000 (17.47%)
$30,086 (105.22%)
TOTAL $55,344,051,000 (17.74%)
287,283 (8.25%)
$9,955,192,000 (10.00%)
$8,054,730,000 (42.77%)
$34,653 (121.19%)
SOURCE: IMPLAN. ANALYSIS: Missouri Economic Research and Information Center (MERIC).
Target Missouri 3 - TM3 11
Missouri Economic Research and Information Center Missouri Department of Economic Development
www.ded.mo.gov
TABLE 4 Missouri's Target Industries
Economic Competitiveness Variables
Industry and Standard Industrial Classification
Out
put
Spe
cial
izat
ion
Ou
tpu
t G
row
th
Pro
du
ctiv
ity
Em
plo
ymen
t S
peci
aliz
atio
n
Em
plo
ymen
t G
row
th
Co
mp
ensa
tio
n
Sp
ecia
lizat
ion
Co
mp
ensa
tio
n
Gro
wth
Exp
ort
S
peci
aliz
atio
n
Exp
ort
G
row
th
Competitive Fast Growth Cluster ++ + + ++ ++ ++ ++ ++ +
Lead and Zinc Ores 1030
Greeting Card Publishing 2770
Agricultural Chemicals, N.E.C 2879
Small Arms Ammunition 3482
Lead and Zinc Ores 1030
Competitive Slow Growth Cluster ++ = = ++ = ++ = ++ =
Grass Seeds 0139
Dog, Cat, and Other Pet Food 2047
Malt Beverages 2082
Macaroni and Spaghetti 2098
Special Product Sawmills, N.E.C 2429
Footwear Cut Stock 3130
Clay Refractories 3255
Lime 3274
Automatic Merchandising Machine 3581

Target Missouri 3 - TM3 12
Missouri Economic Research and Information Center Missouri Department of Economic Development
www.ded.mo.gov
Economic Competitiveness Variables
Industry and Standard Industrial Classification
Out
put
Spe
cial
izat
ion
Ou
tpu
t G
row
th
Pro
du
ctiv
ity
Em
plo
ymen
t S
peci
aliz
atio
n
Em
plo
ymen
t G
row
th
Co
mp
ensa
tio
n
Spe
cial
izat
ion
Co
mp
ensa
tio
n
Gro
wth
Exp
ort
S
peci
aliz
atio
n
Exp
ort
G
row
th
Emerging Hyper Growth Cluster + ++ - + ++ + ++ + ++
Glass Containers 3221
Emerging Fast Growth Cluster + ++ + + ++ + ++ + ++
Soybean Oil Mills 2075
Ammunition, Except For Small Arms, N.E.C. 3483
Machine Tools, Metal Forming Types 3542
Food Products Machinery 3556
Emerging Moderate Growth Cluster + = = + = + = + =
Feed Grains 0110
Hay and Pasture 0110
Dimension Stone 1410 1420
Poultry Processing 2015
Pickles, Sauces, and Salad Dressings 2035
Prepared Feeds, N.E.C 2048
Roasted Coffee 2095
Textile Bags 2393
Pleating and Stitching 2395
Hardwood Dimension and Flooring Mills 2426
Wood Containers 2441 2449

Target Missouri 3 - TM3 13
Missouri Economic Research and Information Center Missouri Department of Economic Development
www.ded.mo.gov
Economic Competitiveness Variables
Industry and Standard Industrial Classification
Out
put
Spe
cial
izat
ion
Ou
tpu
t G
row
th
Pro
du
ctiv
ity
Em
plo
ymen
t S
peci
aliz
atio
n
Em
plo
ymen
t G
row
th
Co
mp
ensa
tio
n
Spe
cial
izat
ion
Co
mp
ensa
tio
n
Gro
wth
Exp
ort
S
peci
aliz
atio
n
Exp
ort
G
row
th
Wood Pallets and Skids 2448
Mattresses and Bedsprings 2515
Metal Partitions and Fixtures 2542
Furniture and Fixtures, N.E.C 2599
Bags, Paper 2674
Sanitary Paper Products 2676
Envelopes 2677
Blankbooks and Looseleaf Binders 2782
Plate Making 2796
Explosives 2892
Paving Mixtures and Blocks 2951
Asphalt Felts and Coatings 2952
Rubber and Plastics Hose and Belting 3052
Leather Tanning and Finishing 3110
Personal Leather Goods 3172
Cement, Hydraulic 3240
Steel Wire and Related Products 3315
Primary Nonferrous Metals, N.E.C. 3339
Miscellaneous Fabricated Wire Products 3495 3496
Internal Combustion Engines, N.E.C. 3519
Welding Apparatus 3548
Blowers and Fans 3564

Target Missouri 3 - TM3 14
Missouri Economic Research and Information Center Missouri Department of Economic Development
www.ded.mo.gov
Economic Competitiveness Variables
Industry and Standard Industrial Classification
Out
put
Spe
cial
izat
ion
Ou
tpu
t G
row
th
Pro
du
ctiv
ity
Em
plo
ymen
t S
peci
aliz
atio
n
Em
plo
ymen
t G
row
th
Co
mp
ensa
tio
n
Spe
cial
izat
ion
Co
mp
ensa
tio
n
Gro
wth
Exp
ort
S
peci
aliz
atio
n
Exp
ort
G
row
th
Refrigeration and Heating Equipment 3585
Transformers 3612
Communications Equipment N.E.C. 3669
Motor Vehicles 3711
Truck Trailers 3715
Boat Building and Repairing 3732
Motorcycles, Bicycles, and Parts 3750
Sporting and Athletic Goods, N.E.C. 3949
Marking Devices 3953
Railroads and Related Services 4010 4740
Water Supply and Sewerage Systems 4940 4952
Commercial Sports Except Racing 7941
Emerging Slow Growth Cluster + = - + = + = + =
Ranch Fed Cattle 0212
Hogs, Pigs and Swine 0213
Oil Bearing Crops 0116 0119
Cheese, Natural and Processed 2022
Condensed and Evaporated Milk 2023
Cereal Preparations 2043
Stationery Products 2678
Polishes and Sanitation Goods 2842
Target Missouri 3 - TM3 15
Missouri Economic Research and Information Center Missouri Department of Economic Development
www.ded.mo.gov
Economic Competitiveness Variables
Industry and Standard Industrial Classification
Out
put
Spe
cial
izat
ion
Ou
tpu
t G
row
th
Pro
du
ctiv
ity
Em
plo
ymen
t S
peci
aliz
atio
n
Em
plo
ymen
t G
row
th
Co
mp
ensa
tio
n
Spe
cial
izat
ion
Co
mp
ensa
tio
n
Gro
wth
Exp
ort
S
peci
aliz
atio
n
Exp
ort
G
row
th
Gum and Wood Chemicals 2861
Shoes, Except Rubber 3143 3144
Leather Gloves and Mittens 3150
Primary Aluminum 3334
Industrial Furnaces and Ovens 3567
Scales and Balances 3596
Motors and Generators 3621
Electric Housewares and Fans 3634
Storage Batteries 3691
Primary Batteries, Dry and Wet 3692
Aircraft 3721
NOTE: High values denoted by ++. Above average values denoted by +. Average values denoted by =. Below average values denoted by -. Low values are denoted by --. SOURCE: IMPLAN. ANALYSIS: Missouri Economic Research and Information Center (MERIC).

Target Missouri 3 - TM3 16
Missouri Economic Research and Information Center Missouri Department of Economic Development
www.ded.mo.gov
SUMMARY AND IMPLICATIONS .
Missouri’s 82 driver industries had a sizable impact on the state's economy, accounting
for 42.8% of total foreign exports, 17.7% of total output, 10.0% of total compensation and
8.3% of total employment. In addition, these driver industries paid an average annual wage
per job of $34,653, which was moderately more that the state average wage per job.
In general, Missouri’s driver industries were concentrated in manufacturing, extractive
industries and agriculture. For example, in manufacturing Missouri had a competitive
advantage in greeting card publishing, automatic merchandising machines, lumber and wood
products (i.e. sawmill products, hardwood floors, wood containers/pallets, and furniture),
ammunition, paper products (i.e. paper bags, paper sanitary products, envelopes, and paper),
and lastly in motor vehicles, which was substantially represented (i.e. motor vehicles, boats,
motorcycles, aircraft, internal combustion engines, motors and generators, fans, and heating
and cooling equipment). In the extractive industries, Missouri had a competitive advantage in
lead mining, clay cricks, lime and stone quarrying, paving and asphalt products, and cement.
Lastly, in agriculture and food products Missouri had a competitive advantage in agricultural
production products (i.e. agricultural chemicals, grass seeds, prepared feeds, feed grains, hay,
cattle, hogs, and oil crops) and in manufactured food products (i.e. pet foods, malt beverages,
pasta products, poultry processing, pickles and sauces, roasted coffee, cheese and condensed
milk, and cereals).
It is hoped that Target Missouri 3 can affect economic development policy by providing
a well conceptualized and empirically based definition of which industries are drivers of a
region’s economy. By using the information provided by TM3, economic development policies
and resources can be directed to the most viable parts of the economy, enhancing the success
of industrial targeting and cluster policies. When targeted industries are identified using
political rather than empirical justifications, development agencies run the risk of investing scare
resources into groups of industries that will produce little to no economic benefits.

Target Missouri 3 - TM3 17
Missouri Economic Research and Information Center Missouri Department of Economic Development
www.ded.mo.gov
STATISTICAL APPENDIX .
IDENTIFYING DRIVER INDUSTRIES
Data and Methods
To identify Missouri's driver industries, a mathematical cluster analysis was used to
group industries based on how economically competitive they are relative to the national
average. Once grouped, multivariate analysis of variance and discriminant function analysis
were used to identify unique characteristics of the clusters and to assess the internal validity of
the groupings. Use of cluster and discriminant analyses follows the work of Hill and Brennan
(2000), who utilized these methods to identify drivers of regional economies.
Data in this analysis was taken from the Minnesota IMPLAN Group who compile cross-
sectional data at the national, state and county level to construct a comprehensive and accurate
database at the county-level that has a consistent structure (MIG, 1999). IMPLAN is used
widely by researchers in industry, government and academia. Since the data is disaggregated
by county, the analysis can be replicated for any combination of counties in Missouri to
approximate economic regions. Nine variables comparing the Missouri industry average to the
national industry average in terms of output, employment, compensation and foreign exports
were used to measure the economic competitiveness of a given industry between 1997 and
2000.
Industry output represents the value of an industry's total production and was derived
from U.S. Bureau of Census (Economic Census), U.S. Bureau of Economic Analysis (output
estimates) and U.S. Bureau of Labor Statistics (projections) data. Industry employment
includes both full-time and part-time workers and is reported as full-time equivalent jobs.
Industry compensation represents total payroll costs, which include wages, salaries, benefits
and non-cash compensation. Industry employment and compensation was derived from U.S.
Bureau of Economic Analysis (REIS) and U.S. Bureau of Labor Statistics (ES-202) data.
Industry foreign exports are demands made for goods and services by consumers and
industries outside the U.S. and was derived from U.S. Bureau of Census (Economic Census) and
U.S. Bureau of Economic Analysis (export estimates) data.
To measure the economic competitiveness of a given industry in Missouri the data was
benchmarked to the national average for that industry. To measure Missouri's economic
competitiveness in a given industry relative to the national industry average in 2000,

Target Missouri 3 - TM3 18
Missouri Economic Research and Information Center Missouri Department of Economic Development
www.ded.mo.gov
specialization in output, employment, compensation and exports were measured using location
quotients. Scores greater than 1.0 indicate that Missouri is relatively more specialized in that
industry relative to the national average, which indicates a comparative advantage or potential
for growth. Scores less than 1.0 indicate that Missouri is relatively less specialized in that
industry relative to the national average, which indicates a comparative disadvantage. The
formula for a location quotient is given in equation (1), where X is the economic variable of
interest, i is the industry, r the region and n the nation.
(1) ( ) ( )ninririr XXXXLQX =
To measure Missouri's growth in a given industry relative to the national industry
average between 1997 and 2000, the difference in growth rates between Missouri and the
United States was calculated for output, employment, compensation and exports. Positive
scores indicate the percentage of regional industry growth above the national average, meaning
that the industry in Missouri is growing faster than the national industry average. Negative
scores indicate the percentage of regional industry growth below the national average, meaning
that the industry in Missouri is growing slower than the national industry average. The formula
used to calculate the difference in growth rates is given in equation (2), where X is the
economic variable of interest, i is the industry, r the region, n the nation and t is time period.
(2) ( )( )( ) ( )( )( )100*XXX100*XXXX 1tin
1tin
tin
1tir
1tir
tirir
−−−− −−−=∆
To measure Missouri's productivity in a given industry relative to the national industry
average in 2000, the ratio of output per worker between Missouri and the United States was
calculated. Scores greater than 1.0 indicate that the industry in Missouri is more productive
than the national average, which indicates a comparative advantage. Scores less than 1.0
indicate that the industry in Missouri is less productive than the national average, which may
indicate a comparative disadvantage. The formula used to calculate the productivity measure is
given in equation (3), where O is output, E is employment, i is the industry, r the region and n
the nation.
(3) ( ) ( )ininiririr EOEOPROD =
--------------------------------------------------------------------------------------------------------------------- Table A1 About Here
---------------------------------------------------------------------------------------------------------------------

Target Missouri 3 - TM3 19
Missouri Economic Research and Information Center Missouri Department of Economic Development
www.ded.mo.gov
Cluster analysis is the generic name for a wide variety of procedures that can be used to
create a classification. These procedures start with data containing information about a sample
of entities and attempts to mathematically reorganize these entities into relatively homogenous
groups. Cluster analytic techniques are used to develop a classification or typology, to
investigate conceptual schema for grouping entities, for hypothesis generation through data
exploration or for hypothesis testing to determine if current typologies are actually present in
the data.
Cluster analysis was used to group 509 industries according to their similarity along nine
economic competitiveness variables. Ward's hierarchical agglomerative cluster method using
the squared Euclidean distance measure was employed in the analysis to group industries into
clusters. Industries are combined into clusters based on a distance matrix between all possible
pairs of industries (Aldenderfer & Blashfield, 1984). At the first stage of the hierarchical
agglomerative method, all industries are considered separate clusters. At the second step, two
of the industries are combined into a single cluster based on the selected clustering method and
the distance matrix is then recomputed using this new cluster. At the third step, either a third
industry is added to the cluster formed in the second stage or two other industries are merged
into a second new cluster, and the distance matrix is then recomputed. At each subsequent
step this process is repeated, where individual industries are added to existing clusters or two
industries are merged to form a new cluster. At the final stage, all industries have been
merged into one cluster.
Squared Euclidean distance is used to measure the distance between clusters and
industries. The formula for the squared Euclidean distance measure is given in equation (4).
Here dij is the distance between industries i and j, and xik is the value of the kth occupational
variable for the ith industry. Two industries or clusters are identical if each one is described by
economic competitiveness variables with the same magnitudes, with the distance being zero.
This distance measure has no upper bounds and is scale-dependent.
(4) ( )2p
1kjkikij XXd ∑ −=
=
Ward's cluster method (Ward, 1963) is designed to optimize the minimum variance
within clusters, with variance being defined using the error sum of squares (ESS). The method
works by joining those industries that result in the minimum increase in the ESS, where the ESS
is zero at the first step of the clustering process when each industry is its own cluster. Ward's

Target Missouri 3 - TM3 20
Missouri Economic Research and Information Center Missouri Department of Economic Development
www.ded.mo.gov
method has a tendency to create clusters of relative equal sizes and shapes as hyperspheres.
The formula for the ESS is given in equation (5), where xi is the distance score of the ith
industry.
(5) ( )2i
2i Xn/1XESS ∑−=
Once industries have been grouped using cluster analysis, the solution was statistically
validated using multivariate analysis of variance (MANOVA) and discriminant function analysis
(DFA). MANOVA is a generalization of ANOVA to a situation where there is more than one
dependent variable. MANOVA tests whether mean differences among groups on a combination
of dependent variables are likely to have occurred by chance. In MANOVA, a new dependent
variable that maximizes group differences is created from a set of dependent variables in order
to separate the groups as much as possible, and then ANOVA is run on the new dependent
variable. In this analysis, MANOVA is used to test if the mean differences among clusters on a
combined economic competitiveness variable are larger than would be expected by chance. If
so, this indicates that the clusters are statistically different from each other in terms of their
scores on the combined economic competitiveness dependent variable, supporting the assertion
that the clusters are distinct entities. If this condition is true, then DFA can be used to predict
cluster membership by taking into account the combination of economic competitiveness
variables as predictors (Tabachnick & Fidell, 1996).
Discriminant function analysis (DFA) is chiefly used to predict group membership from a
set of predictors. Specifically, DFA identifies the linear combination of variables that drive the
classification process. This permits one to more closely examine the meaning of the clusters
from the data, rather than subjectively labeling clusters by industry names. Mathematically,
there is no distinction between the two methods, where DFA is essentially MANOVA turned
around (Tabachnick & Fidell, 1996). In MANOVA, the independent variables are the clusters
and the dependent variables are the economic competitiveness variables, while in DFA the
independent variables are the economic competitiveness variables and the dependent variables
are the clusters. The linear combination of variables – the discriminant function – can be
interpreted like the right side of a regression equation. The coefficients can be used to assess
the degree of strength and direction the function exerts on classification, which can also be
used to classify new industries.
In this analysis, DFA was used to place industries into groups for the purposes of
comparing and validating the cluster solution. The analysis used nine economic

Target Missouri 3 - TM3 21
Missouri Economic Research and Information Center Missouri Department of Economic Development
www.ded.mo.gov
competitiveness variables as independent or predictor variables, and the groupings from the
cluster analysis were the dependent variables. The resulting discriminant functions were used
to gauge the accuracy of the cluster analysis by comparing the percent of industries correctly
classified into the cluster groupings. In addition, the functions were used to describe which
combinations of economic competitiveness variables drove the classification process.
Grouping Industries Into Clusters
According to Aldenderfer and Blashfield (1984), the three main criteria for determining
an appropriate cluster solution are fusion coefficients, Mojena's Stopping Rule and dendograms.
Determination of the appropriate number of clusters is difficult since no single agreed upon
methodology exists, so cluster determination is a subjective process that is based on these
criteria. (Everitt, 1979). The results of the cluster analysis indicated a 13-cluster solution, based
on the available evidence.
Fusion coefficients are an index of the loss of information incurred when merging two
clusters. A large loss of information – a jump in the fusion coefficients – implies that two
relatively dissimilar clusters have been merged, thus the number of clusters prior to the merger
is the most probable cluster solution (Aldenderfer & Blashfield, 1984). There was a significant
loss of information at stage 498 and convention dictates that one takes the prior cluster stage,
which indicated in a 12-cluster solution.
Mojena's Stopping Rule is a method of determining clusters based on the mean and
standard deviation of all fusion coefficients (Mojena, 1977). The Mojena method is a procedure
by which a significant jump in the fusion coefficients can be better defined. The rule states that
a group level or optimal partition of a hierarchical clustering solution was selected that satisfies
the inequality given in equation (6).
(6) αα+ σ+µ>α k1j
Where a is the fusion coefficient at stage j, µ is the mean of the fusion coefficients for all
stages, k is a constant set at 1.25 and s is the standard deviation of the fusion coefficients for
all stages (Milligan & Cooper, 1985). The Mojena value exceeded the fusion coefficient at stage
495 and taking the previous stage this indicated a 15-cluster solution.
Examination of the dendogram indicated the presence of 13 to 14 clusters. Although
dendograms are mainly heuristic devices, it provides an important validation of the cluster
solution. Dendograms also permit the researcher to see where cases and clusters merge
together to get a better understanding of the underlying structure of the data. Additionally, the

Target Missouri 3 - TM3 22
Missouri Economic Research and Information Center Missouri Department of Economic Development
www.ded.mo.gov
cluster solutions obtained using the above mentioned cluster method and distance measure
were compared to other solutions using alternative methods and measures that included
average within-groups linkage using squared Euclidean distance, and centroid method using
squared Euclidean distance. All three methods yielded highly similar cluster solutions, indicating
that there is an inherent structure in the data. All 13 clusters and the industries they are
composed of are listed in Appendix A.
--------------------------------------------------------------------------------------------------------------------- Table A2 About Here
--------------------------------------------------------------------------------------------------------------------- The 13-cluster solution was also statistically validated using a variety of methods.
Results of the MANOVA found that the mean differences across all economic competitiveness
variables were significantly different from each other across the 13 clusters, using the Pillais
Criterion (F(108,4464)=32.91, p<0.000), Hotellings Trace Criterion (F(108,4376)=506.82, p<0.000)
and Wilks Lamba (F(108,3565)=126.82, p<0.000) statistics. Univariate F-tests show that the nine
economic competitiveness variables were significantly different between all 13 clusters at p >
0.000.
Results of the DFA indicated 6 discriminant functions, which correctly classified over
90% of the industries into the groups identified in the cluster analysis. Wilks Lambda measures
the proportion of the total variance in the discriminant scores not explained by differences in
the groups. According to Wilks Lambda, in functions one through four most of the variance is
explained by group differences, indicating that the functions are useful in classifying industries.
By transforming Wilks Lambda into an approximate chi-square distribution, one can test the null
hypothesis that the means of all the economic competitiveness variables across the groups are
equal, which indicates that the function has limited predictive power in classifying industries.
According to the results of the DFA, all six functions were statistically significant at p<0.000,
indicating that they have predictive power in correctly classifying industries. Further, the first
four functions accounted for over almost 100% of the variance in the discriminant scores, with
the first function accounting for slightly more than 70%.
--------------------------------------------------------------------------------------------------------------------- Table A3 About Here
---------------------------------------------------------------------------------------------------------------------

Target Missouri 3 - TM3 23
Missouri Economic Research and Information Center Missouri Department of Economic Development
www.ded.mo.gov
Description of the Clusters
The statistically significant functions were then described according to the size and
direction of the correlations between the economic competitiveness variables and the
standardized canonical discriminant functions. Using a standard employed by Hill and Brennan
(2000), only correlations of r>0.40 were used in describing the functions, regardless of
direction. Results of the DFA identified six discriminant functions that drove the classification
process, which correctly classified 93.9% of all industries into the 13 groups derived from the
cluster analysis. By examining the standardized canonical discriminant functions evaluated at
the cluster means, which are interpreted similar to regression coefficients, one can identify
which functions were statistically significant in classifying industries into the competitive
industry clusters.
--------------------------------------------------------------------------------------------------------------------- Table A4 About Here
---------------------------------------------------------------------------------------------------------------------
The six clusters below were identified as drivers of Missouri's economy based on
economic specialization relative to the national average. This resulted in 82 driver industries
where Missouri had a locational competitive advantage relative to other states. Industries
classified into the competitive fast growth cluster and the competitive slow growth cluster were
highly specialized in output, employment, compensation and foreign exports relative to the
national average (Function 2). Industries classified into the emerging hyper growth cluster had
foreign exports that were growing faster than the national average (Function 1). Industries
classified into the emerging fast growth cluster had output, employment and compensation that
were growing faster than the national average and whose productivity per worker was below
the national average (Function 3). Industries classified into the emerging moderate growth
cluster and the emerging slow growth cluster were highly specialized in output, employment,
compensation and foreign exports relative to the national average (Function 2).
Industries classified into the U.S. average competitiveness cluster had output,
employment and compensation that were growing faster than the national average and whose
productivity per worker was above the national average (Function 4). Industries classified into
the uncompetitive hyper growth cluster and the uncompetitive fast growth cluster had output,
employment and compensation that were growing faster than the national average and whose

Target Missouri 3 - TM3 24
Missouri Economic Research and Information Center Missouri Department of Economic Development
www.ded.mo.gov
productivity per worker was below the national average (Function 3). Industries not classified
into the uncompetitive slow growth cluster were highly specialized in output, employment,
compensation and exports relative to the national average (Function 2).
Industries classified into the non-competitive high productivity cluster had output,
employment and compensation that were growing faster than the national average and whose
productivity per worker was above the national average (Function 4); while industries not
classified into this cluster had output, employment and compensation that were growing faster
than the national average and whose productivity per worker was below the national average
(Function 3). Industries classified into the non-competitive low productivity cluster had output,
employment and compensation that were growing faster than the national average and whose
productivity per worker was below the national average (Function 3); while industries not
classified into this cluster had output, employment and compensation that were growing faster
than the national average and whose productivity per worker was above the national average
(Function 4).
--------------------------------------------------------------------------------------------------------------------- Table A5 About Here
--------------------------------------------------------------------------------------------------------------------- ---------------------------------------------------------------------------------------------------------------------
Table A6 About Here ---------------------------------------------------------------------------------------------------------------------

Target Missouri 3 - TM3 25
Missouri Economic Research and Information Center Missouri Department of Economic Development
www.ded.mo.gov
TABLE A1
Economic Competitiveness Variables for Missouri.
Variable Description Output Specialization Output location quotient, 2000.
Output Growth Difference in output growth rates relative to the national average, 1997-2000. Productivity
Productivity per worker relative to the national average, 2000.
Employment Specialization Employment location quotient, 2000.
Employment Growth Difference in employment growth rates relative to the national average, 1997-2000. Compensation Specialization Compensation location quotient, 2000.
Compensation Growth Difference in compensation growth rates relative to the national average, 1997-
2000. Export Specialization Foreign exports location quotient, 2000.
Export Growth Difference in foreign exports growth rates relative to the national average, 1997-
2000.
NOTE: Data taken from IMPLAN.

Target Missouri 3 - TM3 26
Missouri Economic Research and Information Center Missouri Department of Economic Development
www.ded.mo.gov
TABLE A2
Cluster Analysis Agglomeration Schedule.
Stage Number of
Clusters Fusion
Coefficient
Slope Percent Change in Fusion Coefficient
Acceleration Percent Change in Slope Coefficient
Mojena Value
479 30 1.6120 3.4660 6.7381 3.3435 480 29 1.6680 3.4739 0.2298 3.3435 481 28 1.7260 3.4772 0.0942 3.3435 482 27 1.7880 3.5921 3.3044 3.3435 483 26 1.8560 3.8031 5.8743 3.3435 484 25 1.9290 3.9332 3.4198 3.3435 485 24 2.0100 4.1991 6.7598 3.3435 486 23 2.0910 4.0299 -4.0299 3.3435 487 22 2.2100 5.6911 41.2225 3.3435 488 21 2.3340 5.6109 -1.4092 3.3435 489 20 2.4770 6.1268 9.1958 3.3435 490 19 2.6250 5.9750 -2.4785 3.3435 491 18 2.7730 5.6381 -5.6381 3.3435 492 17 2.9290 5.6257 -0.2203 3.3435 493 16 3.1050 6.0089 6.8116 3.3435 494 15 3.3210 6.9565 15.7708 3.3435 495 14 3.5730 7.5881 9.0786 3.3435 496 13 3.8440 7.5847 -0.0450 3.3435 497 12 4.1610 8.2466 8.7276 3.3435 498 11 4.7270 13.6025 64.9464 3.3435 499 10 5.3210 12.5661 -7.6191 3.3435 500 9 5.9210 11.2761 -10.2660 3.3435 501 8 6.5940 11.3663 0.8003 3.3435 502 7 7.7310 17.2429 51.7021 3.3435 503 6 8.9170 15.3408 -11.0312 3.3435 504 5 10.6100 18.9862 23.7625 3.3435 505 4 12.5090 17.8982 -5.7305 3.3435 506 3 16.1170 28.8432 61.1515 3.3435 507 2 20.0130 24.1732 -16.1910 3.3435 508 1 36.8940 84.3502 248.9404 3.3435
NOTE: Cluster analysis using Ward's Method and squared Euclidean distance.

Target Missouri 3 - TM3 27
Missouri Economic Research and Information Center Missouri Department of Economic Development
www.ded.mo.gov
TABLE A3
Discriminant Function Analysis Diagnostics.
Discriminant Function Wilks
Lamba Chi-Square
Percent Variance Explained
Correlation Coefficient
1: Export Growth Export Growth (fast)
0.000 5706.86*** 71.10 0.961
2: Full Specialization Compensation Specialization (high) Output Specialization (high) Export Specialization (high) Employment Specialization (high)
0.001 3522.82 *** 20.00 0.8950.8720.7810.665
3: Full Growth - Low Productivity Employment Growth (fast) Compensation Growth (fast) Output Growth (fast) Productivity (low)
0.020 1954.40 *** 4.90 0.7220.5800.531
-0.459
4: Full Growth - High Productivity Productivity (high) Employment Growth (fast) Compensation Growth (fast) Output Growth (fast)
0.127 1026.56 *** 3.70 0.7960.5760.5020.462
5: Employment Specialization Employment Specialization (high)
0.657 208.74 *** 0.20 0.603
6: Export Specialization Export Specialization (high)
0.796 113.52 *** 0.10 0.508
NOTE: Correlations between occupational variables and the standardized canonical discriminant functions. * Significant at the 90% confidence level. ** Significant at the 95% confidence level. *** Significant at the 99.9% confidence level.

Target Missouri 3 - TM3 28
Missouri Economic Research and Information Center Missouri Department of Economic Development
www.ded.mo.gov
TABLE A4 Classification of Industries by Cluster and Discriminant Function Analyses.
Predicted Clusters Using Discriminant Function Analysis
Original Clusters Using Cluster Analysis Co
mpe
titive
Fa
st G
rowt
h
Com
petit
ive
Slow
Gro
wth
Emer
ging
Hy
per G
rowt
h
Emer
ging
Fa
st G
rowt
h
Emer
ging
M
oder
ate
Gro
wth
Emer
ging
Sl
ow G
rowt
h
US A
vg
Com
petit
iven
ess
Unco
mpe
titive
Hy
per G
rowt
h
Unco
mpe
titive
Fa
st G
rowt
h
Unco
mpe
titive
Sl
ow G
rowt
h
Unco
mpe
titive
De
clini
ng
Non-
Com
petit
ive
High
Pro
duct
ivity
Non-
Com
petit
ive
Low
Prod
uctiv
ity
Competitive Fast Growth 100.0 0.0 0.0 0.0 0.0 0.0 0.0 0.0 0.0 0.0 0.0 0.0 0.0
Competitive Slow Growth 0.0 100.0 0.0 0.0 0.0 0.0 0.0 0.0 0.0 0.0 0.0 0.0 0.0
Emerging Hyper Growth 0.0 0.0 100.0 0.0 0.0 0.0 0.0 0.0 0.0 0.0 0.0 0.0 0.0
Emerging Fast Growth 0.0 0.0 0.0 100.0 0.0 0.0 0.0 0.0 0.0 0.0 0.0 0.0 0.0
Emerging Moderate Growth 0.0 0.0 0.0 0.0 97.8 2.2 0.0 0.0 0.0 0.0 0.0 0.0 0.0
Emerging Slow Growth 0.0 0.0 0.0 0.0 5.3 94.7 0.0 0.0 0.0 0.0 0.0 0.0 0.0
US Avg Competitiveness 0.0 0.0 0.0 0.0 2.6 0.0 90.5 0.0 0.0 5.8 1.1 0.0 0.0
Uncompetitive Hyper Growth 0.0 0.0 0.0 0.0 0.0 0.0 0.0 100.0 0.0 0.0 0.0 0.0 0.0
Uncompetitive Fast Growth 0.0 0.0 0.0 0.0 0.0 0.0 0.0 0.0 100.0 0.0 0.0 0.0 0.0
Uncompetitive Slow Growth 0.0 0.0 0.0 0.0 0.0 0.0 0.8 0.0 0.8 97.6 0.8 0.0 0.0
Uncompetitive Declining 0.0 0.0 0.0 0.0 0.0 0.0 2.1 0.0 0.0 4.3 85.1 0.0 8.5
Non-Competitive High Productivity 0.0 0.0 0.0 0.0 0.0 0.0 0.0 0.0 0.0 0.0 0.0 100.0 0.0
Non-Competitive Low Productivity 0.0 0.0 0.0 0.0 0.0 0.0 0.0 0.0 1.9 0.0 0.0 0.0 98.1
NOTE: Percentage of industries classified in each cluster. Discriminant function analysis correctly classified 93.9% of industries into the original 13 clusters.

Target Missouri 3 - TM3 29
Missouri Economic Research and Information Center Missouri Department of Economic Development
www.ded.mo.gov
TABLE A5 Association Between Clusters and Discriminant Functions.
Discriminant Functions
Industry Clusters Func
tion
1:
Expo
rt G
rowt
h
Func
tion
2:
Full S
pecia
lizat
ion
Func
tion
3:
Full G
rowt
h Lo
w Pr
oduc
tivity
Func
tion
4:
Full G
rowt
h
High
Pro
duct
ivity
Func
tion
5:
Empl
oym
ent
Spec
ializ
atio
n
Func
tion
6:
Expo
rt Sp
ecia
lizat
ion
Competitive Fast Growth -0.28 2.65*** -0.20 -0.48 -0.54 -0.26
Competitive Slow Growth -0.31 2.65*** -0.56 -0.48 -0.12 -0.32
Emerging Hyper Growth 2.67*** -0.36 -0.33 -0.34 -0.33 -0.33
Emerging Fast Growth -0.54 0.99 1.71* 1.14 -0.95 -0.85
Emerging Moderate Growth -0.58 2.53** -0.66 0.32 -0.19 0.02
Emerging Slow Growth -0.37 2.59*** -0.64 -0.35 0.26 -0.34
US Average Competitiveness -0.44 -0.80 -1.40 1.89* 0.26 -0.94
Uncompetitive Hyper Growth -0.77 -0.39 2.21** 1.15 -0.33 -0.48
Uncompetitive Fast Growth -0.35 -1.28 1.91* 1.34 -0.46 -0.11
Uncompetitive Slow Growth -0.16 -2.44** 0.07 1.18 0.09 0.70
Uncompetitive Declining -0.45 -1.40 -1.42 -0.75 0.64 0.89
Non-Competitive High Productivity 0.07 -0.52 -1.76* 2.14** -0.09 0.17
Non-Competitive Low Productivity -0.12 -0.97 1.94* -1.76* 0.18 0.22
NOTE: z-scores of the canonical discriminant functions evaluated at the cluster means. * Significant at the 90% confidence level. ** Significant at the 95% confidence level. *** Significant at the 99.9% confidence level.

Target Missouri 3 - TM3 30
Missouri Economic Research and Information Center Missouri Department of Economic Development
www.ded.mo.gov
TABLE A6 Industry Clusters in Missouri
Economic Competitiveness Variables
Industry and Standard Industrial Classification
Out
put
Spe
cial
izat
ion
Ou
tpu
t G
row
th
Pro
du
ctiv
ity
Em
plo
ymen
t S
peci
aliz
atio
n
Em
plo
ymen
t G
row
th
Co
mp
ensa
tio
n
Spe
cial
izat
ion
Co
mp
ensa
tio
n
Gro
wth
Exp
ort
S
pec
ializ
atio
n
Exp
ort
G
row
th
Competitive Fast Growth Cluster ++ + + ++ ++ ++ ++ ++ +
Lead and Zinc Ores 1030
Greeting Card Publishing 2770
Agricultural Chemicals, N.E.C 2879
Small Arms Ammunition 3482
Lead and Zinc Ores 1030
Competitive Slow Growth Cluster ++ = = ++ = ++ = ++ =
Grass Seeds 0139
Dog, Cat, and Other Pet Food 2047
Malt Beverages 2082
Macaroni and Spaghetti 2098
Special Product Sawmills, N.E.C 2429
Footwear Cut Stock 3130
Clay Refractories 3255
Lime 3274
Automatic Merchandising Machine 3581

Target Missouri 3 - TM3 31
Missouri Economic Research and Information Center Missouri Department of Economic Development
www.ded.mo.gov
Economic Competitiveness Variables
Industry and Standard Industrial Classification
Out
put
Spe
cial
izat
ion
Ou
tpu
t G
row
th
Pro
du
ctiv
ity
Em
plo
ymen
t S
peci
aliz
atio
n
Em
plo
ymen
t G
row
th
Co
mp
ensa
tio
n
Spe
cial
izat
ion
Co
mp
ensa
tio
n
Gro
wth
Exp
ort
S
peci
aliz
atio
n
Exp
ort
G
row
th
Emerging Hyper Growth Cluster + ++ - + ++ + ++ + ++
Glass Containers 3221
Emerging Fast Growth Cluster + ++ + + ++ + ++ + ++
Soybean Oil Mills 2075
Ammunition, Except For Small Arms, N.E.C. 3483
Machine Tools, Metal Forming Types 3542
Food Products Machinery 3556
Emerging Moderate Growth Cluster + = = + = + = + =
Feed Grains 0110
Hay and Pasture 0110
Dimension Stone 1410 1420
Poultry Processing 2015
Pickles, Sauces, and Salad Dressings 2035
Prepared Feeds, N.E.C 2048
Roasted Coffee 2095
Textile Bags 2393
Pleating and Stitching 2395
Hardwood Dimension and Flooring Mills 2426
Wood Containers 2441 2449

Target Missouri 3 - TM3 32
Missouri Economic Research and Information Center Missouri Department of Economic Development
www.ded.mo.gov
Economic Competitiveness Variables
Industry and Standard Industrial Classification
Out
put
Spe
cial
izat
ion
Ou
tpu
t G
row
th
Pro
du
ctiv
ity
Em
plo
ymen
t S
peci
aliz
atio
n
Em
plo
ymen
t G
row
th
Co
mp
ensa
tio
n
Spe
cial
izat
ion
Co
mp
ensa
tio
n
Gro
wth
Exp
ort
S
peci
aliz
atio
n
Exp
ort
G
row
th
Wood Pallets and Skids 2448
Mattresses and Bedsprings 2515
Metal Partitions and Fixtures 2542
Furniture and Fixtures, N.E.C 2599
Bags, Paper 2674
Sanitary Paper Products 2676
Envelopes 2677
Blankbooks and Looseleaf Binders 2782
Plate Making 2796
Explosives 2892
Paving Mixtures and Blocks 2951
Asphalt Felts and Coatings 2952
Rubber and Plastics Hose and Belting 3052
Leather Tanning and Finishing 3110
Personal Leather Goods 3172
Cement, Hydraulic 3240
Steel Wire and Related Products 3315
Primary Nonferrous Metals, N.E.C. 3339
Miscellaneous Fabricated Wire Products 3495 3496
Internal Combustion Engines, N.E.C. 3519
Welding Apparatus 3548
Blowers and Fans 3564

Target Missouri 3 - TM3 33
Missouri Economic Research and Information Center Missouri Department of Economic Development
www.ded.mo.gov
Economic Competitiveness Variables
Industry and Standard Industrial Classification
Out
put
Spe
cial
izat
ion
Ou
tpu
t G
row
th
Pro
du
ctiv
ity
Em
plo
ymen
t S
peci
aliz
atio
n
Em
plo
ymen
t G
row
th
Co
mp
ensa
tio
n
Spe
cial
izat
ion
Co
mp
ensa
tio
n
Gro
wth
Exp
ort
S
peci
aliz
atio
n
Exp
ort
G
row
th
Refrigeration and Heating Equipment 3585
Transformers 3612
Communications Equipment N.E.C. 3669
Motor Vehicles 3711
Truck Trailers 3715
Boat Building and Repairing 3732
Motorcycles, Bicycles, and Parts 3750
Sporting and Athletic Goods, N.E.C. 3949
Marking Devices 3953
Railroads and Related Services 4010 4740
Water Supply and Sewerage Systems 4940 4952
Commercial Sports Except Racing 7941
Emerging Slow Growth Cluster + = - + = + = + =
Ranch Fed Cattle 0212
Hogs, Pigs and Swine 0213
Oil Bearing Crops 0116 0119
Cheese, Natural and Processed 2022
Condensed and Evaporated Milk 2023
Cereal Preparations 2043
Stationery Products 2678
Polishes and Sanitation Goods 2842

Target Missouri 3 - TM3 34
Missouri Economic Research and Information Center Missouri Department of Economic Development
www.ded.mo.gov
Economic Competitiveness Variables
Industry and Standard Industrial Classification
Out
put
Spe
cial
izat
ion
Ou
tpu
t G
row
th
Pro
du
ctiv
ity
Em
plo
ymen
t S
peci
aliz
atio
n
Em
plo
ymen
t G
row
th
Co
mp
ensa
tio
n
Spe
cial
izat
ion
Co
mp
ensa
tio
n
Gro
wth
Exp
ort
S
peci
aliz
atio
n
Exp
ort
G
row
th
Gum and Wood Chemicals 2861
Shoes, Except Rubber 3143 3144
Leather Gloves and Mittens 3150
Primary Aluminum 3334
Industrial Furnaces and Ovens 3567
Scales and Balances 3596
Motors and Generators 3621
Electric Housewares and Fans 3634
Storage Batteries 3691
Primary Batteries, Dry and Wet 3692
Aircraft 3721
US Average Competitiveness Cluster = = = = = = = - =
Dairy Farm Products 0240
Poultry and Eggs 0250
Range Fed Cattle 0212
Miscellaneous Livestock 0271 0272
Cotton 0131
Food Grains 0110
Forest Products 0181
Landscape and Horticultural Services 0780
New Residential Structures 1500
New Industrial and Commercial Buildings 1500

Target Missouri 3 - TM3 35
Missouri Economic Research and Information Center Missouri Department of Economic Development
www.ded.mo.gov
Economic Competitiveness Variables
Industry and Standard Industrial Classification
Out
put
Spe
cial
izat
ion
Ou
tpu
t G
row
th
Pro
du
ctiv
ity
Em
plo
ymen
t S
peci
aliz
atio
n
Em
plo
ymen
t G
row
th
Co
mp
ensa
tio
n
Spe
cial
izat
ion
Co
mp
ensa
tio
n
Gro
wth
Exp
ort
S
peci
aliz
atio
n
Exp
ort
G
row
th
New Utility Structures 1500
New Highways and Streets 1500
New Government Facilities 1500
Maintenance and Repair, Residential 1500
Maintenance and Repair Other Facilities 1500
Meat Packing Plants 2011
Sausages and Other Prepared Meats 2013
Ice Cream and Frozen Desserts 2024
Frozen Specialties 2038
Flour and Other Grain Mill Products 2041
Bread, Cake, and Related Products 2051 2053
Confectionery Products 2064
Shortening and Cooking Oils 2079
Distilled Liquor, Except Brandy 2085
Bottled and Canned Soft Drinks & Water 2086
Flavoring Extracts and Syrups, N.E.C. 2087
Potato Chips & Similar Snacks 2096
Manufactured Ice 2097
Food Preparations, N.E.C 2099
Apparel Made From Purchased Materials 2310 2320 2330
Curtains and Draperies 2391
Canvas Products 2394
Automotive and Apparel Trimmings 2396

Target Missouri 3 - TM3 36
Missouri Economic Research and Information Center Missouri Department of Economic Development
www.ded.mo.gov
Economic Competitiveness Variables
Industry and Standard Industrial Classification
Out
put
Sp
ecia
lizat
ion
Ou
tpu
t G
row
th
Pro
du
ctiv
ity
Em
plo
ymen
t S
peci
aliz
atio
n
Em
plo
ymen
t G
row
th
Co
mp
ensa
tio
n
Spe
cial
izat
ion
Co
mp
ensa
tio
n
Gro
wth
Exp
ort
S
peci
aliz
atio
n
Exp
ort
G
row
th
Sawmills and Planing Mills, General 2421
Wood Kitchen Cabinets 2434
Structural Wood Members, N.E.C 2439
Wood Preserving 2491
Wood Products, N.E.C 2499
Wood Household Furniture 2511
Upholstered Household Furniture 2512
Public Building Furniture 2530
Wood Partitions and Fixtures 2541
Paperboard Containers and Boxes 2650
Paper Coated & Laminated Packaging 2671
Bags, Plastic 2673
Die-cut Paper and Board 2675
Newspapers 2710
Book Publishing 2731
Book Printing 2732
Miscellaneous Publishing 2740
Commercial Printing 2750
Manifold Business Forms 2760
Bookbinding & Related 2789
Typesetting 2791
Drugs 2830
Soap and Other Detergents 2841

Target Missouri 3 - TM3 37
Missouri Economic Research and Information Center Missouri Department of Economic Development
www.ded.mo.gov
Economic Competitiveness Variables
Industry and Standard Industrial Classification
Out
put
Spe
cial
izat
ion
Ou
tpu
t G
row
th
Pro
du
ctiv
ity
Em
plo
ymen
t S
peci
aliz
atio
n
Em
plo
ymen
t G
row
th
Com
pen
satio
n
Spe
cial
izat
ion
Co
mp
ensa
tio
n
Gro
wth
Exp
ort
S
peci
aliz
atio
n
Exp
ort
G
row
th
Paints and Allied Products 2850
Fertilizers, Mixing Only 2875
Adhesives and Sealants 2891
Printing Ink 2893
Lubricating Oils and Greases 2992
Gaskets, Packing and Sealing Devices 3053
Fabricated Rubber Products, N.E.C. 3060
Miscellaneous Plastics Products 3080
Womens Handbags and Purses 3171
Leather Goods, N.E.C 3190
Vitreous Plumbing Fixtures 3261
Concrete Block and Brick 3271
Concrete Products, N.E.C 3272
Ready-mixed Concrete 3273
Minerals, Ground Or Treated 3295
Steel Pipe and Tubes 3317
Secondary Nonferrous Metals 3340
Copper Rolling and Drawing 3351
Aluminum Rolling and Drawing 3353 3354
Aluminum Foundries 3363 3365
Brass, Bronze, and Copper Foundries 3364 3366
Metal Heat Treating 3398
Metal Cans 3411

Target Missouri 3 - TM3 38
Missouri Economic Research and Information Center Missouri Department of Economic Development
www.ded.mo.gov
Economic Competitiveness Variables
Industry and Standard Industrial Classification
Out
put
Spe
cial
izat
ion
Ou
tpu
t G
row
th
Pro
du
ctiv
ity
Em
plo
ymen
t S
peci
aliz
atio
n
Em
plo
ymen
t G
row
th
Com
pens
atio
n S
peci
aliz
atio
n
Co
mp
ensa
tio
n
Gro
wth
Exp
ort
S
peci
aliz
atio
n
Exp
ort
G
row
th
Metal Barrels, Drums and Pails 3412
Hand Saws and Saw Blades 3425
Fabricated Structural Metal 3441
Metal Doors, Sash, and Trim 3442
Fabricated Plate Work (Boiler Shops) 3443
Sheet Metal Work 3444
Architectural Metal Work 3446
Prefabricated Metal Buildings 3448
Screw Machine Products and Bolts, Etc. 3450
Nonferrous Forgings 3463
Metal Stampings, N.E.C. 3469
Plating and Polishing 3471
Metal Coating and Allied Services 3479
Industrial and Fluid Valves 3491 3492
Pipe, Valves, and Pipe Fittings 3494 3498
Farm Machinery and Equipment 3523
Mining Machinery, Except Oil Field 3532
Conveyors and Conveying Equipment 3535
Machine Tools, Metal Cutting Types 3541
Special Dies and Tools and Accessories 3544 3545
Woodworking Machinery 3553
Printing Trades Machinery 3555
General Industrial Machinery, N.E.C 3569

Target Missouri 3 - TM3 39
Missouri Economic Research and Information Center Missouri Department of Economic Development
www.ded.mo.gov
Economic Competitiveness Variables
Industry and Standard Industrial Classification
Out
put
Sp
ecia
lizat
ion
Ou
tpu
t G
row
th
Pro
du
ctiv
ity
Em
plo
ymen
t S
peci
aliz
atio
n
Em
plo
ymen
t G
row
th
Co
mp
ensa
tio
n
Spe
cial
izat
ion
Co
mp
ensa
tio
n
Gro
wth
Exp
ort
S
peci
aliz
atio
n
Exp
ort
G
row
th
Measuring and Dispensing Pumps 3586
Service Industry Machines, N.E.C. 3589
Carburetors, Pistons, Rings, Valves 3592
Switchgear and Switchboard Apparatus 3613
Electrical Industrial Apparatus, N.E.C. 3629
Electric Lamps 3641
Wiring Devices 3643 3644
Lighting Fixtures and Equipment 3645 3646
Electronic Components, N.E.C. 3675 3676
Truck and Bus Bodies 3713
Motor Vehicle Parts and Accessories 3714
Railroad Equipment 3740
Transportation Equipment, N.E.C 3799
Laboratory Apparatus & Furniture 3821
Automatic Temperature Controls 3822
Surgical and Medical Instrument 3841
Games, Toys, and Childrens Vehicles 3944
Pens and Mechanical Pencils 3951
Lead Pencils and Art Goods 3952
Signs and Advertising Displays 3993
Burial Caskets and Vaults 3995
Manufacturing Industries, N.E.C. 3999
Local, Interurban Passenger Transit 4100

Target Missouri 3 - TM3 40
Missouri Economic Research and Information Center Missouri Department of Economic Development
www.ded.mo.gov
Economic Competitiveness Variables
Industry and Standard Industrial Classification
Out
put
Spe
cial
izat
ion
Ou
tpu
t G
row
th
Pro
du
ctiv
ity
Em
plo
ymen
t S
peci
aliz
atio
n
Em
plo
ymen
t G
row
th
Co
mp
ensa
tio
n
Spe
cial
izat
ion
Co
mp
ensa
tio
n
Gro
wth
Exp
ort
S
peci
aliz
atio
n
Exp
ort
G
row
th
Motor Freight Transport and Warehousing 4200
Air Transportation 4500
Arrangement Of Passenger Transportation 4720
Transportation Services 4730 4783
Communications, Except Radio and TV 4810 4820 4840
Radio and TV Broadcasting 4830
Electric Services 4910
Gas Production and Distribution 4920
Sanitary Services and Steam Supply 4953 4959 4960
Wholesale Trade 5000 5100
Building Materials & Gardening 5200
General Merchandise Stores 5300
Food Stores 5400
Automotive Dealers & Service Stations 5500
Apparel & Accessory Stores 5600
Furniture & Home Furnishings Stores 5700
Eating & Drinking 5800
Miscellaneous Retail 5900
Banking 6000
Credit Agencies 6100 6710 6720
Security and Commodity Brokers 6200
Insurance Carriers 6300
Insurance Agents and Brokers 6400

Target Missouri 3 - TM3 41
Missouri Economic Research and Information Center Missouri Department of Economic Development
www.ded.mo.gov
Economic Competitiveness Variables
Industry and Standard Industrial Classification
Out
put
Spe
cial
izat
ion
Ou
tpu
t G
row
th
Pro
du
ctiv
ity
Em
plo
ymen
t S
peci
aliz
atio
n
Em
plo
ymen
t G
row
th
Co
mp
ensa
tio
n
Spe
cial
izat
ion
Co
mp
ensa
tio
n
Gro
wth
Exp
ort
S
peci
aliz
atio
n
Exp
ort
G
row
th
Real Estate 6500
Hotels and Lodging Places 7000
Laundry, Cleaning and Shoe Repair 7210 7250
Portrait and Photographic Studios 7220
Beauty and Barber Shops 7230 7240
Funeral Service and Crematories 7260
Miscellaneous Personal Services 7290
Advertising 7310
Other Business Services 7320 7331
Photofinishing, Commercial Photography 7334 7335
Services To Buildings 7340
Equipment Rental and Leasing 7350
Personnel Supply Services 7360
Computer and Data Processing Services 7370
Detective and Protective Services 7381 7382
Automobile Rental and Leasing 7510
Automobile Parking and Car Wash 7520 7542
Automobile Repair and Services 7530 7549
Electrical Repair Service 7620
Watch, Clock, Jewelry and Furniture Repair 7630 7640
Miscellaneous Repair Shops 7690
Theatrical Producers, Bands Etc. 7920
Bowling Alleys and Pool Halls 7930

Target Missouri 3 - TM3 42
Missouri Economic Research and Information Center Missouri Department of Economic Development
www.ded.mo.gov
Economic Competitiveness Variables
Industry and Standard Industrial Classification
Out
put
Spe
cial
izat
ion
Ou
tpu
t G
row
th
Pro
du
ctiv
ity
Em
plo
ymen
t S
peci
aliz
atio
n
Em
plo
ymen
t G
row
th
Co
mp
ensa
tio
n
Spe
cial
izat
ion
Co
mp
ensa
tio
n
Gro
wth
Exp
ort
S
peci
aliz
atio
n
Exp
ort
G
row
th
Amusement and Recreation Services, N.E.C. 7910 7990
Membership Sports and Recreation Clubs 7997
Doctors and Dentists 8010 8020
Nursing and Protective Care 8050
Hospitals 8060
Other Medical and Health Services 8070
Legal Services 8110
Colleges, Universities, Schools 8220
Other Educational Services 8230 8240 8290
Job Trainings & Related Services 8330
Child Day Care Services 8350
Social Services, N.E.C. 8320 8390
Residential Care 8360
Other Nonprofit Organizations 8400 8650 8690
Business Associations 8610 8620
Labor and Civic Organizations 8630 8640
Engineering, Architectural Services 8710
Accounting, Auditing and Bookkeeping 8720 8990
Dairy Farm Products 0240

Target Missouri 3 - TM3 43
Missouri Economic Research and Information Center Missouri Department of Economic Development
www.ded.mo.gov
Economic Competitiveness Variables
Industry and Standard Industrial Classification
Out
put
Spe
cial
izat
ion
Ou
tpu
t G
row
th
Pro
du
ctiv
ity
Em
plo
ymen
t S
peci
aliz
atio
n
Em
plo
ymen
t G
row
th
Co
mp
ensa
tio
n
Spe
cial
izat
ion
Co
mp
ensa
tion
G
row
th
Exp
ort
S
peci
aliz
atio
n
Exp
ort
G
row
th
Uncompetitive Hyper Growth Cluster - ++ - - ++ -- ++ -- ++
Steel Springs, Except Wire 3493
Lawn and Garden Equipment 3524
Uncompetitive Fast Growth Cluster -- ++ = -- ++ -- ++ -- ++
Carpets and Rugs 2270
Coated Fabrics, Not Rubberized 2295
Fabricated Textile Products, N.E.C. 2399
Metal Household Furniture 2514
Converted Paper Products, N.E.C 2679
Petroleum and Coal Products, N.E.C. 2999
Luggage 3160
Nonferrous Rolling and Drawing, N.E.C. 3356
Fluid Power Cylinders & Actuators 3593
Fluid Power Pumps & Motors 3594
Analytical Instruments 3826
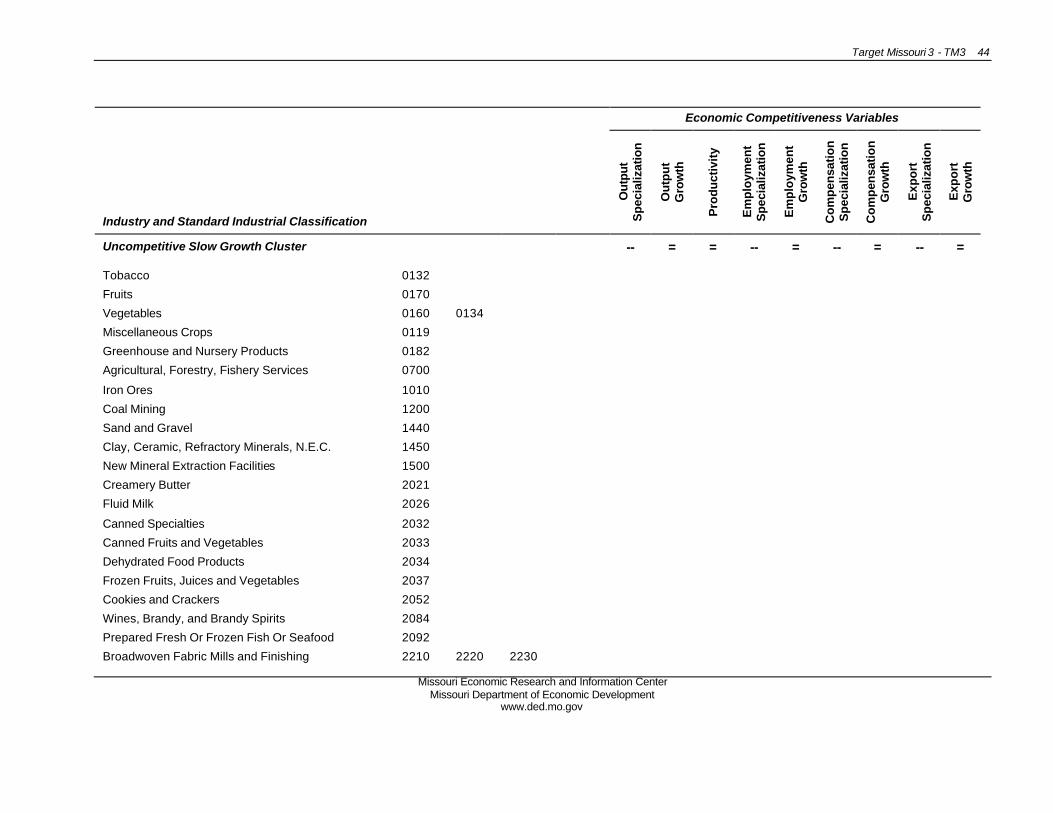
Target Missouri 3 - TM3 44
Missouri Economic Research and Information Center Missouri Department of Economic Development
www.ded.mo.gov
Economic Competitiveness Variables
Industry and Standard Industrial Classification
Out
put
Spe
cial
izat
ion
Ou
tpu
t G
row
th
Pro
du
ctiv
ity
Em
plo
ymen
t S
peci
aliz
atio
n
Em
plo
ymen
t G
row
th
Co
mp
ensa
tio
n
Spe
cial
izat
ion
Co
mp
ensa
tio
n
Gro
wth
Exp
ort
Spe
cial
izat
ion
Exp
ort
G
row
th
Uncompetitive Slow Growth Cluster -- = = -- = -- = -- =
Tobacco 0132
Fruits 0170
Vegetables 0160 0134
Miscellaneous Crops 0119
Greenhouse and Nursery Products 0182
Agricultural, Forestry, Fishery Services 0700
Iron Ores 1010
Coal Mining 1200
Sand and Gravel 1440
Clay, Ceramic, Refractory Minerals, N.E.C. 1450
New Mineral Extraction Facilities 1500
Creamery Butter 2021
Fluid Milk 2026
Canned Specialties 2032
Canned Fruits and Vegetables 2033
Dehydrated Food Products 2034
Frozen Fruits, Juices and Vegetables 2037
Cookies and Crackers 2052
Wines, Brandy, and Brandy Spirits 2084
Prepared Fresh Or Frozen Fish Or Seafood 2092
Broadwoven Fabric Mills and Finishing 2210 2220 2230

Target Missouri 3 - TM3 45
Missouri Economic Research and Information Center Missouri Department of Economic Development
www.ded.mo.gov
Economic Competitiveness Variables
Industry and Standard Industrial Classification
Out
put
Spe
cial
izat
ion
Ou
tpu
t G
row
th
Pro
du
ctiv
ity
Em
plo
ymen
t S
peci
aliz
atio
n
Em
plo
ymen
t G
row
th
Co
mp
ensa
tio
n
Spe
cial
izat
ion
Co
mp
ensa
tio
n
Gro
wth
Exp
ort
S
peci
aliz
atio
n
Exp
ort
G
row
th
Narrow Fabric Mills 2240
Knit Outerwear Mills 2253
Yarn Mills and Finishing Of Textiles, N.E.C. 2269 2281
Textile Goods, N.E.C 2299
Logging Camps and Logging Contractors 2410
Millwork 2431
Veneer and Plywood 2435 2436
Mobile Homes 2451
Prefabricated Wood Buildings 2452
Reconstituted Wood Products 2493
Household Furniture, N.E.C 2519
Wood Office Furniture 2521
Blinds, Shades, and Drapery Hardware 2591
Pulp Mills 2610
Paper Mills, Except Building Paper 2620
Paperboard Mills 2630
Periodicals 2720
Industrial Gases 2813
Inorganic Pigments 2816
Inorganic Chemicals Nec. 2819
Plastics Materials and Resins 2821
Synthetic Rubber 2822
Surface Active Agents 2843

Target Missouri 3 - TM3 46
Missouri Economic Research and Information Center Missouri Department of Economic Development
www.ded.mo.gov
Economic Competitiveness Variables
Industry and Standard Industrial Classification
Out
put
Spe
cial
izat
ion
Ou
tpu
t G
row
th
Pro
du
ctiv
ity
Em
plo
ymen
t S
peci
aliz
atio
n
Em
plo
ymen
t G
row
th
Co
mp
ensa
tio
n
Spe
cial
izat
ion
Co
mp
ensa
tio
n
Gro
wth
Exp
ort
S
peci
aliz
atio
n
Exp
ort
G
row
th
Toilet Preparations 2844
Tires and Inner Tubes 3010
Rubber and Plastics Footwear 3020
Brick and Structural Clay Tile 3251
Ceramic Wall and Floor Tile 3253
Structural Clay Products, N.E.C 3259
Fine Earthenware Food Utensils 3263
Porcelain Electrical Supplies 3264
Pottery Products, N.E.C 3269
Cut Stone and Stone Products 3280
Abrasive Products 3291
Mineral Wool 3296
Nonclay Refractories 3297
Blast Furnaces and Steel Mills 3312
Cold Finishing Of Steel Shapes 3316
Iron and Steel Foundries 3320
Primary Copper 3331
Nonferrous Castings, N.E.C. 3369
Hand and Edge Tools, N.E.C. 3423
Metal Sanitary Ware 3431
Plumbing Fixture Fittings and Trim 3432
Heating Equipment, Except Electric 3433
Miscellaneous Metal Work 3449

Target Missouri 3 - TM3 47
Missouri Economic Research and Information Center Missouri Department of Economic Development
www.ded.mo.gov
Economic Competitiveness Variables
Industry and Standard Industrial Classification
Out
put
Spe
cial
izat
ion
Ou
tpu
t G
row
th
Pro
du
ctiv
ity
Em
plo
ymen
t S
peci
aliz
atio
n
Em
plo
ymen
t G
row
th
Co
mp
ensa
tio
n
Spe
cial
izat
ion
Co
mp
ensa
tio
n
Gro
wth
Exp
ort
S
peci
aliz
atio
n
Exp
ort
G
row
th
Iron and Steel Forgings 3462
Automotive Stampings 3465
Crowns and Closures 3466
Metal Foil and Leaf 3497
Fabricated Metal Products, N.E.C. 3499
Steam Engines and Turbines 3511
Construction Machinery and Equipment 3531
Oil Field Machinery 3533
Elevators and Moving Stairways 3534
Hoists, Cranes, and Monorails 3536
Industrial Trucks and Tractors 3537
Industrial Patterns 3543
Textile Machinery 3552
Paper Industries Machinery 3554
Special Industry Machinery N.E.C. 3559
Pumps and Compressors 3561 3563
Ball and Roller Bearings 3562
Packaging Machinery 3565
Power Transmission Equipment 3566 3568
Electronic Computers 3571
Commercial Laundry Equipment 3582
Industrial Machines N.E.C. 3599
Carbon and Graphite Products 3624

Target Missouri 3 - TM3 48
Missouri Economic Research and Information Center Missouri Department of Economic Development
www.ded.mo.gov
Economic Competitiveness Variables
Industry and Standard Industrial Classification
Out
put
Spe
cial
izat
ion
Ou
tpu
t G
row
th
Pro
du
ctiv
ity
Em
plo
ymen
t S
peci
aliz
atio
n
Em
plo
ymen
t G
row
th
Co
mp
ensa
tio
n
Spe
cial
izat
ion
Co
mp
ensa
tio
n
Gro
wth
Exp
ort
S
peci
aliz
atio
n
Exp
ort
G
row
th
Relays & Industrial Controls 3625
Household Vacuum Cleaners 3635
Phonograph Records and Tape 3652
Radio and Tv Communication Equipment 3663
Printed Circuit Boards 3672
Semiconductors and Related Devices 3674
Engine Electrical Equipment 3694
Magnetic & Optical Recording Media 3695
Electrical Equipment, N.E.C. 3699
Aircraft and Missile Engines and Parts 3724 3764
Aircraft and Missile Equipment, 3728 3769
Ship Building and Repairing 3731
Complete Guided Missiles 3761
Travel Trailers and Camper 3792
Mechanical Measuring Devices 3823 3824
Instruments To Measure Electricity 3825
Optical Instruments & Lenses 3827
Surgical Appliances and Supplies 3842
Dental Equipment and Supplies 3843
X-Ray Apparatus 3844
Ophthalmic Goods 3850
Jewelry, Precious Metal 3911
Silverware and Plated Ware 3914

Target Missouri 3 - TM3 49
Missouri Economic Research and Information Center Missouri Department of Economic Development
www.ded.mo.gov
Economic Competitiveness Variables
Industry and Standard Industrial Classification
Out
put
Spe
cial
izat
ion
Ou
tpu
t G
row
th
Pro
du
ctiv
ity
Em
plo
ymen
t S
peci
aliz
atio
n
Em
plo
ymen
t G
row
th
Co
mp
ensa
tio
n
Spe
cial
izat
ion
Co
mp
ensa
tio
n
Gro
wth
Exp
ort
S
peci
aliz
atio
n
Exp
ort
G
row
th
Musical Instruments 3930
Carbon Paper and Inked Ribbons 3955
Brooms and Brushes 3991
Water Transportation 4400
Pipe Lines, Except Natural Gas 4600
Motion Pictures 7800
Elementary and Secondary Schools 8210
Religious Organizations 8660
Management and Consulting Services 8740
Research, Development & Testing Services 8730
Uncompetitive Declining Cluster -- -- - -- -- -- -- -- --
Tree Nuts 0173
Metal Mining Services 1080
Nonmetallic Minerals (Except Fuels) Service 1480
Misc. Nonmetallic Minerals, N.E.C. 1490
Blended and Prepared Flour 2045
Wet Corn Milling 2046
Sugar 2061 2062 2063
Chocolate and Cocoa Products 2066
Salted and Roasted Nuts & Seeds 2068
Cottonseed Oil Mills 2074
Animal and Marine Fats and Oils 2077

Target Missouri 3 - TM3 50
Missouri Economic Research and Information Center Missouri Department of Economic Development
www.ded.mo.gov
Economic Competitiveness Variables
Industry and Standard Industrial Classification
Out
put
Spe
cial
izat
ion
Ou
tpu
t G
row
th
Pro
du
ctiv
ity
Em
plo
ymen
t S
peci
aliz
atio
n
Em
plo
ymen
t G
row
th
Co
mp
ensa
tio
n
Spe
cial
izat
ion
Co
mp
ensa
tio
n
Gro
wth
Exp
ort
S
peci
aliz
atio
n
Exp
ort
G
row
th
Chewing and Smoking Tobacco 2130
Tire Cord and Fabric 2296
Nonwoven Fabrics 2297
Housefurnishings, N.E.C 2392
Wood Tv and Radio Cabinets 2517
Metal Office Furniture 2522
Paper Coated & Laminated N.E.C. 2672
Cyclic Crudes, Interm. & Indus. Organic Chem. 2865 2869
Nitrogenous and Phosphatic Fertilizers 2873 2874
Chemical Preparations, N.E.C 2899
Glass and Glass Products, Exc Containers 3210 3229 3230
Gypsum Products 3275
Nonmetallic Mineral Products, N.E.C. 3299
Nonferrous Wire Drawing and Insulating 3357
Cutlery 3421
Hardware, N.E.C. 3429
Small Arms 3484
Power Driven Hand Tools 3546
Rolling Mill Machinery 3547
Metalworking Machinery, N.E.C. 3549
Computer Storage Devices 3572
Computer Terminals 3575
Computer Peripheral Equipment, 3577

Target Missouri 3 - TM3 51
Missouri Economic Research and Information Center Missouri Department of Economic Development
www.ded.mo.gov
Economic Competitiveness Variables
Industry and Standard Industrial Classification
Out
put
Spe
cial
izat
ion
Ou
tpu
t G
row
th
Pro
du
ctiv
ity
Em
plo
ymen
t S
peci
aliz
atio
n
Em
plo
ymen
t G
row
th
Co
mp
ensa
tio
n
Spe
cial
izat
ion
Co
mp
ensa
tio
n
Gro
wth
Exp
ort
S
peci
aliz
atio
n
Exp
ort
Gro
wth
Calculating and Accounting Machines 3578
Typewriters and Office Machines N.E.C. 3579
Household Cooking Equipment 3631
Household Laundry Equipment 3633
Household Appliances, N.E.C. 3639
Radio and TV Receiving Sets 3651
Telephone and Telegraph Apparatus 3661
Motor Homes 3716
Search & Navigation Equipment 3812
Electromedical Apparatus 3845
Photographic Equipment and Supplies 3860
Watches, Clocks, and Parts 3870
Costume Jewelery 3961
Non-Competitive High Productivity Cluster -- = ++ -- - -- + -- =
Other Meat Animal Products 0219
Non-Competitive Low Productivity Cluster -- = -- -- = -- = -- =
Cattle Feedlots 0211
Sheep, Lambs and Goats 0214
Sugar Crops 0133
Forestry Products 0810 0830

Target Missouri 3 - TM3 52
Missouri Economic Research and Information Center Missouri Department of Economic Development
www.ded.mo.gov
Economic Competitiveness Variables
Industry and Standard Industrial Classification
Out
put
Spe
cial
izat
ion
Ou
tpu
t G
row
th
Pro
du
ctiv
ity
Em
plo
ymen
t S
peci
aliz
atio
n
Em
plo
ymen
t G
row
th
Co
mp
ensa
tio
n
Spe
cial
izat
ion
Co
mp
ensa
tio
n
Gro
wth
Exp
ort
S
peci
aliz
atio
n
Exp
ort
G
row
th
Commercial Fishing 0910
Copper Ores 1020
Gold Ores 1041
Silver Ores 1044
Ferroalloy Ores, Except Vanadium 1060
Uranium -radium -vanadium Ores 1094
Metal Ores, Not Elswhere Classified 1099
Natural Gas & Crude Petroleum 1310
Natural Gas Liquids 1320
Potash, Soda, and Borate Minerals 1474
Phosphate Rock 1475
Chemical, Fertilizer Mineral Mininig, N.E.C. 1479
New Farm Structures 1500
Maintenance and Repair Oil and Gas Wells 1380
Rice Milling 2044
Chewing Gum 2067
Vegetable Oil Mills, N.E.C 2076
Malt 2083
Canned and Cured Sea Foods 2091
Cigarettes 2110
Cigars 2120
Tobacco Stemming and Redrying 2140

Target Missouri 3 - TM3 53
Missouri Economic Research and Information Center Missouri Department of Economic Development
www.ded.mo.gov
Economic Competitiveness Variables
Industry and Standard Industrial Classification
Out
put
Spe
cial
izat
ion
Ou
tpu
t G
row
th
Pro
du
ctiv
ity
Em
plo
ymen
t S
peci
aliz
atio
n
Em
plo
ymen
t G
row
th
Com
pens
atio
n S
peci
aliz
atio
n
Co
mp
ensa
tio
n
Gro
wth
Exp
ort
S
peci
aliz
atio
n
Exp
ort
G
row
th
Womens Hosiery, Except Socks 2251
Hosiery, N.E.C 2252
Knit Underwear Mills 2254
Knit Fabric Mills 2257 2258
Knitting Mills , N.E.C. 2259
Thread Mills 2284
Cordage and Twine 2298
Schiffi Machine Embroideries 2397
Alkalies & Chlorine 2812
Cellulosic Man-made Fibers 2823
Organic Fibers, Noncellulosic 2824
Carbon Black 2895
Petroleum Refining 2910
House Slippers 3142
Vitreous China Food Utensils 3262
Asbestos Products 3292
Electrometallurgical Products 3313
Primary Metal Products, N.E.C 3399
Other Ordnance and Accessories 3489
Household Refrigerators and Freezers 3632
Electron Tubes 3671
Tanks and Tank Components 3795

Target Missouri 3 - TM3 54
Missouri Economic Research and Information Center Missouri Department of Economic Development
www.ded.mo.gov
Economic Competitiveness Variables
Industry and Standard Industrial Classification
Out
put
Spe
cial
izat
ion
Ou
tpu
t G
row
th
Pro
du
ctiv
ity
Em
plo
ymen
t S
peci
aliz
atio
n
Em
plo
ymen
t G
row
th
Co
mp
ensa
tio
n
Spe
cial
izat
ion
Co
mp
ensa
tio
n
Gro
wth
Exp
ort
S
peci
aliz
atio
n
Exp
ort
G
row
th
Jewelers Materials and Lapidary Work 3915
Dolls 3942
Fasteners, Buttons, Needles, Pins 3965
Hard Surface Floor Coverings 3996
Owner-occupied Dwellings 9999
Racing and Track Operation 7948
NOTE: High values denoted by ++. Above average values denoted by +. Average values denoted by =. Below average values denoted by -. Low values are denoted by --. SOURCE: IMPLAN. ANALYSIS: Missouri Economic Research and Information Center (MERIC).

Target Missouri 3 - TM3 55
Missouri Economic Research and Information Center Missouri Department of Economic Development
www.ded.mo.gov
ABOUT MERIC AT THE MISSOURI DEPARTMENT OF ECONOMIC DEVELOPMENT . The Missouri Economic Research and Information Center (MERIC) at the Missouri Department of Economic Development provides comprehensive analysis of Missouri's socioeconomic environment at the local, regional and state levels. To achieve this, MERIC employs a wide array of analysis tools, which include econometric models, geographic information systems and advanced statistical methods. On-going projects at MERIC include targeted development, economic and social impact assessments, industry and occupational analyses, layoff analyses, and information on Missouri's demographic and economic trends. Coupled with its analysis capability, MERIC is also the U.S. Department of Labor affiliate that maintains a comprehensive labor market database for Missouri. MERIC has current information on employment/unemployment, occupations, wages, layoffs, labor availability, and a variety of other information designed to help understand labor market conditions. In addition, MERIC has developed an outreach infrastructure which includes a comprehensive web site, e-mail distribution list and monthly newsletter. MERIC's mission is to provide value-added research with a customer focus, which means offering accurate, relevant and timely information to decision makers and the public to facilitate a better understanding of Missouri's socioeconomic environment. Ultimately, MERIC and the rest of the Department of Economic Development strive to make Missouri the best place to live, work, vacation and conduct business.
http://www.ded.mo.gov
Principal Investigator
David J. Peters
580 Harry S Truman Building PO Box 3150
Jefferson City, MO 65102-3150
PHONE 573-751-3595 ? FAX 573-751-8385 [email protected]