target date funds - sun life financial
TRANSCRIPT

I N S T I T U T I O N A L
INSTITUTIONAL USE ONLY
Anne Meloche FSA, FCIAHead of Institutional Business
James Wells CIM®Director, Institutional Business Development and Client Relationships
In collaboration with the Portfolio Management Team SLGI Asset Management Inc.
January 2021
TARGET DATE FUNDS FOR CAPITAL ACCUMULATION PLANS
Design and portfolio construction considerations for the new decade

2
Target Date Funds for Capital Accumulation Plans: design and portfolio construction considerations for the new decadeSLGI Asset Management Inc. (SLGI) is a member of the Sun Life group of companies and manages over $30 billion of client assets, including more than $20 billion in multi-asset solutions1. With Granite, its flagship Target Date solution, SLGI is the largest provider of actively managed Target Date Funds in Canada.2
Executive summaryThe Canadian market for Capital Accumulation Plans (CAPs) is growing rapidly as workplace demographics shift between the generations. Older employees covered by Defined Benefit (DB) plans are retiring, while new hires more frequently participate in CAPs. As Target Date Funds (TDFs) have become the default choice for an increasing number of CAP members, the success or failure of TDFs is likely to play a growing role in the retirement prospects of millions of Canadians for decades to come. This paper looks at some of the key considerations for plan sponsors in selecting and overseeing these investment vehicles as they strive to meet the retirement savings needs of plan members in a changing investment environment.
During the final stages of drafting this paper, a global health and economic crisis was unfolding: the COVID-19 pandemic. Events on this scale challenge nearly every type of economic activity, including the management of CAPs. These uncertain economic and financial times provide a revealing perspective on the main theme of this paper: building resilient TDF portfolios that can effectively evolve over time and offer multiple return drivers to help CAP members navigate their way to and through retirement.
1 Data as at June 30, 2020 2 Measured by assets. Source: Strategic Insight, Group Retirement Savings and Pensions Report - Canada, Q1 2020 Update.

3
ContentsINTRODUCTION
Necessary evolution in CAP portfolios design now underway
SECTION 1
Spanning the investment opportunity set - asset class diversification1.1 The need to pursue higher risk-adjusted returns1.2 The shift toward non-traditional equity asset classes1.3 Specialty fixed income may increase yield potential1.4 Wide breadth of specialty asset classes can provide additional benefits1.5 Identifying a TDF’s investable universe1.6 TDF solutions need to evolve
SECTION 2
The optimal mix: deciding the weight of each asset class2.1 Optimizing anticipated risk-adjusted returns2.2 Liquidity: finding the right balance2.3 Specialty asset classes in TDFs
SECTION 3
Glidepath: improving design through ongoing research3.1 What is a glidepath?3.2 Modelling the glidepath3.3 “To” vs. “through” glidepaths3.4 Beware: glidepaths don’t tell the whole story
SECTION 4
Selecting underlying investment strategies4.1 Open architecture4.2 Why choose between active or passive when you can use both?
SECTION 5
Ongoing portfolio overview is key5.1 Continued monitoring and enhancements5.2 Rebalancing strategy and tactical asset allocation
Conclusion
Important information
4
Capital Accumulation Plan (CAP) investment managers around the world are growing in scale and adding capabilities. For the first time, Defined Contribution (DC) pension assets in the largest pension markets (Australia, Canada, Japan, Netherlands, Switzerland, U.K. and U.S.)3 have in aggregate caught up in size to Defined Benefit (DB) pension assets. Over the past 10 years, the rate of growth in DC assets in these countries has been close to double (8.9%) that of DB assets (4.6%).4 Although DB plans still make up the majority of pension assets in Canada (88%)5 the growth trend is favouring DC plans over DB plans, with a projected compound annual growth rate of 7.8% (vs. 3.7% for DB plans).6
The Canadian retirement industry has faced numerous challenges in recent years, with steep global financial and economic crises and low interest rates dampening investment returns, while average life-expectancy is increasing. Whereas such risks are borne by plan sponsors for most DB plans, CAP members bear all these risks and are particularly challenged by relatively static CAP design (contribution levels) and a lack of personal savings. Two recent whitepapers7 published by the World Economic Forum highlight that most individuals are simply not saving enough, estimating the size of the retirement savings gap in Canada to be $3 trillion in 2015, and forecasted to reach $13 trillion by 2050. Given these challenges, all components of CAP, including investments, need to work harder to help plan members close their retirement gap.
As the Canadian CAP market continues to grow in size, CAP plan sponsors are faced with a diverse set of solution providers and an ongoing evolution in investment portfolio design. In this paper, we explore important features that CAP sponsors should consider as they strive to meet the evolving retirement savings needs of plan members in a changing investment environment.
INTRODUCTION Necessary evolution in CAP portfolios design now underway
During the completion of this paper, the COVID-19 pandemic was unfolding across the globe. In the first quarter of 2020, the CBOE Volatility Index (the “VIX”), which began the year at 12.5, hit a peak of 82.7 on March 16. Economies were entering a period of profound uncertainty as governments around the globe instituted measures to limit the virus spread. At the same time, authorities were unleashing unprecedented fiscal and monetary stimulus. While we believe that Canadian investors should consider a broad set of return drivers to achieve their long-term objectives, the economic disruption caused by the COVID-19 pandemic illustrates why multiple investment levers can be beneficial when managing portfolios through rapidly changing market conditions.
Target Date Funds are growing in popularityWithin CAPs, TDFs are gaining an increasing share of assets under management and contributions. A recent report from Sun Life Group Retirement Services (GRS), titled Designed for Savings 2019, shows that TDFs have grown from representing 7% of CAP assets in 2010 to 29% at the end of 2018. It also shows that more than 35% of all plan member contributions go to TDFs. This growth is coming largely at the expense of balanced, target-risk and Canadian equity funds, which have all experienced significant declines over the past five years as a percentage of Sun Life GRS’s overall asset mix.8
At the end of 2018, 77% of Canadian CAP sponsors with at least 200 plan members had designated TDFs as their default option for plan members who do not provide investment directions, according to the same Sun Life report.8
Why is it that TDFs appeal to many CAP sponsors? CAP designs vary, but they commonly offer plan members a limited selection of à la carte investment options and some form of diversified, easy-to-use asset allocation investment, such as a TDF. CAP sponsors have recognized that plan members, whether engaged and knowledgeable or not, face many obstacles when building their own portfolios. TDFs can help overcome these obstacles. The table on p. 5 summarizes the potential benefits of choosing TDFs as a default:

5
Issue Fact Implication
A. Limited investment opportunity set
Plan sponsors typically do not make non-core, diversifying investment funds available to CAP members on a standalone basis for fear of misuse by inexperienced investors. At the end of 2018, only 5% of CAPs offered standalone options in specialty asset classes (such as listed real estate, listed infrastructure, etc.).8
CAP members often face a limited investment opportunity set, which may result in lower risk-adjusted returns.
B. Investor expertise constraints
According to the Financial Consumer Agency of Canada, many Canadians lack even a basic understanding of financial matters. Based on a survey conducted by the OECD9, only 61% of Canadians (on par with other OECD countries) could correctly answer five of seven very basic financial knowledge questions.
Canadians tend to have difficulty making sound investment decisions. Poor financial literacy can lead to undue risk aversion or risk-taking.
C. Lack of time and investor engagement
As illustrated in Figure 1, plan members who build their own portfolios have a relatively constant average level of equity exposure despite significant differences in age and investment time horizons.8
The data suggests plan members are taking a “set-it-and-forget-it” approach to establishing their portfolio’s asset mix, a difficult decision in the investment process but one that is critical to the long-term success of a portfolio.
Figure 1: Equity exposure by age group
20
40
80
60
100
Under 2
0
20 to
29
Perc
ent
(%)
30 to
39
40 to
49
50 to
54
55 to
59
60 to
64
65
Members not using TDFs Members using TDFs exclusively Average TDF glidepath
3 Willis Towers Watson, Global Pension Assets Study 2019. 4 Willis Towers Watson, February 11, 2019, Global DC pension assets exceed DB assets for the first time. 5 Canadian CAP assets derived from: Strategic Insight, 2019 Group Retirement Savings and Pensions Report—Canada, and Willis Towers Watson, Global Pension Assets Study 2019. 6 Strategic Insight, 2018 Group Retirement Savings and Pensions Report—Canada. 7 World Economic Forum, We’ll Live to 100 – How Can We Afford It? (2017), and Investing in (and for) Our Future (2019). 8 Sun Life Group Retirement Services, Designed for Savings 2019 Report. 9Organization for Economic Co-operation and Development (OECD) Survey on Measuring Financial Literacy and Financial Inclusion, 2015.
Source: Sun Life Group Retirement Services, Designed for Savings 2019 Report.
6
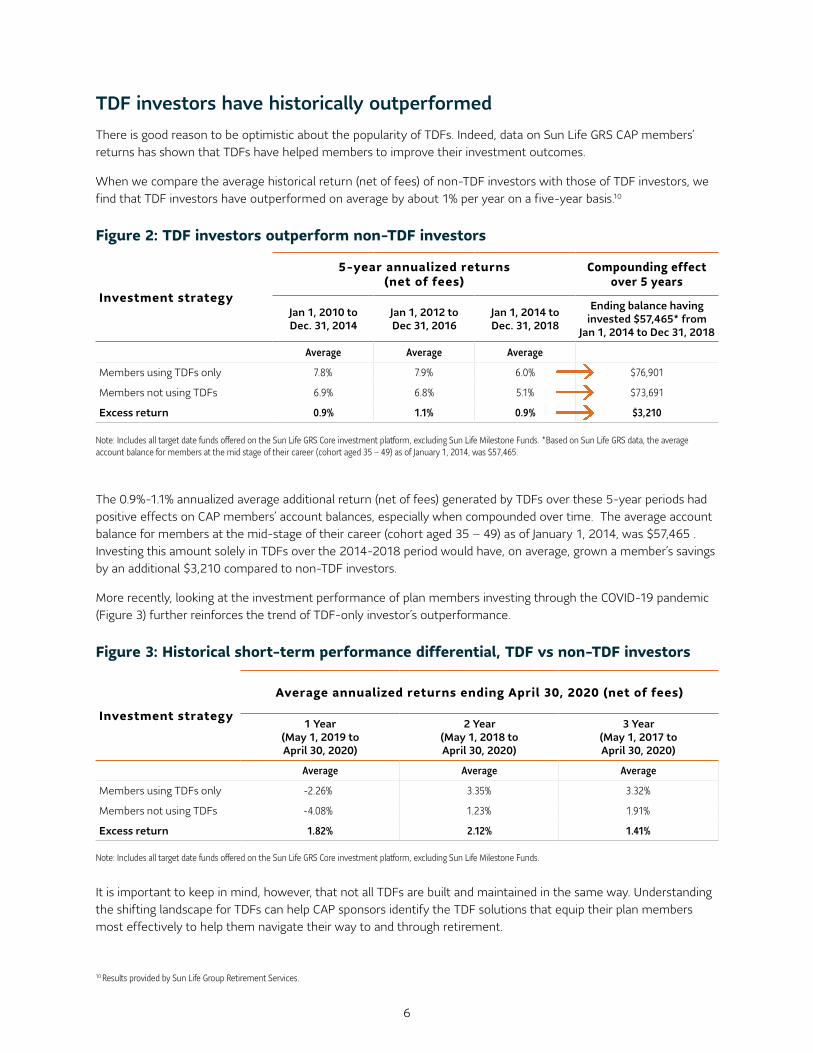
TDF investors have historically outperformedThere is good reason to be optimistic about the popularity of TDFs. Indeed, data on Sun Life GRS CAP members’ returns has shown that TDFs have helped members to improve their investment outcomes.
When we compare the average historical return (net of fees) of non-TDF investors with those of TDF investors, we find that TDF investors have outperformed on average by about 1% per year on a five-year basis.10
The 0.9%-1.1% annualized average additional return (net of fees) generated by TDFs over these 5-year periods had positive effects on CAP members’ account balances, especially when compounded over time. The average account balance for members at the mid-stage of their career (cohort aged 35 – 49) as of January 1, 2014, was $57,465 . Investing this amount solely in TDFs over the 2014-2018 period would have, on average, grown a member’s savings by an additional $3,210 compared to non-TDF investors.
More recently, looking at the investment performance of plan members investing through the COVID-19 pandemic (Figure 3) further reinforces the trend of TDF-only investor’s outperformance.
It is important to keep in mind, however, that not all TDFs are built and maintained in the same way. Understanding the shifting landscape for TDFs can help CAP sponsors identify the TDF solutions that equip their plan members most effectively to help them navigate their way to and through retirement.
Investment strategy
5-year annualized returns (net of fees)
Compounding effect over 5 years
Jan 1, 2010 to Dec. 31, 2014
Jan 1, 2012 to Dec 31, 2016
Jan 1, 2014 to Dec. 31, 2018
Ending balance having invested $57,465* from
Jan 1, 2014 to Dec 31, 2018
Average Average Average
Members using TDFs only 7.8% 7.9% 6.0% $76,901
Members not using TDFs 6.9% 6.8% 5.1% $73,691
Excess return 0.9% 1.1% 0.9% $3,210
Investment strategy
Average annualized returns ending April 30, 2020 (net of fees)
1 Year (May 1, 2019 to April 30, 2020)
2 Year (May 1, 2018 to April 30, 2020)
3 Year (May 1, 2017 to April 30, 2020)
Average Average Average
Members using TDFs only -2.26% 3.35% 3.32%
Members not using TDFs -4.08% 1.23% 1.91%
Excess return 1.82% 2.12% 1.41%
10 Results provided by Sun Life Group Retirement Services.
Note: Includes all target date funds offered on the Sun Life GRS Core investment platform, excluding Sun Life Milestone Funds. *Based on Sun Life GRS data, the average account balance for members at the mid stage of their career (cohort aged 35 – 49) as of January 1, 2014, was $57,465.
Note: Includes all target date funds offered on the Sun Life GRS Core investment platform, excluding Sun Life Milestone Funds.
Figure 2: TDF investors outperform non-TDF investors
Figure 3: Historical short-term performance differential, TDF vs non-TDF investors

7
01 Spanning the investment opportunity set — asset class diversification
11 Source: Study by Gary P. Brinson, L. Randolph Hood, and Gilbert L. Beebower (BHB), “Determinants of Portfolio Performance,” Financial Analysts Journal, July/August 1986. The study analyzed data from 91 large corporate pension plans with assets of at least $100 million over a 10-year period beginning in 1974 and concluded that asset allocation policy explained, on average, 93.6% of the variation in total plan return.
only 6.4%of the variability of performance was driven by security selection and timing of an investment.
93.6%of the variability of performance was driven by an asset allocation policy.
Figure 4: Asset allocation: why bother11?
A fundamental justification for asset allocation is the notion that different asset classes deliver returns that are not perfectly correlated, and hence diversification may reduce investment risk by spreading it across different types of assets. Several academic studies have demonstrated that asset allocation is an important factor in determining returns for an investment portfolio. The most-referenced studies are the Brinson, Hood, and Beebower and follow-up papers that concluded that strategic asset allocation explains 90% to 95% of the portfolio’s performance variability, while only about 5% to 10% can be attributed to security selection and investment timing.11 The diversification strategy is therefore a key component in the design of optimal portfolios.
1.1 The need to pursue higher risk-adjusted returnsTwenty years ago, most Canadian DB plans were invested in traditional balanced portfolios (i.e. containing approximately 60% traditional equity and 40% domestic fixed income). Since then, however, this investment approach has faced increasing challenges as return expectations from traditional asset categories have declined, foreign content restrictions have ceased, and a broadening set of underlying asset classes and providers have disrupted old norms. With the goal of improving the risk-return profile of their balanced portfolios, as well as addressing longer life expectancy, large institutions have restructured their portfolios to span a much wider investment opportunity set.
8
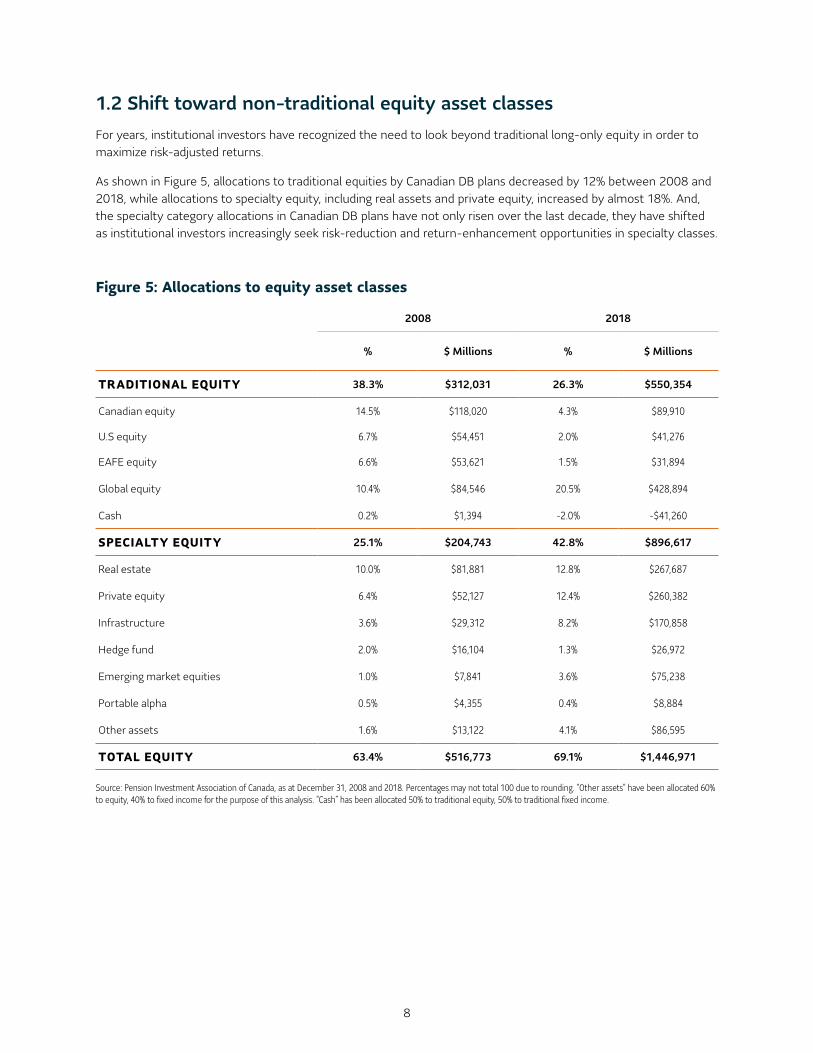
1.2 Shift toward non-traditional equity asset classesFor years, institutional investors have recognized the need to look beyond traditional long-only equity in order to maximize risk-adjusted returns.
As shown in Figure 5, allocations to traditional equities by Canadian DB plans decreased by 12% between 2008 and 2018, while allocations to specialty equity, including real assets and private equity, increased by almost 18%. And, the specialty category allocations in Canadian DB plans have not only risen over the last decade, they have shifted as institutional investors increasingly seek risk-reduction and return-enhancement opportunities in specialty classes.
2008 2018
% $ Millions % $ Millions
TRADITIONAL EQUITY 38.3% $312,031 26.3% $550,354
Canadian equity 14.5% $118,020 4.3% $89,910
U.S equity 6.7% $54,451 2.0% $41,276
EAFE equity 6.6% $53,621 1.5% $31,894
Global equity 10.4% $84,546 20.5% $428,894
Cash 0.2% $1,394 -2.0% -$41,260
SPECIALTY EQUITY 25.1% $204,743 42.8% $896,617
Real estate 10.0% $81,881 12.8% $267,687
Private equity 6.4% $52,127 12.4% $260,382
Infrastructure 3.6% $29,312 8.2% $170,858
Hedge fund 2.0% $16,104 1.3% $26,972
Emerging market equities 1.0% $7,841 3.6% $75,238
Portable alpha 0.5% $4,355 0.4% $8,884
Other assets 1.6% $13,122 4.1% $86,595
TOTAL EQUITY 63.4% $516,773 69.1% $1,446,971
Source: Pension Investment Association of Canada, as at December 31, 2008 and 2018. Percentages may not total 100 due to rounding. “Other assets” have been allocated 60% to equity, 40% to fixed income for the purpose of this analysis. “Cash” has been allocated 50% to traditional equity, 50% to traditional fixed income.
Figure 5: Allocations to equity asset classes

9
1.3 Specialty fixed income may increase yield potentialHigh-quality fixed income can be an important portfolio diversifier alongside equities, helping to preserve capital in times of adverse market environments. Even as the global economy came to a sudden halt at the onset of the COVID-19 pandemic, traditional core fixed income once again proved itself to be an effective risk-mitigation tool to offset equity risk in a portfolio.
Figure 6: Returns during the onset of the coronavirus pandemic (period of January 1, 2020 to April 30, 2020)
However, in the context of the broader low-yield environment, other typical features of high-quality bonds are less clear. In Canada in particular, the strong bias towards high-quality, lower-yielding government issues and a fairly narrow corporate opportunity set challenge longer-term return and income generation potential of this traditional core building block. Diversification into non-domestic fixed income can provide additional sources of return and diversification.
Figure 7: Fixed income yields as at September 30, 2020
In response to the persistent low-yield environment, Canadian institutional investors may continue to increasingly incorporate specialty fixed income into their portfolios. This has been a trend over the past decade, with a particularly large shift towards non-domestic fixed income.
-15%
-10%
-5%
5%
0%
10%
Core fixed income
Ret
urn
Core equity Core fixed income Core equity
U.S.Canada
Source: Morningstar. Note: investors cannot invest directly in an index. Canadian core fixed income returns taken from FTSE Canada Universe Bond Index. Canadian core equity returns taken from S&P/TSX Composite Total Return Index. U.S. core fixed income returns taken from Bloomberg Barclays U.S. Aggregate Bond Total Return Index (Hedged, CAD). U.S. core equity returns taken from S&P 500 Total Return Index (Hedged, CAD).
Source: Bloomberg. Note: Investors cannot invest directly in an index.
2%
4%
6%
0% FTSE Canada
Universe Bond
Yie
lds
Bloomberg Barclays US Aggregate Bond
Bloomberg Barclay Global High Yield
Bloomberg Barclays EM USD Aggregate
10
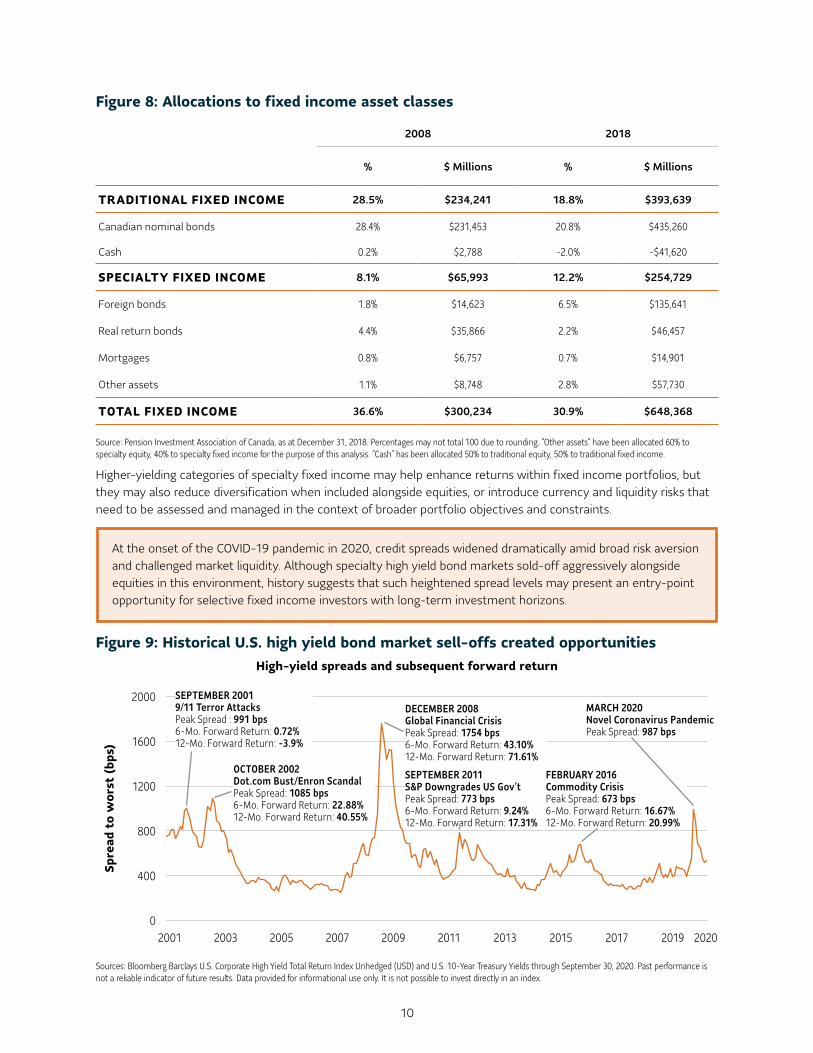
Figure 8: Allocations to fixed income asset classes
2008 2018
% $ Millions % $ Millions
TRADITIONAL FIXED INCOME 28.5% $234,241 18.8% $393,639
Canadian nominal bonds 28.4% $231,453 20.8% $435,260
Cash 0.2% $2,788 -2.0% -$41,620
SPECIALTY FIXED INCOME 8.1% $65,993 12.2% $254,729
Foreign bonds 1.8% $14,623 6.5% $135,641
Real return bonds 4.4% $35,866 2.2% $46,457
Mortgages 0.8% $6,757 0.7% $14,901
Other assets 1.1% $8,748 2.8% $57,730
TOTAL FIXED INCOME 36.6% $300,234 30.9% $648,368
Source: Pension Investment Association of Canada, as at December 31, 2018. Percentages may not total 100 due to rounding. “Other assets” have been allocated 60% to specialty equity, 40% to specialty fixed income for the purpose of this analysis. “Cash” has been allocated 50% to traditional equity, 50% to traditional fixed income.
Sources: Bloomberg Barclays U.S. Corporate High Yield Total Return Index Unhedged (USD) and U.S. 10-Year Treasury Yields through September 30, 2020. Past performance is not a reliable indicator of future results. Data provided for informational use only. It is not possible to invest directly in an index.
Higher-yielding categories of specialty fixed income may help enhance returns within fixed income portfolios, but they may also reduce diversification when included alongside equities, or introduce currency and liquidity risks that need to be assessed and managed in the context of broader portfolio objectives and constraints.
Figure 9: Historical U.S. high yield bond market sell-offs created opportunities
400
0
800
1600
1200
2000
Spre
ad t
o w
orst
(bp
s)
2001 2003 2005 2007 2009 2011 2013 2015 2017 2019 2020
High-yield spreads and subsequent forward return
SEPTEMBER 2001 9/11 Terror Attacks Peak Spread : 991 bps 6-Mo. Forward Return: 0.72% 12-Mo. Forward Return: -3.9%
OCTOBER 2002 Dot.com Bust/Enron Scandal Peak Spread: 1085 bps 6-Mo. Forward Return: 22.88% 12-Mo. Forward Return: 40.55%
DECEMBER 2008 Global Financial Crisis Peak Spread: 1754 bps 6-Mo. Forward Return: 43.10% 12-Mo. Forward Return: 71.61%
SEPTEMBER 2011 S&P Downgrades US Gov’t Peak Spread: 773 bps 6-Mo. Forward Return: 9.24% 12-Mo. Forward Return: 17.31%
FEBRUARY 2016 Commodity Crisis Peak Spread: 673 bps 6-Mo. Forward Return: 16.67% 12-Mo. Forward Return: 20.99%
MARCH 2020 Novel Coronavirus Pandemic Peak Spread: 987 bps
At the onset of the COVID-19 pandemic in 2020, credit spreads widened dramatically amid broad risk aversion and challenged market liquidity. Although specialty high yield bond markets sold-off aggressively alongside equities in this environment, history suggests that such heightened spread levels may present an entry-point opportunity for selective fixed income investors with long-term investment horizons.
11
Source: Anticipated results based on SLGI Asset Management Inc.’s proprietary inputs. For illustrative purposes only. Results are generated using mean-variance optimization, based on forecast returns, risk, and correlations. Forecast returns and risk are gross of fees and are derived based on data as of September 30, 2019.
Incorporating specialty asset classes into the pre-coronavirus quantitative modelling (conducted in 2019) illustrated their positive contribution to anticipated risk and return (see Figure 11).
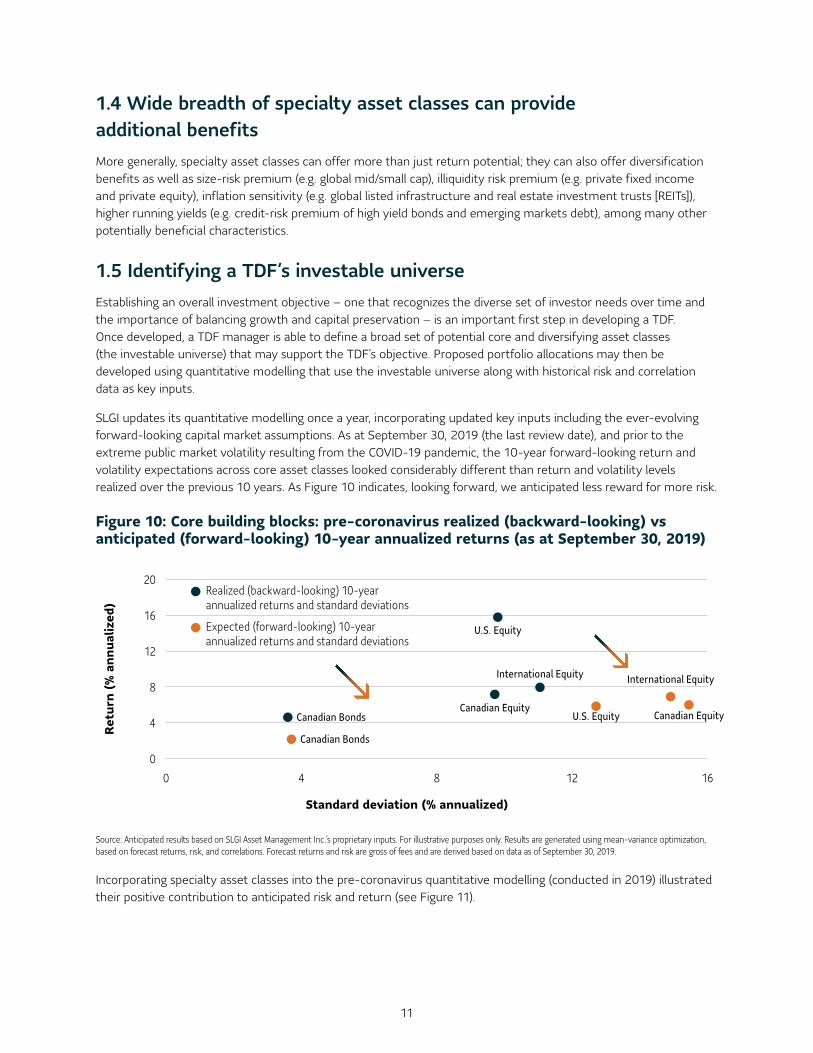
1.4 Wide breadth of specialty asset classes can provide additional benefitsMore generally, specialty asset classes can offer more than just return potential; they can also offer diversification benefits as well as size-risk premium (e.g. global mid/small cap), illiquidity risk premium (e.g. private fixed income and private equity), inflation sensitivity (e.g. global listed infrastructure and real estate investment trusts [REITs]), higher running yields (e.g. credit-risk premium of high yield bonds and emerging markets debt), among many other potentially beneficial characteristics.
1.5 Identifying a TDF’s investable universeEstablishing an overall investment objective – one that recognizes the diverse set of investor needs over time and the importance of balancing growth and capital preservation – is an important first step in developing a TDF. Once developed, a TDF manager is able to define a broad set of potential core and diversifying asset classes (the investable universe) that may support the TDF’s objective. Proposed portfolio allocations may then be developed using quantitative modelling that use the investable universe along with historical risk and correlation data as key inputs.
SLGI updates its quantitative modelling once a year, incorporating updated key inputs including the ever-evolving forward-looking capital market assumptions. As at September 30, 2019 (the last review date), and prior to the extreme public market volatility resulting from the COVID-19 pandemic, the 10-year forward-looking return and volatility expectations across core asset classes looked considerably different than return and volatility levels realized over the previous 10 years. As Figure 10 indicates, looking forward, we anticipated less reward for more risk.
Figure 10: Core building blocks: pre-coronavirus realized (backward-looking) vs anticipated (forward-looking) 10-year annualized returns (as at September 30, 2019)
0
4
8
16
12
20
0 4 8 12 16
Ret
urn
(% a
nnua
lized
)
Standard deviation (% annualized)
Realized (backward-looking) 10-year annualized returns and standard deviations
Expected (forward-looking) 10-year annualized returns and standard deviations
Canadian Bonds
Canadian Bonds Canadian Equity
Canadian Equity
International Equity International Equity
U.S. Equity
U.S. Equity

12
Figure 11: Core vs. enhanced portfolio building blocks: pre-coronavirus anticipated (forward looking) 10-year annualized return and standard deviation
Source: SLGI Asset Management Inc. For illustrative purposes only. Results are generated using mean-variance optimization, based on forecast returns, risk, and correlations. Forecast returns and risk are gross of fees and are derived based on data as of September 30, 2019.
The results of our annual quantitative modelling in 2020 will be known only after the publication of this paper. However, as the world emerges from the COVID-19 pandemic, although much may have changed economically and sociologically, a lower level of expected returns may likely persist.
1.6 TDF solutions need to evolveIn light of the ongoing evolution of capital markets, opportunities and constraints, TDF managers should consider whether their strategic asset mixes remain optimal to provide the anticipated long-term returns for different levels of risk taken.
TDF managers who regularly revisit their investment opportunity set and constraints, and adjust their long-term forward-looking risk and return assumptions do so in an effort to maintain an optimal strategic asset allocation based on the funds’ investment objectives: typically, to generate the growth required for spend-down needs in retirement, while also preserving capital and purchasing power. With the strategic asset allocation being responsible for 90%-95% of performance variability, the importance of appropriately setting and updating the strategic asset allocation over time should not be understated. This consideration is not limited to TDFs. Depending on the plan design, it may be equally important for traditional balanced funds and asset-allocation options and tools at large.
0
2
3
5
7
9
1
4
8
6
10
0 4 6 82 10 12 14 16 2018
Expe
cted
ret
urn
(% a
nnua
lized
)
Expected standard deviation (% annualized)
Fixed income
Equity
U.S. high yield bonds
Emerging market bonds
Canadian real return bonds
Canadian private fixed income
Emerging markets equity
Global mid cap
Canadian equity U.S. equity
Global listed infrastructure International equity Global REITs
Global natural resources
U.S. bonds
Canadian bonds
Canadian mortgages
Canadian cash
Core building blocks
Enhanced building blocks
13
02 The optimal mix: deciding the weight of each asset classHaving identified the appropriate range of asset classes, the TDF manager should determine the optimal allocation to each asset class, effectively creating a series of model portfolios designed to maximize returns, subject to volatility and applicable constraints such as liquidity and diversification.
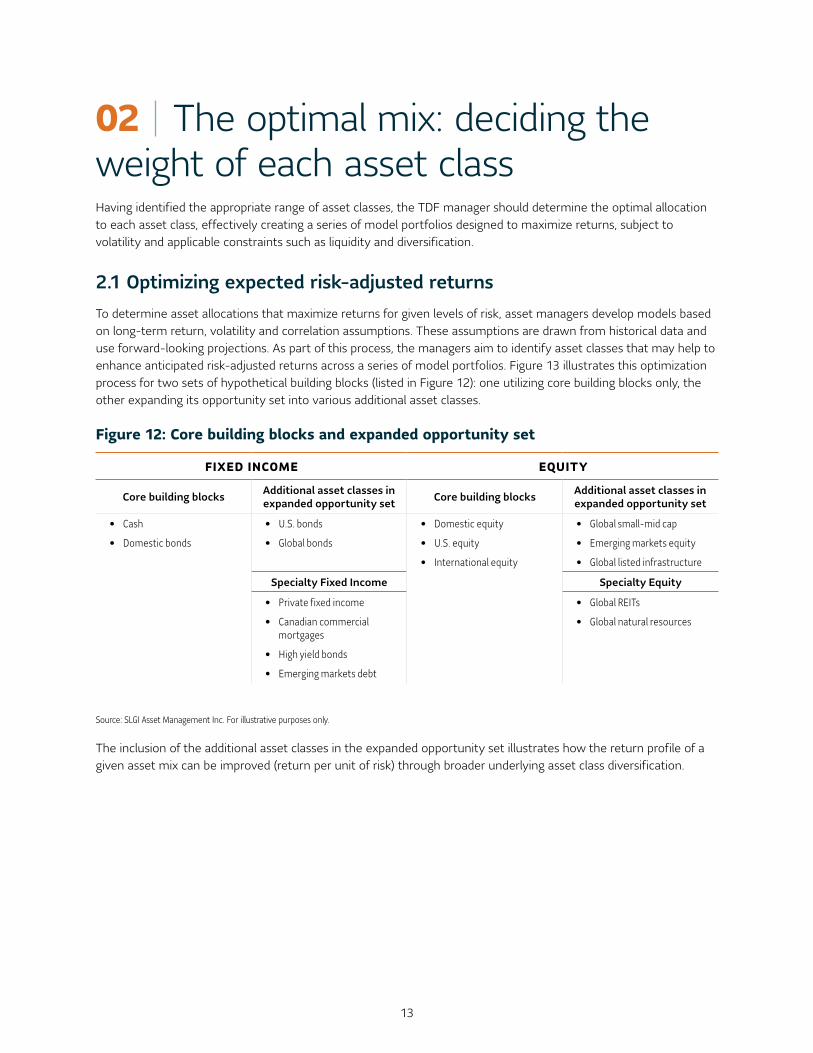
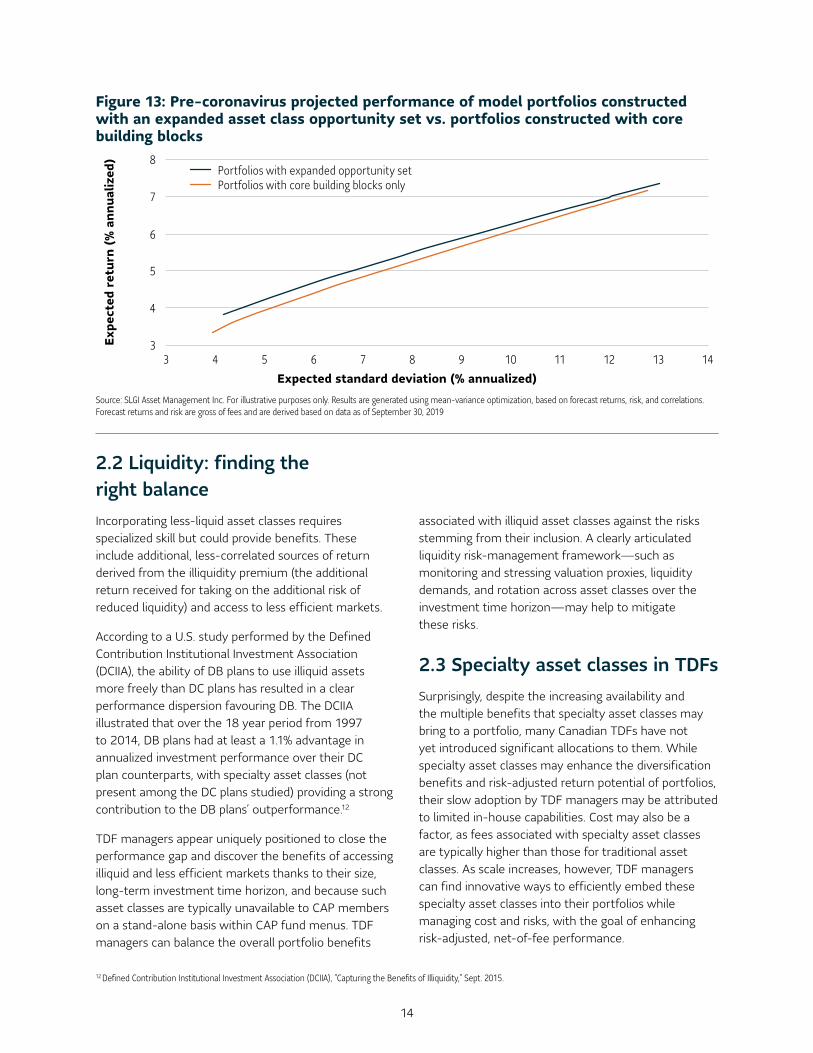
2.1 Optimizing expected risk-adjusted returnsTo determine asset allocations that maximize returns for given levels of risk, asset managers develop models based on long-term return, volatility and correlation assumptions. These assumptions are drawn from historical data and use forward-looking projections. As part of this process, the managers aim to identify asset classes that may help to enhance anticipated risk-adjusted returns across a series of model portfolios. Figure 13 illustrates this optimization process for two sets of hypothetical building blocks (listed in Figure 12): one utilizing core building blocks only, the other expanding its opportunity set into various additional asset classes.
Figure 12: Core building blocks and expanded opportunity set
FIXED INCOME EQUITY
Core building blocks Additional asset classes in expanded opportunity set Core building blocks Additional asset classes in
expanded opportunity set
• Cash
• Domestic bonds
• U.S. bonds
• Global bonds
• Domestic equity
• U.S. equity
• International equity
• Global small-mid cap
• Emerging markets equity
• Global listed infrastructure
Specialty Fixed Income Specialty Equity
• Private fixed income
• Canadian commercial mortgages
• High yield bonds
• Emerging markets debt
• Global REITs
• Global natural resources
Source: SLGI Asset Management Inc. For illustrative purposes only.
The inclusion of the additional asset classes in the expanded opportunity set illustrates how the return profile of a given asset mix can be improved (return per unit of risk) through broader underlying asset class diversification.
14
2.2 Liquidity: finding the right balanceIncorporating less-liquid asset classes requires specialized skill but could provide benefits. These include additional, less-correlated sources of return derived from the illiquidity premium (the additional return received for taking on the additional risk of reduced liquidity) and access to less efficient markets.
According to a U.S. study performed by the Defined Contribution Institutional Investment Association (DCIIA), the ability of DB plans to use illiquid assets more freely than DC plans has resulted in a clear performance dispersion favouring DB. The DCIIA illustrated that over the 18 year period from 1997 to 2014, DB plans had at least a 1.1% advantage in annualized investment performance over their DC plan counterparts, with specialty asset classes (not present among the DC plans studied) providing a strong contribution to the DB plans’ outperformance.12
TDF managers appear uniquely positioned to close the performance gap and discover the benefits of accessing illiquid and less efficient markets thanks to their size, long-term investment time horizon, and because such asset classes are typically unavailable to CAP members on a stand-alone basis within CAP fund menus. TDF managers can balance the overall portfolio benefits
associated with illiquid asset classes against the risks stemming from their inclusion. A clearly articulated liquidity risk-management framework—such as monitoring and stressing valuation proxies, liquidity demands, and rotation across asset classes over the investment time horizon—may help to mitigate these risks.
2.3 Specialty asset classes in TDFsSurprisingly, despite the increasing availability and the multiple benefits that specialty asset classes may bring to a portfolio, many Canadian TDFs have not yet introduced significant allocations to them. While specialty asset classes may enhance the diversification benefits and risk-adjusted return potential of portfolios, their slow adoption by TDF managers may be attributed to limited in-house capabilities. Cost may also be a factor, as fees associated with specialty asset classes are typically higher than those for traditional asset classes. As scale increases, however, TDF managers can find innovative ways to efficiently embed these specialty asset classes into their portfolios while managing cost and risks, with the goal of enhancing risk-adjusted, net-of-fee performance.
Figure 13: Pre-coronavirus projected performance of model portfolios constructed with an expanded asset class opportunity set vs. portfolios constructed with core building blocks
Source: SLGI Asset Management Inc. For illustrative purposes only. Results are generated using mean-variance optimization, based on forecast returns, risk, and correlations. Forecast returns and risk are gross of fees and are derived based on data as of September 30, 2019
Expected standard deviation (% annualized)
4
3
5
7
6
8
Expe
cted
ret
urn
(% a
nnua
lized
)
3 4 5 6 7 8 9 10 11 12 13 14
Portfolios with expanded opportunity set Portfolios with core building blocks only
12 Defined Contribution Institutional Investment Association (DCIIA), “Capturing the Benefits of Illiquidity,” Sept. 2015.
15
03 Glidepath: improving design through ongoing research3.1 What is a glidepath?Glidepath refers to the process through which TDF managers make gradual changes to a target date portfolio’s strategic asset mix over the investment time horizon. The glidepath creates an asset allocation model that becomes more conservative (i.e., has more exposure to fixed income) as the fund gets closer to and transitions into the plan member’s period of retirement. The glidepath aims to align the plan member’s portfolio with anticipated changes to their investment objectives, shifting from growth to income-generation, increasingly prioritizing capital preservation as risk tolerance declines. While there are many moving parts to TDFs, the glidepath is widely viewed as the design component that has the most impact on the wealth that plan members accumulate during their working years and will spend during retirement.
In the early working years, when account balances are low and the investment time horizon is long, plan members’ capacity to bear investment risk may be higher because they have more years to recover any declines in account balance before their target retirement date. Risk tolerance is personal, but we believe it plays an important role in encouraging plan members to stay invested for the long term. For example, large early declines in account balance may cause plan members to exit the TDF and invest too conservatively, inhibiting their ability to generate sustainable retirement income to protect against longevity risk. TDF solutions that do not effectively balance capital appreciation and downside risk may be exposed not only to heightened market volatility, but also to greater risk of poor plan member behaviours, such as divestment and/or reduction of contributions following times of market stress.
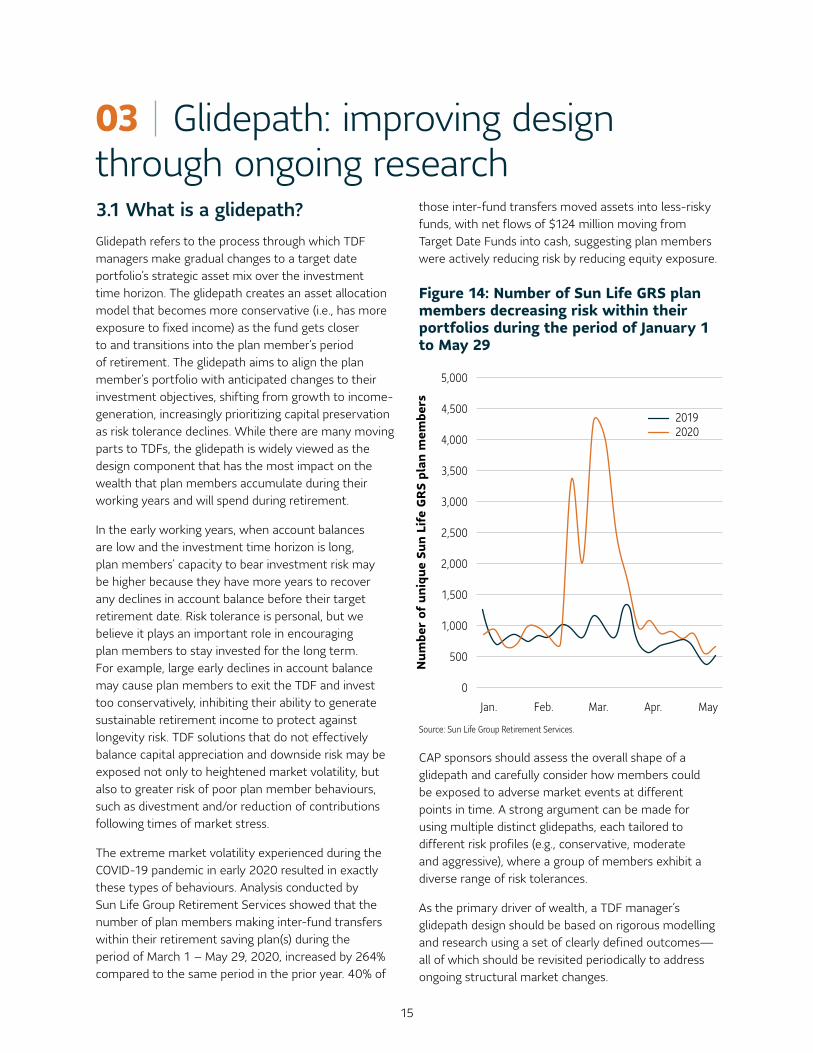
The extreme market volatility experienced during the COVID-19 pandemic in early 2020 resulted in exactly these types of behaviours. Analysis conducted by Sun Life Group Retirement Services showed that the number of plan members making inter-fund transfers within their retirement saving plan(s) during the period of March 1 – May 29, 2020, increased by 264% compared to the same period in the prior year. 40% of
those inter-fund transfers moved assets into less-risky funds, with net flows of $124 million moving from Target Date Funds into cash, suggesting plan members were actively reducing risk by reducing equity exposure.
Figure 14: Number of Sun Life GRS plan members decreasing risk within their portfolios during the period of January 1 to May 29
Source: Sun Life Group Retirement Services.
CAP sponsors should assess the overall shape of a glidepath and carefully consider how members could be exposed to adverse market events at different points in time. A strong argument can be made for using multiple distinct glidepaths, each tailored to different risk profiles (e.g., conservative, moderate and aggressive), where a group of members exhibit a diverse range of risk tolerances.
As the primary driver of wealth, a TDF manager’s glidepath design should be based on rigorous modelling and research using a set of clearly defined outcomes— all of which should be revisited periodically to address ongoing structural market changes.
0
1,000
1,500
2,500
3,500
4,500
500
2,000
4,000
3,000
5,000
Jan. Mar. Apr.Feb. May
2019 2020
Num
ber
of u
niqu
e Su
n Li
fe G
RS
plan
mem
bers
16
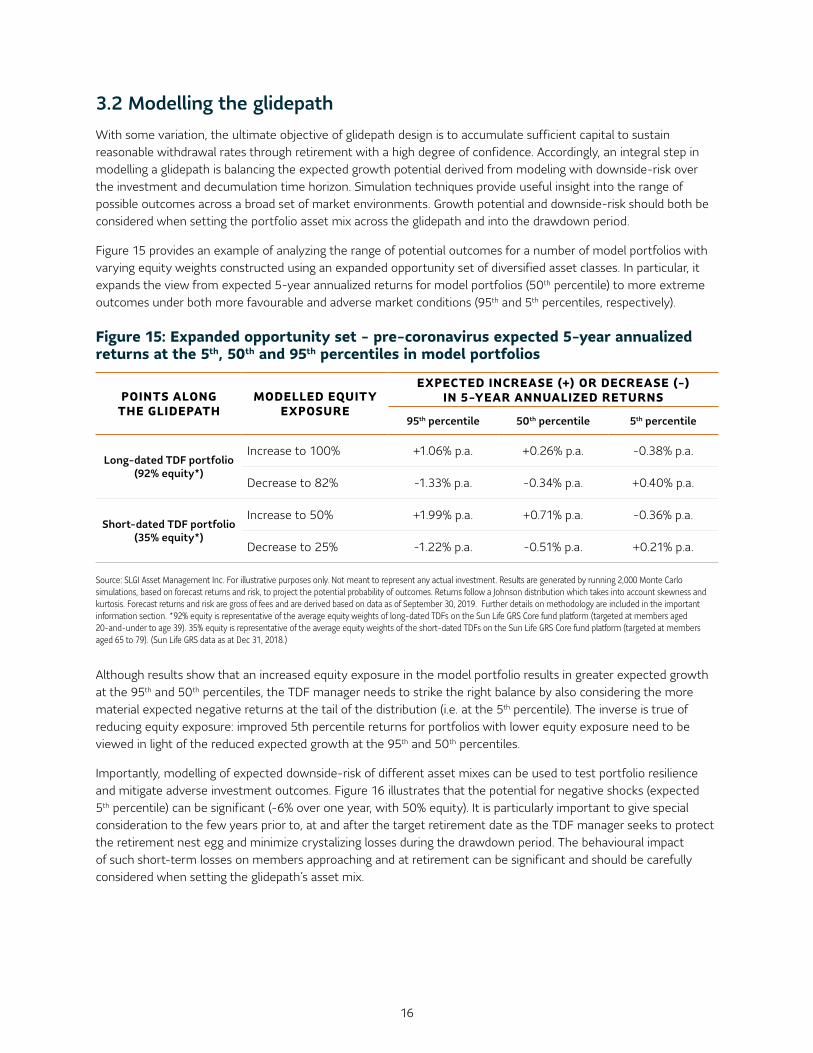
3.2 Modelling the glidepathWith some variation, the ultimate objective of glidepath design is to accumulate sufficient capital to sustain reasonable withdrawal rates through retirement with a high degree of confidence. Accordingly, an integral step in modelling a glidepath is balancing the expected growth potential derived from modeling with downside-risk over the investment and decumulation time horizon. Simulation techniques provide useful insight into the range of possible outcomes across a broad set of market environments. Growth potential and downside-risk should both be considered when setting the portfolio asset mix across the glidepath and into the drawdown period.
Figure 15 provides an example of analyzing the range of potential outcomes for a number of model portfolios with varying equity weights constructed using an expanded opportunity set of diversified asset classes. In particular, it expands the view from expected 5-year annualized returns for model portfolios (50th percentile) to more extreme outcomes under both more favourable and adverse market conditions (95th and 5th percentiles, respectively).
Figure 15: Expanded opportunity set - pre-coronavirus expected 5-year annualized returns at the 5th, 50th and 95th percentiles in model portfolios
Although results show that an increased equity exposure in the model portfolio results in greater expected growth at the 95th and 50th percentiles, the TDF manager needs to strike the right balance by also considering the more material expected negative returns at the tail of the distribution (i.e. at the 5th percentile). The inverse is true of reducing equity exposure: improved 5th percentile returns for portfolios with lower equity exposure need to be viewed in light of the reduced expected growth at the 95th and 50th percentiles.
Importantly, modelling of expected downside-risk of different asset mixes can be used to test portfolio resilience and mitigate adverse investment outcomes. Figure 16 illustrates that the potential for negative shocks (expected 5th percentile) can be significant (-6% over one year, with 50% equity). It is particularly important to give special consideration to the few years prior to, at and after the target retirement date as the TDF manager seeks to protect the retirement nest egg and minimize crystalizing losses during the drawdown period. The behavioural impact of such short-term losses on members approaching and at retirement can be significant and should be carefully considered when setting the glidepath’s asset mix.
POINTS ALONG THE GLIDEPATH
MODELLED EQUITY EXPOSURE
EXPECTED INCREASE (+) OR DECREASE (-) IN 5-YEAR ANNUALIZED RETURNS
95th percentile 50th percentile 5th percentile
Long-dated TDF portfolio (92% equity*)
Increase to 100% +1.06% p.a. +0.26% p.a. -0.38% p.a.
Decrease to 82% -1.33% p.a. -0.34% p.a. +0.40% p.a.
Short-dated TDF portfolio (35% equity*)
Increase to 50% +1.99% p.a. +0.71% p.a. -0.36% p.a.
Decrease to 25% -1.22% p.a. -0.51% p.a. +0.21% p.a.
Source: SLGI Asset Management Inc. For illustrative purposes only. Not meant to represent any actual investment. Results are generated by running 2,000 Monte Carlo simulations, based on forecast returns and risk, to project the potential probability of outcomes. Returns follow a Johnson distribution which takes into account skewness and kurtosis. Forecast returns and risk are gross of fees and are derived based on data as of September 30, 2019. Further details on methodology are included in the important information section. *92% equity is representative of the average equity weights of long-dated TDFs on the Sun Life GRS Core fund platform (targeted at members aged 20-and-under to age 39). 35% equity is representative of the average equity weights of the short-dated TDFs on the Sun Life GRS Core fund platform (targeted at members aged 65 to 79). (Sun Life GRS data as at Dec 31, 2018.)

17
Figure 16: Downside risk – pre-coronavirus expected 5th percentile annualized returns for hypothetical short-dated TDF portfolios modelled at 25%, 35% and 50% equity allocations over 1, 5 and 10-years (annualized)
-6
-5
-3
-1
1
-7
-4
0
-2
2
25% equity 35% equity 50% equity
Expe
cted
dow
nsid
e ri
sk
(% a
nnua
lized
ret
urn)
1 year 5 years 10 years
20
25
30
40
35
15
45
4% (nominal)Year
s fo
r sp
end-
dow
n (9
5% c
onfi
denc
e as
sets
are
sti
ll le
ft in
the
acc
ount
)
Withdrawal rates (with and without inflation adjustment)
4% (inflation adjusted) 5% (nominal) 5% (inflation adjusted)
25% Equity 35% Equity 50% Equity
Source: SLGI Asset Management Inc. For illustrative purposes only. Not meant to represent any actual investment. Results are generated by running 2,000 Monte Carlo simulations, based on forecast returns and risk, to project the potential probability of outcomes. Returns follow a Johnson distribution which takes into account skewness and kurtosis. Forecast returns and risk are gross of fees and are derived based on data as of September 30, 2019. Further details on methodology are included in the important information section.
Stress testing portfolio sustainabilityWhen conducting portfolio modelling, it is critical to consider the sustainability of assets during the decumulation period. Simulating the expected number of years of spend-down decumulation using different withdrawal rates and inflation assumptions can help test the post-retirement glidepath design against overall objectives.
Figure 17 illustrates the incremental number of years of drawdown that is expected with 95% confidence for three hypothetical post-retirement portfolios with the same equity weights as the hypothetical short-dated TDF portfolios considered in Figure 16.
Figure 17: Simulating and monitoring decumulation spend-down risk for hypothetical post-retirement portfolios, modelled at consistent 25%, 35% and 50% equity weights, with 4% and 5% annual withdrawal rates, both with and without inflation adjustment.
Source: SLGI Asset Management Inc. For illustrative purposes only. Not meant to represent any actual investment. Results are generated by running 2,000 Monte Carlo simulations, based on forecast returns and risk, to project the potential probability of outcomes. Returns follow a Johnson distribution which takes into account skewness and kurtosis. Forecast returns and risk are gross of fees and are derived based on data as of September 30, 2019. Further details on methodology are included in the important information section.
18
As the results in Figure 17 show, withdrawal sustainability is not linearly linked to the level of equity allocation. More specifically in this example, the 35% equity portfolio appears more resilient than both higher and lower equity portfolios.
Optimally balancing risk factors while retaining the highest levels of confidence in meeting a TDF’s ultimate objective – providing a sustainable income during retirement – is what guides the glidepath modelling process. And sincestructural market changes may affect long-term opportunity sets, assumptions and constraints, the glidepath modelling process should be revisited regularly. Regular monitoring allows TDF managers to assess whether the current target asset allocation remains the one best suited to meet the investment objectives of the portfolio and, importantly, make changes where deemed necessary. Frequent scenario-testing, similar to the type illustrated in Figures 15, 16, and 17, not only provides information needed to assess the optimal target asset mix at a given point in time, when conducted routinely as part of the investment process it also allows adjustments to be made incrementally as forward-looking assumptions change and are seen to persist over time.
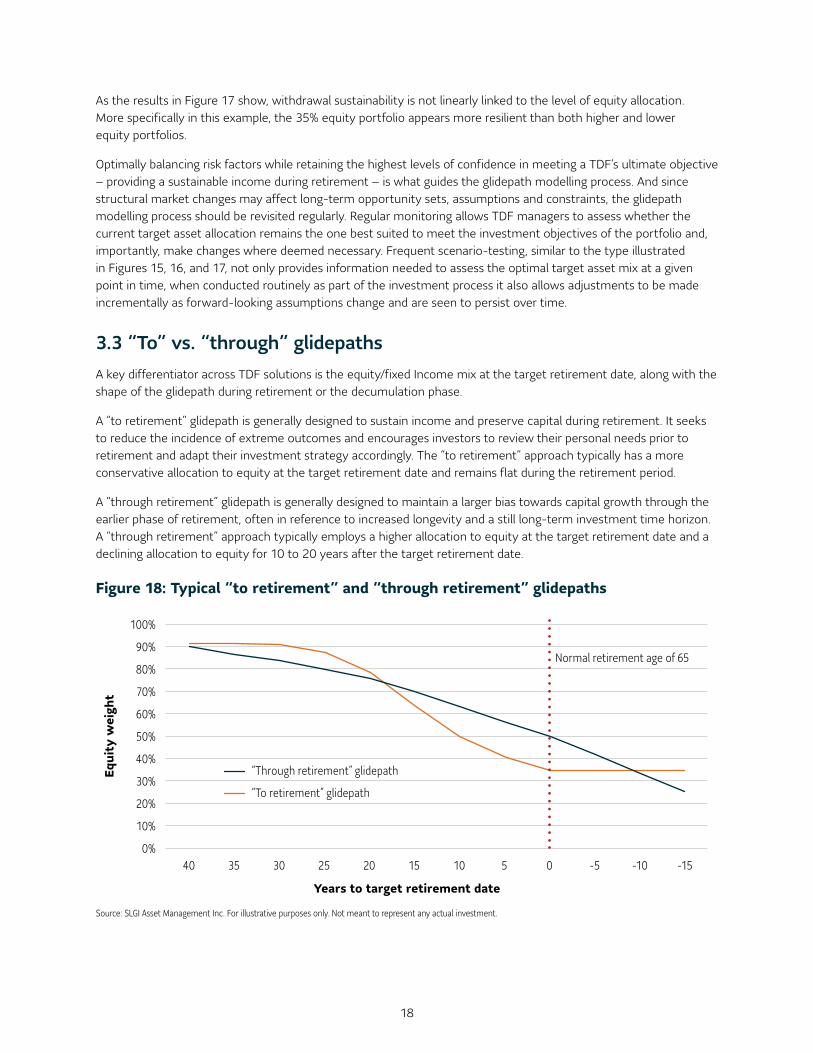
3.3 “To” vs. “through” glidepathsA key differentiator across TDF solutions is the equity/fixed Income mix at the target retirement date, along with the shape of the glidepath during retirement or the decumulation phase.
A “to retirement” glidepath is generally designed to sustain income and preserve capital during retirement. It seeks to reduce the incidence of extreme outcomes and encourages investors to review their personal needs prior to retirement and adapt their investment strategy accordingly. The “to retirement” approach typically has a more conservative allocation to equity at the target retirement date and remains flat during the retirement period.
A “through retirement” glidepath is generally designed to maintain a larger bias towards capital growth through the earlier phase of retirement, often in reference to increased longevity and a still long-term investment time horizon. A “through retirement” approach typically employs a higher allocation to equity at the target retirement date and a declining allocation to equity for 10 to 20 years after the target retirement date.
Figure 18: Typical “to retirement” and “through retirement” glidepaths
Source: SLGI Asset Management Inc. For illustrative purposes only. Not meant to represent any actual investment.
Years to target retirement date
20%
10%
0%
40%
30%
80%
70%
60%
50%
100%
90%
Equi
ty w
eigh
t
40 35 30 25 20 15 10 5 0 -5 -10 -15
Normal retirement age of 65
“To retirement” glidepath
“Through retirement” glidepath

19
The negative-return environment of the 2009 global financial crisis put investment assumptions to the test and shed light on the significant impact of a glidepath’s equity landing-point. In 2009, two U.S. agencies, the Securities and Exchange Commission (SEC) and the Department of Labor (DOL), began investigating the widely divergent returns of thirty-one 2010-dated TDFs during the global financial crisis, ranging from -3.6% to -41.8% for 2008,13 which resulted from the dramatically different asset mixes (21% to 79% in equity) of otherwise similarly labelled retirement funds. The SEC subsequently proposed amendments14 to its advertising rules to require TDF marketing materials to provide investors enhanced information about those funds and, in doing so, addressing concerns regarding the potential for investor misunderstanding regarding the risks posed by and the differences among such funds.
In 2020, the COVID-19 pandemic illustrated, once again, how the equity landing-point of a glidepath can have a material effect on portfolio performance for Canadians approaching retirement. As at March 31st, following the initial shock to global markets following the outbreak of the coronavirus, the dispersion in the 3-month returns of Canadian 2020 target maturity funds ranged from +0.6% to -11.5%15; a return differential of over 12% (in comparison to an average quarterly return differential of 3.3% over the 5-year period ending December 31, 2019).
Retirees face their maximum risk exposure at the point of retirement – the time when contributions are expected to stop and periodic withdrawals to begin. As such, retirees have heightened sensitivity to market declines: an investor who withdraws following a market decline suffers a permanent loss of capital. Market-based “tail events” or even normal market declines at the start of retirement can negatively impact retirement income for years to come. As such, CAP sponsors should carefully assess the downside risks associated with the equity landing-point in the years prior to and at maturity for each of the TDF solutions available to them.
3.4 Beware: glidepaths don’t tell the whole storyWhile an important consideration, the glidepath shape merely provides an indication of the TDF manager’s high-level preference for capturing growth opportunities to drive wealth accumulation while balancing risk across the life of the TDF. A more detailed analysis of underlying asset class building-blocks can help shed additional light on portfolio diversification and key drivers of risk and return.
13 “Allocation in retirement: A flat glidepath always makes sense,” by Josh Cohen, AAII Journal, July 2010. 14 U.S. Securities and Exchange Commission. Investment Company Advertising: Target Date Retirement Fund Names and Marketing, Securities Act Release No. 9126 ( June 16, 2010). 15 Returns of Mercer Pooled Target Date (Retirement Date -2020) universe as at March 31, 2020.

20
04 Selecting underlying investment strategiesWhile asset allocation and glidepath construction are critical drivers of overall portfolio performance, the selection of underlying investment strategies can also play an important role in enhancing returns or managing risk. These may be increasingly important in market environments where model-generated forecasts project muted investment returns or heightened volatility. Successful TDF managers use a wide variety of tools in pursuit of strong risk-adjusted returns. One of these is carefully selecting and monitoring the underlying strategies that make up the funds.
4.1 Open architectureDiversification reaches beyond asset classes. It includes many factors, such as underlying investment styles, time horizons and scale. Most large institutional plan sponsors hire multiple fund managers for the strategies that make up their portfolios, recognizing that no one manager is likely to be best at managing all asset classes and styles. The Canadian Institutional Investment Network (CIIN) Database for Canadian Pensions and Foundations & Endowments shows that over 700 plan sponsors, with median plan sponsor assets of $114 million and a combined $1 trillion in assets under management, exclusively hire third-party external managers, retaining an average of five managers each. Diversifying assets among specialists across asset classes and styles can help plan sponsors to target specific exposures to maximize risk-adjusted returns.
As market conditions, opportunity sets, peer groups and capabilities evolve, a flexible approach to selecting these specialists can help ensure ongoing exposure to best-in-class building blocks across a broad set of asset classes. Scale, breadth and skill are important features to enable sustainable competitiveness at this level.
4.2 Why choose between active and passive when you can use both?Although the “active versus passive investing” debate continues, it is widely acknowledged16 that active and passive investing are complementary approaches when constructing a portfolio. Markets are dynamic, and what was once efficient (ideal for a passive approach) can over time become inefficient (ideal for an active approach). Constructing “hybrid” portfolios that have an allocation to both active and passive styles enables fund managers to exploit the benefits of each, especially if the manager has the flexibility to tactically allocate between active and passive styles as market conditions change.
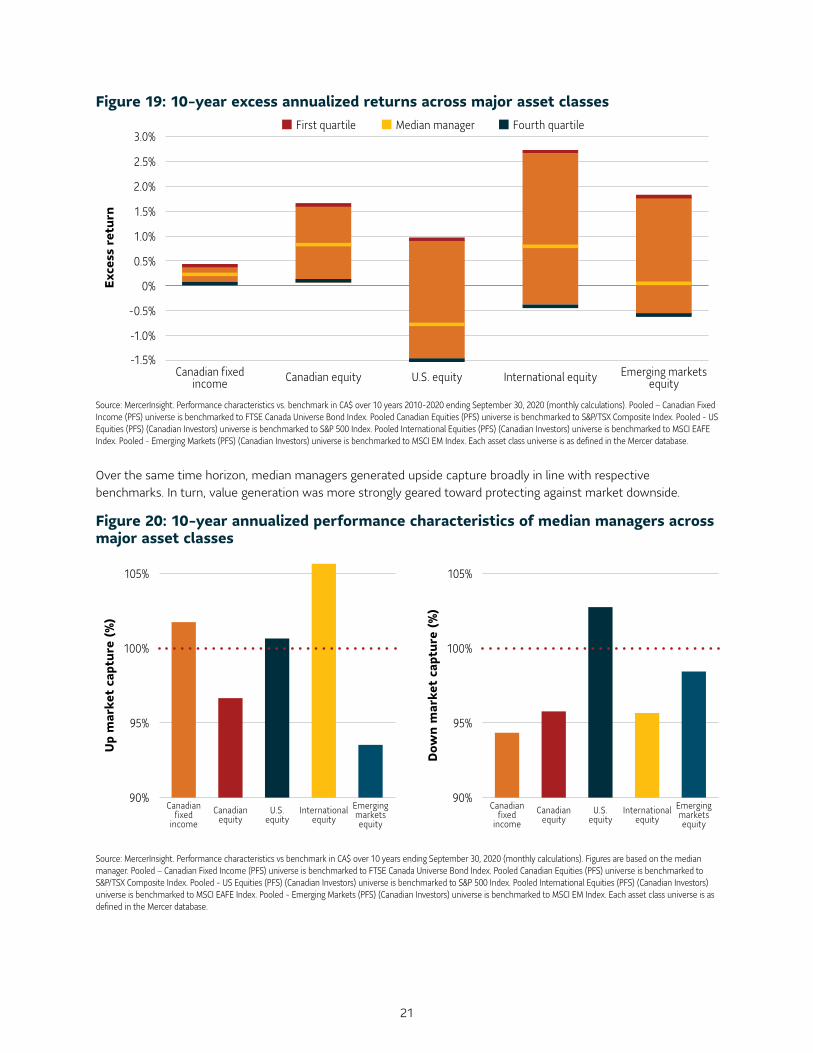
As the COVID-19 crisis recedes and the impact of the pandemic – along with its associated risks – can be more clearly assessed, investing in actively managed strategies may help avoid businesses and sectors experiencing negative impacts and identify industries for investment that are positioned to thrive coming out of the virus slowdown. Figure 19 shows the long-term annualized excess returns from core asset classes, illustrating how median active managers generated long-term excess returns in major asset classes (except U.S. equities). Of further note is the opportunity to generate additional value through strong manager selection, highlighted by, in most cases, the material difference between median and first quartile breakpoints.
16 Karl V. Lins and Lukasz Pomorski, “Does Active Management Pay? New International Evidence.” Why we believe NOW is the time for active equities. Willis Towers Watson, 2020.
21
Figure 19: 10-year excess annualized returns across major asset classes
Source: MercerInsight. Performance characteristics vs. benchmark in CA$ over 10 years 2010-2020 ending September 30, 2020 (monthly calculations). Pooled – Canadian Fixed Income (PFS) universe is benchmarked to FTSE Canada Universe Bond Index. Pooled Canadian Equities (PFS) universe is benchmarked to S&P/TSX Composite Index. Pooled - US Equities (PFS) (Canadian Investors) universe is benchmarked to S&P 500 Index. Pooled International Equities (PFS) (Canadian Investors) universe is benchmarked to MSCI EAFE Index. Pooled - Emerging Markets (PFS) (Canadian Investors) universe is benchmarked to MSCI EM Index. Each asset class universe is as defined in the Mercer database.
Over the same time horizon, median managers generated upside capture broadly in line with respective benchmarks. In turn, value generation was more strongly geared toward protecting against market downside.
Figure 20: 10-year annualized performance characteristics of median managers across major asset classes
Source: MercerInsight. Performance characteristics vs benchmark in CA$ over 10 years ending September 30, 2020 (monthly calculations). Figures are based on the median manager. Pooled – Canadian Fixed Income (PFS) universe is benchmarked to FTSE Canada Universe Bond Index. Pooled Canadian Equities (PFS) universe is benchmarked to S&P/TSX Composite Index. Pooled - US Equities (PFS) (Canadian Investors) universe is benchmarked to S&P 500 Index. Pooled International Equities (PFS) (Canadian Investors) universe is benchmarked to MSCI EAFE Index. Pooled - Emerging Markets (PFS) (Canadian Investors) universe is benchmarked to MSCI EM Index. Each asset class universe is as defined in the Mercer database.
0.5%
0%
-1.0%
1.0%
-1.5%
-0.5%
1.5%
2.0%
2.5%
3.0%
Exce
ss r
etur
n
Canadian equityCanadian fixed income U.S. equity International equity Emerging markets
equity
Median managerFirst quartile Fourth quartile
Canadian fixed
income
Canadian fixed
income International
equity Emerging markets equity
Canadian equity
Canadian equity
U.S. equity
U.S. equity
90% 90%
95% 95%
100% 100%
105% 105%
Up
mar
ket
capt
ure
(%)
Dow
n m
arke
t ca
ptur
e (%
)
International equity
Emerging markets equity

22
Institutional investors favour a blendInstitutional investors recognize that using a combination of styles helps to create stronger portfolios. Of the 700-plus plan sponsors in the CIIN database who exclusively hire third-party external managers, only a very small percentage (approximately 2%) report exclusively hiring a manager who specializes in passive portfolio management, suggesting the vast majority of plan sponsors employ some form of active management in their portfolios.
Selecting a passive underlying investment strategy is not a passive decisionCareful selection of underlying strategies that make up a particular series of TDFs can support overall portfolio efficiency. Considerations may include benchmark, targeted level of active returns, risk, as well as cost. The options available will vary, but common to all TDFs should be a robust selection process that is well defined and suitably in-depth.
The decision whether to use an active or a passive strategy is itself a form of active management. Opting to use a passive underlying strategy for an asset class is an active decision that takes into account views on the market (beta), value-add (alpha), cost, and absolute/ relative risk. Glidepath design and the selection of underlying strategies involve many active decisions that can dramatically alter the results for plan members. Therefore, these decisions should be carefully considered in light of clearly defined objectives and constraints. Active strategies can be used to maximize returns, reduce volatility and mitigate downside risk in difficult market environments, and may ultimately result in better absolute and risk-adjusted performance. Passive strategies, on the other hand, offer liquidity and provide cost-effective exposure to efficient markets (potentially providing room to invest in more costly diversifying asset classes).
Environmental, Social, and Governance investing (ESG)Consideration of ESG factors is of increasing importance to managers, helping to identify potential investment risks and opportunities. There is a growing body of evidence that the share prices of companies with good ESG practices tended to outperform those with poor ESG practices over the long run, and investors appear to have taken notice.
In the United States, the incorporation of ESG factors into the investment decision-making process nearly doubled in the six years from 2013 to 2019, increasing from 22% to 42%.17 In Canada, the Responsible Investment Association reported18 that by the end of 2017, assets in Canada being managed using at least one responsible investment strategy totalled $2.1 trillion - more than double the level of such assets recorded four years earlier.
ESG integration could be impacted by the degree to which passive investing is implemented within a portfolio, as Willis Towers Watson pointed out in a recent publication:
“…it is harder to pursue an integrated ESG strategy passively compared with the opportunity to allocate capital more dynamically or opportunistically with an active approach.”
Willis Towers Watson, Why we believe NOW is the time for active equities (2020)
For TDF solutions, ESG integration involves articulating and incorporating ESG considerations into the underlying fund selection process. In this way, the selection and oversight of underlying funds may help further support strong, risk-adjusted returns. Checking the box on policies is helpful, but only actual portfolio decisions can provide the hard evidence for proper review.
17 Callan Institute, 2019 ESG Survey of 89 unique U.S. institutional investors
18 Responsible Investment Association, 2018 Canadian Responsible Investment Trends Report (October 2018)
23
05 Ongoing portfolio overview is key5.1 Continued monitoring and enhancementsConstantly evolving market conditions, opportunity sets, peer groups and capabilities present ongoing sources of risk and opportunity. Monitoring allows for the re-assessment of the investment opportunity set, inputs (risk, return, and correlation assumptions), as well as constraints. Quantitative tools can help ensure underlying assumptions are robust. Regular reassessment of the inputs used in the portfolio construction process permits TDF managers to incrementally adjust for structural market changes and incorporate investment innovations into their portfolios. This approach ensures portfolios are optimized to their objectives and minimizes drift into inefficient allocations. It also reduces the need, later on, for larger shifts in underlying investments.
5.2 Rebalancing strategy and tactical asset allocationTDF managers will adopt varying approaches to rebalance to their target strategic asset allocation. Minimizing the level of trading activity necessary to rebalance the funds is an important consideration. Using incoming cash flows and initiating rebalancing trades only where necessary to cover any residual deviations from the target allocation can help reduce portfolio drift and overall trading costs.
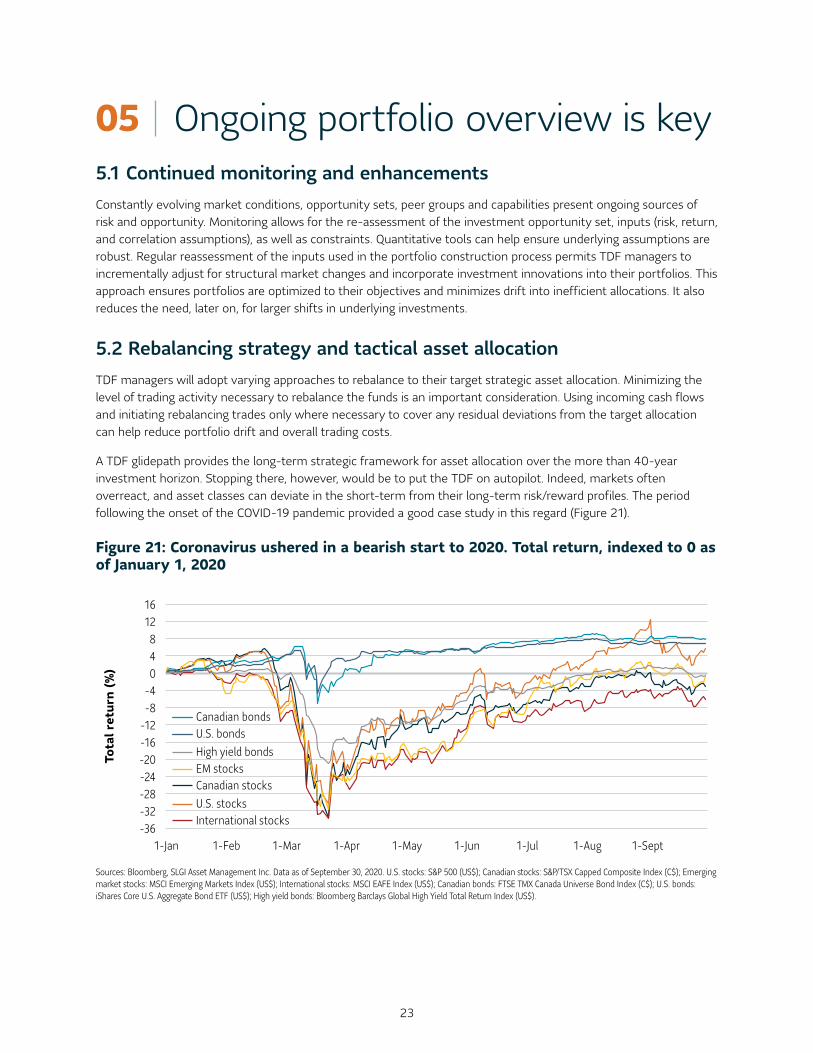
A TDF glidepath provides the long-term strategic framework for asset allocation over the more than 40-year investment horizon. Stopping there, however, would be to put the TDF on autopilot. Indeed, markets often overreact, and asset classes can deviate in the short-term from their long-term risk/reward profiles. The period following the onset of the COVID-19 pandemic provided a good case study in this regard (Figure 21).
Figure 21: Coronavirus ushered in a bearish start to 2020. Total return, indexed to 0 as of January 1, 2020
-20-24
-36-32-28
-12-8
-16
8 4 0
-4
16 12
Tota
l ret
urn
(%)
1-Jan 1-Feb 1-Mar 1-Apr 1-May 1-Jun 1-Jul 1-Aug 1-Sept
Canadian bonds
High yield bonds
U.S. stocks
U.S. bonds
Canadian stocks EM stocks
International stocks
Sources: Bloomberg, SLGI Asset Management Inc. Data as of September 30, 2020. U.S. stocks: S&P 500 (US$); Canadian stocks: S&P/TSX Capped Composite Index (C$); Emerging market stocks: MSCI Emerging Markets Index (US$); International stocks: MSCI EAFE Index (US$); Canadian bonds: FTSE TMX Canada Universe Bond Index (C$); U.S. bonds: iShares Core U.S. Aggregate Bond ETF (US$); High yield bonds: Bloomberg Barclays Global High Yield Total Return Index (US$).

24
At the time of publication of this paper, the impact on and outlook for some industries remained unclear (e.g. airlines, travel companies, restaurants, etc.). Having the flexibility to proactively adjust portfolios in the form of tactical asset allocation can be beneficial in capturing opportunities as well as managing risks and evolving the portfolios cost-efficiently. However, implementation of a tactical asset allocation process should not be confused with a simple binary decision on whether to over- or under-weight fixed income vs. equities. Consistency may be enhanced by a broad set of independent top-down decision points across different levers, such as the ability to over- or under-weight specific asset classes (e.g. Canadian equities vs. U.S. equities) or styles (e.g. active vs. passive). When properly implemented, tactical shifts to the strategic allocation based on market conditions help TDF managers to manage risk and add value across market regimes and as new risks emerge — to the benefit of plan members.
ConclusionWith global crises, a low interest rate environment and increasing life expectancy, plan members face a number of hurdles in their path towards achieving successful retirement outcomes. TDFs can play a pivotal role in helping to overcome these challenges.
As the Canadian CAP market grows in size, an evolution in TDF design is now underway. In the U.S., the passage of the Pension Protection Act (PPA) in 2006 introduced default opt-in membership provisions where plans offered a Qualified Default Investment Alternative (QDIA). TDFs were one of the three eligible QDIAs, which helped to fuel their growth towards becoming the dominant default investment option in the U.S. DC marketplace. Although QDIA status is not offered to Canadian plan sponsors, they nonetheless share many of the same goals as their U.S. counterparts when selecting and monitoring a TDF. In the intervening years, U.S. organizations such as the Defined Contribution Institutional Investment Association (DCIIA) have focused on the “institutionalization” of DC plans, using DB plans as the institutional model for retirement, with the goal of improving financial security for workers. Professionally-managed investment solutions such as TDFs are expected to play a pivotal role in this effort, as illustrated by the June 2020 Information Letter19 published by the U.S. Department of Labor (DOL) in which it was clarified that particular
private investments can be made available to DC plan members when part of a diversified portfolio. In line with the DOL guidance in the U.S., we believe that spanning a broad investment opportunity set within a diversified portfolio will be an important driver of returns (along with tactical asset allocation and active investment management), especially as the hierarchy of risk premia across asset classes shifts - sometimes rapidly - during the transition out of the COVID-19 pandemic.
This paper has sought to highlight important considerations in evaluating TDFs with the goal of meeting the retirement savings needs of plan members in an ever-changing investment environment. These include:
• How glidepath design indicates a TDF Manager’s preference for capturing growth opportunities to generate retirement wealth, balancing risk factors across the life of the TDF including during decumulation from the retirement portfolio;
• The need to consider a broad opportunity set of asset classes to seek higher risk-adjusted returns;
• How flexibility across investment styles can support efficient portfolio implementation;
• Where the reflection of shorter-term market risks and opportunities can be used as a tool to maximize risk adjusted returns; and
• The benefits of continuous research and portfolio evolution to support robust and sustainable outcomes over the more than 40-year investment time horizon.
There is considerable scope for a CAP framework to increase plan members’ likelihood of achieving sufficient levels of retirement income. Much remains beyond the scope of this paper, such as the potential for improving savings levels through recordkeeper-led initiatives like the periodic re-enrolment of plan members using TDFs as the default investment option. In the end, Canadian plan sponsors and the broader CAP community should strive to do all we can in the effort to promote plan participation, optimize investment results, and ultimately help Canadians achieve successful retirement outcomes.
19 U.S. Department of Labor, Information Letter 06-03-2020

25
IMPORTANT INFORMATION a note on how glidepath modelling is conductedGlidepath modelling is conducted using Monte Carlo simulations, based on SLGI inputs of expectations for return, standard deviation, correlation, kurtosis, and skewness. Return expectations are forward-looking, while the risk and correlation measures are historical, based on quarterly returns going back to 2006. Each return scenario is generated by taking random draws of quarterly returns from a Johnson distribution based on the inputs.
Simulated portfolio returns are applied to a portfolio value and adjusted for cash flows. In each scenario, the cash outflows are assumed to exit the portfolio at the start of each year. When adjusting for inflation, inflation is expected to be 2% but is simulated to be variable, the same as all asset classes.
Anne Meloche, FSA, FCIAHead of Institutional BusinessAnne is responsible for developing the strategy for our institutional business. She leads the national institutional sales team, who work with plan sponsors, consultants and advisors to educate and promote SLGI’s innovative solutions for group retirement platforms.
James Wells, CIM®Director, Institutional Business Development and Client RelationshipsBased in Vancouver, James is responsible for further developing and building new relationships for the firm’s growing institutional asset management business in Western Canada.
David Charland, ACIA, ASADirector, Institutional Business Development and Client RelationshipsBased in Montreal, David is responsible for further developing and building new relationships for the firm’s growing institutional asset management business in Quebec and Atlantic Canada.
Satwik Misra, CFA, MBADirector, Institutional Business Development and Client RelationshipsBased in Toronto, Satwik is responsible for further developing and building new relationships for the firm’s growing institutional asset management business in Ontario.
Contact us

/0yearsC E L E B R AT I N G
810-5049-01-21
Information contained in this whitepaper is provided for information purposes only and is not intended to provide specific financial, tax, insurance, investment, legal or accounting advice and should not be relied upon in that regard. Views expressed regarding a particular company, security, industry or market sector should not be considered an indication of trading intent of any investment fund managed or sub-advised by SLGI Asset Management Inc. These views are not to be considered as investment advice nor should they be considered a recommendation to buy or sell.
Information herein has been compiled from sources believed to be reliable as of the date of publication, but no representation or warranty, express or implied, is made with respect to its timeliness or accuracy.
This whitepaper may contain forward-looking statements about the economy, and markets; their future performance, strategies or prospects. Forward-looking statements are not guarantees of future performance and are speculative in nature and cannot be relied upon. Forward-looking statements involve inherent risks and uncertainties about general economic factors, so it is possible that predictions, forecasts, projections and other forward-looking statements will not be achieved. You are cautioned to not place undue reliance on these statements as a number of important factors could cause actual events or results to differ materially from those expressed or implied in any forward-looking statement. Before making any investment decisions, you are encouraged consider these and other factors carefully. The indicated rates of return are shown before the deduction of fees. Mutual and segregated fund values change frequently and past performance may not be repeated.
Group Retirement Services are provided by Sun Life Assurance Company of Canada. Sun Life Granite Target Date Funds are segregated funds of Sun Life Assurance Company of Canada, managed on a sub-advisory basis by SLGI Asset Management Inc. Sun Life Granite Target Risk segregated funds launched November 2009 and were managed on behalf of GRS by Sun Life Assurance Company of Canada. In 2012, Sun Life Global Investments (Canada) Inc. launched Sun Life Target Risk mutual funds, at which time the Sun Life Granite Target Risk segregated funds were closed and new funds were created that invest in mutual funds with a similar mandate to each of those funds.
Sun Life Assurance Company of Canada and its affiliated companies respectively own or properly license all the trade-marks used on or in connection with the goods and services which they provide. The trade-marks are protected by Canadian and foreign trade-mark laws. All rights reserved. Sun Life Granite Target Date Funds, Sun Life Granite Multi-Risk Target Date Funds and Sun Life Granite Target Risk Funds are segregated funds of Sun Life Assurance Company of Canada, managed on a sub-advisory basis by SLGI Asset Management Inc.
Sun Life Global Investments is a trade name of SLGI Asset Management Inc., Sun Life Assurance Company of Canada, and Sun Life Financial Trust Inc.
© SLGI Asset Management Inc., Sun Life Assurance Company of Canada, and their licensors, 2021. SLGI Asset Management Inc. and Sun Life Assurance Company of Canada are members of the Sun Life group of companies. All rights reserved.
slgiinstitutional.com