tapio salmi - Åbo akademi | startsidaweb.abo.fi/fak/tkf/tek/files/cacre_2016/cacrereactint.pdf ·...
TRANSCRIPT

Aspects on reaction intensification
Åbo AkademiLaboratory of Industrial Chemistry
and Reaction Engineering
FI-20500 Turku / Åbo Finland
Tapio Salmi

Process intensification
Structures and methods which lead to a
considerable compression of the equipment
size, and to a more efficient, selective and
clean production
Raw material Products Process

Process intensification
Intensification methods
Ultrasonic techniques
Microwave techniques
Integrated reaction and separation
Reactions under extreme conditions
Unsteady state operation
Enhancement of mass and heat transfer...

Process intensification
Intensification equipment
Structured reactors
(monoliths, foams, fibre structures, columns)
Reactors with internal heat exchangers
Microreactors
Equipment for reactive separation
Spinning disk reactors...

Reaction intensification
Intensification of the chemical reactor
performance is a vital part of chemical reaction
engineering and process intensification
Reactant molecules Product molecules Chemical reactor

Batch and continuous reactors

Three-phase reactors in laboratory scale
New catalyst materials have emerged
monoliths
fibres/cloths
foams
Benefit: low pressure drop, suppressed diffusion
resistance inside the catalyst particle
Challenge: activity, selectivity, metal particle size,
chemical state
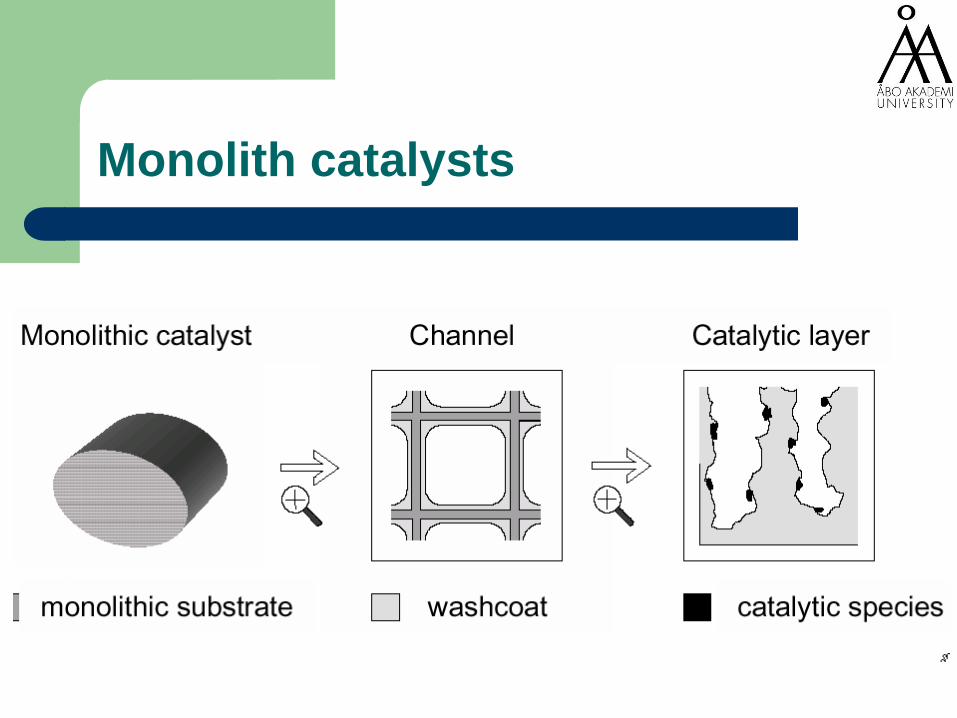
Monolith catalysts

Continuous reactor – KATAPACK column

Fibre catalysts
4 nm
TEM image of the 5 wt.% Pt/Al2O3
(Strem Chemicals) catalyst SEM image of the 5 wt.% Pt/SiO2
fiber catalyst
1 mm
125-90 m particles
D = 27%
dPt= 4 nm
D = 40%
dPt= 2.5 nm

Catalysts in micro and nanoscale
5 m
TEM image SEM image
4 nm 5 m
• 5wt.% Pt/SF (Silica fibre) 5wt.% Pt/Al2O3 (Strem)
4 nm

Reaction and mass transfer in three-phase reactors - bottlenecks
Bulk Film Bulk Film Solid

Reaction and diffusion
Even though the governing phenomena of
coupled reaction and mass transfer in porous
media are principally known since the days
of Thiele and Frank-Kamenetskii
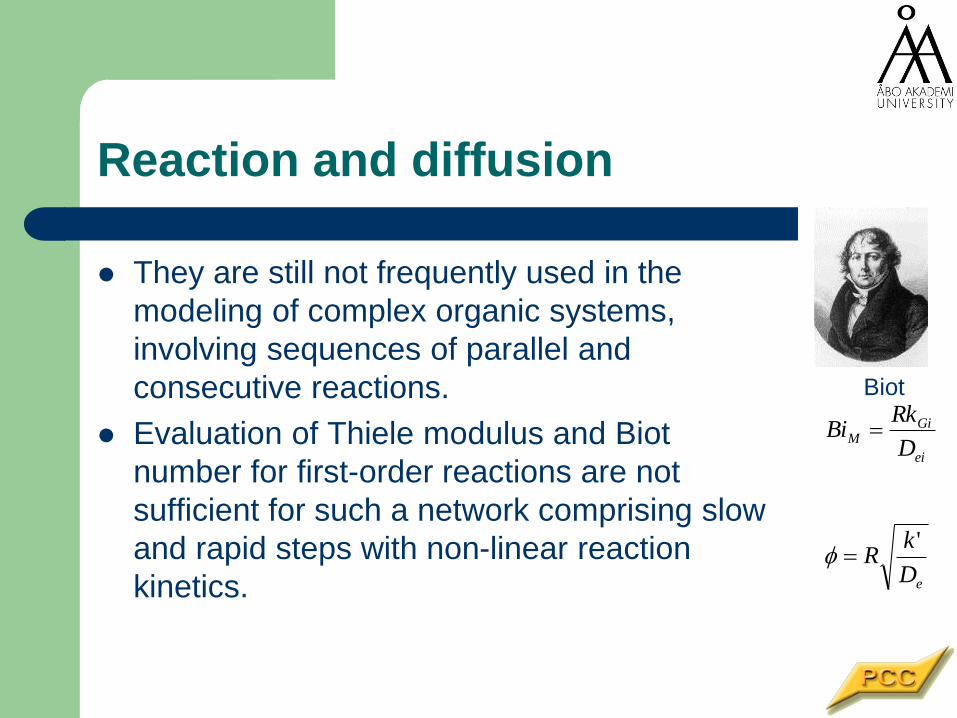
Reaction and diffusion
They are still not frequently used in the
modeling of complex organic systems,
involving sequences of parallel and
consecutive reactions.
Evaluation of Thiele modulus and Biot
number for first-order reactions are not
sufficient for such a network comprising slow
and rapid steps with non-linear reaction
kinetics.
ei
GiM
D
RkBi
Biot
eD
kR
'

Porous particle
dr
rNdrr
dt
dc S
iS
pipi 1
j
jjiji aRr
Reaction, diffusion and catalyst
deactivation in porous particles
Particle model
Rates
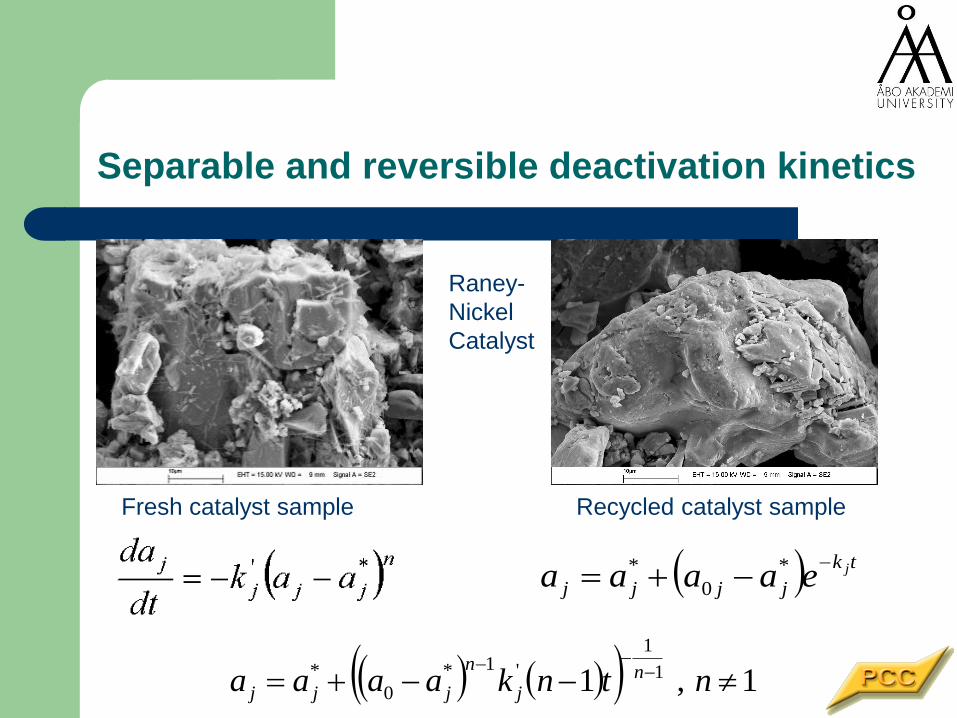
Separable and reversible deactivation kinetics
tk
jjjjjeaaaa
*
0
*
1,1 1
1
'1*
0
*
ntnkaaaa nj
n
jjj
Fresh catalyst sample Recycled catalyst sample
Raney-
Nickel
Catalyst

Porous particle model
dr
dcDN i
eii
dr
dc
r
s
dr
cdDaR
dt
dc iieijjijpp
i
2
21
, where Dei=(p/p)Dmi
0dr
dci0r
Rcckdt
dcD iiLi
Rr
iei
Rr
Boundary conditions
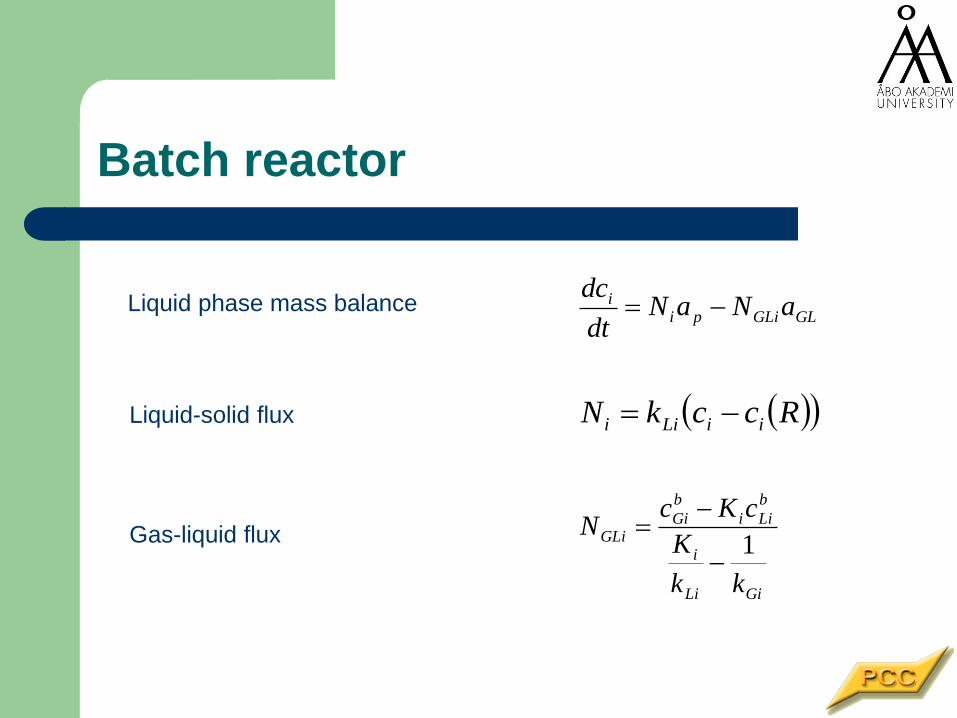
Batch reactor
GLGLipii aNaN
dt
dc
RcckN iiLii
GiLi
i
b
Lii
b
GiGLi
kk
K
cKcN
1
Liquid phase mass balance
Liquid-solid flux
Gas-liquid flux

Example systems
Hydrogenation of
Citral
Lactose O O
OH
OH
OH
OH
HO
OHOH
OH
OH
Lactose Lactitol
O O OHOH
OH
OH
HO
OHOH
OH
OH
LactulitolLactulose
O
OH
OH
HO
OH
OH
Galactose
+Glucose
OH
OH
OH
HO
OH
OH
Galactitol
OH
OH
OH
OH
OH
HO
Sorbitol
H2
H2
H2
H2
H2
Isomerization
OHˉ
Hydrolysis
O
O
O
OHHO
OH
OH
HO
HO
HO OH
O
O
O
OH
OH
OH
OH
HO
OHOH
OH
Lactobionic acid
(Na-salt)
Dehydrogenation
Hydrogenation
O
OH
OHHO
OH
OH
O
OH
O OHOH
OH
OH
HO
OHOH
OH
O
O O
OH
OH
OH
OH
HO
OHOH
OH
OH
O O
OH
OH
OH
OH
HO
OHOH
OH
OH
Lactose Lactitol
O O OHOH
OH
OH
HO
OHOH
OH
OH
O O OHOH
OH
OH
HO
OHOH
OH
OH
LactulitolLactulose
O
OH
OH
HO
OH
OH
Galactose
+Glucose
OH
OH
OH
HO
OH
OH
OH
OH
OH
HO
OH
OH
Galactitol
OH
OH
OH
OH
OH
HOOH
OH
OH
OH
OH
HO
Sorbitol
H2
H2
H2
H2
H2
Isomerization
OHˉ
Hydrolysis
O
O
O
OHHO
OH
OH
HO
HO
HO OH
O
O
O
OHHO
OH
OH
HO
HO
HO OH
O
O
O
OH
OH
OH
OH
HO
OHOH
OH
O
O
O
OH
OH
OH
OH
HO
OHOH
OH
Lactobionic acid
(Na-salt)
Dehydrogenation
Hydrogenation
O
OH
OHHO
OH
OH
O
OH
OHHO
OH
OH
O
OH
O OHOH
OH
OH
HO
OHOH
OH
O

Modelling results Citral hydrogenation
0 50 100 150 200 250 300 0
0.1
0.2
0.3
0.4
0.5
0.6
0.7
0.8
0.9
1
time (min)
Re
lative c
on
cen
tratio
n
citronellal
citral
0 0.1 0.2 0.3 0.4 0.5 0.6 0.7 0.8 0.9 1 0
0.05
0.1
0.15
0.2
0.25
Hydrogen
Citral
Citronellal
c m
ol/l
x
trilobic catalyst particle
0 50 100 150 0
0.2
0.4
0.6
0.8
1
x
Intrinsic kinetics,
thin catalyst layers concentration profiles
inside a trilobic catalyst
particle

Lactose hydrogenation to lactitol Intrinsic kinetics
0 50 100 150 200 250 3000
5
10
15
20
25
30
35
40
45
time (min)
w-%
20 bar
20 bar
70 bar
70 bar
T=110C, P=70 bar
Lactose
Lactitol

Lactose hydrogenation - diffusion
0 0.1 0.2 0.3 0.4 0.5 0.6 0.7 0.8 0.9 10
0.2
0.4
0.6
0.8
1
1.2
1.4
x
c (
mol/l)
0.03 mm
0.3 mm
0.3 mm
0.03 mm1.0 mm
1.0 mm
3.0 mm
3.0 mm
Concentration profiles
inside catalyst particle
with different particle sizes
Surface Center
Lactose
Lactitol

0 200
400 600
0
0.5
1
0
0.2
0.4
0.6
0.8
1
1.2
1.4
0 200
400 600
0
.5
1
0
0.2
0.4
0.6
0.8
1
1.2
1.4
Concentration profiles of lactose inside a catalyst particle
No deactivation Deactivation
center x x

4FeSO4 + O2 + 2HSO-4 + 2H3O
- ®
2Fe2(SO4)3 + 4H2O
Proceeds as a gas-liquid reaction but catalyst helps
Catalyst: Active carbon
Oxidation of ferrous sulphate to ferric sulphate
Simultaneous catalytic and non-catalytic reaction
FeSO4 oxidation in Katapack
Non-catalytic process can be enhanced by
addition of a heterogeneous catalyst
Diffusion resistance in catalyst particle
Gas-liquid equilibria

Kinetic model
c ck 1 + c K
)K
c c cc c( )
c
c(k
= r FeO
OO
C
3/2wFe
+w¼OFe
+w
¼O
II
III
II
2/1
2/1
Non-catalytic reaction rate
Catalytic reaction rate
) f (1
c a
a + 1
c c a = r
Fe
1
2
O2Fe2

Catalytic and noncatalytic oxidation
0 50 100 150 200 250 300 0
1
2
3
4
5
6
7
8
9
10
time/min
Fe(I
I)/w
eig
ht-
%
Experiments at 4 bar : from top 60oC, 80oC (o),
100oC (x) and 10 bar 100oC (+). Lines by simulation.

Catalyst particles
0 0.2 0.4 0.6 0.8 1 0.035
0.04
0.045
0.05
0.055
0.06
0.065
0.07
2
5 10
J =
Simulated concentration
profiles of oxygen inside
catalyst particle
0 0.2 0.4 0.6 0.8 10
0.2
0.4
0.6
0.8
1
1.2
1.4
Catalyst particle coordinate
2
510
=
Simulated concentration
profiles of Fe2+ inside catalyst
particle
r + aN aN +
dl
cdD +
dl
dcw
1 =
dt
dcnoncatiLvLiv
bLi2
Li2
LLLi
L
L
Li,
aN
dl
cdD+
dt
dcc
dl
dw+ w
dl
dc1=
dt
dcv
bLi2
Gi2
GGG
Gi2GiG
1GGi
G
Gi
r + aN aN
dl
cdD +
dl
dcw
1 =
dt
dcinoncat,vLippL2
Li2
LLLi
L
L
Li ''
'''
''
'
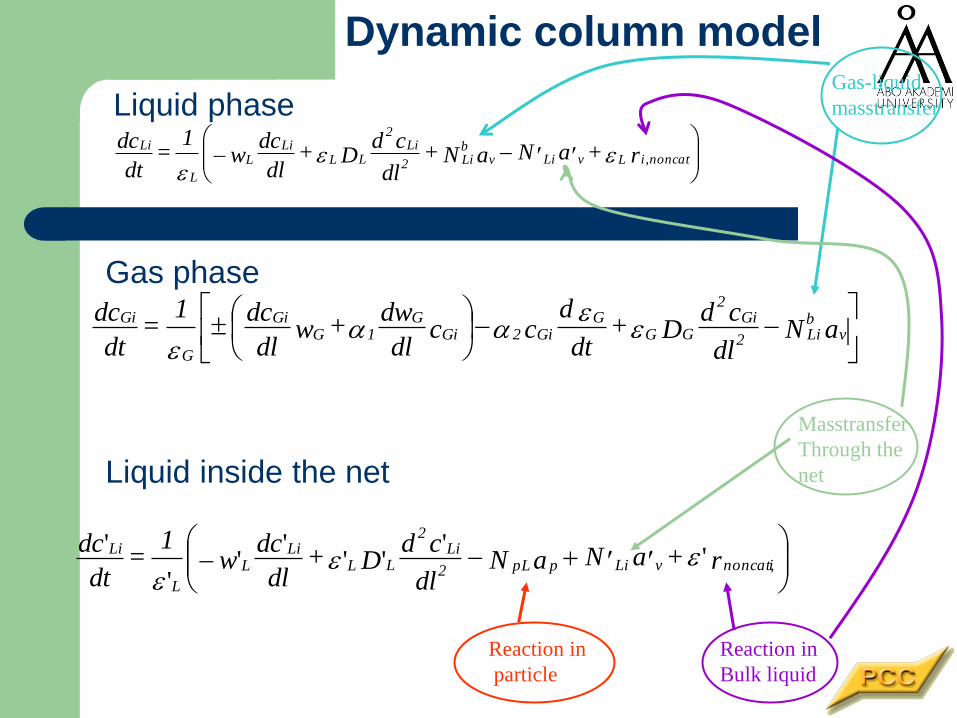
Dynamic column model
Liquid phase
Gas phase
Liquid inside the net
Gas-liquid
masstransfer
Masstransfer
Through the
net
Reaction in
particle
Reaction in
Bulk liquid
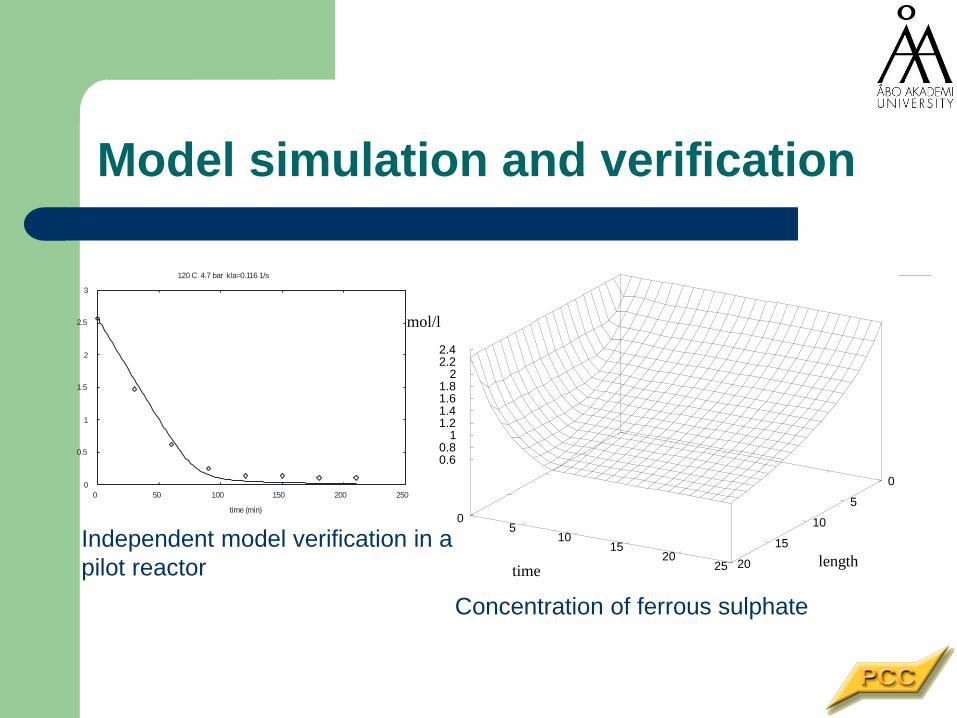
Model simulation and verification
0
5
10
15
20
05
1015
2025
0.60.8
11.21.41.61.8
22.22.4
mol/l
timelength
0
0.5
1
1.5
2
2.5
3
0 50 100 150 200 250
time (min)
120 C 4.7 bar kla=0.116 1/s
Independent model verification in a
pilot reactor
Concentration of ferrous sulphate

Catalyst reactivation and ultrasound
Deactivation is serious problem in heterogeneous catalysis
- help is needed
The aim of the study:
a) to determine the effect of ultrasound on deactivation kinetics
b) to model quantitatively the effect of ultrasound on kinetics

0 2 4 6
Time
CA
1st
3rd
2nd
4th Batch
Catalyst performance in batch
reactor
• The catalyst activity declines at each batch even at low temperatures
• The reason is very often the fouling by organic compounds
• More catalyst is added -> mass transfer limitations enter
• Can ultrasound prolong the catalyst lifetime?
A + H2 -> P

In situ ultrasound equipment
Electric
connection
HornM odified
Rushton
turbine
Pressurized
autoclaveHigh-pressure autoclave with in
situ ultrasonic irradiation system
(in-house design) :
Power input 0-100 W
Operating frequency 20kHz
Slurry reactor

Multi-transducer set-up
Generator (0-600W)
20 kHz
Reactor pot inserted
6 transducers
A time-variable
power input
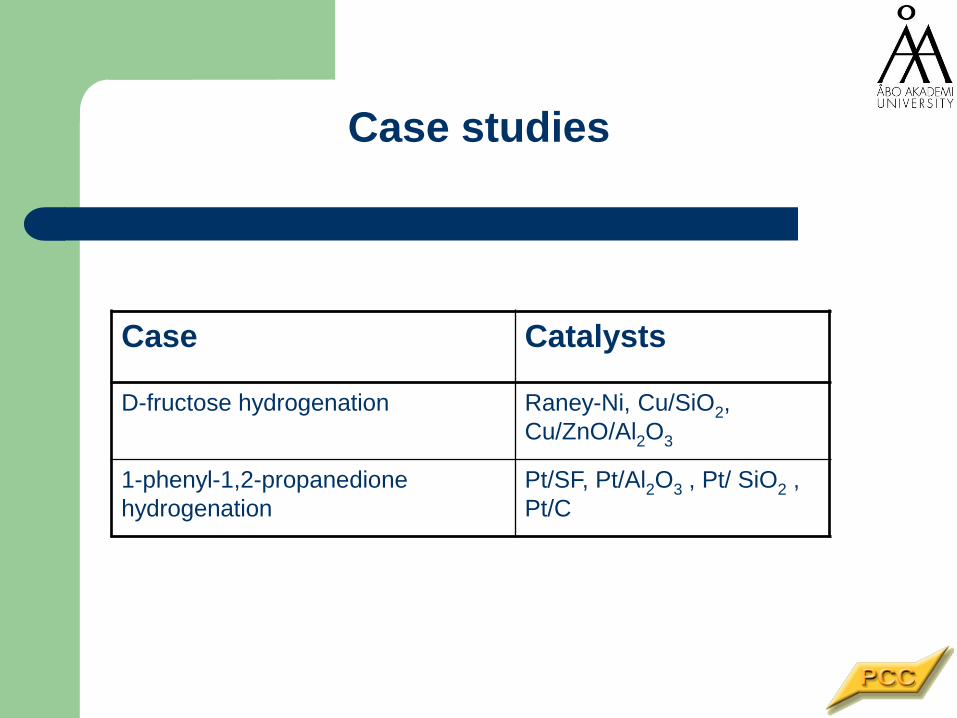
Case studies
Case Catalysts
D-fructose hydrogenation Raney-Ni, Cu/SiO2,
Cu/ZnO/Al2O3
1-phenyl-1,2-propanedione
hydrogenation
Pt/SF, Pt/Al2O3 , Pt/ SiO2 ,
Pt/C

D-fructose hydrogenation
CH2OH
C
CH
HC
O
HO
OH
HC OH
CH2OH
H2
CH2OH
CH
CH
HC
HC
CH2OH
HO
HO
OH
OH
CH2OH
HC
CH
HC
HC
CH2OH
HO
OH
OH
OH
H2
D-sorbitol
D-mannitol is a low caloric
sweetener widely used in
pharmaceutical and
alimentary industry.
D-mannitol
D-fructose

Reaction conditions
• Pressurised batch autoclave (VL=250ml)
• Stirring rate 1800 rpm
• pH2 = 30 bar
• T=110C
• Nominal ultrasound intensity 130 Wcm-2
• Solvent: deionised water
• Catalyst: Raney-Ni
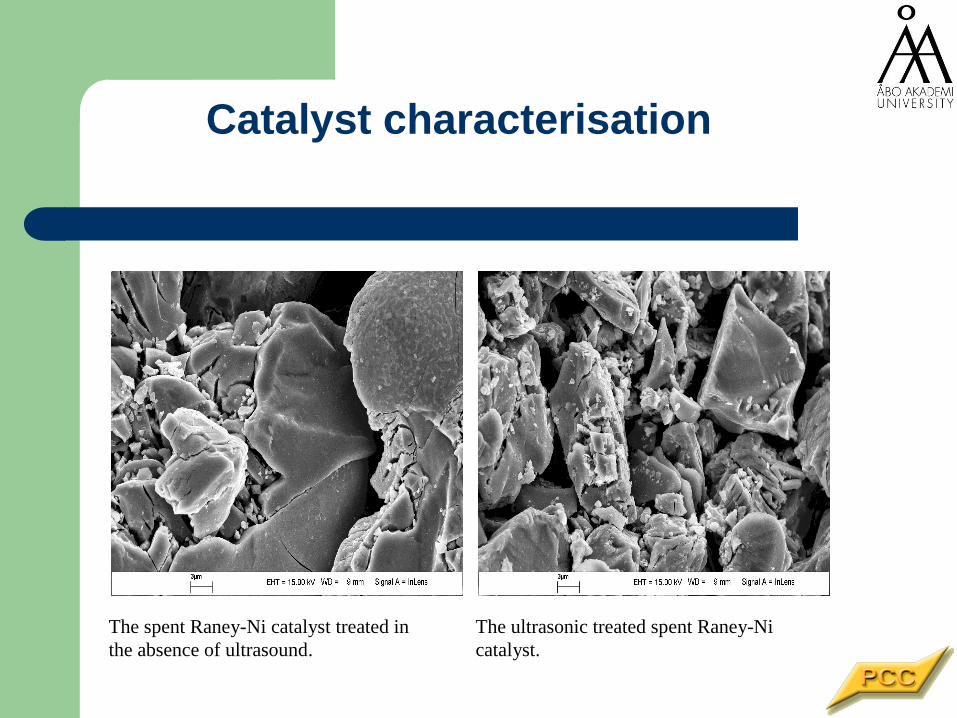
Catalyst characterisation
The spent Raney-Ni catalyst treated in
the absence of ultrasound.
The ultrasonic treated spent Raney-Ni
catalyst.

0
20
40
60
80
100
0 20 40 60 80 100 120
time (min)
Co
nve
rsio
n (
%)
3rd reuse
3rd reuse Sono
fresh Sonofresh Silent
Deactivation of re-used catalyst

)( 21 rrdt
dCB
F
F
F
CC
X0
1, tckk
F
F HBeC
C 221 )(
0
tktckkX HB
''
21 2)()1ln(
Kinetic modelling
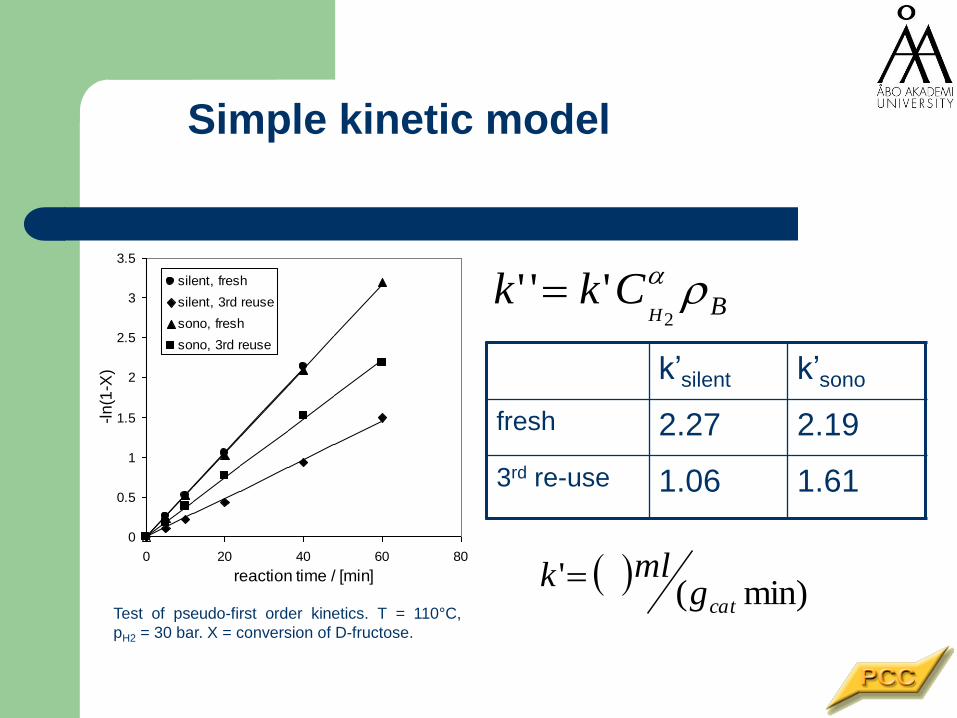
Simple kinetic model
Test of pseudo-first order kinetics. T = 110°C,
pH2 = 30 bar. X = conversion of D-fructose.
0
0.5
1
1.5
2
2.5
3
3.5
0 20 40 60 80
reaction time / [min]
-ln
(1-X
)
silent, fresh
silent, 3rd reuse
sono, fresh
sono, 3rd reuse
BHCkk
2
'''
k’silent k’sono
fresh 2.27 2.19
3rd re-use 1.06 1.61
min)(
'catg
mlk
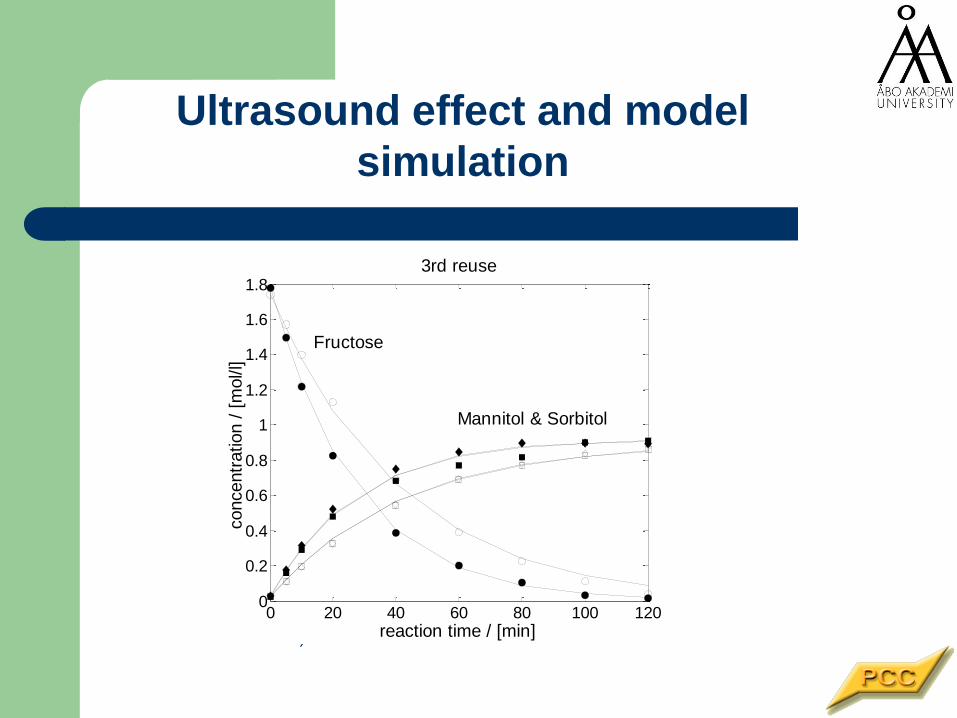
Ultrasound effect and model
simulation
Example fit using the graphically obtained rate constants,
T = 110°C, pH2 = 30 bar. (Fructose: ○ = silent, ● = ultrasound;
Mannitol: □ = silent, ■ = ultrasound; Sorbitol: ◊ = silent, ♦ =
ultrasound).
0 20 40 60 80 100 1200
0.2
0.4
0.6
0.8
1
1.2
1.4
1.6
1.8
reaction time / [min]
concentr
ation /
[m
ol/l]
3rd reuse
Mannitol & Sorbitol
Fructose

1-Phenyl-1,2-propanedione
hydrogenation
O
O
O
OH
O
OH
O
HO
O
HO
OH
HO
(B)
(C)
(D)(E)
OH
HO
HO
OH
(I) (F)
(G)(H)
(A)
OH
HO
Used for the
synthesis of several
pharmaceuticals e.g.
ephedrine...

Reaction conditions
Pressurised batch autoclave (VL=200ml)
• Stirring rate 2000 rpm
• pH2 = 10 bar
• T=15C
• Nominal ultrasound intensity 78 Wcm-2
• Catalyst modifier (M): cinchonidine cM = 0.1mg/ml
• Solvents: toluene, methyl acetate, mesitylene
N
N
OHH
Catalyst modifier
cinchonidine

The spent Pt/SF catalyst
treated in the absence of
ultrasound (SEM image).
The ultrasonic treated spent Pt/SF
catalyst (SEM image).
Catalyst characterization

Catalyst deactivation – experiments
in a fixed bed
0
10
20
30
40
0 20 40 60 80
Time-on-stream (min)
c (
mm
ol l-1
)
A
R
S
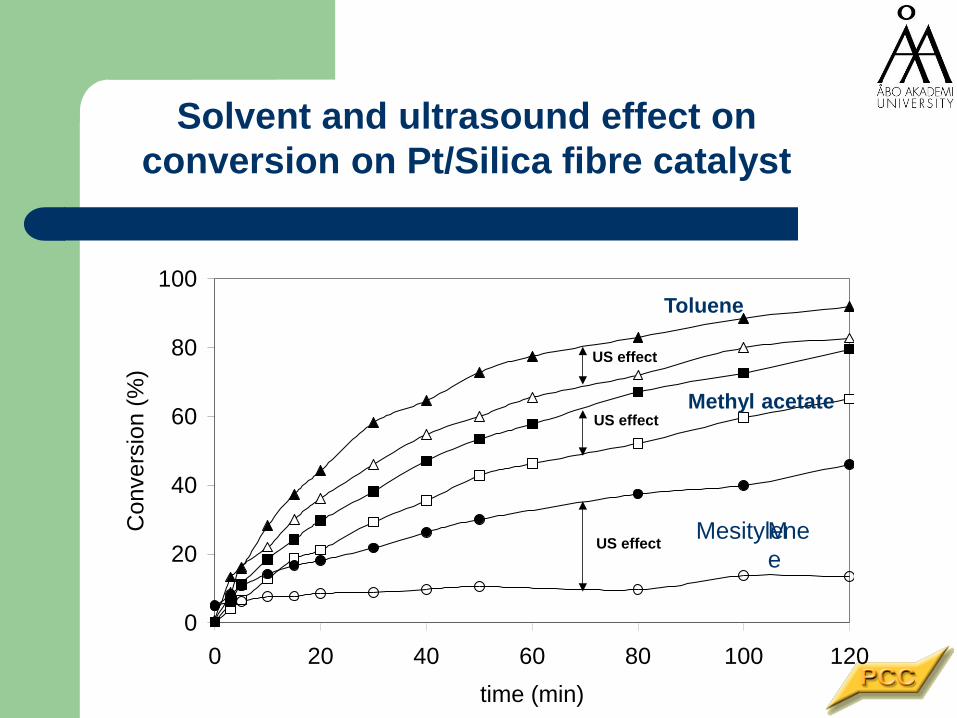
Solvent and ultrasound effect on
conversion on Pt/Silica fibre catalyst
0
20
40
60
80
100
0 20 40 60 80 100 120
time (min)
Co
nve
rsio
n (
%)
US effect
US effect
US effect
Methyl acetate
Toluene
M
e
Mesitylene

Hydrogenation kinetics of
1-phenyl-1,2-propanedione
0.000
0.005
0.010
0.015
0.020
0.025
0 20 40 60 80 100 120
time (min)
c (
mol /
dm
3)
0.000
0.005
0.010
0.015
0.020
0.025
0 20 40 60 80 100 120
time (min)
c (
mol /
dm
3)
(R )- enantiomer
(S )- enantiomer
Hydrogenation kinetics of 1-phenyl-1,2-propanedione (A) at 15°C and
6.5 bar hydrogen
A B (R)
C (S)
H2
H2
B + C
B
C
A B
C
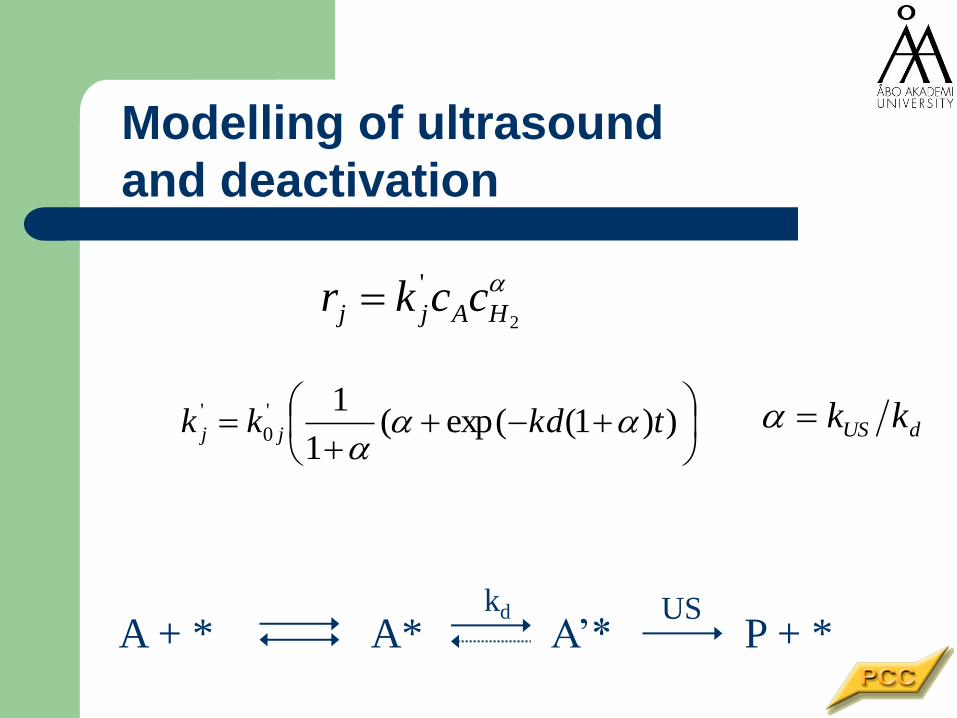
2
' HAjj cckr
))1(exp((
1
1'
0
' tkdkk jj
dUS kk
A + * A* A’* P + * kd US
Modelling of ultrasound
and deactivation

Parameter values
Solvent kd
(100*min-1)
kd,US
(100*min-1)
kd-kd,US
(100*min-1)
Toluene 1.74 1.22 0.52
Mesitylene 14.1 13.0 1.1
Methyl
acetate
1.45 1.07 0.39

Data fitting and model simulation
Batch reactor
0 20 40 60 80 100 1200
0.002
0.004
0.006
0.008
0.01
0.012
0.014
0.016
0.018
0.02
US
No US
time (min)
c (
mol/l)
A
B
C
DE A
B
C
DE
A: 1-Phenyl-1,2-propanedione, B: (R)-1-hydroxy-1-
phenylpropanone, C: (S)-1-hydroxy-1-phenylpropanone,
D+E: (R)+(S)-2-hydroxy-1-phenylpropanone
0 20 40 60 80 100 1200
0.002
0.004
0.006
0.008
0.01
0.012
0.014
0.016
0.018
0.02
c (
mol/l)
time (min)
A
B C
D+E
A, no US
A, US
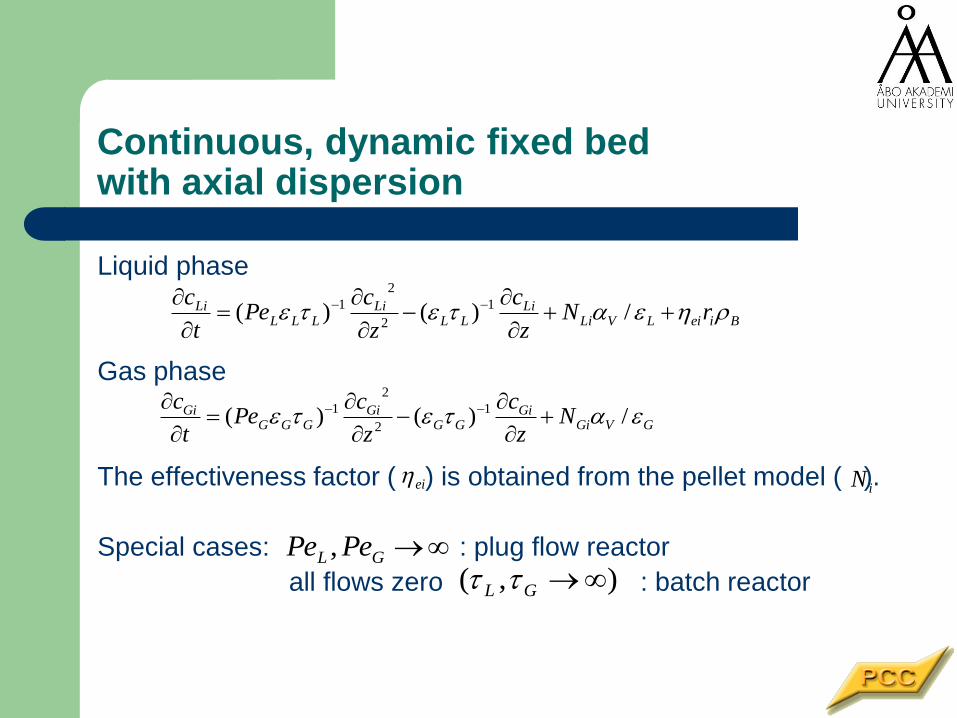
Continuous, dynamic fixed bed with axial dispersion
Liquid phase
Gas phase
The effectiveness factor ( ) is obtained from the pellet model ( ).
Special cases: : plug flow reactor
all flows zero : batch reactor
GVGiGi
GGGi
GGGGi N
z
c
z
cPe
t
c /)()( 1
2
2
1
BieiLVLiLi
LLLi
LLLLi rN
z
c
z
cPe
t
c
/)()( 1
2
2
1
eiiN
GL PePe ,),( GL

C
B
Dynamic modelling of continuous bed
Non-steady
state kinetics
in continuous
fixed bed
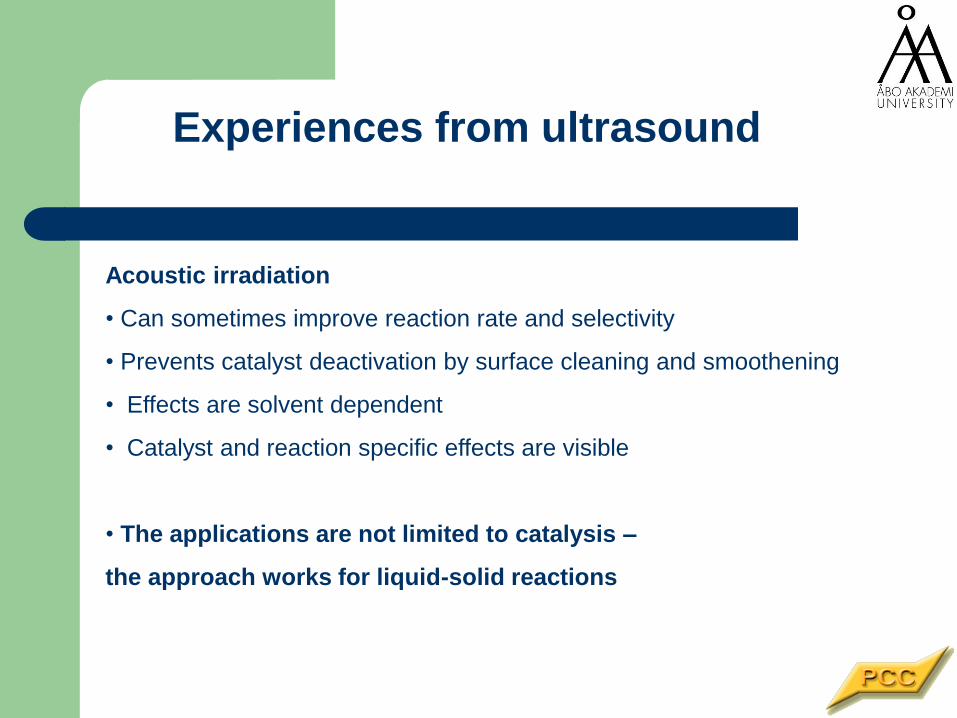
Experiences from ultrasound
Acoustic irradiation
• Can sometimes improve reaction rate and selectivity
• Prevents catalyst deactivation by surface cleaning and smoothening
• Effects are solvent dependent
• Catalyst and reaction specific effects are visible
• The applications are not limited to catalysis –
the approach works for liquid-solid reactions

Conclusions and future aspects
Reaction intensification is a part of process intensification – keep the entire process in mind
Fundamental understanding on kinetics, thermodynamics, flow structures should be the basis of reaction intensification
A lot of reactor and catalyst structures are available – they shoud be evaluated critically
Intensification methods are very promising, but scale-up is a challenge
Implementation of catalysts is an intensification approach as such
Active search for new application areas is needed
More imagination is needed

A structured reactor
Design by Victor Vasarely (1908-1997 )
A famous Hungarian-French painter
”Colours are the vitamines of our life”
Art shows the way
Thank you for your kind attention
Laboratory of Industrial Chemistry and Reaction Engineering