tap research summary - niet · tap research summary ... the online portal which houses hundreds of...
TRANSCRIPT

DECEMBER 2017
TAP Research Summary Examining the Evidence for the Impact of TAP: The System for
Teacher and Student Advancement
NATIONAL INSTITUTE FOR EXCELLENCE IN TEACHING 1
TAP Research Summary
Researchers at NIET and elsewhere have studied the effectiveness of TAP: The System for Teacher and Student Advancement in raising student achievement, improving the quality of instruction, andincreasing the ability of high-need schools to recruit, retain and support effective teachers. This document describes some of the most recent results that have emerged from the research on the TAP System to date. Data collection and analysis efforts are ongoing, and the findings described here will be updated periodically as information becomes available.
Table of Contents NIET Mission................................................................................................................................................. 3
TAP: The System for Teacher and Student Advancement Description .................................................... 3
Educator Effectiveness Best Practices Center Description ...................................................................... 4
NIET Initiative Comparisons and Results .................................................................................................. 4
TAP System Evaluation Methods Compared to Traditional Evaluation Methods ................................... 4
TAP Teachers Demonstrate Consistent Improvement across Time ........................................................ 5
TAP Impact in Schools and Districts ............................................................................................................. 7
Results from Prior Selected Studies of TAP’s Impact ................................................................................... 7
Results from New Selected Studies of TAP’s Impact .................................................................................... 9
TAP System Perspectives: Teacher Perceptions of the TAP Systems across Time .................................. 9
Impact of the TAP System on Student Achievement in Louisiana .........................................................11
Impact of the TAP System on Student Achievement in Slaton ISD ........................................................12
Project Spotlight: Impact of the Leadership Instruction for Teachers (LIFT) Program ..............................13
National TAP Attitude Survey – 2017.........................................................................................................15
Teacher Results – 2017 TAP Attitude Survey .........................................................................................15
Administrator Results – 2017 TAP Attitude Survey ...............................................................................18
Upcoming Projects .....................................................................................................................................19
Voices in the Field: National Study of Educator Views of Teacher Leadership......................................19
Impact of an Educator Effectiveness System on Retaining Administrators Nationwide .......................19
Conclusion ..................................................................................................................................................19
Acknowledgements ....................................................................................................................................20
About the Authors .....................................................................................................................................20
References .................................................................................................................................................21

NATIONAL INSTITUTE FOR EXCELLENCE IN TEACHING 2
Table of Figures Figure 1. Traditional Teacher Evaluation Scores. .................................................................................................. 4
Figure 2. Observational Ratings of Teachers in TAP Schools Using TAP Teaching Standards Rubric. .................. 5
Figure 3. Teacher Instructional Improvement across Time. ................................................................................. 6
Figure 4. Student Achievement Growth by TAP System Status. ........................................................................... 6
Figure 5. Levels of Teacher Reported Support for TAP System Core Elements over Time. .................................. 9
Figure 6. Teachers’ Perceptions of TAP System Impact on Teacher Practices and Student Achievement......... 10
Figure 7. Student Performance Growth in Louisiana TAP and Matched Comparison Schools. .......... 11
Figure 8. Student Performance Growth Statewide, in Slaton ISD, and in Slaton Junior High. ........... 12
Figure 9. Application Material and Interview Scores for Candidates in LIFT Program, by Admission Status. .... 13Figure 10. T-PESS Scores among Principal Fellows, 2016-17 Cohort. ................................................................. 14
Figure 11. Principal Fellows’ Coaching Skills, 2016-17 Cohort. ........................................................................... 14
Figure 12. Principal Fellows’ Perception of the LIFT Program, 2016-17 cohort. ................................................ 15Figure 13. Level of Reported Support for Collegiality from Teachers Nationwide. ............................................ 15
Figure 14. Level of Reported Support for Multiple Career Paths from Teachers Nationwide............................ 16
Figure 15. Level of Reported Support for Ongoing Applied Professional Growth from Teachers Nationwide. . 16
Figure 16. Level of Reported Support for Instructionally Focused Accountability from Teachers Nationwide. 17
Figure 17. Level of Reported Support for Performance-Based Compensation from Teachers Nationwide. ..... 17
Figure 18. Administrator Survey Results on TAP Outcomes in their Schools. .................................................... 18
Figure 19. “The implementation of TAP has helped retain effective teachers at my school.” ............................ 18
NATIONAL INSTITUTE FOR EXCELLENCE IN TEACHING 3
NIET Mission
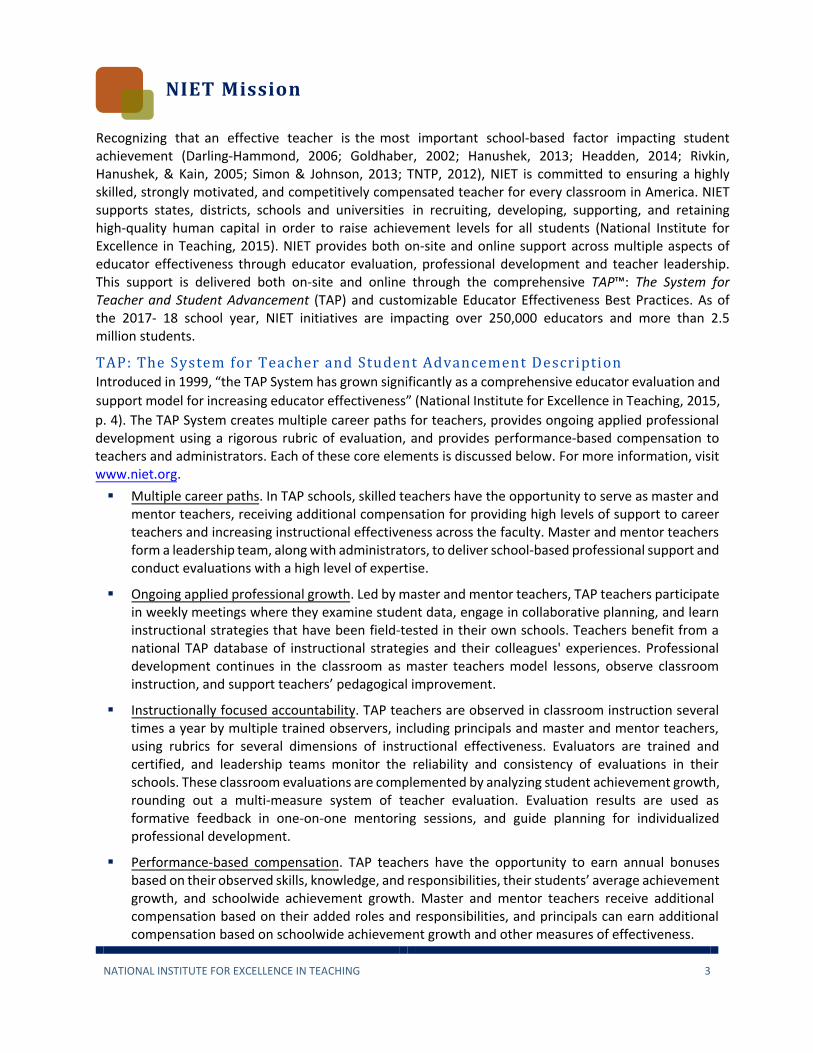
Recognizing that an effective teacher is the most important school-based factor impacting student achievement (Darling-Hammond, 2006; Goldhaber, 2002; Hanushek, 2013; Headden, 2014; Rivkin, Hanushek, & Kain, 2005; Simon & Johnson, 2013; TNTP, 2012), NIET is committed to ensuring a highly skilled, strongly motivated, and competitively compensated teacher for every classroom in America. NIET supports states, districts, schools and universities in recruiting, developing, supporting, and retaining high-quality human capital in order to raise achievement levels for all students (National Institute for Excellence in Teaching, 2015). NIET provides both on-site and online support across multiple aspects of educator effectiveness through educator evaluation, professional development and teacher leadership. This support is delivered both on-site and online through the comprehensive TAP™: The System for Teacher and Student Advancement (TAP) and customizable Educator Effectiveness Best Practices. As of the 2017- 18 school year, NIET initiatives are impacting over 250,000 educators and more than 2.5 million students.
TAP: The System for Teacher and Student Advancement Description Introduced in 1999, “the TAP System has grown significantly as a comprehensive educator evaluation and
support model for increasing educator effectiveness” (National Institute for Excellence in Teaching, 2015,
p. 4). The TAP System creates multiple career paths for teachers, provides ongoing applied professional development using a rigorous rubric of evaluation, and provides performance-based compensation to teachers and administrators. Each of these core elements is discussed below. For more information, visit www.niet.org.
Multiple career paths. In TAP schools, skilled teachers have the opportunity to serve as master and mentor teachers, receiving additional compensation for providing high levels of support to career teachers and increasing instructional effectiveness across the faculty. Master and mentor teachers form a leadership team, along with administrators, to deliver school-based professional support and conduct evaluations with a high level of expertise.
Ongoing applied professional growth. Led by master and mentor teachers, TAP teachers participate in weekly meetings where they examine student data, engage in collaborative planning, and learn instructional strategies that have been field-tested in their own schools. Teachers benefit from a national TAP database of instructional strategies and their colleagues' experiences. Professional development continues in the classroom as master teachers model lessons, observe classroom instruction, and support teachers’ pedagogical improvement.
Instructionally focused accountability. TAP teachers are observed in classroom instruction several times a year by multiple trained observers, including principals and master and mentor teachers, using rubrics for several dimensions of instructional effectiveness. Evaluators are trained and certified, and leadership teams monitor the reliability and consistency of evaluations in their schools. These classroom evaluations are complemented by analyzing student achievement growth, rounding out a multi-measure system of teacher evaluation. Evaluation results are used as formative feedback in one-on-one mentoring sessions, and guide planning for individualized professional development.
Performance-based compensation. TAP teachers have the opportunity to earn annual bonuses based on their observed skills, knowledge, and responsibilities, their students’ average achievement growth, and schoolwide achievement growth. Master and mentor teachers receive additional compensation based on their added roles and responsibilities, and principals can earn additional compensation based on schoolwide achievement growth and other measures of effectiveness.

NATIONAL INSTITUTE FOR EXCELLENCE IN TEACHING 4
Educator Effectiveness Best Practices Center Description The NIET Educator Effectiveness Best Practices Center provides innovative services, support, and solutions to schools, districts, and states to improve educator effectiveness. Based on two decades of experience in schools across the country, NIET works with its partners to redesign educator evaluation, deliver effective professional development, implement performance-based compensation systems, and train teacher leaders in schools. NIET offers a network of expert trainers and access to a range of innovative web-based resources and tools. For more information, visit www.niet.org/best-practices-center.
NIET Initiative Comparisons and Results
Since 1999, the TAP System of comprehensive educator effectiveness has operated across multiple states in hundreds of schools. TAP has grown steadily in the number of schools participating, the majority of which are high-need schools (over 90% of participating schools). In addition to schools and districts implementing the full TAP System, a number of states, districts, and schools are using TAP System core elements – in particular, the online portal which houses hundreds of hours of effective teaching across subjects and grade levels, the TAP teacher observational rubric, and the certification and recertification process for educator evaluators.
TAP System Evaluation Methods Compared to Traditional Evaluation Methods To improve the quality of classroom instruction, the quality of each teacher’s instruction must be assessed. Traditional school systems have not been successful at measuring and assessing classroom instruction. TNTP (formerly The New Teacher Project) published a revealing report in 2009 showingthat schools fail to evaluate their teachers in any meaningful way (Weisberg, Sexton, Mulhern, & Keeling, 2009). As TNTP reported, most teachers were rated at the very highest levels (replicated as Figure 1 below), despite the fact that most schools were not performing at these highest levels on achievement indicators.
A 2014 report from the National Council on Teacher Quality (NCTQ, 2014) indicated that while improvements in educator evaluation have occurred since the 2009 report, still many of the same problems persist. Given that differences in teacher effectiveness represent the single most important school-related factor affecting student learning, accurately measuring differences in teacher performance
is critical to the improvement of teaching and learning.
Figure 1. Traditional Teacher Evaluation Scores. 1
1 Teacher evaluation in five urban school districts, based on data taken from
https://tntp.org/assets/documents/TheWidgetEffect_2nd_ed.pdf. Scores on a 3-point and 4-point scale have been
interpolated to a 5-point scale using a cumulative probability density function based on reported data.
3% 5%11%
23%
63%
0%
10%
20%
30%
40%
50%
60%
70%
Lowest Ratings Middle Ratings Highest Ratings
Percent of Teachers
Teacher Evaluation Rating

NATIONAL INSTITUTE FOR EXCELLENCE IN TEACHING 5
In contrast to traditional evaluation methods noted previously in Figure 1, the TAP System has developed a comprehensive approach to teacher evaluation and incentives that depends on multiple measures of both teaching practice and teaching outcomes. This system provides differentiated feedback for teacher improvement, in contrast to the often inflated ratings found in evaluation systems (see Figure 2).
Teacher Skills, Knowledge, and Responsibilities distribution of TAP evaluations using 1-5 scale in half-point increments. Figure based on 7,159 teachers and approximately 20,077 observations, 2016-17.
Figure 2. Observational Ratings of Teachers in TAP Schools Using TAP Teaching Standards Rubric.
The above ratings are based only on the classroom evaluation component of the TAP System, before considering student learning growth measures. Teachers are observed several times a year by multiple trained and certified raters who consider 19 areas of effective instructional practice. These observers use a multi-dimensional, research-based set of standards and rubrics that are fair, transparent, and curriculum-independent. Results are provided immediately as feedback to the teacher in post- observation mentoring sessions. The scores from all observations of these 19 classroom indicators are combined with seven responsibility indicators at the end of the school year to create an overall Skills, Knowledge, and Responsibilities (SKR) score for each teacher. On a scale of 1.0 to 5.0, 1 represents unsatisfactory performance on a certain standard, 3 represents proficiency on that standard, and 5 represents exemplary performance on that standard. Teachers earn scores in increments of 0.5.
TAP Teachers Demonstrate Consistent Improvement across Time
TAP results show a steady improvement in observed skills during the course of the school year. Figure 3
shows recent improvement for teachers in TAP nationally. This shows the improvement in instructional
quality scores over a two-year period. In the data shown, despite a slight dip over the summer, teachers
demonstrated an overall path of improvement that continued over both years. This graph is based on a
sample including all TAP schools during the years 2015-2017.
We tracked a cohort of 1,305 career teachers through observations grouped into six periods in fall, winter and spring of the 2015-16 and 2016-17 school years. The cohort was composed of teachers working in TAP schools both years, with observations in each of the observation periods. Teachers present in only one school year or who lacked an observation in one of the quarters were excluded from the sample.
0.0% 0.4%2.5%
12.3%
33.6%
30.4%
15.9%
4.7%
0.2%0%
5%
10%
15%
20%
25%
30%
35%
40%
1 1.5 2 2.5 3 3.5 4 4.5 5
Percent of Teachers
SKR Score
NATIONAL INSTITUTE FOR EXCELLENCE IN TEACHING 6
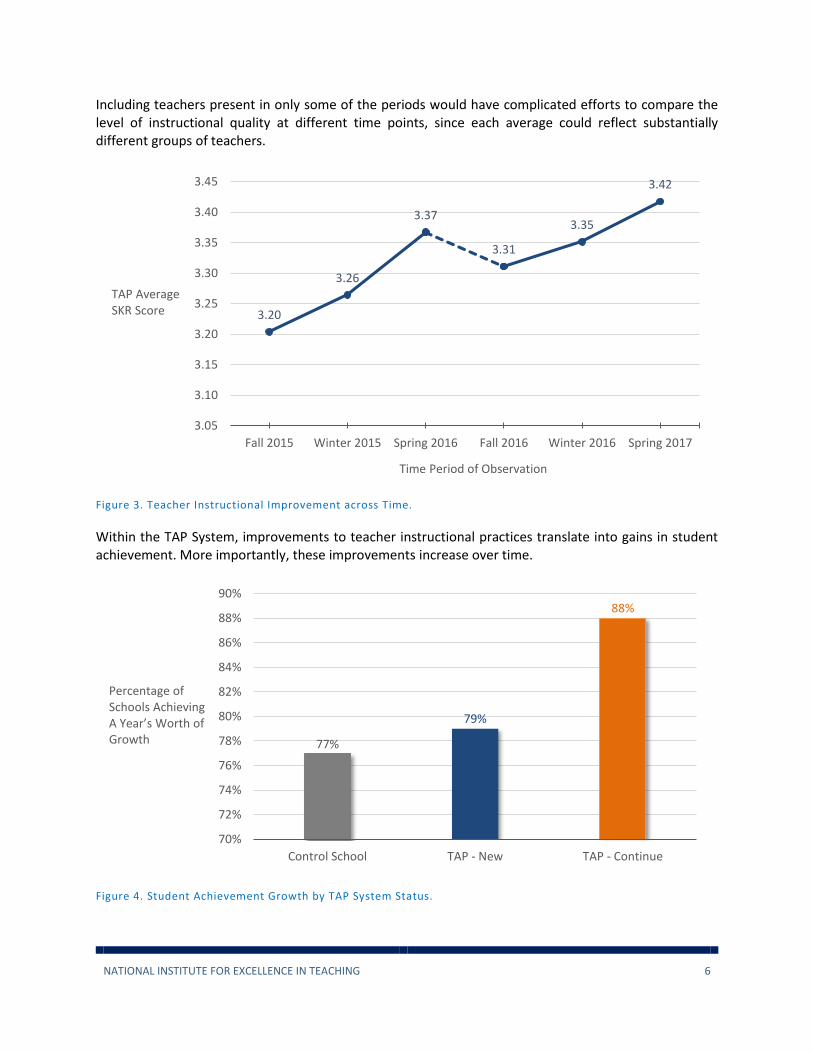
Including teachers present in only some of the periods would have complicated efforts to compare the level of instructional quality at different time points, since each average could reflect substantially different groups of teachers.
Figure 3. Teacher Instructional Improvement across Time.
Within the TAP System, improvements to teacher instructional practices translate into gains in student achievement. More importantly, these improvements increase over time.
Figure 4. Student Achievement Growth by TAP System Status.
3.20
3.26
3.37
3.31
3.35
3.42
3.05
3.10
3.15
3.20
3.25
3.30
3.35
3.40
3.45
Fall 2015 Winter 2015 Spring 2016 Fall 2016 Winter 2016 Spring 2017
TAP Average SKR Score
Time Period of Observation
77%
79%
88%
70%
72%
74%
76%
78%
80%
82%
84%
86%
88%
90%
Control School TAP - New TAP - Continue
Percentage of Schools AchievingA Year’s Worth of Growth

NATIONAL INSTITUTE FOR EXCELLENCE IN TEACHING 7
TAP Impact in Schools and Districts
A notable success of the TAP System is the expanding preponderance of performance data that comes from examining the impact of the system across multiple locations and conducted by different researchers using varied methodological frameworks (Algiers Charter School Association, 2011; Barnett, Hudgens, & Logis, 2017; Barnett, Hudgens, Logis, & Alexander, 2016; Barnett, Hudgens, & Alexander, 2016; Barnett, Rinthapol, & Alexander, 2015; Barnett, Rinthapol, & Hudgens, 2014; Barnett, Wills, Hudgens, & Alexander, 2015; Buck & Coffelt, 2013; Daley & Kim, 2010; Hudson, 2010; Schacter & Thum, 2005; Schacter et al., 2002; Schacter, Thum, Reifsneider, & Schiff, 2004; Solmon, White, Cohen, & Woo, 2007). The next section discusses several of these studies demonstrating the impact of the TAP System. Following this review, three new studies, a project spotlight, and results from the 2017 TAP Attitude Survey are presented.
Results from Prior Selected Studies of TAP’s Impact In 2004, Schacter et al. examined the impact of the TAP System across 11 schools. This was a follow-
up study of their 2002 study in which the authors conducted a statewide cluster analysis to analyzethe growth in achievement of students and found that TAP schools made significantly higherimprovements in student achievement gains. In the follow-up study, the same cluster level analysiswith multi-level multivariate analyses were employed using all available covariates to compare growthbetween the TAP and control schools. Results from the study indicate that 65% of the TAP schoolsoutperformed their matched controls in reading, language, and mathematics achievement, with themagnitude of change ranging from 6% to 46%. The teacher satisfaction component of this studyindicated strong support for the four core principles of the TAP System.
In 2007, Solmon et al. analyzed the impacts of the TAP System in terms of value-added gain scoresacross 650 classrooms in six states, including 61 TAP schools and 285 control schools. Researchersanalyzed the student achievement gains at two levels of comparison—teacher-to- teacher and school-to-school. To evaluate TAP teachers (and similarly in evaluating TAP schools), researchers calculatedthe effect of each teacher on student progress as assessed by the difference between the actualaverage scores of the teacher’s students and the expected average scores of those students (asderived from previous scores). Through this process, researchers created a statistical control groupfor the TAP teachers based on performance. Results of the study indicate that in every state more TAPteachers demonstrated statistically significant at or above average amount of student achievementgrowth than control group teachers. Further, TAP schools outperformed their controls in 57% of thecategories in math and in 67% of the categories in reading.
In 2010, Hudson examined the effect of the TAP System on student achievement across 151 schoolsin 10 states. Hudson used a statistical control matching method to ensure that the TAP schools andthe comparison schools were equivalent prior to the intervention being implemented. Hudson alsoused a differences-in-differences approach to further account for any differences between the groupsand to ensure that the evaluation was able to isolate the impact of the program. Results of the studyindicate that students in TAP schools outperformed students in comparison schools by approximately0.15 standard deviations in mathematics, and smaller effects but in favor of the TAP schools inreading. Hudson explains these findings in context to other education interventions by noting that“the estimated effect of TAP on mathematics achievement is more than twice as large [as class sizereduction effects]” (p. 28).
Mann, Leutscher, and Reardon (2013) examined the impact of the TAP System across 15 schools inLouisiana. In order to determine impact, a one-to-one nearest-neighbor matching algorithm withreplacements was created to find a comparison school for each TAP school. Based on the propensity

NATIONAL INSTITUTE FOR EXCELLENCE IN TEACHING 8
scores computed using the selection model, the algorithm chooses the non-TAP school with the propensity score closest to the propensity score of the TAP school. There was no significant difference between the TAP schools and their matched comparison schools in the pretreatment year, t(26) =0.080, p > 0.05. However, results of the study indicate that in the four primary subjects assessed, therewas a significant effect in favor of the TAP schools for ELA: F(1, 6421) = 6.334, p = 0.012; Mathematics:F(1, 6421) = 86.386, p < 0.001; Science: F(1, 7084) = 31.792, p < 0.001; and Social Studies: F(1, 7085)= 87.411, p < 0.001]. Further, the study examined the impact of the TAP System across time to findthat the TAP schools significantly outperform comparison schools, F(1, 24) = 5.30, p < 0.05. The studyalso found that 92% of teachers reported that TAP made a positive difference on student achievement in their school and 91% reported that the AYP status was improved as a result of the TAP System.
In their 2014 study, Barnett and Hudgens drew upon a sample of 12,095 teacher-level records,representing 413 schools in 10 states, to examine teacher retention rates in schools that implementedthe TAP System during the 2010-11, 2011-12, and 2012-13 school years. Counter to national trends,the authors found that TAP System schools retain 14% more teachers than similar high-needcomparison schools and 10% more than the national average. Furthermore, the results indicateteachers retained in TAP schools become more effective over time as measured by observational andvalue-added scores.
In 2014, Barnett, Wills, and Kirby evaluated the impact of the TAP System across 66 schools inLouisiana using two rigorous analytic strategies. First, the authors employed a linear regression tocompare 2012-13 Assessment Index (AI) performance of the 66 TAP schools and non-TAP schoolsstatewide, controlling for prior (2010-11) achievement, percentage of students receiving free orreduced-price lunch, school configuration, school size (number of students), and percentage of Englishlanguage learners. Controlling for the covariates, implementation of the TAP System showed asignificant positive effect on 2012-13 achievement: the 66 TAP schools scored 3.7 points higher onaverage than non-TAP schools (p < .01). Second, the authors compared the 66 TAP schools with apropensity score matched group of non-TAP schools. The average 2012-13 AI for TAP schools (64.45)was 5.47 points greater than the average for the matched controls (58.98).
Barnett and Wills (2016a) examined the impact of the TAP System on Black-White and Hispanic-Whiteachievement gaps in Indiana schools. First, the authors compared achievement gaps in 32 TAP schoolsthat began implementing TAP in school year 2010-11 with other Indiana schools. Study results indicateTAP schools have narrowed the Black-White gap in ELA and Hispanic-White gap in ELA and math morethan other Indiana schools have. Second, the authors selected propensity score matched controlschools separately for 1) the 20 TAP schools reporting data for Black and White students in 2009-10and 2013-14, 2) the 24 TAP schools reporting data for Hispanic and White students in 2009-10 and2013-14. Study results indicate TAP schools outperformed their matched schools; while achievementgaps at the TAP schools narrowed, most gaps at the matched schools widened.
Barnett and Wills (2016b) investigated the stability over time of classroom observation scores fromthe TAP System rubric, as well as the relationships between TAP observational scores and value-addedmeasures. The correlations between average SKR scores in the 2010-11, 2011-12, and 2012-13 schoolyears were highly significant and large, particularly for consecutive school years. Further, theexamination of correlations between average SKR scores and classroom value-added scores in the2010-11, 2011-12, and 2012-13 school years revealed highly significant correlations. To put thesefindings into context, the authors examined the reported correlations across other observationalmeasures used in large-scale research studies and discovered these correlations exceed or match therange reported in recent literature – evidence that the TAP observation rubric measures aspects ofteacher practice that contribute to improved student test performance.
NATIONAL INSTITUTE FOR EXCELLENCE IN TEACHING 9
Results from New Selected Studies of TAP’s Impact
TAP System Perspectives: Teacher Perceptions of the TAP Systems across Time
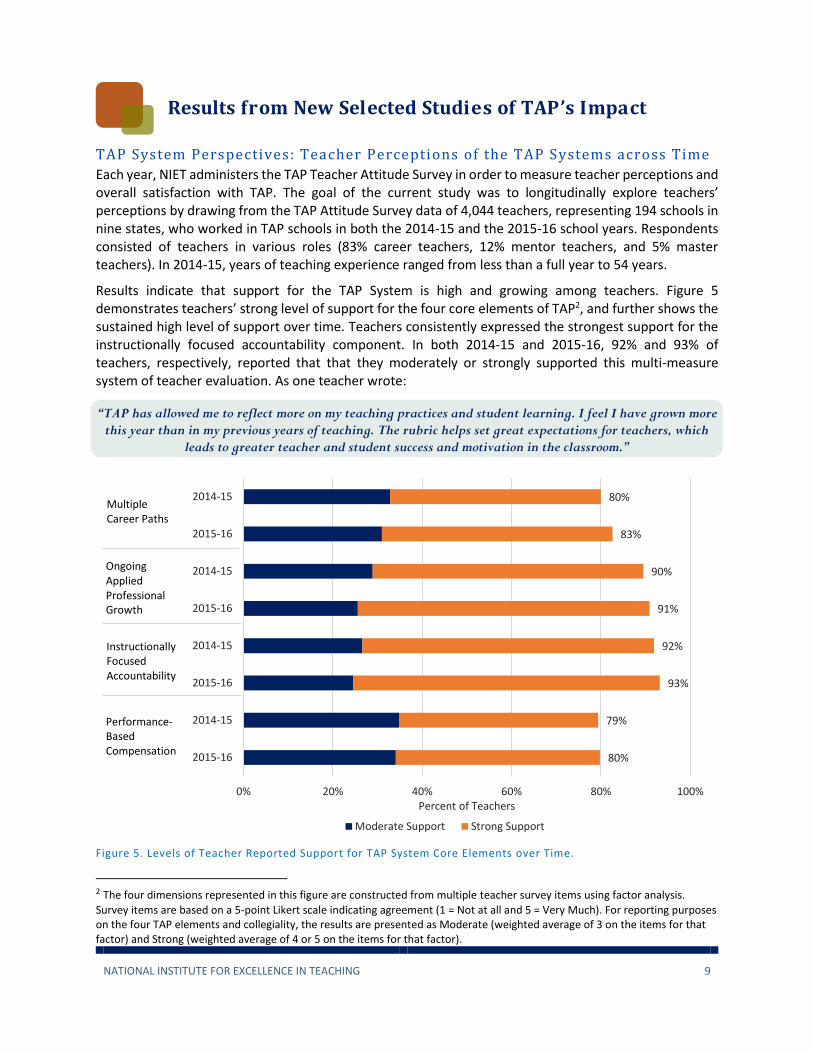
Each year, NIET administers the TAP Teacher Attitude Survey in order to measure teacher perceptions and overall satisfaction with TAP. The goal of the current study was to longitudinally explore teachers’ perceptions by drawing from the TAP Attitude Survey data of 4,044 teachers, representing 194 schools in nine states, who worked in TAP schools in both the 2014-15 and the 2015-16 school years. Respondents consisted of teachers in various roles (83% career teachers, 12% mentor teachers, and 5% master teachers). In 2014-15, years of teaching experience ranged from less than a full year to 54 years.
Results indicate that support for the TAP System is high and growing among teachers. Figure 5 demonstrates teachers’ strong level of support for the four core elements of TAP2, and further shows the sustained high level of support over time. Teachers consistently expressed the strongest support for the instructionally focused accountability component. In both 2014-15 and 2015-16, 92% and 93% of teachers, respectively, reported that that they moderately or strongly supported this multi-measure system of teacher evaluation. As one teacher wrote:
“TAP has allowed me to reflect more on my teaching practices and student learning. I feel I have grown more this year than in my previous years of teaching. The rubric helps set great expectations for teachers, which
leads to greater teacher and student success and motivation in the classroom.”
Figure 5. Levels of Teacher Reported Support for TAP System Core Elements over Time.
2 The four dimensions represented in this figure are constructed from multiple teacher survey items using factor analysis.
Survey items are based on a 5-point Likert scale indicating agreement (1 = Not at all and 5 = Very Much). For reporting purposes on the four TAP elements and collegiality, the results are presented as Moderate (weighted average of 3 on the items for that factor) and Strong (weighted average of 4 or 5 on the items for that factor).
80%
79%
93%
92%
91%
90%
83%
80%
0% 20% 40% 60% 80% 100%
2015-16
2014-15
2015-16
2014-15
2015-16
2014-15
2015-16
2014-15
Percent of Teachers
Moderate Support Strong Support
Multiple Career Paths
Ongoing Applied Professional Growth
Instructionally Focused Accountability
Performance-Based Compensation
NATIONAL INSTITUTE FOR EXCELLENCE IN TEACHING 10
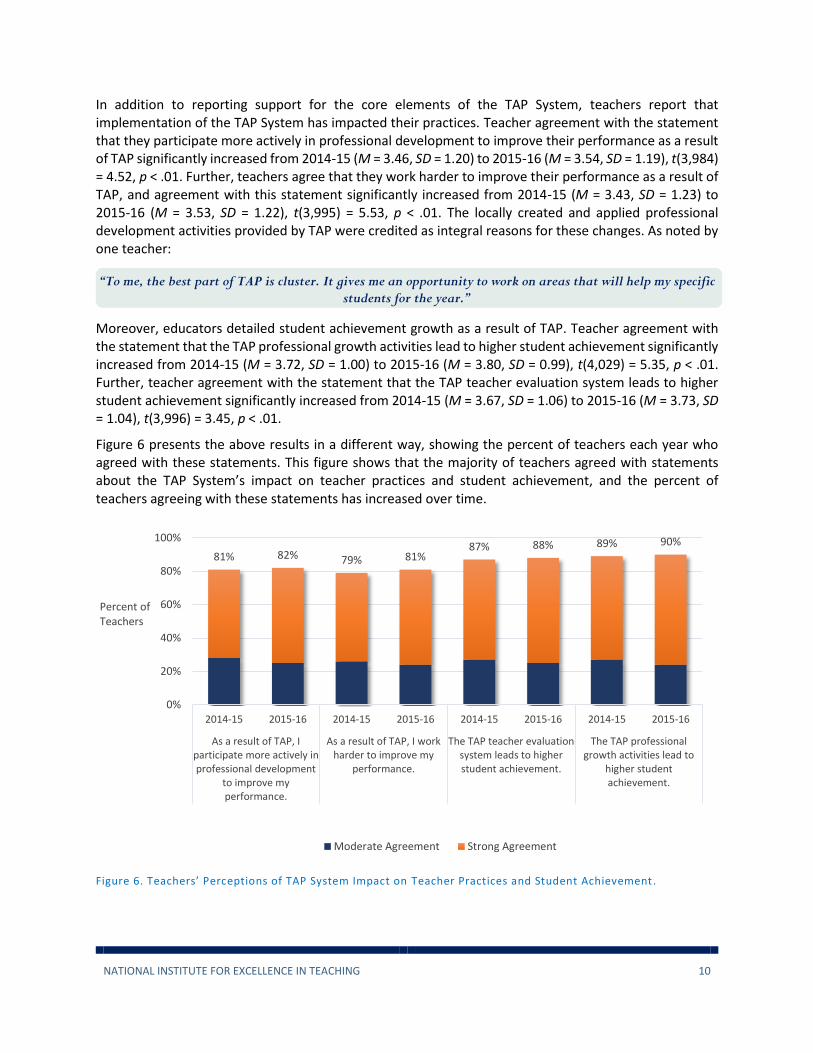
In addition to reporting support for the core elements of the TAP System, teachers report that implementation of the TAP System has impacted their practices. Teacher agreement with the statement that they participate more actively in professional development to improve their performance as a result of TAP significantly increased from 2014-15 (M = 3.46, SD = 1.20) to 2015-16 (M = 3.54, SD = 1.19), t(3,984)= 4.52, p < .01. Further, teachers agree that they work harder to improve their performance as a result ofTAP, and agreement with this statement significantly increased from 2014-15 (M = 3.43, SD = 1.23) to2015-16 (M = 3.53, SD = 1.22), t(3,995) = 5.53, p < .01. The locally created and applied professionaldevelopment activities provided by TAP were credited as integral reasons for these changes. As noted by one teacher:
“To me, the best part of TAP is cluster. It gives me an opportunity to work on areas that will help my specific students for the year.”
Moreover, educators detailed student achievement growth as a result of TAP. Teacher agreement with the statement that the TAP professional growth activities lead to higher student achievement significantly increased from 2014-15 (M = 3.72, SD = 1.00) to 2015-16 (M = 3.80, SD = 0.99), t(4,029) = 5.35, p < .01.Further, teacher agreement with the statement that the TAP teacher evaluation system leads to higher student achievement significantly increased from 2014-15 (M = 3.67, SD = 1.06) to 2015-16 (M = 3.73, SD = 1.04), t(3,996) = 3.45, p < .01.
Figure 6 presents the above results in a different way, showing the percent of teachers each year who agreed with these statements. This figure shows that the majority of teachers agreed with statements about the TAP System’s impact on teacher practices and student achievement, and the percent of teachers agreeing with these statements has increased over time.
Figure 6. Teachers’ Perceptions of TAP System Impact on Teacher Practices and Student Achievement.
81% 82% 79% 81%87% 88% 89% 90%
0%
20%
40%
60%
80%
100%
2014-15 2015-16 2014-15 2015-16 2014-15 2015-16 2014-15 2015-16
As a result of TAP, Iparticipate more actively inprofessional development
to improve myperformance.
As a result of TAP, I workharder to improve my
performance.
The TAP teacher evaluationsystem leads to higherstudent achievement.
The TAP professionalgrowth activities lead to
higher studentachievement.
Percent ofTeachers
Moderate Agreement Strong Agreement

NATIONAL INSTITUTE FOR EXCELLENCE IN TEACHING 11
Impact of the TAP System on Student Achievement in Louisiana
Building on the 2014 study conducted by Barnett, Wills, and Kirby (Barnett, Wills, & Kirby, 2014), the current study examined the impact of the TAP System in 49 K-8 schools in Louisiana. These schools began implementing the TAP System between the 2010-11 and 2012-13 school years, with average free/reduced price lunch eligibility of 87.6% at the start of TAP implementation. Thirty-nine (80%) of these schools implemented TAP with the support of a Teacher Incentive Fund (TIF-3) grant, while the remaining of the schools received funding from other sources to implement the TAP System.
The goal of this study was to examine the academic performance of students in Louisiana TAP schools with strong implementation fidelity of the TAP System, relative to students in matched comparison schools. School performance data was drawn from the Louisiana Department of Education website. School academic performance was measured using the K-8 Assessment Index (AI) score for the 2009-10 to 2015-16 school years. In 2012-13, the maximum score for the K-8 AI score changed from 200 to 150; therefore, we transformed the K-8 AI scores into standardized scores in order to make comparisons across different school years. The quality of implementation in each TAP school was measured by school review scores.
Propensity score matching was used to select matched comparison schools. First, a propensity score for each school was computed, which involved estimating the conditional probability of a school to receive TAP given its base year student achievement and the percent of students qualified for free or reduced-price lunch (FRL). Then, a one-to-one, nearest-neighbor matching method without replacement wasemployed to choose one non-TAP with the closest propensity score to that of the TAP school and with an exact match on school type (e.g., elementary/middle school, combination school, high school).
As shown in Figure 7, the 49 Louisiana TAP schools significantly outperformed their matched comparison schools in student performance growth (t(48) = 2.11, p = 0.04) from base year to 2015-16. While, onaverage, Louisiana TAP schools improved by 0.21 SD in student performance from one year prior to TAP System implementation to 2015-16, student performance in matched schools declined 0.03 over this time.
Figure 7. Student Performance Growth in Louisiana TAP and Matched Comparison Schools.
0.21
-0.03-0.05
0.00
0.05
0.10
0.15
0.20
0.25
TAP Schools Matched Schools
K-8 AI Standardized Score

NATIONAL INSTITUTE FOR EXCELLENCE IN TEACHING 12
Impact of the TAP System on Student Achievement in Slaton ISD In 2014, Slaton Independent School District (ISD) began implementing the TAP System districtwide with the support of a U.S. Department of Education Supporting Effective Educator Development (SEED-1) grant, in partnership with Texas Tech University (TTU) and NIET. In addition to the implementation of the TAP System, the three-way partnership among NIET, TTU and Slaton ISD included providing all teachers at Slaton Junior High with coursework in STEM, Literacy, and Leadership delivered by TTU faculty. Coursework in these areas was designed to closely align with the expectations within the TAP System.
To examine the impact of the TAP System implementation and the advanced coursework offered in Slaton Junior High, school performance data from the year prior to TAP System implementation through the 2016-17 school year were tracked. School performance, obtained from the Texas Education Agency website, was assessed based on the percentage of students at “Approaches Grade Level or Above” (previously labeled “Level II Satisfactory Standard or Above”) for all grades in 1) all subjects, 2) reading, and 3) mathematics, as reported in the 2013-14 through the 2016-17 Texas Academic Performance Reports. Findings are shown in Figure 8 and explained in more detail below.
All Subjects. From 2013-14 to 2016-17, the percentage of students at “Approaches Grade Level or Above” in all subjects combined declined by 2% statewide. During this same time, Slaton Junior High experienced increases in the percentage of students at “Approaches Grade Level or Above” in all subjects combined - 10% growth across all students and 9% growth among economically disadvantaged students.
Reading. A decline in the percentage of students at “Approaches Grade Level or Above” in reading occurred statewide from 2013-14 to 2016-17. On the other hand, Slaton Junior High saw increases in the percentage of students at “Approaches Grade Level or Above” in reading for all students and economically disadvantaged students independently.
Mathematics. Texas and Slaton Junior High experienced increases in the percentage of students at “Approaches Grade Level or Above” in math from 2013-14 to 2016-17. However, while the percentage of students at “Approaches Grade Level or Above” in math increased by 1% statewide, it increased by 11% for students overall and by 10% for economically disadvantaged students at Slaton Junior High.
Figure 8. Student Performance Growth Statewide and at Slaton Junior High.
-2%
-4%
1%
10%
5%
11%
9%
3%
10%
-6%
-4%
-2%
0%
2%
4%
6%
8%
10%
12%
All Subjects Reading Mathematics
Growth in the Percentage of Students at Approaches Grade Level or Above, 2013-14 to 2016-17
STAAR
State Slaton Junior High - all students Slaton Junior High - economically disadvantaged students

NATIONAL INSTITUTE FOR EXCELLENCE IN TEACHING 13
Project Spotlight: Impact of the Leadership Instruction for Teachers (LIFT) Program
The quality of teachers and the quality of principals are the top two school variables impacting student achievement (Grissom & Loeb, 2011; Hallinger, 2011; McKibben, 2013; Papa, 2007; Rampey, Dion, & Donahue, 2009). High-poverty, low-achieving school districts, which arguably need the best principals, experience the most difficulty attracting high-quality applicants (Branch, Hanushek, & Rivkin, 2012). New principals working in high-need schools also often lack skills needed to turn around historically low student achievement, including skills for coaching teachers to improve instruction or using data to target areas for improvement.
With support from a Supporting Effective Educator Development (SEED-2) grant, NIET, TTU and nine high-need school districts across Texas and Louisiana address this need through the Leadership Instruction for Teachers (LIFT) program. This three-way partnership aims to improve a principal preparation program through a competency-based fellowship that offers future school leaders hands-on experiences of school leadership in collaboration with highly skilled veteran leaders, and university preparation.
TTU and NIET collaborate with partner district leaders to identify potential candidates from a pool of mentor/master teachers based on a track-record of exemplary achievement. Potential candidates are screened through a rigorous selection process that includes application materials, the Haberman Assessment, and a group interview with representatives from TTU, NIET and partner districts. Those admitted into the program (called Principal Fellows) are placed in a different school within the district they came from to serve as an interim assistant principal during the yearlong, job-embedded clinical experience while also taking courses from TTU. While serving as an interim assistant principal, each Principal Fellow is mentored by a high-quality principal mentor and a TTU coach. TTU coaches provide weekly support to each Principal Fellow and conduct monthly site visits that support both the Principal Fellows and the principal mentors. TTU coaches also help Principal Fellows connect to partner district central office resources and specialists to help the target school achieve its school improvement goals.
1. Recruitment of High-Quality Principal Candidates.Out of 50 applicants for the 2016-17 and the 2017-18 cohorts, 27 (54%) gained admission. As shown inthe figure below, admitted candidates significantly outperformed non-admitted candidates on theiraverage application material score (M = 20.28, SD = 3.09 for admitted candidates, M = 15.84, SD = 3.40for non-admitted candidates; t(48) = 4.84, p < .001) and on their average interview score (M = 8.56, SD =1.66 for admitted candidates, M = 7.02 and SD = 1.80 for non-admitted candidates; t(35) = 2.45, p < .05).Admitted and non-admitted candidates were not significantly different in their Haberman Assessmentscore (t(35) = 1.32, n.s.), but admitted candidates obtained a “High” score on more dimensions than non-admitted candidates (t(35) = 2.25, p < .05).
Figure 9. Application Material and Interview Scores for Candidates in LIFT Program, by Admission Status.
7.02
8.56
0 3 6 9 12
Interview Score
15.84
20.28
0 5 10 15 20 25
Non-admitted
Admitted
Application Material Score
Evaluation of the impact of this partnership has revealed successes in the following five areas:

NATIONAL INSTITUTE FOR EXCELLENCE IN TEACHING 14
2. Growth in Principal Fellows’ Leadership SkillsPrincipal mentors evaluated Principal Fellows’ leadership skills using the Texas Principal Evaluation andSupport System (T-PESS). As shown in Figure 10, on average, Principal Fellows showed improvement ineach T-PESS standard from midyear to end-of-year evaluations. Moreover, changes in three T-PESSstandards were statistically significant: Instructional Leadership (t(10) = 2.78, p < .01), ExecutiveLeadership (t(10) = 2.43, p < .05), and Strategic Operations (t(10) = 2.22, p < .05).
Figure 10. T-PESS Scores among Principal Fellows, 2016-17 Cohort.
3. Improvement in Coaching SkillsTTU faculty and staff assessed Principal Fellows’ coaching skills by evaluating their ability to facilitatediscussions before and after the observations of teachers (i.e., pre- and post-conferences). Figure 11shows that on average, Principal Fellows demonstrated improvement in their coaching skills at pre- andpost-conferences. Moreover, dependent sample t tests suggest that Principal Fellows’ improvement incoaching skills from Cycle 1 to Cycle 4 were statistically significant (t(10) = 4.91, p <. 001 for pre-conferenceand t(10) = 4.66, p < .001 for post-conference).
Figure 11. Principal Fellows’ Coaching Skills, 2016-17 Cohort.
2.59 2.612.75 2.75
2.52
3.002.84
3.183.04
2.86
1.00
2.00
3.00
4.00
5.00
Standard 1 -InstructionalLeadership
Standard 2 -Human Capital
Standard 3 -Executive
Leadership
Standard 4 -School Culture
Standard 5 -Strategic
Operations
Average T-PESSScore
Midyear
End-of-Year
2.26 2.16
2.85 2.98
2.382.55
3.13 3.19
1.00
2.00
3.00
4.00
5.00
Cycle 1 Cycle 2 Cycle 3 Cycle 4 Cycle 1 Cycle 2 Cycle 3 Cycle 4
Pre-conference Post-conference
Average Conference Facilitation Rubric Score

NATIONAL INSTITUTE FOR EXCELLENCE IN TEACHING 15
4. Positive Perceptions of the LIFT ProgramTo gauge Principal Fellows’ perceptions of the LIFT program, an online survey was administered towardthe end of their yearlong experience as an interim assistant principal. As shown in Figure 12, whenasked about their overall LIFT program experience, 92% reported their experience as “Good” or“Excellent.” Similarly, when asked whether they feel “job-ready,” 100% voted “Yes” or “Yes, very much.”
Figure 12. Principal Fellows’ Perception of the LIFT Program, 2016-17 cohort.
5. Placement of Principal Fellows in High-Need Schools upon GraduationThirteen Principal Fellows from the 2016-17 cohort graduated in August 2017 and 12 (92%) are serving inhigh-need schools.
National TAP Attitude Survey – 2017
Teacher Results – 2017 TAP Attitude Survey
In spring 2017, 4,714 teachers (73% response rate) from 160 schools in 9 states completed the TAP Teacher Attitude Survey. Below, we present teacher reported levels of support for the four core elements of the TAP System and collegiality.
Collegiality. Critics of performance measures and incentives for teachers often indicate such policies will result in competitiveness and a loss of collegiality among teachers. Notwithstanding, we find evidence of a high degree of collegiality in TAP schools. In the 2017 TAP national survey of teacher attitudes, 94% of teachers in TAP schools agree with statements reporting a high level of collegiality in their schools, and over 73% report strong agreement. As one teacher shared:
“[TAP] has brought about major changes in the collaboration among teachers. Before TAP, teachers rarely talked to each other about what was going on in their classrooms, but now it happens frequently.”
This evidence for collegiality has been remarkably high over the last decade, as shown in Figure 13, which indicates that TAP System schools consistently have a collaborative and collegial environment.
Figure 13. Level of Reported Support for Collegiality from Teachers Nationwide.
Good
Yes
Excellent
Yes, very much
92%
100%
0% 20% 40% 60% 80% 100%
How was your overall experience as a PrincipalFellow?
Do you feel "job-ready" after completing thePrincipal Fellowship Program?
Percent of Principal Fellows
94%
90%
0% 20% 40% 60% 80% 100%
2017
2005
Percent of Teachers
Collegiality
Moderate Support Strong Support

NATIONAL INSTITUTE FOR EXCELLENCE IN TEACHING 16
Beyond the overall high levels of reported collegiality within TAP schools, the levels of support for the specific elements of TAP including multiple career paths, ongoing professional growth, instructionally focused accountability and performance-based compensation are also high and growing, as shown in Figures 14-17.
Multiple career paths. A growing number of teachers report that the creation of teacher leader roles in their school has a positive impact on student achievement and school goals. Teacher leaders and administrators form a leadership team that articulates school goals and supports all teachers indeveloping and achieving their own instructional goals based on their skills and their students’ needs. Teacher leadership roles also provide a pathway for teachers to make a greater contribution to the instructional excellence of a school without leaving the classroom. As one teacher noted:
“TAP has provided great opportunities to learn from master and mentor teachers who have extensive knowledge.”
Figure 14 showcases the strong levels of support teachers have for the opportunity to take on additional roles and responsibilities provided by the TAP System.
Figure 14. Level of Reported Support for Multiple Career Paths from Teachers Nationwide.
Ongoing applied professional growth. In TAP schools, master and mentor teachers lead weekly cluster group meetings where they examine student data, engage in collaborative planning and discuss instructional strategies that have been field-tested in their own schools. Teachers benefit from access to a national TAP database of instructional strategies and their colleagues' experiences. Professional development continues in the classroom as master teachers model lessons, observe classroom instruction and support teachers’ pedagogical improvement. As one teacher stated:
“TAP has made teachers more effective by creating opportunities to analyze student data and work to drive instruction. A large part of this takes place during clusters, where teachers can collaborate and support each
other more effectively.”
Figure 15. Level of Reported Support for Ongoing Applied Professional Growth from Teachers Nationwide.
82%
72%
0% 20% 40% 60% 80% 100%
2017
2005
Percent of Teachers
Multiple Career Paths
Moderate Support Strong Support
88%
87%
0% 20% 40% 60% 80% 100%
2017
2005
Percent of Teachers
Ongoing Applied Professional Growth
Moderate Support Strong Support

NATIONAL INSTITUTE FOR EXCELLENCE IN TEACHING 17
Instructionally focused accountability. TAP teachers are observed in classroom instruction multiple times a year by multiple trained observers, including principals and master and mentor teachers, using rubrics measuring indicators of instructional effectiveness. Evaluators are trained and certified, and leadership teams monitor the reliability and consistency of evaluations in their schools. These classroom evaluations are complemented by analyzing student achievement growth, rounding out a multi-measure system of teacher evaluation. Evaluation results are used as formative feedback in one-on-one mentoring sessions, and guide planning for cluster group meetings. As one teacher wrote:
“TAP has created stronger instruction among our staff. Using the TAP rubric has helped us better understand effective instructional practices and has given teachers a common language to communicate
expectations and to improve.”
Figure 16 illustrates the strong level of support reported by TAP teachers across the nation.
Figure 16. Level of Reported Support for Instructionally Focused Accountability from Teachers Nationwide.
Performance-based compensation. TAP teachers have the opportunity to earn annual bonuses based on their observed skills, knowledge and responsibilities, their students’ average achievement growth, and schoolwide achievement growth. Master and mentor teachers receive additional compensation based on their added roles and responsibilities, and principals can earn additional compensation based on schoolwide achievement growth and other measures of effectiveness. As one teacher reported:
“Our teachers do enjoy and look forward to the compensation aspect of TAP. It is nice to receive an extra reward for our teaching efforts.”
Figure 17 demonstrates the level of support for the performance-based compensation system from TAP teachers. Levels of support for performance-based compensation in TAP schools have increasedsignificantly over time, from 49% in 2005 to 75% in 2017.
Figure 17. Level of Reported Support for Performance-Based Compensation from Teachers Nationwide.
92%
78%
0% 20% 40% 60% 80% 100%
2017
2005
Percent of Teachers
Instructionally Focused Accountability
Moderate Support Strong Support
75%
49%
0% 20% 40% 60% 80% 100%
2017
2005
Percent of Teachers
Performance-Based Compensation
Moderate Support Strong Support

NATIONAL INSTITUTE FOR EXCELLENCE IN TEACHING 18
Administrator Results – 2017 TAP Attitude Survey
The above substantially positive results from the TAP Teacher Attitudes Survey are echoed by the 2017 TAP Administrator Attitudes Survey (n = 219 administrators). When asked about the impact TAP has had on their school, one principal wrote:
“In seven years, our school has moved from being a ‘D’ school to being on the verge of an ‘A’ school. Performance on standardized tests including the ACT and End-of-Course tests has increased dramatically.
The graduation rate has increased from 66% to 96%. TAP is the foundation of our instructional program and has been a key factor in our success.”
As shown in Figure 18, principals overwhelmingly report that TAP has a positive effect on instructional practices, collegiality, student achievement, and teacher effectiveness.
Figure 18. Administrator Survey Results on TAP Outcomes in their Schools .
Further, as noted in Figure 19, a significant majority of principals (90%) agree that TAP helps retain effective teachers.
Figure 19. “The implementation of TAP has helped retain effective teachers at my school .”
94%
96%
98%
100%
0% 20% 40% 60% 80% 100%
TAP has made my teachers more effective.
The TAP teacher evaluation system leads tohigher student achievement.
The TAP professional growth activities lead tocollegiality among my school's teachers.
The TAP professional growth activities improvemy school's teachers' instructional practice.
Percent of Administrators
Moderate Support Strong Support
No, 2%Somewhat, 8%
Yes, 90%

NATIONAL INSTITUTE FOR EXCELLENCE IN TEACHING 19
Upcoming Projects
Voices in the Field: National Study of Educator Views of Teacher Leadership
Throughout the years of implementing the TAP System across multiple states in hundreds of schools, NIET has learned a tremendous amount about the use of teacher leaders in schools. To add to this knowledge, NIET has conducted a series of interviews and focus groups with educators across several states nationwide to explore views of teacher leadership. This report will inform conversations about defining teacher leadership roles, the preparation of and support for teacher leaders in schools, as well as successes and challenges to using teacher leaders as a strategy to improve teaching and learning.
Impact of an Educator Effectiveness System on Retaining Administrators Nationwide
In 2014, Barnett and Hudgens released a report examining teacher retention rates in schools that implemented the TAP System. Recognizing the role administrators play in the successful implementation of any reform effort, in a follow-up piece, the authors use school rosters, administrator effectiveness data, and school data to investigate the retention and impact of administrators who work in TAP System schools. Specifically, the authors examine retention rates for multiple school years across three types of administrator groups, those who: 1) worked continuously at the same TAP school (“TAP school stayers”); 2) transferred from one TAP school to another TAP school (“TAP school movers”); and 3) left TAP schoolsaltogether (“TAP school leavers”). Additionally, the authors analyze characteristics of these three categories of administrators.
Conclusion The TAP System stands out because of its track record spanning two decades of growth and success inraising student achievement in high-need schools. The research evidence also reveals several key reasons for TAP’s positive impact: an evaluation system capable of differentiating teacher performance levels and providing detailed feedback for improvement, ongoing professional growth in classroom practice using student and teacher data to guide improvement, recruitment and retention of effective teachers, and the creation of a challenging, rewarding and collegial environment focused on high-quality instruction and student learning.

NATIONAL INSTITUTE FOR EXCELLENCE IN TEACHING 20
Acknowledgements The authors gratefully acknowledge the input and information provided by TAP System partner schools, including the willingness of administrators and teachers to respond to NIET’s surveys and participate in focus group meetings. We are also indebted to the work of all of the NIET members who work with partnering schools each day.
Suggested citation:
Barnett, J. H., Hudgens, T. M., & Logis, H. A. (2017). TAP research summary fall 2017: Examining the evidence and impact of TAP: The system for teacher and student advancement. Santa Monica, CA:National Institute for Excellence in Teaching.
About the Authors Joshua H. Barnett, Ph.D., serves as chief learning officer at the National Institute for Excellence inTeaching. He leads the implementation, management and oversight of NIET trainings, support, materials, resources, and web-based technologies. Barnett also serves as the principal investigator for NIET's federal projects. Prior to joining NIET, he worked at multiple universities as a researcher and professor teaching courses in research methods, statistics, and education program evaluation. Barnett earned his Ph.D. in education evaluation and policy from the University of Arkansas.
Tanée M. Hudgens, Ph.D., serves as a director of research at the National Institute for Excellence inTeaching. She earned her Ph.D. in developmental psychology with a concentration in quantitative psychology from the University of North Carolina at Chapel Hill. Prior to joining NIET, she evaluated the quality of instruction and care provided to preschoolers, as well as the recruitment, retention, and development of the early childhood care and education workforce across Los Angeles.
Handrea A. Logis, Ph.D., serves as a senior research associate at the National Institute for Excellence inTeaching. Prior to joining NIET, she conducted research on children’s peer networks, bullying, and teaching practices for the Classroom Peer Ecologies Project funded by the Institute of EducationSciences. She earned her Ph.D. in educational psychology with specialization in child development and quantitative methods from the University of Illinois at Urbana-Champaign.

NATIONAL INSTITUTE FOR EXCELLENCE IN TEACHING 21
References Algiers Charter School Association. (2011). Annual report 2011. New Orleans, LA: Author. Retrieved from
http://tapsystem.niet.org/publications/algiers_charter_schools_association_annual_report_2011.pdf
Archer, J., Kerr, K. A., & Pianta, R. C. (2014). Why measure effective teaching. In T. J. Kane, K. A., Kerr, & R. C. Pianta (Eds.), Designing teacher evaluation systems: New guidance from the Measures of Effective Teaching project (pp. 1-5). San Francisco, CA: Jossey-Bass.
Barnett, J. H., & Hudgens, T. M. (2014). Staying power: The impact of the TAP System on retaining teachers nationwide. Santa Monica, CA: National Institute for Excellence in Teaching. Retrievedfrom http://www.niet.org/assets/Publications/staying-power-tap-system-teacher- retention.pdf
Barnett, J. H., Hudgens, T. M., & Logis, H. A. (2017). TAP research summary spring 2017: Examining the evidence and impact of TAP: The system for teacher and student advancement. Santa Monica,CA: National Institute for Excellence in Teaching.
Barnett, J. H., Hudgens, T. M., Logis, H. A. & Alexander, J. L. (2016). TAP research summary fall 2016: Examining the evidence and impact of TAP: The system for teacher and student advancement. Santa Monica, CA: National Institute for Excellence in Teaching.
Barnett, J. H., Hudgens, T. M., & Alexander, J. L. (2016). TAP research summary spring 2016: Examining the evidence and impact of TAP: The system for teacher and student advancement. SantaMonica, CA: National Institute for Excellence in Teaching. Retrieved from http://www.niet.org/assets/Publications/032016-TAP-Research-Summary-Spring-2016.pdf
Barnett, J. H., Rinthapol, N., & Alexander, J. (2015). Real perspectives on tough issues: Teacher attitudes about teaching. Paper presented at the annual meeting of the American Educational Research Association. Chicago, IL.
Barnett, J. H., Rinthapol, N., & Hudgens, T. (2014). TAP research summary spring 2014: Examining the evidence and impact of TAP: The system for teacher and student achievement. Santa Monica, CA:National Institute for Excellence in Teaching. Retrieved from http://www.niet.org/assets/Publications/tap-research-summary-0314.pdf
Barnett, J. H. & Wills, K. C. (2016a). Narrowing the gap: Achievement gaps in Indiana TAP schools. Paper presented at the annual meeting of the American Educational Research Association. Washington, D.C.
Barnett, J. H. & Wills, K. C. (2016b). Measuring and assessing classroom instruction: Properties of TAP observational rubric scores. Paper presented at the annual meeting of the American Educational Research Association. Washington, D.C.
Barnett, J. H., Wills, K. C., Hudgens, T. M., & Alexander, J. L. (2015). TAP research summary spring 2015: Examining the evidence and impact of TAP: The system for teacher and student achievement. Santa Monica, CA: National Institute for Excellence in Teaching. Retrieved from http://www.niet.org/assets/Publications/tap-research-summary-0615.pdf
Barnett, J. H., Wills, K. C., & Kirby, P. C. (2014). Comprehensive educator effectiveness models that work: Impact of the TAP system on student achievement in Louisiana. Santa Monica, CA: NationalInstitute for Excellence in Teaching. Retrieved from http://www.niet.org/assets/Publications/louisiana-tap-student-achievement.pdf

NATIONAL INSTITUTE FOR EXCELLENCE IN TEACHING 22
Branch, G. F., Hanushek, E. A., & Rivkin, S. G. (2012). Estimating the effect of leaders on public sector productivity: The case of school principals (Working Paper No. 17803). Retrieved from http://www.nber.org/papers/w17803.pdf
Buck, B., & Coffelt, C. (2013, August 15). Leadership program good for all teachers: TAP leaders provide support for colleagues, create collaborative team. Des Moines Register. Retrieved fromhttp://www.iowahouserepublicans.com/op-ed-leadership-program-good-for-all-teachers
Center for Research on Education Outcomes (CREDO). (2015). Urban charter school study report on 41 regions. Retrieved fromhttps://urbancharters.stanford.edu/download/Urban%20Charter%20School%20Study%20Report%20on%2041%20Regions.pdf
Chaplin, D., Gill, B., Thompkins, A., & Miller, H. (2014). Professional practice, student surveys, and value added: Multiple measures of teacher effectiveness in the Pittsburgh Public Schools (REL 2014–024). Washington, D.C: U.S. Department of Education, Institute of Education Sciences,National Center for Education Evaluation and Regional Assistance, Regional Educational
Laboratory Mid- Atlantic. Retrieved from http://ies.ed.gov/ncee/edlabs
Daley, G., & Kim, L. (2010). A teacher evaluation system that works (NIET Working Paper). Santa Monica,CA: National Institute for Excellence in Teaching. Retrieved from http://tapsystem.niet.org/publications/wp_eval.pdf
Darling-Hammond, L. (2006). Assessing teacher education: The usefulness of multiple measures for assessing program outcomes. Journal of Teacher Education, 57(2), 120-138.doi:10.1177/0022487105283796
Goldhaber, D. (2002). The mystery of good teaching. Education Next, 1, 50-55. Retrieved fromhttp://educationnext.org/the-mystery-of-good-teaching
Grissom, J. A., & Loeb, S. (2011). Triangulating principal effectiveness: How perspectives of parents, teachers, and assistant principals identify the central importance of managerial skills. American Educational Research Journal, 48(5), 1091–1123. doi: 10.3102/0002831211402663
Grossman, P., Cohen, J., Ronfeldt, M., & Brown, L. (2014). The test matters: The relationship between classroom observation scores and teacher value added on multiple types of assessment. Educational Researcher 43, 293-303. doi: 10.3102/0013189X14544542
Hallinger, P. (2011). Leadership for learning: Lessons from 40 years of empirical research. Journal of Educational Administration, 49(2), 125-142. doi: https://doi.org/10.1108/09578231111116699
Hanushek, E. (2013). Why educators’ wages must be revamped now. Education Week, 32(20), 28-29, 31.Retrieved from http://www.edweek.org/ew/articles/2013/02/06/20hanushek_ep.h32.html
Headden, S. (2014). Beginners in the classroom. What the changing demographics of teaching mean for schools, students, and society. Stanford, CA: Carnegie Foundation for the Advancement ofTeaching.
Hudson, S. (2010). The effects of performance-based teacher pay on student achievement. DiscussionPaper for the Stanford Institute for Economic Policy Research, Stanford University. Retrieved from http://www-siepr.stanford.edu/repec/sip/09-023.pdf
Mann, D., Leutscher, T., & Reardon, R. M. (2013). The system for teacher and student advancement: An evaluation of achievement and engagement in Louisiana. Santa Monica, CA: National Institute

NATIONAL INSTITUTE FOR EXCELLENCE IN TEACHING 23
for Excellence in Teaching. Retrieved from http://tapsystem.niet.org/publications/interactive- louisiana-student-achievement.pdf
National Council on Teacher Quality (NCTQ). (2014). 2013 State teacher policy yearbook: National summary. Washington, DC: Author. Retrieved fromhttps://www.nctq.org/dmsView/2013_State_Teacher_Policy_Yearbook_National_Summary_NCTQ_Report
National Institute for Excellence in Teaching. (2015). TAP in focus. Santa Monica, CA: Author. Retrievedfrom http://www.niet.org/assets/Publications/tap-in-focus-2015.pdf
Norris, J., van der Mars, H., Kulinna, P., Kwon, J., & Amrein-Beardsley, A. (In Editing). A document analysis of teacher evaluation systems specific to physical education. The Physical Educator.
Papa, F. (2007). Why do principals change schools? A multivariate analysis of principal retention. Leadership and Policy in Schools, 6(3), 267-290. doi:http://dx.doi.org/10.1080/15700760701263725
Rampey, B. D., Dion, G. S., & Donahue, P. L. (2009). NAEP 2008 trends in academic progress. Retrievedfrom https://eric.ed.gov/?id=ED505083
Ritter, G. W. & Barnett, J. H. (2016). Learning on the job: Teacher evaluation can foster real growth. Phi Delta Kappan 97(7), 48-52. doi: 10.1177/0031721716641649
Rivkin, S., Hanushek, E. A. & Kain, J. (2005) Teachers, schools, and academic achievement. Econometrica,73(2), 417-458. http://dx.doi.org/10.1111/j.1468-0262.2005.00584.x
Schacter, J., & Thum, Y. M. (2005). TAPping into high quality teachers: Preliminary results from the Teacher Advancement Program comprehensive school reform. School Effectiveness & School Improvement, 16(3), 327–353. doi:10.1080/13803610500146202
Schacter, J., Schiff, T., Thum, Y. M., Fagnano, C., Bendotti, M., Solmon, L., … Milken, L. (2002). The impact of the teacher advancement program on student achievement, teacher attitudes, and job satisfaction. Santa Monica, CA: Milken Family Foundation.
Schacter, J., Thum, Y. M., Reifsneider, D., & Schiff, T. (2004). The teacher advancement program report two: Year three results from Arizona and year one results from South Carolina TAP schools. SantaMonica, CA: Milken Family foundation.
Simon, N. S., & Johnson, S. M. (2013). Teacher turnover in high-poverty schools: What we know and can do. (Working Paper: Project on the Next Generation of Teachers). Cambridge, MA: HarvardGraduate School of Education.
Solmon, L. C., White, J. T., Cohen. D., & Woo, D. (2007). The effectiveness of the teacher advancement program. Santa Monica, CA: National Institute for Excellence in Teaching. Retrieved fromhttp://tapsystem.niet.org/pubs/effective_tap07_full.pdf
The New Teachers Project (TNTP). (2012). The irreplaceables: Understanding the real retention crisis in America’s urban schools. Retrieved fromhttp://tntp.org/assets/documents/TNTP_Irreplaceables_2012.pdf
Weisberg, D., Sexton, S., Mulhern, J., & Keeling, D. (2009). The Widget Effect: Our national failure to acknowledge and act on differences in teacher effectiveness. Brooklyn, NY: The New Teacher Project (TNTP). Retrieved from http://tntp.org/publications/view/evaluation-and- development/the-widget-effect-failure-to-act-on-differences-in-teacher-effectiveness